- 1Escuela de Geología, Universidad Mayor, Santiago, Chile
- 2Institute of Geophysics and Tectonics, School of Earth and Environment, University of Leeds, Leeds, United Kingdom
Diffusion chronometry is a technique gaining interest in the scientific community related to volcanology and petrology; however, modelling can be challenging for non-expert users. Here, we present DiffSim, a user-friendly standalone freeware that allows users to calculate magmatic timescales simulating 1D diffusion of major elements in olivine, orthopyroxene, titanomagnetite, and melt (inclusions). The freeware works solving the Fick’s second law equation (for both Cartesian and spherical polar coordinates, depending on the phase) using finite differences through the Crank-Nicolson method. Users must specify the initial composition vs. distance profile, the time resolution, and the intensive conditions (such as temperature, pressure, and oxygen fugacity). For orthorhombic phases, such as olivine and orthopyroxene, users must also specify the plunge and the trend of the (001)-axis and the angle traverse of the 2D section being studied. The best-fitting profile, comparing the natural (measured) and the modelled (calculated) profiles, is obtained using the least-squares fitting method in accordance with the total time specified by the user for performing the diffusion modelling. To determine the uncertainties of the timescale calculation, DiffSim propagates errors based on the uncertainties associated with each intensive condition and the experimental diffusivity measurements. DiffSim is available as executable freeware, allowing researchers and students to use diffusion chronometry to elucidate information about crustal processes with ease and precision.
Introduction
In recent years, computational geochemistry tools have been garnered interest and use within the scientific community, particularly for addressing petrological and volcanological challenges. These tools find applications in various areas, including thermodynamic modelling (e.g., Gualda et al., 2012; Bohrson et al., 2014; Ghiorso and Gualda, 2015; Ariskin et al., 2018), equilibration of melt inclusions (Danyushevsky and Plechov, 2011; Brahm et al., 2021), thermobarometry (Petrelli et al., 2020), and diffusion chronometry (Girona and Costa, 2013; Wu et al., 2022).
Diffusion chronometry is a technique that has gained increasing interest in igneous petrology (e.g., Costa et al., 2020; Chakraborty and Dohmen, 2022). It serves as a powerful tool for determining timescales of geological processes, especially in the field of volcanology. This encompasses phenomena such as eruptive triggering (Coombs et al., 2000; Morgado et al., 2019), magma mobilisation (Caracciolo et al., 2021; Kahl et al., 2023), magmatic residence times in the crust (Kahl et al., 2011; Chamberlain et al., 2014; Morgado et al., 2017; Petrone et al., 2018), magma assimilation (Costa and Dungan, 2005), magma ascent (Ma et al., 2024) and syn-eruptive processes (Morgado et al., 2022).
However, the calculations related to diffusion processes can be a challenging task, especially for non-expert users. Therefore, to overcome this limitation, we developed DiffSim, a user-friendly interface freeware designed to solve Fick’s second law equation. DiffSim offers a range of intuitive features that guide users through the process, providing accurate diffusivity values and magmatic timescales for major elements in olivine, orthopyroxene, titanomagnetite and melt. Additionally, DiffSim is available as executable freeware, enabling researchers and students to perform diffusion chronometry-related calculations and uncertainties with ease and accuracy.
Diffusion modelling in magmatic phases
Diffusion processes can be modelled in mineral phases according to the Fick’s second law (Fick, 1855), which is defined for Cartesian coordinates (Eq. 1) as:
Where C is concentration, t is time (in s), and D is diffusivity (m2/s) considered as a constant value depending on the magmatic phase and the magmatic intensive conditions.
Also, diffusion processes could be modelled in melt inclusions according to the Fick’s second law, defined for spherical coordinates (Eq. 2) as:
To approximate a solution for these Fick’s law equations, for Cartesian and spherical coordinates (Crank, 1975), DiffSim employs numerical solutions, which become more accurate the better the resolution of the created profiles. The created profiles will have better resolution depending on the number of nodes declared by the user in the DiffSim interface. A higher number of nodes (points) leads to an enhanced profile resolution and higher accuracy (Figure 1), but also results in a larger number of calculations and, in consequence, slower computational solving times (Costa et al., 2008).
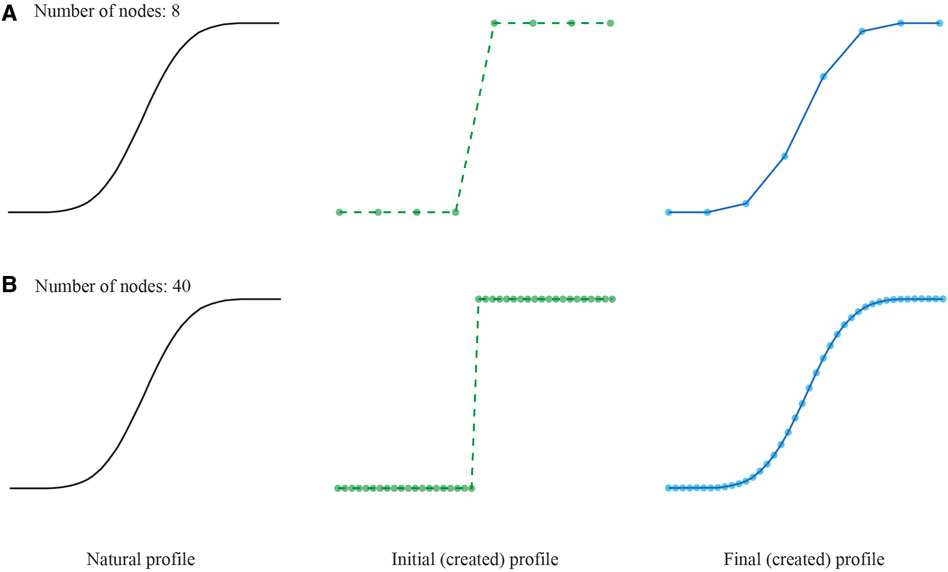
Figure 1. Natural, initial (created), and final (created) profiles were represented as 8 (A) and 40 (B) nodes for all the calculations. The final profile becomes more similar to the natural profile as the number of nodes increases.
Generation of finite differences
The user input field “number of points” corresponds to the number of nodes representing the initial composition profile, all the calculated composition profiles (including the final one), and the natural composition profile representation. Thus, the total spatial elements represented are “number of points - 2”. If the user declares a “number of points” value lower than the measured points, then DiffSim enforces the calculation with a “number of points” equivalent to the points measured. As a result, the modelling does not have a resolution coarser than the data, even though sometimes that level of resolution could be adequate, especially when the natural data are noisy.
The increase in the number of nodes used to represent the final profile (an approximation of the final profile) is calculated by considering the profile given by the user as the initial set of nodes. If we consider both the position and concentration of two contiguous nodes, those points define a single linear equation. The new nodes interpolated between the initial nodes are (position, concentration) plotted pairs, which must satisfy the same linear equation. This procedure is repeated for all contiguous pairs of nodes (Figure 2). If the number of nodes of the natural profile are “n”, then to represent the profile as nodes, the number of nodes “N” must satisfy the following equation (for a value of k = {0, 1, 2, 3 …}):
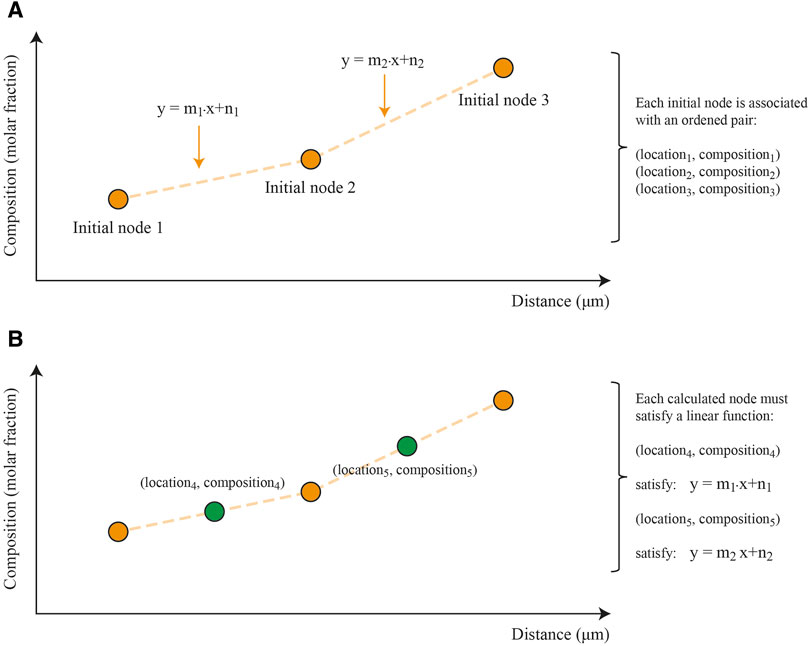
Figure 2. (A) shows an example of how the natural compositional profile, of “n” nodes given by the user, determine “n-1” linear equations between two contiguous nodes. (B) shows how additional nodes are included between the initial nodes.
Then, the “number of nodes” specified by the user is designated as “N”, and DiffSim will consider it as an appropriate value for processing only if it satisfies Eq. 3. If “N” fails to meet the criteria of Eq. 3, then DiffSim will sequentially attempt values N-1, N-2, N-3, and so forth, decrementing by one with each failure, until it identifies the maximum value that fulfils Eq. 3. This value will then be adopted as the number of nodes for all subsequent calculations.
Initial boundary conditions
The natural compositional profile determines the maximum length of both the calculated profiles and the initial nodes. In the DiffSim interface, the “break distance” specified by the user determines location of the boundary between two plateau compositions (“Cmin” and “Cmax”), resulting in highly defined initial profiles with sharp transitions (dependent on the resolution), which yield maximum timescales (Costa and Morgan, 2010). Considering the “break distance” given by the user (in µm), DiffSim finds the closest node to that value and considers it as the last node with initial composition. Then, the higher the number of nodes (or points) specified by the user, the more closely the “break distance” given by the user will match the “break distance” considered by DiffSim. Therefore, for the total “n” nodes, if the break distance considers “c” nodes, the initial compositional profile is built as follows:
For the nodes numbered from 1 to “c”, we have Eq. 4:
For the nodes numbered from “c+1” to “n”, we have Eq. 5:
where Ci,1 is the node number “i” for the initial profile (iteration = 1), equivalent to the boundary condition before the iterations (iteration >1). DiffSim calculates both initial profile and an approximation of the final profile, which have the number of nodes given by the user (Figure 3).
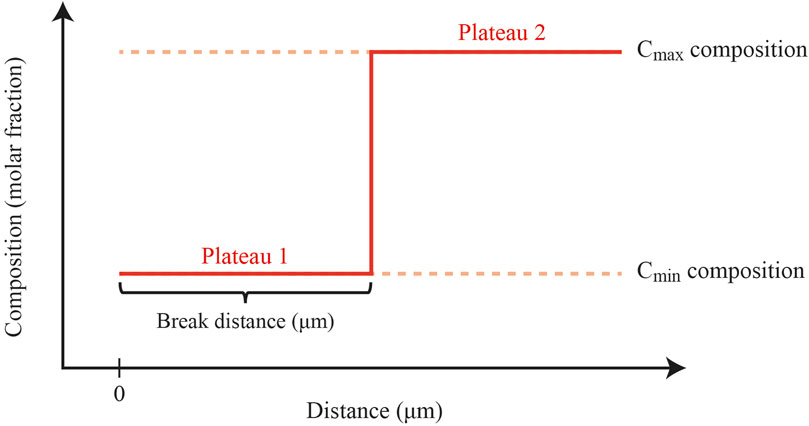
Figure 3. Scheme showing how DiffSim creates initial profiles considering the natural profile, break distance (in µm), Cmin, and Cmax compositions.
Effect of crystallographic orientation
Diffusivity calculation
For DiffSim diffusivity calculations, both melt and titanomagnetite are considered as isotropic, meaning that their diffusivity values remain independent of the crystallographic orientation of the crystal (or solid). Conversely, olivine and orthopyroxene are orthorhombic minerals, exhibiting anisotropic diffusivity characteristics that can affect the ionic diffusivity. For Fe-Mg diffusion, the diffusivity along the (001)-axis is six times greater for olivine (Dohmen and Chakraborty, 2007; Dohmen et al., 2007) and 3.5 times greater for orthopyroxene (Dohmen et al., 2016) compared to the (100)- and the (010)-axes. To determine the influence of the anisotropy in the diffusivity of a particular traverse, DiffSim utilises the Philibert (1991) equation for any crystallographic orientation:
where α, β, and γ correspond to the angles between the traverse and the axes (100), (010), and (001), respectively (details of calculations in Supplementary Material S1). The Eq. 6 works better if the diffusion traverse is measured perpendicular to the external face of the studied crystal (Couperthwaite et al., 2021). Then, we recommend considering external faces normal to the sectioning plane to hold the Eq. 6.
If the user knows crystallographic orientation values represented as Euler angles typically obtained through techniques such as electron backscatter diffraction, as demonstrated by (Prior et al., 1999, 2009), these angles can be subsequently converted into the trend and plunge of Miller indices. This transformation can be accomplished using the spreadsheet provided in Supplementary Material S2 (euler_proc_CORRECT.xls for orthorhombic phases). For diffusivity calculations, EBSD analyses are only required if the user work non cubic phases, and currently, DiffSim is restricted to isotropic (titanomagnetite and melt) and orthorhombic (olivine and orthopyroxene) phases.
Implementation of EBSD data
The EBSD technique works on a 2D section of a mineral phase and prior to its use, a reference axis must be defined (hereafter referred to as “North”, Figure 4). This reference axis lies within the plane of the studied section and will be a benchmark to compare the trends of the (100), (010), and (001) axes of the orthorhombic phases. Subsequently, the plunges of each axis [(100), (010), and (001)] are calculated using the studied section as reference (Figure 4). Finally, since the (100) and (010) axes are perpendicular with respect to the (001)-axis, then only the trend and plunge of the (001)-axis are needed to determine the diffusivity correction due to crystallographic orientation. To facilitate this, DiffSim interface prompts the user for “(001) trend” and “(001) plunge” values (which can be computed from Euler angles, using the spreadsheet provided in Supplementary Material S1).
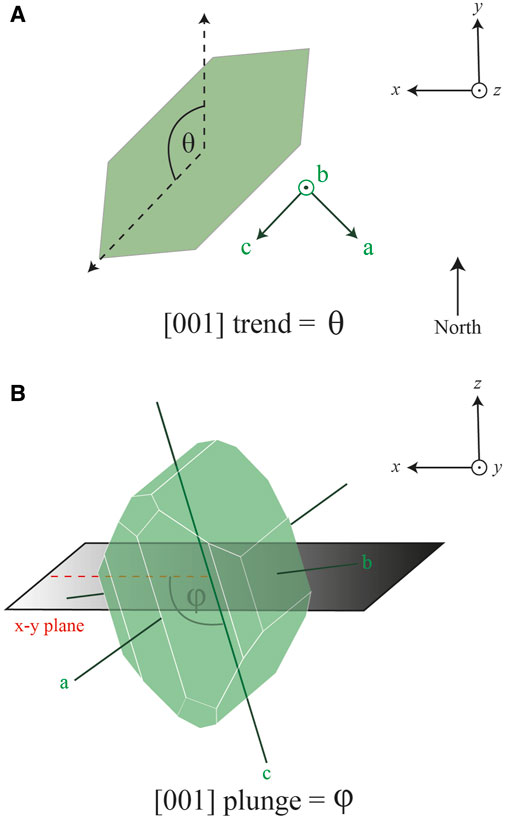
Figure 4. (A) Shows a view from above of the studied section, where the “north” direction is indicated based on the observed plane. The trends of the axes are calculated using “north” as a reference. (B) Shows an olivine phenocryst intersected by a random section (x-y plane) and provides an example of how the plunge is calculated for the (001)-axis (equivalent to the “c” axis) in the olivine phenocryst crossed by the random section.
Best fitting iteration
For iterations beyond the first one (equivalent to the initial profile), the compositional profile is calculated using the Crank-Nicolson method (Crank and Nicolson, 1947), considering points (nodes) on lines according to the Eq. 7:
Where Ci,j is the concentration of the element of interest in the node i in the iteration (representing time) j, D is diffusivity (in m2/s), t is the time resolution (in s), and x is space (in m). As Girona and Costa (2013) established for their software DIPRA, the numerical solution of the Fick’s second law equation is stable only if the time resolution, node spacing, and phase diffusivity accomplish the condition of Eq. 8. To accomplish this condition, users are advised to either increase the time resolution or decrease the spatial resolution. Increasing the time resolution will result in longer computation times, while decreasing the spatial resolution will shorten the computation times.
The time resolution is given directly by the user, the space of each finite element is determined by dividing the maximum length of the provided profile by the number of “nodes – 2”. Also, DiffSim calculates the diffusivity of the major elements according to the physical intensive conditions specified by the user in the interface. All calculated profiles, including the final one, have the same number of nodes. Therefore, DiffSim is able to determine the least squares value for each iteration, and the iteration with the minimum value is selected as the final solution. Throughout these iterations, the best-fitting profile is calculated using the least-squares fitting method (Eq. 9) to minimise the error.
where yi is the composition of the node “i” for the final (created) profile, and
Uncertainties
Recent studies have presented calculations of uncertainties (error propagation) in the diffusivities for Fe-Mg interdiffusion models in olivine (Kahl et al., 2015) and titanomagnetite (Aragon et al., 1984; Morgado et al., 2019). The uncertainties in diffusivities are related to those in the calculated magmatic timescales. Then, to determine the standard error propagation (e.g., Barlow, 1989) for orthopyroxene diffusivity, and subsequently the uncertainty of the timescales, we use a similar approach as that used by Barlow (1989) for any functions employed. This involves the Eq. 10:
DiffSim provides the opportunity to calculate magmatic timescales with a specific diffusivity of the system, considering error propagations to determine maximum and minimum diffusivity values. Details of the error propagations are available on Supplementary Material S4. This is achieved by choosing the “Minimum time” and “Maximum time” options, respectively, in the interface.
Practical implementations of DiffSim
First, the user must specify the key parameters for the modelling: number of nodes (larger number provides better resolution), time resolution (determining the units in the model), iterations (number of modeling steps), and the magmatic intensive conditions. These conditions include temperature (for olivine, titanomagnetite, orthopyroxene, and melt diffusion modelling), pressure (for olivine diffusion modelling), and oxygen fugacity buffer (applicable to olivine, titanomagnetite, and orthopyroxene modelling). Simultaneously, the user is required to provide variations of compositions (in molar fraction of major elements) along with corresponding distances (in µm) as a profile in the designated spreadsheet (Supplementary Material S3). Based on the length and composition of the compositional profile, the user must specify the minimum and maximum values of the x-axis and y-axis to display the solutions (lengths of the plot box).
Olivine and orthopyroxene phenocrysts are orthorhombic (anisotropic); therefore, EBSD will yield the crystallographic orientation in Euler angles. These Euler angles can be transformed to Miller indices using the spreadsheet provided in Supplementary Material S1: (001) trend, (001) plunge. Finally, the user must specify the angle between the “North” and the traverse (compositional profile), referred to as the “traverse angle” in the DiffSim interface.
The “total time” DiffSim simulates diffusion corresponds to the multiplication of two key parameters given by the user: “time resolution” times “iterations”. The answer provided by DiffSim corresponds to the “total time” related to the best-fitting iteration (according to the least-squares fitting method), expressed in different scales (seconds, minutes, hours, days, weeks, months, years, and millennia), according to the time resolution specified by the user. If the “total time” of the best-fitting calculated profile is equivalent to the time specified by the user for modelling, then we suggest that this could be due to an insufficient number of iterations (Figure 5) and it allows to follow the evolution of the profile in time. If the “total time” of the best-fitting calculated profile is equal or shorter than the “total time” specified by the user (through the given “time resolution” and “iterations”) for modelling, then that is the answer provided by DiffSim (Figure 6).

Figure 5. The user-friendly DiffSim interface displays the best fitting profile for the specified “total time”, “time resolution”, and “number of iterations”. The software also shows initial, measured, and calculated profiles to illustrate of the temporal evolution of the system. Results in yellow boxes highlight the “least-square best fitting” outcome and the corresponding time required to achieve the best-fitting profile (equivalent to the best “total time” model, which corresponds to the minimum SSD value). In this scenario (case 1), DiffSim requires more “total time” than the specified by the user (as “time resolution” multiplied by “number of iterations”) to produce a calculated profile that closely matches the natural (measured) one.
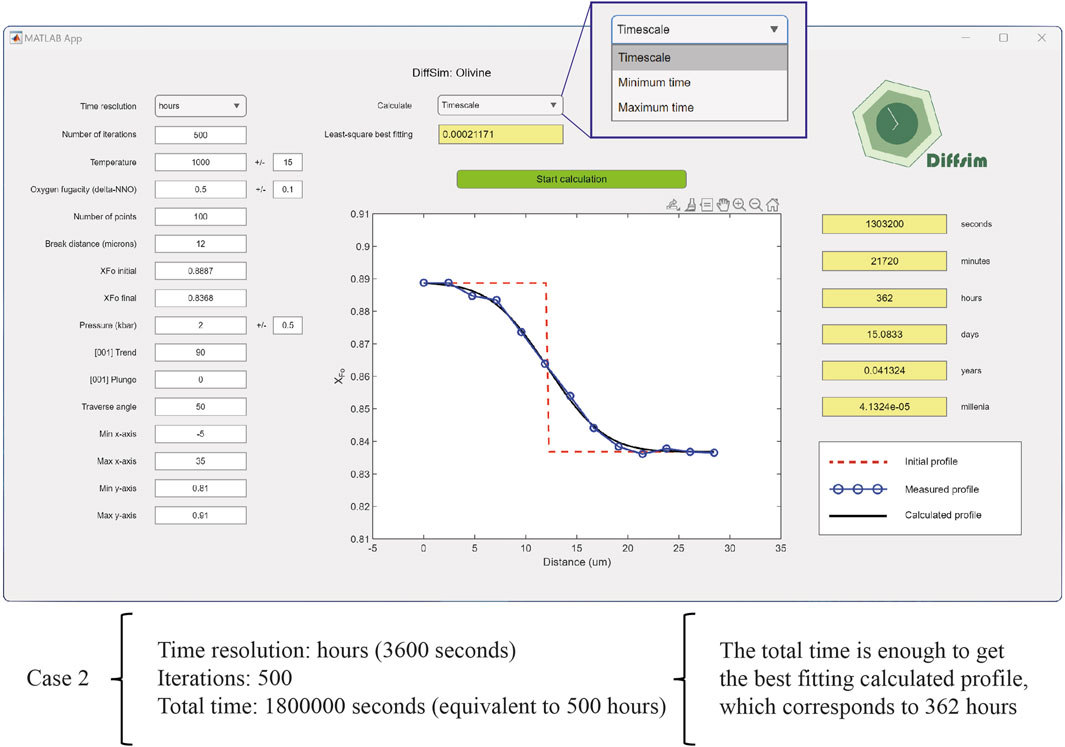
Figure 6. Similar to Figure 5, this displays the best fitting profile for the “total time”, based on the “time resolution” and “number of iterations” specified by the user. It contrasts Figure 5 by showing a scenario where the DiffSim model requires less time (362 h) to match the measured profile compared to the “total time” specified by the user (as “time resolution” multiplied by “number of iterations” = 500 h). In this scenario (case 2), the specified “total time” was sufficient to achieve the best-fitting profile to the natural (measured) one.
The DiffSim installer is in an external website (https://eduardomorgado.com/index.php/diffsim_en/), while the executable files can be found in Supplementary Material S3, offering users the opportunity to modify features to their specific needs and preferences, allowing customisation and flexibility. This software serves also as a resource for learning and education, providing tools for exploration and fostering a collaborative environment.
Example: masuring the timescale of an olivine crystal
As an example, we will present the timescale calculation for an olivine crystal from one of the Caburgua cones (Southern Volcanic Zone of the Andes, Chile) at a temperature of 1,150°C ± 20°C, a pressure of 1.2 kbar ±1.2 kbar, and an oxygen fugacity buffer of NNO ± 0.2 (Morgado et al., 2017). We obtained the major elements by measuring a traverse via Electron Probe MicroAnalysis (EPMA) and calculated XFo as Mg/(Mg+Fe2+) in mols. The traverse defines a distance (μm) vs. XFo arrangement, which the user provides in the “Olivine_distance_composition.xls” spreadsheet. Additionally, we obtained the crystal orientation as Euler angles via Electron BackScatter Diffraction (EBSD). Then, we convert the Euler angles to (001) plunge and (001) trend using the “euler_proc_CORRECT_2.xls” spreadsheet (Figure 7A). To determine the traverse angle, we measure the angle between the north and the traverse in an anti-clockwise direction (Figure 7B). Finally, all the information (pre-eruptive conditions, compositional profile, and angles) is given by the user as input into the DiffSim interface. DiffSim then calculates “Timescale” (diffusivity with no uncertainty), “Minimum time” (maximum diffusivity considering uncertainties), and “Maximum time” (minimum diffusivity considering uncertainties) according to the user’s needs (Figure 7C).
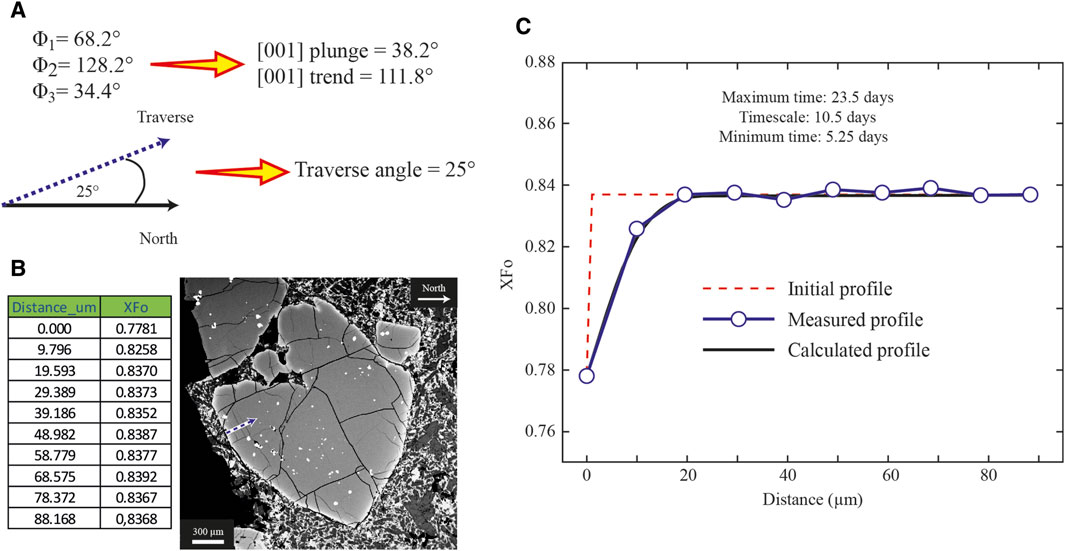
Figure 7. Example of how to determine timescales using DiffSim: (A) (001) plunge, (001) trend, and traverse angle calculations; (B) how to add data in the “Olivine_distance_composition.xls” spreadsheet representing a compositional profile (indicated by the dashed arrow); (C) magmatic timescales obtained as “Maximum time”, “Timescale”, and “Minimum time” considering the uncertainties in diffusivity.
Code availability section
Contact: ZWR1YXJkby5tb3JnYWRvQHVtYXlvci5jbA==
Hardware requirements: Minimum of 2 GB disk capacity, Minimum of 1 GB RAM, dual processor cores.
Program language: MATLAB.
Software required: DiffSim Installer (∼ 1GB).
Program size: ∼5 MB (executable files).
Source codes available at: https://github.com/eduardomorgado1988/DiffSim
Installation package available at: https://eduardomorgado.com/index.php/diffsim_en/
Data availability statement
The datasets presented in this study can be found in online repositories. The names of the repository/repositories and accession number(s) can be found in the article/Supplementary Material.
Author contributions
EM: Conceptualization, Formal Analysis, Funding acquisition, Methodology, Software, Visualization, Writing–original draft. DM: Formal Analysis, Methodology, Software, Writing–review and editing, Validation.
Funding
The author(s) declare that financial support was received for the research, authorship, and/or publication of this article. ANID provided financial support to EM via FONDECYT Iniciación (ANID Project number 11230197).
Acknowledgments
We would like to acknowledge the financial support provided by the FONDECYT Iniciación project (ANID Project number 11230197), which provides support to EM We thank Gisella Palma for her scientific illustration assistance and Zhaochong Zhang for the Editorial handling.
Conflict of interest
The authors declare that the research was conducted in the absence of any commercial or financial relationships that could be construed as a potential conflict of interest.
Publisher’s note
All claims expressed in this article are solely those of the authors and do not necessarily represent those of their affiliated organizations, or those of the publisher, the editors and the reviewers. Any product that may be evaluated in this article, or claim that may be made by its manufacturer, is not guaranteed or endorsed by the publisher.
Supplementary material
The Supplementary Material for this article can be found online at: https://www.frontiersin.org/articles/10.3389/feart.2024.1431516/full#supplementary-material
References
Aragon, R., McCallister, R. H., and Harrison, H. R. (1984). Cation diffusion in titanomagnetites. Contrib. Mineral. Petr. 85, 174–185. doi:10.1007/bf00371707
Ariskin, A. A., Bychkov, K. A., Nikolaev, G. S., and Barmina, G. S. (2018). The COMAGMAT-5: modeling the effect of Fe–Ni sulfide immiscibility in crystallizing magmas and cumulates. J. Petrol. 59 (2), 283–298. doi:10.1093/petrology/egy026
Barlow, R. J. (1989). Statistics: a guide to the use of statistical methods in the physical sciences 29. John Wiley & Sons.
Bohrson, W. A., Spera, F. J., Ghiorso, M. S., Brown, G. A., Creamer, J. B., and Mayfield, A. (2014). Thermodynamic model for energy-constrained open-system evolution of crustal magma bodies undergoing simultaneous recharge, assimilation and crystallization: the magma chamber simulator. J. Petrol. 55 (9), 1685–1717. doi:10.1093/petrology/egu036
Brahm, R., Zellmer, G. F., Kuritani, T., Coulthard, Jr. D., Nakagawa, M., Sakamoto, N., et al. (2021). MushPEC: correcting post-entrapment processes affecting melt inclusions hosted in olivine antecrysts. Sci. 8, 599726. doi:10.3389/feart.2020.599726
Caracciolo, A., Kahl, M., Bali, E., Guðfinnsson, G. H., Halldórsson, S. A., and Hartley, M. E. (2021). Timescales of crystal mush mobilization in the Bárðarbunga-Veiðivötn volcanic system based on olivine diffusion chronometry. Am. Mineral. 106 (7), 1083–1096. doi:10.2138/am-2021-7670
Chakraborty, S., and Dohmen, R. (2022). Diffusion chronometry of volcanic rocks: looking backward and forward. B. Volcanol. 84 (6), 57. doi:10.1007/s00445-022-01565-5
Chamberlain, K. J., Morgan, D. J., and Wilson, C. J. (2014). Timescales of mixing and mobilisation in the Bishop Tuff magma body: perspectives from diffusion chronometry. Contrib. Mineral. Petr. 168, 1034–1124. doi:10.1007/s00410-014-1034-2
Coombs, M. L., Eichelberger, J. C., and Rutherford, M. J. (2000). Magma storage and mixing conditions for the 1953–1974 eruptions of southwest trident volcano, katmai national park, Alaska. Contrib. Mineral. Petr. 140 (1), 99–118. doi:10.1007/s004100000166
Costa, F., Dohmen, R., and Chakraborty, S. (2008). Time scales of magmatic processes from modeling the zoning patterns of crystals. Rev. Mineral. Geochem. 69 (1), 545–594. doi:10.2138/rmg.2008.69.14
Costa, F., and Dungan, M. (2005). Short time scales of magmatic assimilation from diffusion modeling of multiple elements in olivine. Geology 33 (10), 837–840. doi:10.1130/g21675.1
Costa, F., and Morgan, D. (2010). “Timescales of magmatic processes,” in Timescales of magmatic processes. Editors A. Dosseto, S. Turner, and J. Van-Orman (Wiley-Blackwell).
Costa, F., Shea, T., and Ubide, T. (2020). Diffusion chronometry and the timescales of magmatic processes. Nat. Rev. Earth Environ. 1 (4), 201–214. doi:10.1038/s43017-020-0038-x
Couperthwaite, F. K., Morgan, D. J., Pankhurst, M. J., Lee, P. D., and Day, J. M. (2021). Reducing epistemic and model uncertainty in ionic inter-diffusion chronology: A 3D observation and dynamic modeling approach using olivine from Piton de la Fournaise, la Réunion. Am. Mineral. 106 (3), 481–494. doi:10.2138/am-2021-7296ccby
Crank, J., and Nicolson, P. (1947). A practical method for numerical evaluation of solutions of partial differential equations of the heat-conduction type. Math. Proc. Camb. philosophical Soc. 43 (1), 50–67. doi:10.1017/s0305004100023197
Danyushevsky, L. V., and Plechov, P. (2011). Petrolog3: integrated software for modeling crystallization processes. Geochem. Geophy. Geosy. 12 (7). doi:10.1029/2011gc003516
Dohmen, R., Becker, H. W., and Chakraborty, S. (2007). Fe–Mg diffusion in olivine I: experimental determination between 700 and 1,200°C as a function of composition, crystal orientation and oxygen fugacity. Phys. Chem. Min. 34, 389–407. doi:10.1007/s00269-007-0157-7
Dohmen, R., and Chakraborty, S. (2007). Fe–Mg diffusion in olivine II: point defect chemistry, change of diffusion mechanisms and a model for calculation of diffusion coefficients in natural olivine. Phys. Chem. Min. 34 (6), 409–430. doi:10.1007/s00269-007-0158-6
Dohmen, R., Ter Heege, J. H., Becker, H. W., and Chakraborty, S. (2016). Fe-Mg interdiffusion in orthopyroxene. Am. Mineral. 101 (10), 2210–2221. doi:10.2138/am-2016-5815
Fick, A. (1855). V. On liquid diffusion. Lond. Edinb. Dublin Philosophical Mag. J. Sci. 10 (63), 30–39. doi:10.1080/14786445508641925
Ghiorso, M. S., and Gualda, G. A. (2015). An H2O–CO2 mixed fluid saturation model compatible with rhyolite-MELTS. Contributions Mineralogy Petrology 169, 53–30. doi:10.1007/s00410-015-1141-8
Girona, T., and Costa, F. (2013). DIPRA: a user-friendly program to model multi-element diffusion in olivine with applications to timescales of magmatic processes. Geochem. Geophys. Geosystems 14 (2), 422–431. doi:10.1029/2012gc004427
Gualda, G. A., Ghiorso, M. S., Lemons, R. V., and Carley, T. L. (2012). Rhyolite-MELTS: a modified calibration of MELTS optimized for silica-rich, fluid-bearing magmatic systems. J. Petrol. 53 (5), 875–890. doi:10.1093/petrology/egr080
Kahl, M., Chakraborty, S., Costa, F., and Pompilio, M. (2011). Dynamic plumbing system beneath volcanoes revealed by kinetic modeling, and the connection to monitoring data: an example from Mt. Etna. Earth Planet. Sc. Lett. 308 (1-2), 11–22. doi:10.1016/j.epsl.2011.05.008
Kahl, M., Chakraborty, S., Pompilio, M., and Costa, F. (2015). Constraints on the nature and evolution of the magma plumbing system of Mt. Etna volcano (1991–2008) from a combined thermodynamic and kinetic modelling of the compositional record of minerals. J. Petrol. 56 (10), 2025–2068. doi:10.1093/petrology/egv063
Kahl, M., Mutch, E. J. F., Maclennan, J., Morgan, D. J., Couperthwaite, F., Bali, E., et al. (2023). Deep magma mobilization years before the 2021 CE Fagradalsfjall eruption, Iceland. Geology 51 (2), 184–188. doi:10.1130/g50340.1
Ma, B., Liu, P. P., Dick, H. J., Zhou, M. F., Chen, Q., and Liu, C. Z. (2024). Trans-lithospheric ascent processes of the deep-rooted magma plumbing system underneath the ultraslow-spreading SW Indian ridge. J. Geophys. Res. Solid Earth 129, e2023JB027224. doi:10.1029/2023jb027224
Morgado, E., Morgan, D. J., Castruccio, A., Ebmeier, S. K., Parada, M. Á., Brahm, R., et al. (2019). Old magma and a new, intrusive trigger: using diffusion chronometry to understand the rapid-onset Calbuco eruption, April 2015 (Southern Chile). Contrib. Mineral. Petr. 174, 61–11. doi:10.1007/s00410-019-1596-0
Morgado, E., Morgan, D. J., Harvey, J., Castruccio, A., Brahm, R., McGee, L. E., et al. (2022). The magmatic evolution and the regional context of the 1835 AD osorno volcano products (41°06’S, southern Chile). J. Petrol. 63 (11). doi:10.1093/petrology/egac105
Morgado, E., Parada, M. A., Morgan, D. J., Gutiérrez, F., Castruccio, A., and Contreras, C. (2017). Transient shallow reservoirs beneath small eruptive centres: constraints from Mg-Fe interdiffusion in olivine. J. Volcanol. Geoth. Res. 347, 327–336. doi:10.1016/j.jvolgeores.2017.10.002
Petrelli, M., Caricchi, L., and Perugini, D. (2020). Machine learning thermo-barometry: application to clinopyroxene-bearing magmas. J. Geophys. Res. Solid Earth 125 (9), e2020JB020130. doi:10.1029/2020jb020130
Petrone, C. M., Braschi, E., Francalanci, L., Casalini, M., and Tommasini, S. (2018). Rapid mixing and short storage timescale in the magma dynamics of a steady-state volcano. Earth Planet. Sc. Lett. 492, 206–221. doi:10.1016/j.epsl.2018.03.055
Philibert, J. (1991). Atom movements, diffusion and mass transport in solids. France: Les éditions de Physique, Les Ulis, 577.
Prior, D. J., Boyle, A. P., Brenker, F., Cheadle, M. C., Day, A., López, G., et al. (1999). The application of electron backscatter diffraction and orientation contrast imaging in the SEM to textural problems in rocks. Am. Mineral. 84 (11-12), 1741–1759. doi:10.2138/am-1999-11-1204
Prior, D. J., Mariani, E., and Wheeler, J. (2009). EBSD in the earth sciences: applications, common practice, and challenges. Electron Backscatter Diffr. Mater. Sci., 345–360. doi:10.1007/978-0-387-88136-2_26
Keywords: diffusion chronometry, magmatic timescales, standalone software, olivine, orthopyroxene, titanomagnetite, error propagation, melt
Citation: Morgado E and Morgan DJ (2024) DiffSim: a user-friendly tool for precise magmatic timescale determination and error propagation via major element diffusion chronometry in magmatic phases. Front. Earth Sci. 12:1431516. doi: 10.3389/feart.2024.1431516
Received: 12 May 2024; Accepted: 26 June 2024;
Published: 16 July 2024.
Edited by:
Zhaochong Zhang, China University of Geosciences, ChinaReviewed by:
Ping-Ping Liu, Peking University, ChinaTong Hou, China University of Geosciences, China
Copyright © 2024 Morgado and Morgan. This is an open-access article distributed under the terms of the Creative Commons Attribution License (CC BY). The use, distribution or reproduction in other forums is permitted, provided the original author(s) and the copyright owner(s) are credited and that the original publication in this journal is cited, in accordance with accepted academic practice. No use, distribution or reproduction is permitted which does not comply with these terms.
*Correspondence: Eduardo Morgado, ZWR1YXJkby5tb3JnYWRvQHVtYXlvci5jbA==
 Eduardo Morgado
 Daniel J. Morgan