 Xinsheng Luo1
 Chunlong Yang
 Ming Cheng
 Dengke Li
- 1Research Institute of Exploration and Development, Tarim Oilfield Company, PetroChina, Korla, Xinjiang, China
- 2Research Institute of Petroleum Exploration and Development, Beijing, China
- 3Bohai Rim Energy Research Institue, Northeast Petroleum University, Daqing, China
- 4College of Geoscience and Surveying Engineering, China University of Mining and Technology, Beijing, China
The Lower Cambrian petroleum system in the Tarim Basin has undergone multiple periods of tectonic movements, leading to successive hydrocarbon expulsion events and adjustments. The complex process of hydrocarbon accumulation occurred under deep burial conditions, persisting at depths of nearly 6,000 m over an extended period. This has resulted in the current occurrence of various phases including light oil, condensate, and gas in the deep-ultradeep strata of the Tarim Basin. The intricacies of formation of hydrocarbon accumulations and phase evolution have posed challenges to understanding the accumulation mechanisms and enrichment patterns of the Cambrian in the Tarim Basin, consequently lowering the success rate of oil and gas exploration. Such characteristics of multi-stage accumulation and adjustment are prevalent in deep hydrocarbon systems. Therefore, based on data from Well ZH1 in the Tazhong Uplift, combined with basin simulation, Compositional kinetics model, and PVT performance simulation, this study investigates the hydrocarbon generation and phase evolution processes in the deep hydrocarbon systems of the Tazhong Uplift. The results indicate that Well ZH1 entered the hydrocarbon generation peak during the Late Ordovician, followed by secondary cracking as the predominant hydrocarbon evolution process. Hydrocarbon fluids within the Lower Cambrian reservoir transitioned into the condensate phase towards the end of the Cambrian, with increasing depth resulting in higher gas-oil ratios and a decreasing trend in viscosity and density.
1 Introduction
With the continuous growth of global energy demand and the gradual depletion of shallow oil and gas resources, deep-ultradeep oil and gas exploration has become an important strategic direction to safeguard national energy security and promote the sustainable development of the oil and gas industry. As one of the world’s largest energy consumers, China’s exploration and development of deep-ultradeep oil and gas resources are particularly crucial (Li et al., 2020; Guo et al., 2023; Jia and Zhang, 2023). By the end of 2022, China had discovered more than ten deep-ultradeep gas fields, with proven natural gas reserves reaching 5 × 10¹²m3 and cumulative natural gas production of 5 × 10⁸ m3 (Jia et al., 2024), ensuring the healthy and stable development of the petroleum industry. For the foreseeable future, deep-ultradeep oil and gas resources will undoubtedly remain a key area and direction for oil and gas exploration in China.
The Tarim Basin is the largest oil and gas basin in China, with the Lower Cambrian sub-salt strata being the hotspot for deep-ultradeep oil and gas exploration (Yang et al., 2021). This stratigraphic sequence constitutes an oil and gas-bearing system, with thick evaporite and gypsum rocks widely developed in the overlying Middle Cambrian, providing strong sealing capabilities (Xu et al., 2023). The Yuertusi Formation at the base serves as the primary source rock for Cambrian oil and gas reservoirs in the basin, characterized by high organic matter abundance (Wang et al., 2003; Xiong et al., 2015; Song et al., 2016; Yang et al., 2020a). The reservoir consists of extensively developed dolomite reservoirs formed in a reef-flat depositional environment, offering excellent conditions for oil and gas accumulation (Yang et al., 2020b). Currently, more than 20 exploration wells targeting the Lower Cambrian have been drilled in areas such as Bachu Uplift, Tazhong Uplift, and the Lunan-Gucheng Marginal Belt, with several wells encountering industrial oil and gas flows, marking a new phase in deep-ultradeep exploration in the Tarim Basin (Yi et al., 2019; Lin et al., 2021; Lv et al., 2022).
The most significant characteristics of the Lower Cambrian sub-salt hydrocarbon system in the Tarim Basin are as follows: the source rocks are of ancient age and have undergone multiple phases of hydrocarbon expulsion due to tectonic movements, resulting in a complex hydrocarbon accumulation process within the system (Zhang et al., 2017). Additionally, the strata are deeply buried, with depths persisting at nearly 6,000 m over an extended period (Yang et al., 2020a; Chen et al., 2023). Under high-pressure conditions, hydrocarbons have undergone complex phase evolution throughout geological history, leading to the current occurrence of various phases such as light oil, condensate, and gas in the deep-ultradeep strata of the Tarim Basin (Yang et al., 2020b; Cao et al., 2020). These characteristics constrain the study of the accumulation mechanisms and enrichment patterns of the Lower to Middle Cambrian in the central Tarim area, consequently reducing the success rate of oil and gas exploration. Therefore, a proper understanding of the hydrocarbon expulsion process in the sub-salt Lower Cambrian hydrocarbon system of the Tarim Basin, as well as the phase characteristics and evolutionary history of hydrocarbons within the system, is crucial for predicting and exploring Tarim oil and gas resources (Yang et al., 2020b).
Currently, as the importance of oil and gas phase prediction grows, the prediction method based on compositional hydrocarbon generation kinetics model, basin model technology, and PVT simulation technology has been widely applied in the study of conventional, unconventional, and deep reservoirs (di Primio and Horsfield, 2006; Tan et al., 2013; Gao et al., 2023; Chen et al., 2019; Liu et al., 2022). This allows for accurate quantitative recovery of oil and gas phase states and crude oil physical parameters, laying a foundation for studying the migration and accumulation of oil and gas.
This study selects Well ZH1 in the Tazhong Uplift as the research target and employs a methodology of hydrocarbon system simulation. By utilizing component kinetic hydrocarbon modeling and PVT phase simulation, the hydrocarbon expulsion process from the Yuertusi Formation source rock in the study area was reconstructed. This enabled an accurate understanding of the evolution of hydrocarbon phase properties from the source to the reservoir, laying a foundation for further understanding the mechanisms of hydrocarbon accumulation and enrichment patterns.
2 Geological setting
The Tazhong Uplift, located in the central segment of the Tarim Basin, is a long-term inherited paleo-uplift. This uplift is bordered by the Manjiaer Depression in the north and the Tanggubasi Depression in the south, and Composed of Tazhong No.1 Structural Belt, the Northern Slope, the Central Fault Horst, the Southern Slope, and the eastern buried hill (Figure 1) (Zhang et al., 2002; Yang et al., 2007). Since the Paleozoic era, the Tazhong Uplift has undergone five stages of tectonic evolution: the Cambrian-Early Ordovician uplift incubation stage, Middle Ordovician uplift formation stage, Late Ordovician uplift construction stage, Silurian-Early Permian uplift modification stage, and localized adjustment stage after the Triassic (Lu et al., 2004; Pang et al., 2011). This tectonic evolution process has resulted in six major unconformities in the Tazhong Uplift: the Early Caledonian Unconformity (or Base Upper Ordovician Series), Late Caledonian Unconformity (or Base Silurian), Early Hercynian Unconformity (or Base Devonian), Late Hercynian Unconformity (or Base Triassic), Indosinian Unconformity (or Base Cretaceous), and Yanshan- Himalayan Unconformity (or Base Paleogene).
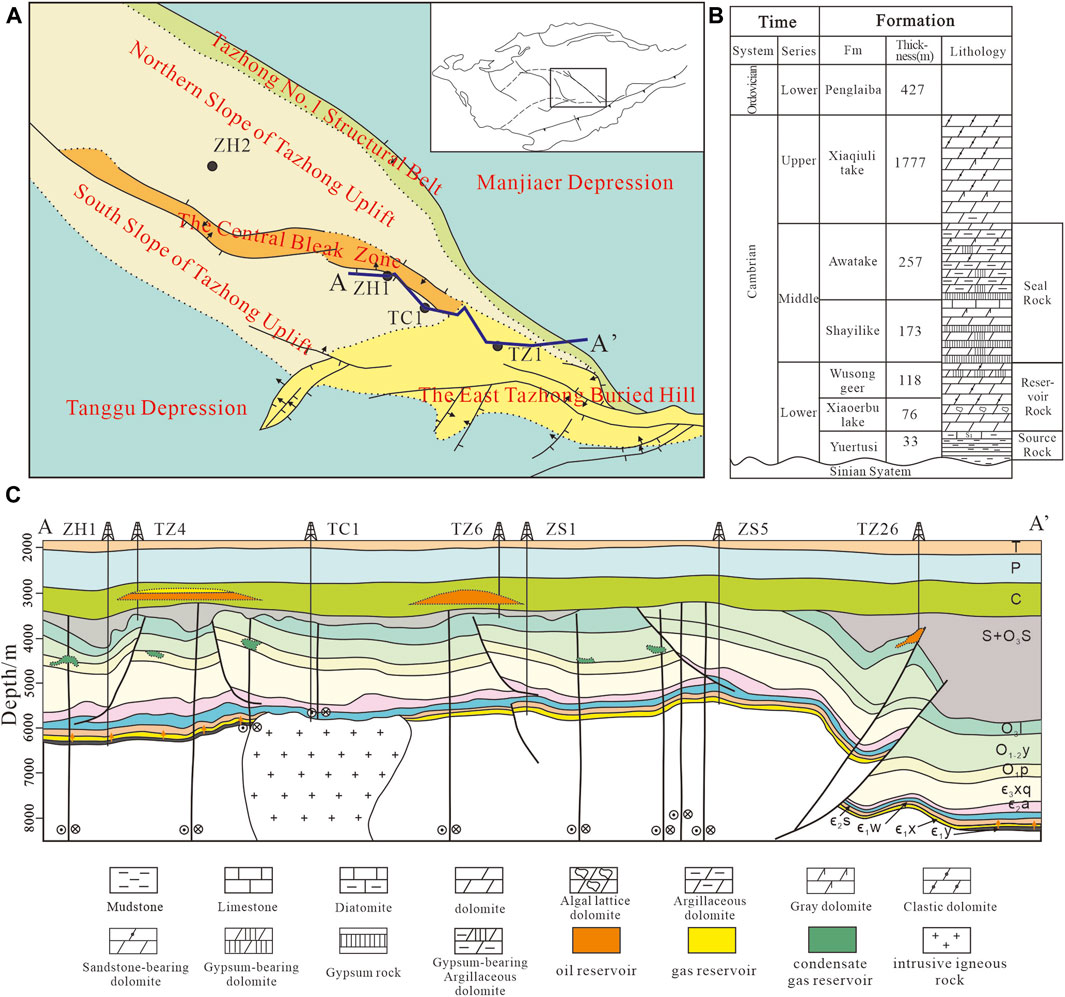
Figure 1. (A) Location of Tazhong Uplift. (B) Lithologic sketch of Cambrian in the Tazhong Uplift (modified from Yang et al., 2007). (C) A-A′ stratigraphic profile [see (A) for location].
The Cambrian system in the Tarim Basin includes the Yuertusi Formation, Xiaoerbulake Formation, Wusonggeer Formation, Shayilike Formation, Awatage Formation, and Lower Qiulitage Formation, from bottom to top (Figure 1). The Yuertusi Formation consists of mudstone deposited in a deep-water shelf and slope facies (Li et al., 2021), and it has been confirmed as the most important source rock in the entire Tarim Basin. In Tazhong Uplift and the neighboring Manjiaer Depression, the thickness of source rock in the Yuertusi Formation varies between 0 and 70m, with TOC ranges from 4% to 20% and HI ranges from 51 to 1055mg/gTOC (Lu et al., 2004; Yang et al., 2020a; Li et al., 2021). It exhibits excellent hydrocarbon generation potential throughout geological history. Platform facies were widely developed throughout Xiaoerbulake and Wusonggeer stage in the Tazhong Uplift. The lithology is mainly composed of algal lattice dolomite, arenaceous dolomite, and dolomite containing sand chips, accompanied by a large number of fractures and dissolution pores. The average porosity and permeability can reach 12.6 and 3.3mD (Zhang et al., 2017; Zhu et al., 2021). It can be seen that the Xiaoerbulake and Wusonggeer formations are excellent reservoir in deep-ultradeep reservoirs. After the deposition of Wusonggeer formation, accompanied by the fall of sea level, the platform facies in Tazhong Uplift underwent a gradual transition to become restricted platform facies and evaporite platform facies. And the Shayilike Formation and Awatage Formation, are primarily composed of gypsum and salt (Zhang et al., 2017; Lin et al., 2021).
Favorable source-reservoir-cap assemblage of Middle and Lower Cambrian bestows Tazhong Uplift with the potential for widespread hydrocarbon distribution within these strata. The hydrocarbon generated by source rocks in the Yuertusi Formation migrate vertically to the Xiaoerbulake Formation and Wusonggeer Formation, where lateral migration and accumulation occur in the two strata. Within the region, there are reverse faults and strike-slip faults (Figure 1), with reverse faults mainly developed during the Middle-Late Ordovician and strike-slip faults mainly developed during the Silurian-Carboniferous (Yang et al., 2022). Previous studies suggest that, the activity of thrust and strike-slip faults, as well as hydrocarbon migration, are the main reasons for the destruction of Lower Cambrian hydrocarbon reservoirs and the formation of reservoirs above the lower Cambrian (Yang et al., 2022; Han et al., 2008). The distribution of Lower Paleozoic hydrocarbon reservoirs in the Tazhong Uplift is attributed to multiple stages of accumulation, destruction and adjustment, resulting in a complex array of hydrocarbon phases.
Well ZH1 is located near the Central Fault Horst in the Tazhong Uplift (Figure 1), successfully drilling into the pre-Cambrian Qigebulake Formation and encountering a thickness of 33 m of the Yuertusi Formation source rock in the Lower Cambrian. This further confirms the presence of high-quality source rocks in the Yuertusi Formation below the salt layer in the Cambrian system in the Tazhong Uplift.
3 Method and data
3.1 Basin simulation based on PetroMod
The study utilized the Schlumberger PetroMod2017 basin model software to conduct basin simulation and obtain the thermal evolution history of Well ZH1. The necessary input data for the model include three main categories: 1) Geochemical data, comprising TOC, HI, hydrocarbon generation kinetics model (or type of source rock), vitrinite reflectance, etc. 2) Geological model, consisting of parameters such as sedimentary strata burial depth or thickness, lithology, absolute time of sedimentation, types of tectonic events, and their durations (corresponding to erosion events and the amount of erosion). 3) Boundary conditions, including variations in paleo-water depth, paleo-heat flow, and sediment-water interface temperatures. Additionally, the model requires a certain amount of data for maturity (Ro) values of source rocks, as well as temperature and pressure data from geological formations to ensure the reliability of the simulation results.
3.1.1 Basic parameter settings of source rocks
Well ZH1 encountered high-quality source rocks in the Yuertusi Formation, with a thickness of 33 m. The lithology is predominantly dark shale, interspersed with minor amounts of muddy siltstone and sandy mudstone. The total organic carbon (TOC) content was referenced from previous studies, with the initial HI set at 601mgHC/gTOC (Chen et al., 2023), and the initial TOC set at 18% (Zhu et al., 2016; Yang et al., 2020b; Chen et al., 2023).
3.1.2 Geological model
Table 1 presents the main geological model parameters for Well ZH1. The stratigraphic thickness and lithology are derived from the geological logging data of ZH1. Thermal conductivity data are sourced from the research of Feng et al. (2010), who measured 296 samples in Tazhong Uplift, and gave the thermal conductivity distribution range of each lithology. Using the model proposed by Luo et al. (2008), the radiogenic heat generation rates (A) for various logging intervals of ZH1 were calculated. The formula is A=0.0115 (GR+9.1), where GR is the natural gamma logging value, the unit is API, and A is the radioactive heat generation rate, the unit is μW·m−3. The erosion thickness is referenced from the results of Chen et al. (2019) and Wang et al. (2010).
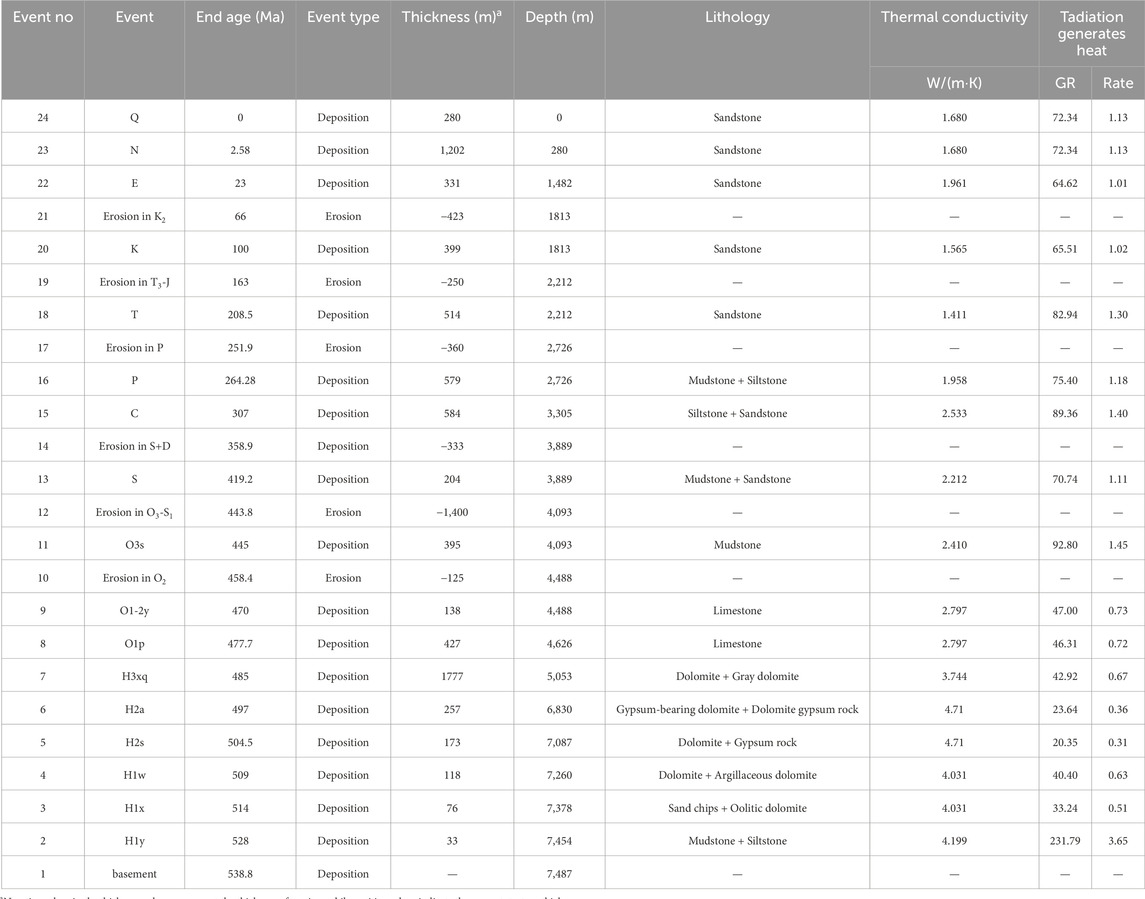
Table 1. Input data in ZH1 basin model (stratigraphic name, age, lithology, physical parameters).
3.1.3 Boundary condition
The geothermal field research in the Tazhong area indicates that since the Paleozoic era, the overall heat flow in the Tazhong Uplift has a trend of gradual decrease (Feng et al., 2010; Li et al., 2023; Qiu et al., 2023). It has gradually decreased from 50 to 70 mW/m2 (with an average of approximately 60 mW/m2) in the early Paleozoic to 32–50 mW/m2 (with an average of approximately 38 mW/m2) today. Previous studies suggest that large-scale magmatic activity in the Early Permian period caused a temporary peak of heat flow in the Tazhong Uplift. However, according to the research of Li et al. (2023), the heat generation effect of volcanic rock has a more significant impact on the northern slope, with a smaller effect on the southern slope. Their study found only a slight increase in heat flow remaining in the southern slope during this period (Li et al., 2023). So this study considers that the thermal uplift effect caused by Early Permian volcanic rocks has limited impact on Well ZH1. Paleo-water depth data are referenced from Qi et al. (2020), which include paleogeographic maps of key sedimentary periods since the deposition of the Lower Cambrian Yuertusi Formation. This study utilizes the global mean sea level temperature model from Petromod2017 (Wygrala, 1989) to estimate sediment water interface temperature (SWIT). ZH1 is located in Central Asia, Northern Hemisphere, specifically at 40°N latitude. Through this setting, the SWIT for each geological period of ZH1 can be determined. Figure 2 illustrates the evolution of boundary conditions for Well ZH1 with geological events.
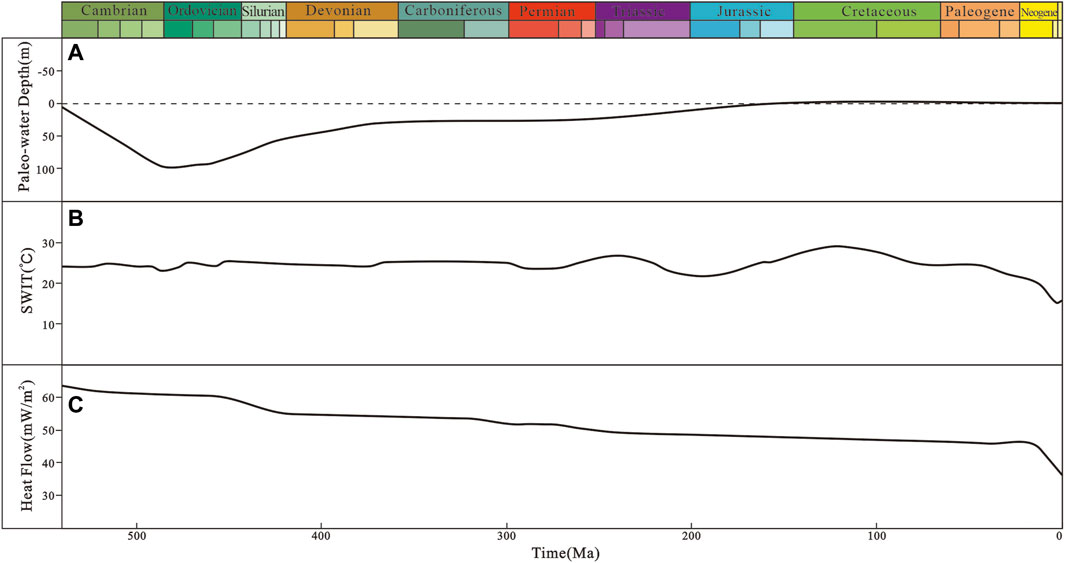
Figure 2. Boundary conditions of well ZH1 in basin modeling. (A) Paleo-water Depth; (B) sediment water interface temperature (SWIT); (C) Basal heat flow.
Calibration is crucial for basin modeling, and in this study, maturity and temperature were choose as Calibration parameters to ensure that the simulation results more consistent with the geological conditions. Temperature data were obtained from drill stem test in Well ZH1. Since there were only two maturity data points available in Well ZH1, this study further calibrated the simulation result using Ro data from the adjacent Well TC1 (Figure 1). Based on the stratigraphic correlation between ZH1 and TC1, the depths of Ro data were converted to equivalent depths in Well ZH1.
3.2 Compositional kinetics model and secondary cracking model
Petroleum generation kinetics parameters are typically derived from pyrolysis experiments conducted on immature source rocks. However, in Tarim Basin, Yuertusi Formation source rocks are commonly in the over-mature stage, making it challenging to conduct pyrolysis experiments to obtain relevant parameters (Chen et al., 2023). Chen et al. (2023) utilized pyrolysis results from closed-system experiments conducted on immature source rock samples from the Arthur Creek Formation of the Lower Cambrian in the Georgina Basin, Northern Australia, to obtain hydrocarbon generation kinetics parameters for the Yuertusi Formation source rocks in the Tarim Basin (Tan et al., 2013; Chen et al., 2019; Chen et al., 2023). This approach yielded satisfactory results in basin and Well Luntan-1 simulations. This study adopts the same model (Figure 3), comprising 14 hydrocarbon components (C1, C2, C3, iC4, nC4, iC5, nC5, nC6, C7-15, C16-25, C26-35, C36-45, C46-55, and C56-80). The component division scheme aligns with the commonly used hydrocarbon fluid component scheme in PVT phase simulation, facilitating the integration of petroleum generation and phase behavior simulation research.
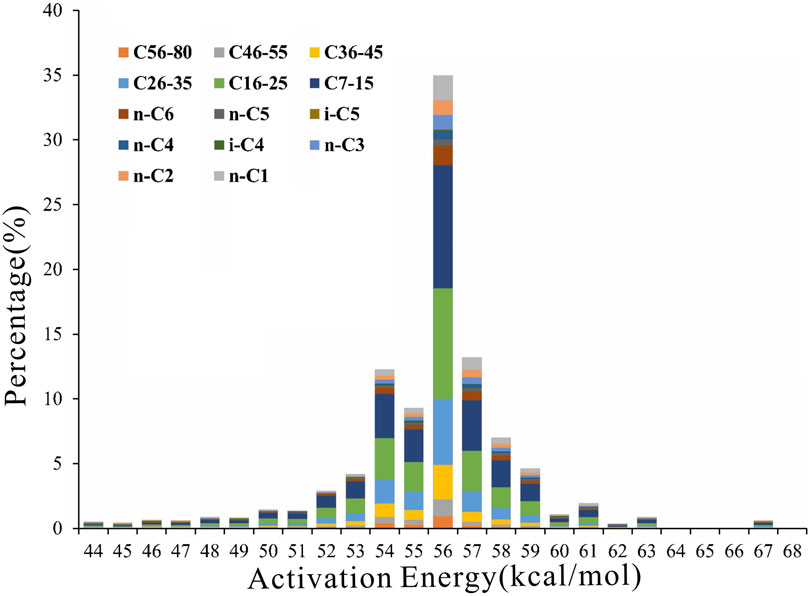
Figure 3. Distribution of activation energy of Arthur Creek Formation source rocks in Georgina Basin (mollified from Tan et al., 2013) (Frequency factor = 2.658 × 1028/Ma).
Considering that the burial depth of lower Cambrian is below 7,000 m and the temperature exceeds the temperature at which crude oil begins to crack (160°C), the crude oil in the Lower Cambrian reservoirs has entered the cracking stage (Behar et al., 1992; Behar et al., 2008). Additionally, the phase behavior of hydrocarbons is significantly influenced by the gas components content (di Primio and Horsfield, 2006). Therefore, this study incorporates a secondary cracking reaction model (provided by Petromod2017) into the generation model. This model includes the kinetic parameters for the secondary cracking of six heavy hydrocarbon components, denoted as P10, P20, P30, P40, P50, and P60+, representing C7-15, C16-25, C26-35, C36-45, C46-55, and C56-80, respectively (di Primio and Horsfield, 2006; Hantschel and Kaurauf, 2009).
3.3 PVT phase simulation
The PVT phase simulation method is utilized to predict the phase behavior characteristics of oil and gas and calculate fluid physical property. Currently, this method is widely integrated with basin modeling to reconstruct the evolution of petroleum phase behavior during geological history (di Primio and Horsfield, 2006). With the aid of the Petroleum generation kinetics and basin modeling, the types and relative contents (in mole fraction or mass percentage) of hydrocarbon components generated during various geological history periods can be obtained. Based on the hydrocarbon component data, this study utilizes the PVT sim software to conduct relevant phase behavior simulation work. To correspond with the hydrocarbon generation kinetic, eight pure components and six pseudo-components are selected based on previous literature for constructing the component property parameter table (Table 2), which includes molar mass, normal boiling point, critical temperature, etc. Furthermore, combining the fluid composition, the Peng-Robinson equation of state (Peng and Robinson, 1976) was selected. By performing flash calculations under specific temperature and pressure conditions, phase envelope, gas-oil ratio (GOR), density, viscosity, and other physical properties were simulated and calculated.
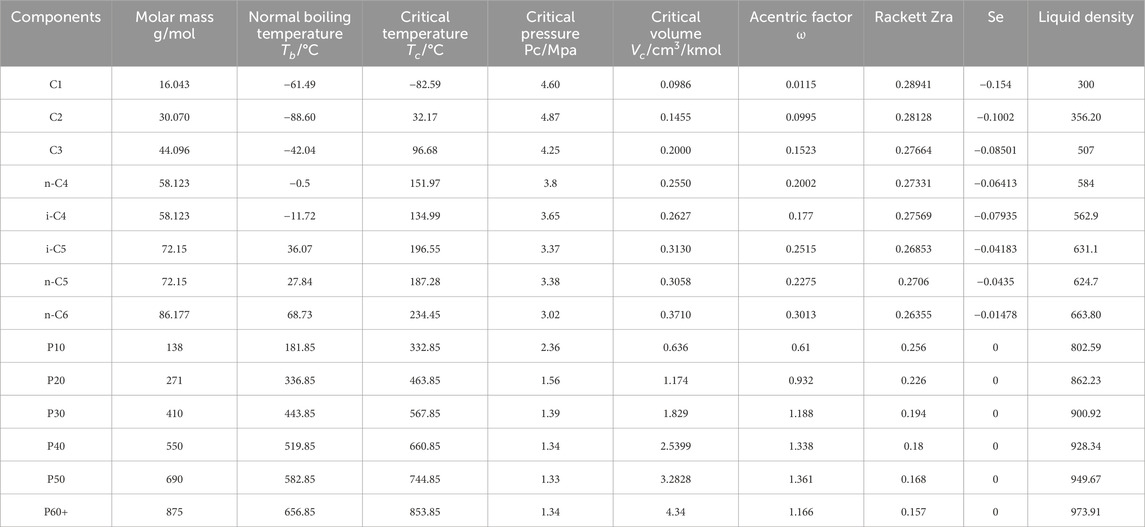
Table 2. The physical chemistry parameters of eight pure components and six quasi-components in PVT phase simulation.
3.4 Migration simulation
The Petroleum migration and accumulation process in the Lower Cambrian of the Tazhong Uplift can be simplified as the following model: oil and gas migrated upward from the Yuertusi Formation source rock, which is at the bottom of the Lower Cambrian. They accumulate in the reservoirs of the Xiaoerbulake Formation and Wusonggeer Formation, under the sealing effect of the evaporite rocks in the Shayilike Formation and Awatage Formation in the Middle Cambrian. Without considering vertical migration effects such as faults, this process can be simulated using a 1D migration model. The Darcy migration model is chosen for the 1D migration model (Hantschel and Kaurauf, 2009), with a maximum simulation step of 0.5 million years, to obtain the oil and gas composition characteristics in the Lower Cambrian reservoirs during different geological periods, which is the foundation for PVT phase simulation. Due to the occurrence of secondary cracking of crude oil in reservoirs such as the Xiaoerbulake Formation and Wusonggeer Formation in the Lower Cambrian, the hydrocarbon generation model considered secondary cracking during the migration simulation process.
4 Results and discussion
4.1 Burial and thermal evolution history of ZH1
Figure 4 displays the calibration data and the burial-thermal evolution of ZH1 model. The Ro data were obtained from the nearby TZ1 well, and the equivalent depth is estimated based on the relative position of data points in the stratigraphy. As shown in Figure 4, the simulation results of ZH1 exhibit a high degree of consistency with measured geothermal data and Ro data, indicating a high level of reliability in the simulation results.
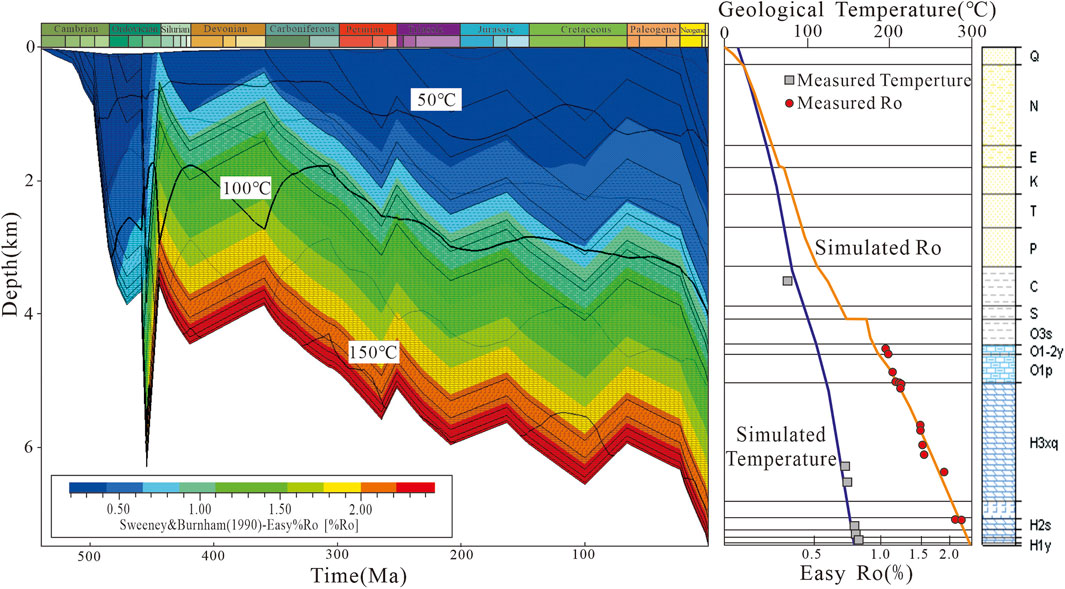
Figure 4. ZH1 burial history and superposition temperature-maturity and model correction results (The test Ro was obtained by equivalence in TC1 well).
Based on the simulation results and the regional geological setting, the burial process of ZH1 well can be delineated into four distinct stages: the rapid subsidence stage spanning from the Cambrian to the Middle Ordovician, uplift growth stage extending from the Late Ordovician to the Silurian, the uplift adjustment stage covering the Devonian to Permian, and the second rapid subsidence stage, which persists from the Triassic to the present day. Specifically, during the first stage, which occurred in the early to middle Caledonian movement, the lithology was mainly marine carbonate rocks, with the maximum burial depth of the Lower Cambrian approaching 6,000 m by the end of Middle Ordovician. The second stage was influenced by strong tectonic movements, resulting in differential uplift in the Tazhong area and forming the embryonic form of the Tazhong Paleo-uplift. ZH1 is close to the Eastern Subsidence Belt (Figure 1), with an erosion thickness of up to 700 m. The third stage experienced tectonic movements during the Caledonian period, after which the Tazhong uplift entered an adjustment period, and the landforms of the Tazhong paleo-uplift were basically formed, with the maximum burial depth of the Lower Cambrian approaching 6,000 m. The fourth stage, from the Indosinian to the Himalayan period, witnessed the inheritable development of the Tazhong ancient uplift, with weaker tectonic movements, forming the current structural pattern. The basin began to receive sedimentary deposits of continental clastic rocks in the Cenozoic era, with the burial depth of the Lower Cambrian approaching nearly 7,500 m.
The maturity of the Yuertusi Formation at the ZH1 well has reached 2.3% Ro, indicating that the source rock has surpassed both the oil window and the condensate stage in geological history and entered the gas window. As shown in Figure 4, the maturity evolution of the Yuertusi Formation source rock exhibits a distinct three-step: 1). The first stage corresponds to the Cambrian-Middle Ordovician, during which the maturity of source rock reached the early oil stage. During this stage, the Ro value can reach up to 0.74%. 2). The second stage corresponds to the Late Ordovician. With the rapid subsidence during the deposition of the Sangtamu Formation, the maturity rapidly increased from 0.8% Ro to 1.77% Ro. Subsequently, the maturity remained almost unchanged, reaching 1.9% Ro by the end of the Jurassic. 3). The third stage corresponds to the Yanshanian to Himalayan period, during which the maturity value reached the present 2.3% Ro.
From the thermal evolution history, Yuertusi Formation at the ZH1 well exhibits a complex temperature variation trend due to early strong tectonic movements, followed by relatively stable temperatures during later tectonic activities. As shown in Figure 4, during the Early Ordovician, Yuertusi Formation reached its highest temperature of 180°C. During this period (0.5%–1.4% maturity), oil generation was predominant. By the Late Ordovician, significant tectonic activity resulted in substantial uplift and erosion of the strata in the study area. Consequently, the temperature of the Yuertusi Formation decreased rapidly, followed by a gradual increase, reaching a minimum temperature of 110°C. During this period, the predominant hydrocarbon phase shifted to light oil and gas generation. After the Devonian, as tectonic activity gradually decreased, coupled with increased burial depth and decreased geothermal gradient, the temperature variation of the strata became relatively minor, fluctuating slightly between 160°C and 175°C. In terms of crude oil stability, the temperature fluctuations during this period led to extensive cracking of unstable oil, indicating the current stage is dominated by gas generation.
4.2 Hydrocarbon generation history
Figure 5 shows the hydrocarbon generation history of Yuertusi Formation source rock in the ZH1 well. There are three stages of hydrocarbon generation, as shown in Figure 5A, corresponding to Cambrian-Silurian, Devonian-Middle Triassic, and Late Triassic-present. During the Late Ordovician, the Yuertusi Formation experienced rapid burial, reaching depths of around 6,000 m with temperatures reaching approximately 160°C. The hydrocarbon generation rate of the source rock exhibited a trend of rapid increase followed by a rapid decrease. The maximum hydrocarbon generation rate occurred at 450 Ma, reaching 0.11mgHC/gTOC/Ma, with the maximum oil generation rate at 0.09mgHC/gTOC/Ma and the maximum gas generation rate at 0.02mgHC/gTOC/Ma. This trend is likely attributed to intense tectonic activity during the Late Ordovician, resulting in significant uplift and erosion of the strata. Subsequently, during the Late Devonian, the total organic carbon content of the source rock decreased, leading to a significant decrease in hydrocarbon generation rates. During the Late Devonian to the present period, the hydrocarbon generation rate exhibited an evolving trend of fluctuating increase and decrease.

Figure 5. Hydrocarbon generation history of Yuertusi Formation source rock in ZH1 well.
The hydrocarbon generation process corresponds to the consumption process of total organic carbon (TOC), as shown in Figure 5B. After the Late Ordovician period, the total organic carbon content of the source rock remains unchanged at 9%. However, the maturity index (Ro) continuously increases due to the increasing burial depth of the source rock, reaching the current value of 2.3%. During the Late Ordovician period, the TOC value decreased from 18% to 9%, corresponding to maturity indices of Ro<1.60%. The Late Devonian period corresponds to maturity indices of Ro = 1.6%–1.9%, and the Carboniferous-Permian period corresponds to maturity indices of Ro = 1.9%–2.3%. The hydrocarbon generation intensity of the Yuertusi Formation source rock during each stage is depicted in Figure 5C: during the Late Ordovician period, the hydrocarbon generation intensity was 8.96 × 10⁶ t/km2, with oil generation intensity at 7.51 × 10⁶ t/km2 and gas generation intensity at 1.45 × 10⁶ t/km2; during the Late Devonian period, the hydrocarbon generation intensity was 0.05 × 10⁶ t/km2, with oil generation intensity at 0.04 × 10⁶ t/km2 and gas generation intensity at 0.01 × 10⁶ t/km2; during the Carboniferous-Permian period, the hydrocarbon generation intensity was 0.1 × 10⁶ t/km2, with oil generation intensity at 0.07 × 10⁶ t/km2 and gas generation intensity at 0.03 × 10⁶ t/km2; the total hydrocarbon generation intensity was 9.11 × 10⁶ t/km2, with total oil generation intensity at 7.62 × 10⁶ t/km2 and total gas generation intensity at 1.49 × 10⁶ t/km2. Overall, the Yuertusi Formation source rock began to generate a large amount of hydrocarbon during the Late Ordovician period, with oil generation being dominant, and the peak of hydrocarbon generation occurred during the Late Ordovician period. Some hydrocarbon generation continued after the Late Ordovician period, with the Late Devonian period being dominated by light oil and gas generation, and the Carboniferous-Permian period being dominated by dry gas generation.
4.3 Phase and physical characteristics of lower Cambrian in ZH1
Based on the secondary cracking hydrocarbon generation kinetics model, 1D migration model, and PVT phase simulation, this study simulated the evolution of petroleum phase in the geological history of the Lower Cambrian reservoirs. The simulation results show similarities in the composition and thermodynamic evolution between the Xiaoerbulake Formation and Wusonggeer Formation, so this paper only presents the petroleum phase and physical property characteristics changes of the Wusonggeer Formation (Figure 6).
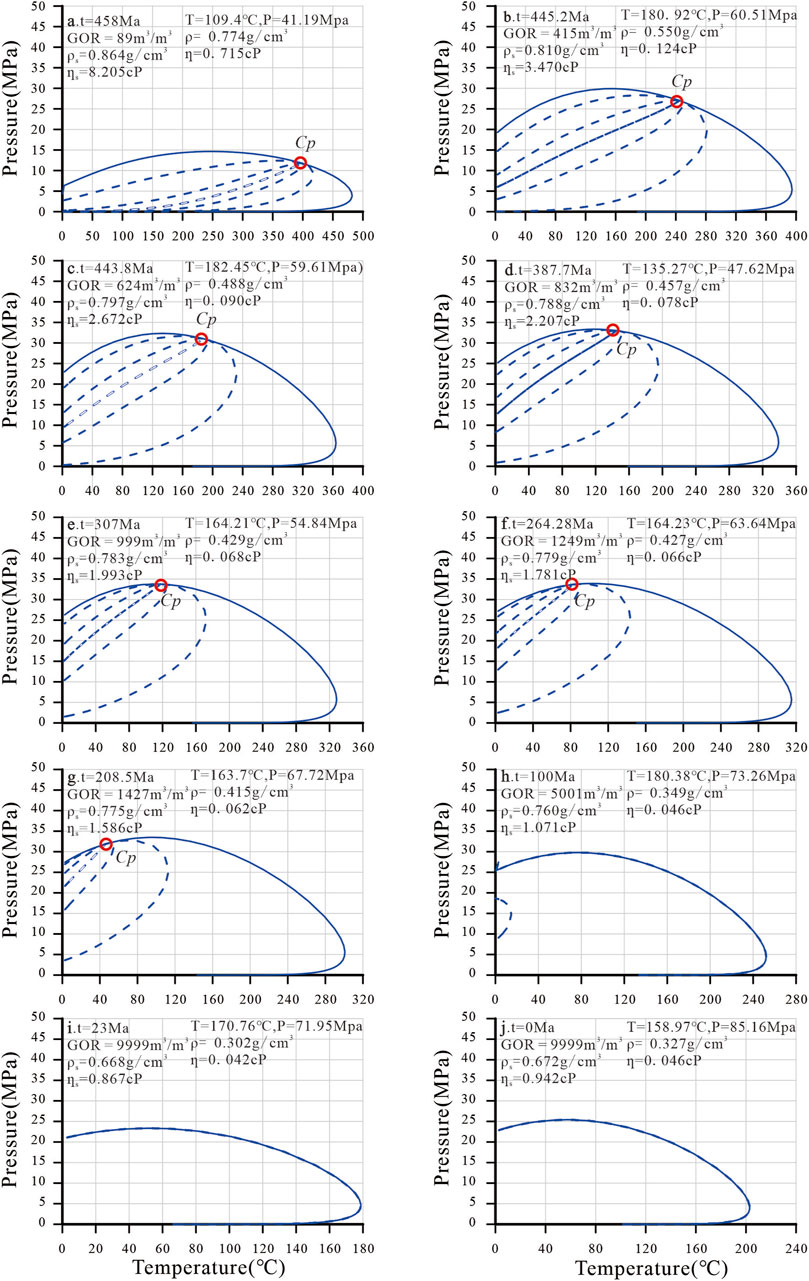
Figure 6. Hydrocarbon fluid phase diagram and phase state physical properties of Wusonggeer Formation Reservoir in ZH1 well (GOR, Gas-oil ratio; ρs, Crude oil density under surface conditions; ηs, Crude oil viscosity under surface conditions; T, Reservoir temperature; P, Reservoir pressure; ρ, Crude oil density under reservoir conditions; η, Crude oil viscosity under reservoir conditions.
During the Early to Middle Ordovician, the source rocks of the Yuertusi Formation entered the mature stage, and the process of hydrocarbon generation begins. Petroleum migrated from the source rocks into the Xiaoerbulake Formation and Wusonggeer Formation by the end of the Early Ordovician. Figure 6A illustrates the phase envelope of Petroleum within the Wusonggeer Formation by the end of the Middle Ordovician. It can be observed that during this period, the range of petroleum phase envelope is relatively small, with a maximum condensation temperature of 481.94°C and a maximum condensation pressure of 14.64 MPa. The critical temperature and pressure are 398.8°C and 11.76MPa, respectively. Under reservoir conditions (109.49°C and 41.19 MPa), the petroleum exists in the liquid phase with a density of 0.774 g/cm3 and viscosity of 0.715 cP. At surface conditions, the viscosity and density of the crude oil are 0.864 g/cm3 and 8.205 cP, respectively, with a gas-oil ratio of 89 m3/m3. At this time, the crude oil is classified as black oil (with a gas-oil ratio less than 350 m3/m3 under surface conditions).
During the Late Ordovician, the source rocks of the Yuertusi Formation entered the gas generation stage during rapid burial. The temperatures of various strata below the Lower Cambrian exceeded 160°C, causing the crude oil to enter the stage of secondary cracking, leading to an increase in the relative content of gases such as methane. As a result, the range of hydrocarbon fluid phase envelope within the Wusonggeer Formation expanded (Figure 6B, C). By the deposition age of the Sangtamu Formation, the maximum condensation temperature decreased to 364.11°C, and the maximum condensation pressure expanded to 32.33MPa, with critical temperature and pressure values of 187.80°C and 31.03MPa, respectively. Under in situ conditions (182.45°C and 59.61 MPa), the hydrocarbon fluid exists in the liquid phase with a density of 0.488 g/cm3 and a viscosity of 0.090 cP. At surface conditions, the viscosity and density of the crude oil are 0.797 g/cm3 and 2.672 cP, respectively, with a gas-oil ratio of 624 m3/m3, indicating that the petroleum type has transitioned to condensate gas (with a gas-oil ratio ranging from 600 m3/m3 to 9000 m3/m3 under surface conditions). This also suggests that the presence of light oil (with a gas-oil ratio ranging from 350 m3/m3 to 600 m3/m3 under surface conditions) within the reservoir of the Wusonggeer Formation was relatively short-lived.
During the Late Silurian to Triassic, the source rocks of the Yuertusi Formation and the two underlying reservoirs underwent secondary cracking, accompanied by the decomposition of liquid hydrocarbons and the generation of methane, altering the relative proportions of hydrocarbon components within the reservoir. With changes in temperature and pressure conditions, the hydrocarbon fluid phase envelope within the Wusonggeer Formation reservoir underwent corresponding changes. As shown in Figure 6D–G, the maximum condensation temperature gradually decreased from 339.1°C in the Silurian to 300.74°C in the Triassic, while the maximum condensation pressure remained relatively stable (within the range of 330–340 MPa). Regarding the critical pressure and temperature, the former showed minimal fluctuations (ranging from 320 to 335 MPa), while the latter exhibited significant changes, decreasing from 144.96°C to 45.62°C. By the end of the Silurian, under in situ conditions (164.21°C and 54.84 MPa), the hydrocarbon fluid existed in the liquid phase, with a density of 0.457 g/cm3 and a viscosity of 0.078 cP. At surface conditions, the density and viscosity of the oil were 0.783 g/cm3 and 1.993 cP, respectively, with a gas-oil ratio of 999 m3/m3. Upon entering the Carboniferous, the in situ petroleum transitioned from liquid to gas phase. By the end of the Triassic, under reservoir conditions (163.7°C and 67.72 MPa), the density and viscosity of the oil and gas were 0.4146 g/cm3 and 0.078 cP, respectively. At surface conditions, the density and viscosity of the oil were 0.760 g/cm3 and 1.070 cP, respectively, with a gas-oil ratio of 1,427.5 m3/m3.
From the Cretaceous to the present, secondary cracking of hydrocarbons predominated. As depicted in Figure 6H–J, the most notable feature of the hydrocarbon fluid phase diagram during this period is the disappearance of the critical point. By the end of the Cretaceous, within the Wusonggeer Formation reservoir, the density of oil under reservoir conditions was 0.349 g/cm3, with a viscosity of 0.046 cP. At surface conditions, the density and viscosity of the oil were 0.760 g/cm3 and 1.071 cP, respectively, with a gas-oil ratio as high as 5001 m3/m3. Upon entering the Cenozoic era, the relative methane content in the oil within the Wusonggeer Formation increased. During the Paleogene, under reservoir conditions, the density of the oil was 0.302 g/cm3, with a viscosity of 0.042 cP. At surface conditions, the density and viscosity of the oil were 0.668 g/cm3 and 0.867 cP, respectively, with a gas-oil ratio of 9999 m3/m3. At present, under reservoir conditions, the density of the oil is 0.327 g/cm3, with a viscosity of 0.046 cP. At surface conditions, the density and viscosity of the oil are 0.672 g/cm3 and 0.942 cP, respectively, with a gas-oil ratio of 9999 m3/m3.
Combining the evolution of the Yuertusi Formation source rock, it can be observed that as maturity increases, the hydrocarbon fluids within the Wusonggeer Formation reservoir gradually become lighter. The petroleum type transitions from early to middle Ordovician black oil to light oil, condensate, and gas phase. The gas-oil ratio changes from 89 m3/m3 to the current 9,999 m3/m3.
4.4 Lightening process of crude oil in the lower Cambrian reservoir in Tazhong Uplift
Lightening of crude oil is crucial in deep reservoirs. Based on simulation results, this paper explores the process of crude oil lightening in the Tazhong Uplift. Figure 7 illustrates the changes in the critical temperature and pressure of reservoir crude oil with increasing maturity of the source rocks in the Yuertusi Formation. As maturity increases, the critical temperature of crude oil gradually decreases from 400°C to 0°C. The critical pressure tends to increase first and then decrease, rising from 118.3 bar to 337.5 bar and then dropping to 254.9 bar. The reduction point of critical pressure corresponds to an Easy Ro of around 1.8%, which aligns with the maturity level at which large-scale cracking and gas generation occur in crude oil. The GOR evolution curve shown in Figure 7 exhibits similar characteristics. Before reaching 1.8% Ro, the GOR of reservoir oil remains below 2,000 m3/m3, indicating the petroleum type is black oil or light oil. However, once maturity exceeds 1.8% Ro, the GOR of reservoir oil rises rapidly, transforming the petroleum type into condensate gas and wet gas. The direct consequence of this evolution is a rapid decrease in crude oil density and viscosity after 1.8% Ro (see Figure 1). Under reservoir conditions, the density and viscosity decrease to below 0.4 g/cm3 and 0.062 cP, respectively. Therefore, despite the poorer quality of deep reservoirs compared to shallower ones, the reduction in density and viscosity still facilitates hydrocarbon migration and accumulation.
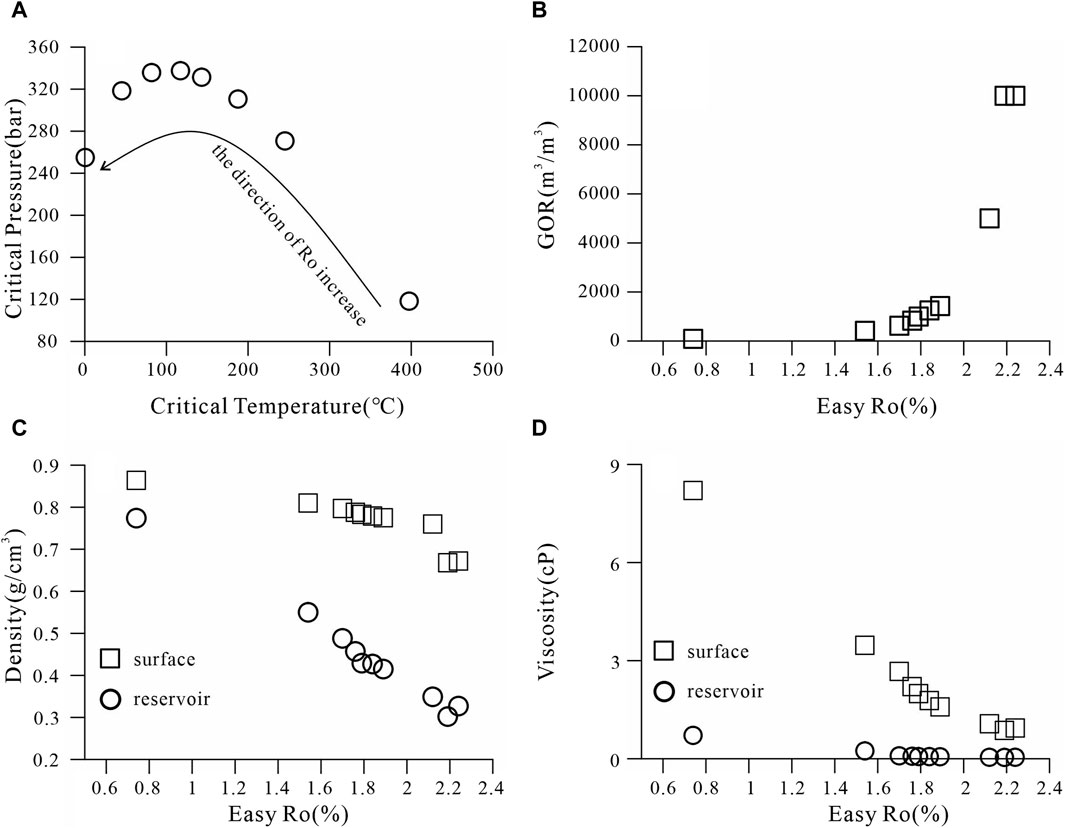
Figure 7. Evolution process of crude oil properties with the maturity of hydrocarbon source rocks. (A) Correlation diagram between critical temperature and critical pressure, indicating the direction of increasing Ro; (B) Relationship between GOR and RO; (C) Relationship between crude oil density and RO, where circles represent reservoir conditions and squares represent surface conditions; (D) Relationship between crude oil viscosity and Ro, where circles represent reservoir conditions and squares represent surface conditions.
Based on the simulation results of source rock maturity, it can be observed that the source rocks of the Yuertusi Formation had already reached a thermal evolution degree of 1.8% during the Silurian period, coinciding with the end of intense tectonic activity. This suggests that the crude oil in the Lower Cambrian reservoir of Tazhong Uplift had already transformed into condensate gas with very low density and viscosity at an early stage. In a relatively stable tectonic setting, this facilitated easy migration and accumulation, leading to the formation of large oil and gas reservoirs.
5 Conclusion
(1) In the Tarim Basin area, the hydrocarbon generation process of Well ZH1 went through three stages. The first stage occurred during the early to middle Ordovician period, when the source rock entered the mature stage. The second stage corresponds to the late Ordovician period, during which, with the rapid sedimentation of the Sangtamu Formation, maturity increased rapidly from 0.8% Ro to 1.77% Ro. Subsequently, maturity remained relatively stable, reaching 1.9% Ro by the end of the Indo-china period. The third stage corresponds to the Yanshanion to Himalayan period, where the maturity value reached the current 2.3% Ro.
(2) Hydrocarbon generation from the Yuertusi Formation source rock began significantly during the early Galician period, predominantly producing oil. The peak of hydrocarbon generation occurred during the late Galician period. Even after the Galician period, some hydrocarbon generation continued. During the late Hercynian period, light oil and gas predominated, while during the Indosinian to Himalayan period, dry gas was the main product of hydrocarbon generation.
(3) As the maturity of the source rock in the Yuertusi Formation increases, the hydrocarbon fluids in the Wusonggeer Formation reservoir gradually become lighter. During the early to middle Cambrian, the fluids are classified as black oil, transitioning to the condensate oil stage towards the end of the late Cambrian. With increasing of burial depth, the hydrocarbon fluids in the reservoir exhibit an increasing gas-to-oil ratio, accompanied by a decrease in viscosity and density.
Data availability statement
The raw data supporting the conclusions of this article will be made available by the authors, without undue reservation.
Author contributions
XL: Writing–review and editing, Writing–original draft. CY: Writing–review and editing, Software, Methodology, Writing–original draft. QZ: Supervision, Methodology, Writing–original draft. MC: Writing–original draft, Software, Methodology. KZ: Methodology, Writing–original draft. JS: Methodology, Investigation, Data curation, Writing–original draft. DL: Writing–original draft, Software, Investigation.
Funding
The author(s) declare that financial support was received for the research, authorship, and/or publication of this article. The study was supported by the National Key Research and Development Program (Grant No. 2019YFC0605505) and PetroChina Limited Science and Technology Project (2023ZZ0203).
Conflict of interest
Authors XL, QZ, and KZ were employed by Tarim Oilfield Company, PetroChina.
The remaining authors declare that the research was conducted in the absence of any commercial or financial relationships that could be construed as a potential conflict of interest.
Publisher’s note
All claims expressed in this article are solely those of the authors and do not necessarily represent those of their affiliated organizations, or those of the publisher, the editors and the reviewers. Any product that may be evaluated in this article, or claim that may be made by its manufacturer, is not guaranteed or endorsed by the publisher.
References
Behar, F., Kressman, S., Rudkiewicz, J., and Vandenbrouke, M. (1992). Experimental simulation in a confined system and kinetic modelling of kerogen and oil cracking. J. Org. Geochem. 19, 173–189. doi:10.1016/0146-6380(92)90035-V
Behar, F., Lorant, F., and Mazeas, L. (2008). Elaboration of a new compositional kinetic schema for oil cracking. J. Org. Geochem. 39, 764–782. doi:10.1016/j.orggeochem.2008.03.007
Cao, Z., You, D., Qi, L., Yun, L., Hu, W., Li, Z., et al. (2020). New insights of the genesis of ultra-deep dolomite reservoirs in Well TS1, Tarim Basin: Evidence from in situ carbon and oxygen isotope. analysis. J. Nat. Gas. Geosci. 31 (7), 915–922. doi:10.11764/j.issn.1672-1926.2020.03.005
Chen, C., Deng, R., Zhang, H., and Wang, Y. (2023). Quantitative simulation of phase evolution for ultra-deep oil and gas from Lower Cambrian strata of Well Luntan-1 in the Tarim Basin. J. Nat. Gas. Geosci. 34 (1), 96–110. doi:10.11764/j.issn.1672-1926.2022.09.008
Chen, C., Shi, S., and Wang, Y. (2019). Adsorption simulation based on PetroMod of high-quality shale segment of Wufeng-Longmaxi Formation in Changning area, Sichuan basin. J. Geochim. 48 (06), 602–612. doi:10.19700/j.0379-1726.2019.06.008
di Primio, R., and Horsfield, B. (2006). From petroleum-type organofacies to hydrocarbon phase prediction. J. AAPG Bull. 90 (7), 1031–1058. doi:10.1306/02140605129
Feng, C., Liu, S., Wang, L., and Li, C. (2010). Present-Day geotemperature field characteristics in the central uplift area of the Tarim Basin and implications for hydrocarbon generation and preservation. J. Earth Science—Journal China Univ. Geosciences 35 (04), 645–656. doi:10.3799/dqkx.2010.079
Gao, J., Li, X., Cheng, G., Luo, H., and Zhu, H. (2023). Structural evolution and characterization of organic-rich shale from macroscopic to microscopic resolution: the significance of tectonic activity. Adv. Geo-Energy Res. 10 (2), 84–90. doi:10.46690/ager.2023.11.03
Guo, X., Hu, Z., Li, S., Zheng, L., Zhu, D., Liu, J., et al. (2023). Progress and prospect of natural gas exploration and research in deep and ultra-deep strata. J. Petroleum Sci. Bull. 04, 461–474. doi:10.3969/j.issn.2096-1693.2023.04.035
Han, J., Mei, L., Yang, H., Wu, G., Yu, H., Guo, D., et al. (2008). Hydrocarbon accumulation mechanism of large-Sized reef-Shoal complex condensate gas field in Tazhong No.1 slope-Break Zone, Tarim Basin. J. XINJIANG Pet. Geol. 03 (29), 323–326.
Hantschel, T., and Kaurauf, A. (2009). Fundamentals of basin and petroleum systems modeling. New York: Springer, 1–485.
Jia, A., Yan, H., Tang, H., Wang, Z., and Liu, Q. (2024). Key technologies and countermeasures for deep and ultra-deep gas reservoir development in China. J. Nat. Gas. Ind. 44 (1), 119–127. doi:10.3787/j.issn.1000-0976.2024.01.011
Jia, C., and Zhang, S. (2023). The formation of marine ultra-deep petroleum in China. J. Acta Geol. Sin. 97 (9), 2775–2801. doi:10.19762/j/cnki.dizhixuebao.2023201
Li, D., Chang, J., Qiu, N., and Xiong, Y. (2023). Thermal analysis of ultra-deep layers and its influence on reservoir utilization in platform area, Tarim Basin. Earth Sci. Front. 30 (6), 135–149. doi:10.13745/j.esf.sf.2023.2.25
Li, F., Zhu, G., Lv, X., Zhang, Z., Wu, Z., Xue, N., et al. (2021). The disputes on the source of Paleozoic marine oil and gas and the determination of the Cambrian system as the main source rocks in Tarim Basin[J]. Acta Pet. Sin. 42 (11), 1417–1436. doi:10.7623/syxb202111002
Li, Y., Xue, Z., Cheng, Z., Jiang, H., and Wang, R. (2020). Progress and development directions of deep oil and gas exploration and development in China. J. China Pet. Explor. 25 (01), 45–57. doi:10.3969/j.issn.1672-7703.2020.01.005
Lin, T., Wang, T., Li, Z., Yuan, W., Ma, W., Xu, Z., et al. (2021). Hydrocarbon filling evolution and exploration direction of the middle-lower Cambrian interval in Tazhong area, Tarim Basin. J. J. China Univ. Petroleum Ed. Nat. Sci. 45 (3), 42–54. doi:10.3969/j.issn.1673-5005.2021.03.005
Liu, B., Gao, S., Mohammadian, E., Hadavimoghaddam, F., Tian, S., Xu, Y., et al. (2022). Comprehensive outlook into critical roles of Pressure, Volume, and Temperature (PVT) and phase behavior on the Exploration and development of shale oil. J. Energy Fuels 36 (24), 14534–14553. doi:10.1021/acs.energyfuels.2c02842
Lu, X. X., Jin, Z. J., Liu, L. F., Xu, S. L., Zhou, X. Y., Pi, X. J., et al. (2004). Oil and gas accumulations in the Ordovician carbonates in the Tazhong Uplift of Tarim Basin, west China. J. Pet. Sci. Eng. 41, 109–121. doi:10.1016/s0920-4105(03)00147-5
Luo, M., Pan, H., Zhao, Y., Zhang, H., and Zhou, F. (2008). Natural radioactivity logs and interpretation from the CCSD Main Hole. J. Earth Science—Journal China Univ. Geosciences (05), 661–671.
Lv, H., Geng, F., and Shang, K. (2022). Key factors and directions of exploration in the Cambrian pre-salt sequence, Tarim Basin. J. Oil Gas Geol. 43 (05), 1049–1058. doi:10.11743/ogg20220504
Pang, X., Zhou, X., Li, Z., Wang, Z., and Jiang, Z. (2011). A model for controlling hydrocarbon and predicting favorable exploration zones of the Tazhong palaeouplift in Tarim Basin, NW China. J. Acta Pet. Sin. 32 (02), 189–198.
Peng, D., and Robinson, D. (1976). A new two-constant equation of state. J. Industrial Eng. Chem. Fundam. 15 (1), 59–64. doi:10.1021/i160057a011
Qi, L., Li, Z., Lyu, H., Yang, Z., Jiang, H., Yang, L., et al. (2020). Tectonic sedimentary evolution and oil and gas exploration in the Tarim superimposed Basin. Beijing: Science Press, 1–350.
Qiu, N., Chang, J., Feng, Q., Zeng, S., Liu, X., Li, H., et al. (2023). Maturation history of deep and ultra-deep source rocks, central and western basins, China. J. Earth Sci. Front. 30 (6), 199–212. doi:10.13745/j.esf.sf.2023.2.37
Song, D., Wang, T., and Li, M. (2016). Geochemistry and possible origin of the hydrocarbons from wells Zhongshen1 and Zhongshen1C, Tazhong uplift. J. Sci. China Earth Sci. 46, 840–850. doi:10.1007/s11430-015-5226-z
Tan, J., Horsfield, B., Mahlstedt, N., Zhang, J., di Primio, R., Vu, T., et al. (2013). Physical properties of petroleum formed during maturation of Lower Cambrian shale in the upper Yangtze Platform, South China, as inferred from PhaseKinetics modelling. J. Mar. Petroleum Geol. 48, 47–56. doi:10.1016/j.marpetgeo.2013.07.013
Wang, F., Zhang, S., Zhang, B., Xiao, Z., and Liu, C. (2003). Maturity and its history of Cambrian marine source rocks in the Tarim Basin. J. Geochim. 32 (05), 461–468. doi:10.19700/j.0379-1726.2003.05.007
Wang, T. G., Dai, F. F., Zhang, W. B., Qiu, N. S., and Wang, G. L. (2010). Stratigraphic thermohistory and its implications for regional geoevolution in the Tarim Basin, NW China. J. Sci. China Earth. 53, 1495–1505. doi:10.1007/s11430-010-4069-x
Wygrala, B. (1989). Integrated study of an oil field in the southern Po basin, northern Italy (No.FZJ-2014-03033). Publikationen vor 200.
Xiong, R., Zhou, J., Ni, X., Zhu, Y., and Chen, Y. (2015). Distribution prediction of Lower Cambrian Yuertusi Formation source rocks and its significance to oil and gas exploration in the Tarim Basin. J. Nat. Gas. Ind. 35 (10), 49–56. doi:10.3787/j.issn.1000-0976.2015.10.006
Xu, Z., Chen, S., Luo, C., Yang, G., Xu, S., Hu, F., et al. (2023). Distribution and sealing capacity evaluation of gypsum-salt rocks in the Middle Cambrian in Tarim Basin. J. China Pet. Explor. 28 (5), 54–67. doi:10.3969/j.issn.1672-7703.2023.05.005
Yang, H., Chen, Y., Tian, J., Du, J., Zhu, Y., Li, H., et al. (2020a). Great discovery and its significance of ultra-deep oil and gas exploration in well Luntan-1 of the Tarim Basin. J. China Pet. Explor. 25 (02), 62–72. doi:10.3969/j.issn.1672-7703.2020.02.007
Yang, H., Wu, G., Han, J., Wang, X., and Ji, Y. (2007). Characteristics of hydrocarbon enrichment along the Ordovician carbonate Platform margin in the central uplift of Tarim Basin. J. Acta Pet. Sin. (04), 26–30.
Yang, H., Yu, S., Zhang, H., Li, T., Fan, S., Cheng, B., et al. (2020b). Geochemical characteristics of Lower Cambrian sources rocks from the deepest drilling of Well LT-1 and their significance to deep oil gas exploration of the Lower Paleozoic system in the Tarim Basin. J. Geochim. 49 (06), 666–682. doi:10.19700/j.0379-1726.2021.01.017
Yang, H. J., Li, Y. J., Ma, D. B., Wei, H. X., Li, H. F., Luo, C. M., et al. (2022). The Mid-Paleozoic extensional structures revealed in the eastern Tarim Basin and their geological significance. Chin. J. Geol. 57 (3), 633–652. doi:10.12017/dzkx.2022.037
Yang, X., Tian, J., Wang, Q., Li, Y., Yang, H., Li, J., et al. (2021). Geological understanding and favorable exploration fields of ultra-deep formations in Tarim Basin. J. China Pet. Explor. 26 (4), 17–28. doi:10.3969/j.issn.1672-7703.2021.04.002
Yi, S., Li, M., Guo, X., Yang, F., Miao, W., Lin, S., et al. (2019). Breakthrough direction of Cambrian pre-salt exploration fields in Tarim Basin. J. Acta Pet. Sin. 40 (11), 1281–1295. doi:10.7623/syxb201911001
Zhang, J., Wang, Z., Yang, H., Xu, Z., Xiao, Z., and Li, Z. (2017). Origin and differential accumulation of hydrocarbons in Cambrian sub-salt dolomite reservoirs in Zhongshen Area, Tarim Basin, NW China. J. Petroleum Explor. Dev. 44 (1), 40–47. doi:10.1016/s1876-3804(17)30006-x
Zhang, Z., Li, M., and Liu, S. (2002). Generation and evolution of Tazhong low uplift. J. Petroleum Explor. Dev. 29 (01), 28–31.
Zhu, G., Chen, F., Chen, Z., Zhang, Y., Xing, X., Tao, X., et al. (2016). Discovery and basic characteristics of the high-quality source rocks of the Cambrian Yuertusi Formation in Tarim Basin. J. Nat. Gas. Geosci. 27 (1), 8–21. doi:10.11764/j.issn.1672-1926.2016.01.0008
Zhu, H., Huang, C., Ju, Y., Bu, H., Li, X., Yang, M., et al. (2021). Multi-scale multi-dimensional characterization of clay-hosted pore networks of shale using FIBSEM, TEM, and X-ray micro-tomography: implications for methane storage and migration. J. Appl. Clay Sci. 213, 106239. doi:10.1016/j.clay.2021.106239
Keywords: Tarim Basin, Tazhong area, lower Cambrian, phase simulation, basin modeling
Citation: Luo X, Yang C, Zhao Q, Cheng M, Zhang K, Su J and Li D (2024) Simulation of lower Cambrian oil and gas generation and phase evolution process in ZH1 of Tazhong area. Front. Earth Sci. 12:1430820. doi: 10.3389/feart.2024.1430820
Received: 10 May 2024; Accepted: 12 June 2024;
Published: 10 July 2024.
Edited by:
Hongjian Zhu, Yanshan University, ChinaReviewed by:
Chao Li, Chinese Academy of Sciences (CAS), ChinaAli Raza, University of Houston, United States
Zhang Youzhi, North China University of Science and Technology, China
Copyright © 2024 Luo, Yang, Zhao, Cheng, Zhang, Su, and Li. This is an open-access article distributed under the terms of the Creative Commons Attribution License (CC BY). The use, distribution or reproduction in other forums is permitted, provided the original author(s) and the copyright owner(s) are credited and that the original publication in this journal is cited, in accordance with accepted academic practice. No use, distribution or reproduction is permitted which does not comply with these terms.
*Correspondence: Chunlong Yang, eWFuZ2NodW5sb25nNjlAcGV0cm9jaGluYS5jb20uY24=; Dengke Li, bGlkazE5OTkwN0AxNjMuY29t