 Guogen Xie
 Guoliang Xie
 Kun Jiao
- 1School of Mathematics and Computer, Tongling University, Tongling, Anhui, China
- 2School of Civil Engineering and Architecture, Tongling University, Tongling, Anhui, China
- 3State Key Laboratory of Oil and Gas Reservoir Geology and Exploration (Chengdu University of Technology), Chengdu, China
The heterogeneity of pore system of deep shale reservoir determines the occurrence, enrichment and migration behavior of shale gas within shales. In this study, multi-fractal analysis was applied to analyze CO2 and N2 adsorption data for obtaining multi-fractal parameters including Hurst index and multi-fractal spectrum (D5--D5+) of the deep Wufeng-Longmaxi shales collected from the Sichuan Basin, China, in order to study the connectivity and heterogeneity of micropore pores and meso-macropores as well as their influencing factors. The results showed that pore system of the Wufeng-Longmaxi deep shale exhibits distinct multifractal nature. There exists significant differences in the pore volume (PV) of micropores (<2 nm), mesopore (2–50 nm), and macropore (>50 nm) across different shale lithofacies due to their differences in TOC content and mineral composition. The heterogeneity and connectivity of micropores and meso-macropores within deep shales in the Sichuan Basin are controlled by multiple factors including shale lithofacies, burial depth, and pressure coefficients. Notably, siliceous shale (SL) and calcareous/argillaecous siliceous shale (C/ASL), known as sweet spot for current shale gas exploitation, exhibits characteristics such as relative low micropore connectivity, high micropore heterogeneity, high micropore PV and low meso-macropore connectivity. These suggest that isolated pressure-sealing compartment is easier formed within the overpressured SL and C/ASL. Thus, pressure in these shales is less likely to release during the Yanshanian-Xishanian tectonic uplift process, favoring the preservation of organic matter (OM) pores and residual interparticle pores, which is conducive to the accumulation of deep shale gas dominated by free gas.
1 Introduction
By the end of 2022, China’s shale gas production reached 24 billion cubic meters, accounting for 80.4% of the targeted goal outlined in the “Shale Gas Development Plan (2016–2020)”. This implies the imperative to further improve shale gas production to meet China’s increasing energy demands and to support the “Gas Daqing” project in the Sichuan Basin (Guo et al., 2022; Yun, 2023). The demand for expanding shale gas reserves and production propels the exploration and development of deep shale gas, basin margin shale gas, and other potential shale gas formations (Li et al., 2014; Ma et al., 2018; Xu et al., 2019; Zou et al., 2021; Nie et al., 2022; He et al., 2023; Li et al., 2023; Yun, 2023; Zhao et al., 2023; Shan et al., 2024). In current, a high proportion of organic-rich marine shale in the southern Sichuan Basin is buried at deep (3,500–6,000 m burial depth) or ultra-deep (>6,000 m burial depth) (Nie et al., 2022). Shale gas resources with burial depths exceeding 3,500 m constitute over 60% of the total shale gas resources in the southern Sichuan Basin (He et al., 2019; 2020).
Shale gas primarily occurs as adsorbed gas and free gas within the pores and fractures of shale reservoirs (Curtis et al., 2012). The occurrence of shale gas and its relative proportions closely correlate with the pore structure of shale reservoirs (Clarkson et al., 2013; Teng et al., 2022; Zhang et al., 2023). Various methods have been employed to characterize the pore structures of shale reservoirs, including image analysis techniques such as high-resolution microscopy, scanning electron microscopy (SEM), transmission electron microscopy (TEM) (Bernard et al., 2012; Chalmers et al., 2012; Loucks et al., 2012), fluid injection methods like low-pressure nitrogen (N2), carbon dioxide (CO2), argon adsorption (Ar), and high-pressure mercury injection (Jiao et al., 2018; Wang et al., 2020), as well as non-intrusive methods including nuclear magnetic resonance (NMR), computed tomography imaging technology (CTIT), small-angle X-ray scattering (SAXS), small-angle neutron scattering (SANS), and ultra-small-angle neutron scattering (USANS) (Clarkson et al., 2013; Okolo et al., 2015; Liu et al., 2019; Wang et al., 2019; Wang et al., 2021; Zhang et al., 2023). These multi-scale techniques enable both qualitative and quantitative characterization of pore structures of shale reservoir. Unlike shallow shale gas, deep shale gas primarily exists in a supercritical state, with free gas highly concentrated in the shale reservoir under high-pressure to super-pressure conditions (Guo et al., 2022). Consequently, the preservation conditions of deep shale gas are notably superior to those of shallow shale gas, conductive for shale gas enrichment (Ma et al., 2018; Guo et al., 2022; Tang et al., 2024). Given the distinct pore structure characteristics of deep shale reservoirs and their complex gas accumulation mechanisms, it is imperative to comprehensively employ multiple techniques for precise characterization of these shales.
Fractal theory, renowned for its ability to elucidate the complexity and heterogeneous of pore systems within porous materials, has gained widespread application in investigating the pore structure characteristics of shale reservoirs (Liu and Ostadhassan, 2017; Liu et al., 2019). Through SEM images and gas adsorption data, fractal theory has revealed the fractal nature of the pore systems within shale reservoirs, establishing a correlation between fractal parameters and pore structure (Wang et al., 2018), which provides new perspective for studying the complexity of pore systems of shale reservoirs. Given the diverse scales of pores within deep shale reservoirs, spanning nano-to micro-to millimeter, the pore structures exhibit exceptional complexity (Nie et al., 2022; Zheng et al., 2024). Yet, previous studies have been deficient in quantitatively assessing the heterogeneity and connectivity of these pores within deep shale reservoirs.
In this study, we focused on the deep overpressured organic-rich shale from the Wufeng-Longmaxi Formation in the Dazu gas block in the southern Sichuan Basin, and TOC content analysis, FE-SEM observation, low-pressure CO2 and N2 adsorption were also conducted. Moreover, the box-counting fractal analysis method was used to quantitatively characterize the multi-fractal nature of pore system within deep shale reservoirs. Additionally, we selected superdeeply (>6,000 m) overpressured Wufeng-Longmaxi shales from well C-1 in the northern Sichuan Basin and deep normal-pressured Wufeng-Longmaxi shale from well N-1 in the southern Sichuan Basin for comparative analysis. This allows us to explore the relationships between shale burial depth, shale lithofacies, formation pressure, and multi-fractal parameters. The purpose of our study is to provide a reference for optimizing shale gas favorable areas in the exploration of deep shale gas in the southern Sichuan Basin.
2 Geological background
The Sichuan Basin, situated on the northwest margin of the Yangtze Platform, is bordered by the Qiyue mountain to the southeast, the Songpan-Ganzi orogenic belt to the west, and the Qinling orogenic belt to the north (Figure 1), covering an area of approximately 180,000 km2. It experienced multiple stages of tectonic evolution, including the formation stage of metamorphic and crystalline basement in the Pre-Sinian, the passive continental margin stage from the Sinian to the Middle Triassic, the stage of basin-mountain conversion and formation of composite foreland basin under the background of tectonic compression since the Late Triassic, and the stage of uplift and fold transformation since the Cenozoic (Liu et al., 2021). According to the topography between the Sichuan Basin and its surrounding orogenic belts, as well as the deep and frontal structural characteristics and dynamic formation mechanisms of the basin, the basin-mountain structure is categorized into five types (Liu et al., 2021): linearly abrupt margin-plate systems in the northern (I) and western (II) sectors, diffusely gradual interior-plate systems in the eastern (III) and southwestern (IV) sectors, and the uplift-basin region in the central sector (V). The southern Sichuan Basin typically refers to the area south of the Weiyuan structure, including blocks like Weiyuan, Yongchuan, Changning, and Dingshan.
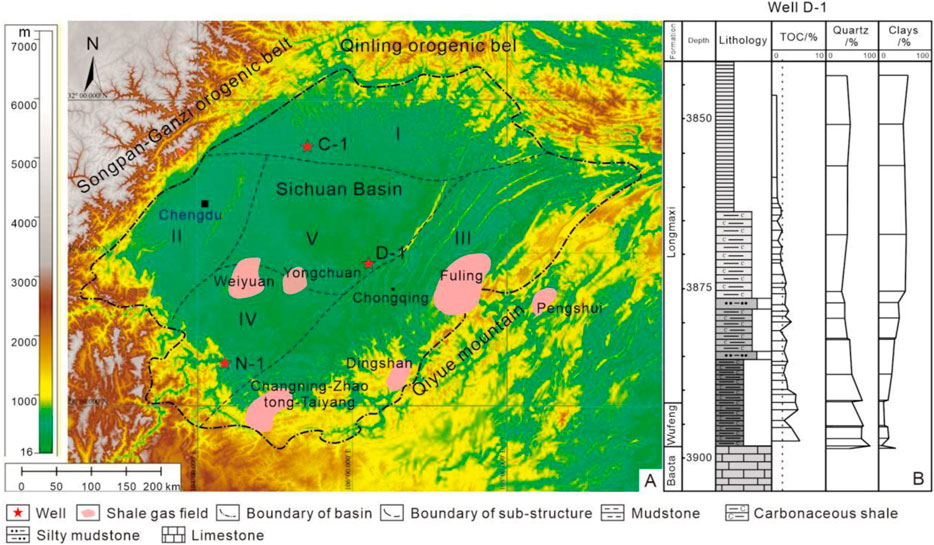
Figure 1. (A). The location of sampling well and the column chart of well Z-1, modified from Liu et al. (2024). (B). Column chart of well Z-1.
Currently, the primary interval for deep shale gas exploitation in the southern Sichuan Basin is predominantly concentrated in the upper Wufeng Formation and the lower Longmaxi Formation. These intervals primarily comprise black carbonaceous siliceous shale and carbonaceous shale deposited in deep-water shelf facies, characterized by richness in graptolite and TOC content. Deep shale reservoir in the southern Sichuan Basin exhibits a high degree of thermal evolution, with equivalent vitrinite reflectance (ERO) ranging from approximately 2.0%–3.0%, indicative of over-mature dry gas generation. The roof of the target interval of shale gas exploitation in southern Sichuan Basin is gray silty mudstone and argillaceous siltstone from the upper part of the Longmaxi Formation, while its underlying floor consists of dark gray nodular limestone from the Ordovician Baota Formation or Linxiang Formation. These strata are typically compacted, exhibiting poor physical properties (low porosity and permeability) and high breakdown pressure, offering favorable roof and floor seal conditions (Ma et al., 2018). Pressure coefficient of shale reservoirs is closely related to their preservation conditions, with a high pressure coefficient (>1.2) generally indicating good preservation conditions for shale gas (Gao et al., 2019; Ma et al., 2020). For instance, well D-1 in the Dazu block exhibits a pressure coefficient of 1.86, yielding gas production of 49,000 cubic meters per day and 456,700 cubic meters per day after straight well fracturing and horizontal well fracturing, respectively. In contrast, well N-1 in the Yuxi block, exhibits a pressure coefficient of 1.05, with gas production reaching only 700–800 cubic meters per day after straight well fracturing. Another comparative well, C-1, situated in the northern slope zone of the northern Sichuan Basin, shows a pressure coefficient ranging from 1.77 to 1.89, exhibiting obvious gas indications.
3 Samples and methods
3.1 Samples
A total of thirty-five samples of organic-rich shale were collected from two representative deep wells (D-1 and N-1) in the southern Sichuan Basin, as well as an ultra-deep well (C-1) in the northern Sichuan Basin. These samples were conducted a series of analyses, including TOC analysis, mineral composition analysis, optical microscopy observation, FE-SEM observation, and low-pressure CO2 and N2 adsorption. Table 1 shows detailed information on these samples, including depth, TOC content, and lithofacies. To preserve sample freshness, all samples were securely wrapped in plastic bags to prevent weathering.
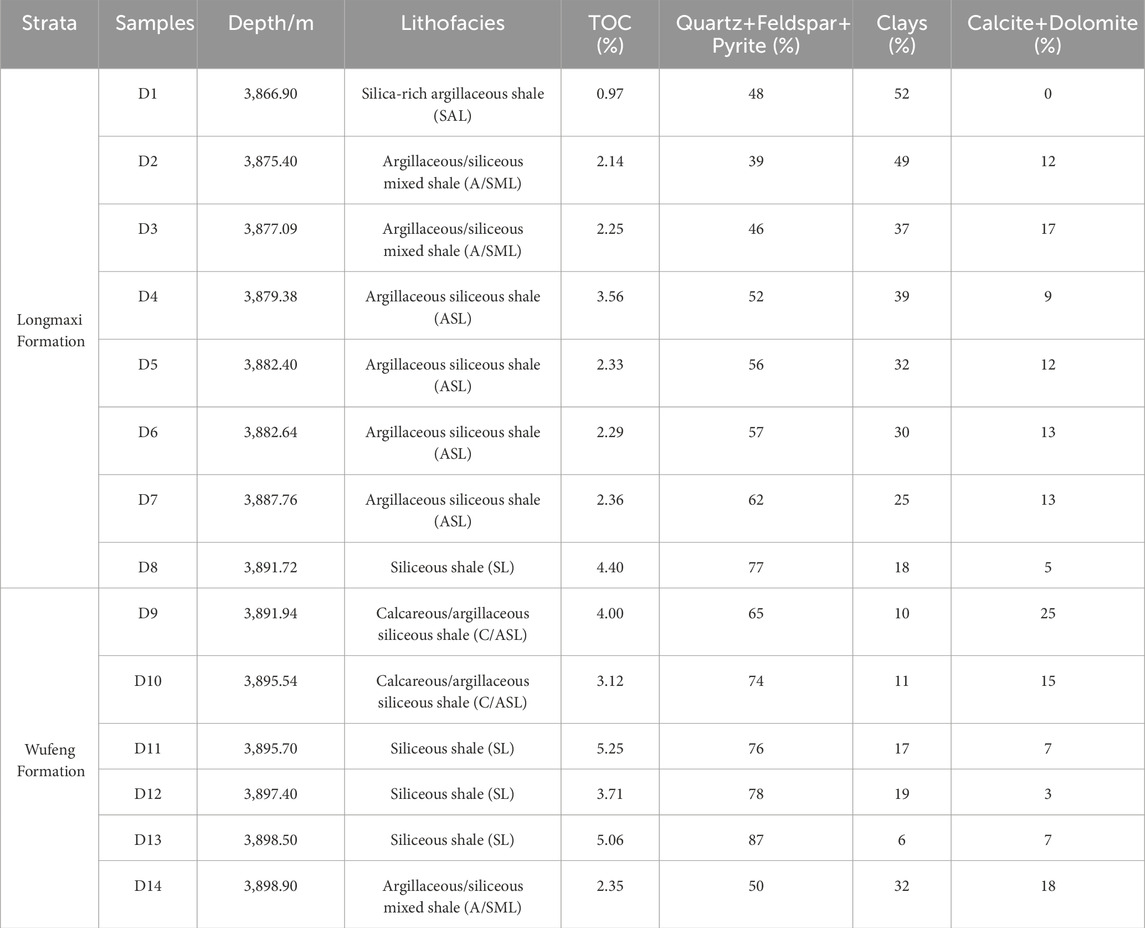
Table 1. The detailed information of shale samples from well D-1.
3.2 Methods
3.2.1 TOC analysis
TOC content serves as a vital parameter in assessing the OM abundance of shale, thereby influencing its potential for hydrocarbon generation. Shale powder samples, with a particle size of 200 mesh and a weight ranging from 0.1 to 0.5 g, was treated with a diluted HCl solution in a volume ratio of 1:7 to remove inorganic carbon. Subsequently, these samples were dried in an oven at 60°C–80°C and combusted in a high-temperature oxygen flow to determine the amount of carbon dioxide by using infrared detectors. The TOC analysis was conducted at the Keyuan Engineering Technology Testing Center of Sichuan Province.
3.2.2 Mineral composition analysis
Mineral composition analysis was conducted using the X'Pert PRO DY2198 X-ray diffractometer, following the SY/T6201-1996 standard. Approximately 1–2 g of 200-mesh powder samples were analyzed under following conditions: tube voltage of 35 kV, tube current of 30 mA, Cu target radiation source (λ = 1.54 Å), scanning range of 2θ = 5°–80°, and scanning speed of 2°/min.
3.2.3 FE-SEM observation
Before observation, shale samples were first treated into a rectangular block of 8 mm × 8 mm × 3 mm, and were then ground using ultra-thin diamond sandpaper with particle sizes ranging from 30 μm to 0.1 μm to achieve a smooth surface. Subsequently, the surface was further polished using an argon ion polishing machine (Hitachi IM 4000) under vacuum conditions, making it exceptionally smooth. The argon ion polishing process was set to 120 min, which can effectively avoid damage to the sample surface caused by mechanical polishing, and reveal the true pore morphology of shale. Following argon ion polishing, high-resolution pore images of the shale samples were captured using secondary electron microscopy.
3.2.4 Low pressure CO2 and N2 adsorption
Low pressure gas adsorption (CO2, N2, and Ar) experiment is utilized for determining pore structure parameters such as PV, specific surface area (SSA) and pore size distribution (PSD) of shale samples. In this study, low-pressure N2 adsorption experiment was performed using the Quadrasorb SI analyzer at the State Key Laboratory of Oil and Gas Reservoir Geology and Exploitation, Chengdu University of Technology, China. First, 1–2 g of shale samples with a particle size of 60–80 mesh were degassed under Flovac Degasser for over 10 h at 80°C to eliminate moisture. Subsequently, the N2 adsorption experiment was conducted at a temperature of 77.3 K, and adsorption capacity was measured by increasing the pressure to reach N2 saturation vapor pressure and then decreasing it at various relative pressures (P/P0 = 0.01–0.99). In theory, the pore size detected by N2 adsorption ranges from 0.33–200 nm (Jiao et al., 2018). For low-pressure CO2 adsorption, the sample was degassed for more than 10 h and then subjected to a temperature of 273.15 K and relative pressures (P/P0) of 4 × 10⁻⁴ to 3 × 10⁻² to obtain CO2 adsorption isotherms. In theory, CO2 adsorption can characterize the pore structures of pore sizes ranging from 0.3 nm to 2 nm (Wei et al., 2016; Tong et al., 2022).
3.2.5 Multi-fractal analysis
The fractal theory, proposed by Mandelbrot in 1975, was widely applied to assess the pore structure of porous media such as coal and shale reservoirs (Mandelbrot, 1975; Zheng et al., 2022). Unlike monofractals, which are characterized by a single-dimensional fractal dimension, the pore structure of deep shale reservoirs exhibits exceptional complexity, necessitating characterization through multiple dimensions. Multi-fractal, also referred to as fractal measures, serve as vital tools for describing the pore structure of complex porous media, which can characterize the distribution of a physical quantity.
The sequence of PSD of shale samples {xi} was determined using CO2 and N2 adsorption data. The pore size range ε is artificially defined, dividing the sequence {xi} into N subsets of length ε. Then, the probability distribution function {Pi(ε)} of the N subsets in the sequence {xi} is calculated. If the PSD of the shale reservoir exhibits multi-fractal nature, the probability distribution function {Pi(ε)} exhibits the following relationship with ε.
where ε refers to the singularity exponent.
The number of subsets within the N subsets exhibiting the same probability size is represented as Nα(ε). As ε decreases, Nα(ε) increases, which corresponds to the following relationship:
where f(a) represents the frequency of subsets represented by α among all subsets.
The partition function is defined as follows:
Where τ(q) represents the mass exponent.
Taking the logarithm of both sides of the equation yields:
By applying the Legendre transformation to the above equation, a and f(a) are obtained.
The generalized dimension Dq can be defined as follows:
The curves of a and f(a) can reflect the heterogeneity of PSD. Here, amin referss to pores with larger volume (micropore), while amax represents pores with smaller volume (meso-macropore). The difference Δa = amax - amin, reflects the extent of variation among the pores. Similarly, Δf = f(amax) - f(amin) reflects the relative proportion of meso-macropore to micropore. Thus, a positive Δf indicates the dominance of meso-macropore. The curve D(q) versus q provides insights into the fractal characteristics of different pores.
4 Results
4.1 Mineralogical and geochemical characteristics
The TOC content of deep shales collected from well D-1 varies between 0.97% and 5.25%, averaging at 3.13%. Specifically, shale samples from the Wufeng Formation exhibit a notably higher TOC content in comparison to those from the Longmaxi Formation, with their values ranging from 2.35% to 5.25% (average 3.98%) and 0.97%–4.4% (average 2.54%), respectively. The TOC content from well D-1 shows an increasing trend with increasing burial depth (Figure 1), consistent with previous studies (e.g., Guo et al., 2017).
The deep shales from well D-1 predominantly consist of quartz and clay minerals. As buried depth increases, there is a general trend of rising quartz content, as well as a decrease in clay minerals content (Figure 1). In well D-1, the quartz content ranges from 29% to 82% (averaging at 51.36%), while the clay mineral content ranges from 6% to 52% (averaging at 26.93%). Compared to shallow - moderate buried shale from well JY-1 in the Fuling Block (Guo et al., 2017), shales from well D-1 exhibit relatively higher quartz content and lower clay mineral content. Increased silica content plays a beneficial role in establishing a rigid framework within the shale reservoir, thus protecting the pores from compaction (Cai et al., 2022). Following the lithofacies classification proposed by Loucks et al. (2012), shale samples from well D-1 can be categorized into five sub-lithofacies types (Figure 2).
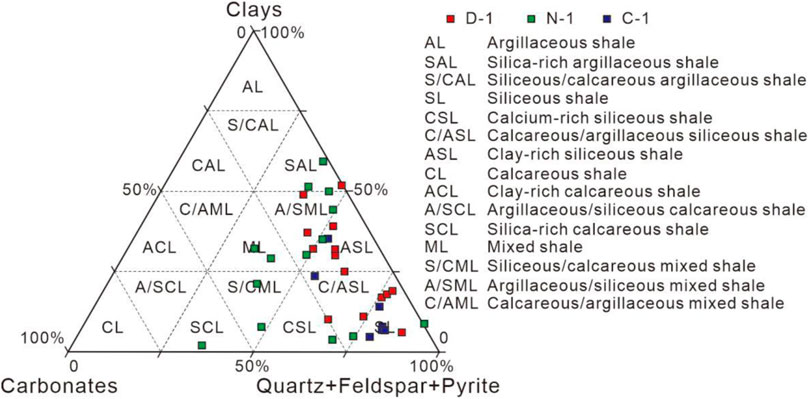
Figure 2. Ternary diagram showing the mineral composition of shale samples.
Significant differences in TOC content are observed among different shale lithofacies (Table 1). SAL exhibits the lowest TOC content at 0.97%, whereas SL exhibits the highest TOC content at 4.60%. The descending order of the TOC content is observed in SL (average 4.60%), C/ASL (average 3.56%), A/SML (2.25%), ASL (average 2.63%), and SAL (average 0.97%). Additionally, the quartz content and TOC content demonstrate a noteworthy consistency, displaying a synergistic increase. This covariant relationship may be related to the presence of siliceous organisms like radiolaria and diatoms within the Wufeng Formation-Longmaxi shale (Xi et al., 2019). In well D-1, the ERo ranges from 2.2% to 2.45%, averaging at 2.33%, suggesting that these shales are at stage of overmature, showing excellent potential for oil and gas exploration.
4.2 Pore morphology characteristics
Deep shale reservoirs within well D-1 show complex pore network, including OM pores, interparticle pores, and intraparticle pores. OM pores are very common in these samples, especially for the silica-rich shale such as C/ASL and SL. In C/ASL and SL, OM pores are well developed between rigid minerals (Figure 3A), whereas they are poor between clay minerals (Figure 3B). This indicates that rigid minerals promote the development of OM pores, consistent with previous study (Wang, 2020), which suggested that the location and extent of OM pores are closely related to the abundance, type, and distribution of OM. As a comparison, A/SML exhibits poor-developed OM pores (Figure 3C).
Figure 3. SEM secondary electrons images of shales from well D-1. (A). OM pores are well developed between rigid minerals such as quartz in SL, indicating the protection effect of rigid minerals on OM pores, SL, sample D8, 3,891.94 m. (B). OM close to clay minerals contains moderate-developed pores, C/ASL, sample D9, 3,891.94 m. (C). Poor-developed pores are observed in OM surrounded by clay minerals, A/SML, sample D3, 3,877.09 m. (D). Intraparticle pores are observed in pyrite framboid and calcite, resulting from dissolution, C/ASL, sample D9, 3,891.94 m. (E). Dissolution pores are observed in pyrite framboid, A/SML, sample D3, 3,877.09 m. (F). Interparticle pores are developed between rigid minerals such as quartz and feldspar, exhibiting linear and triangle shaped, C/ASL, sample D9, 3,891.94 m.
Intraparticle pores are also common in shales from well D-1. In A/SML, intraparticle pores are well developed in clay minerals (Figure 3C), differing from C/ASL and SL that interparticle pores distributed in clay minerals are moderate-developed, and dissolution pores associated with feldspar (Figure 3D) and pyrite framboid (Figure 3E) are developed. Interparticle pores in our samples are mainly distributed between rigid minerals, which is more common in C/ASL and SL. Interparticle pores generally exhibit linear and triangle shaped (Figure 3F), indicating intense compaction.
4.3 Pore structure characteristics
According to the DFT and BJH models, adsorption data from low-pressure CO2 and N2 adsorption was analyzed to obtain the PSD curve and pore structure parameters of shales (Table 2). Integration of the PSD curves in different pore size ranges, the variation curve of PV increment with pore size and the histogram of PV fraction for deep shale samples were obtained (Figure 4).
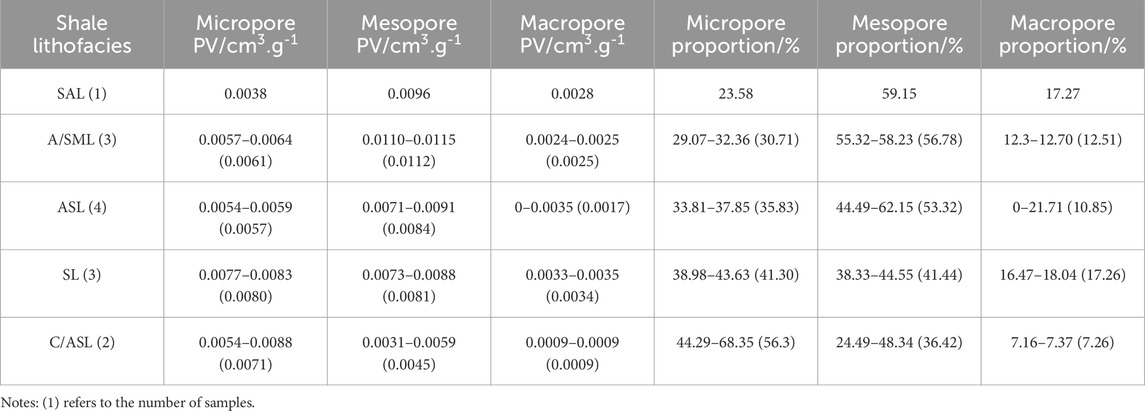
Table 2. Pore structure parameters of over-pressured deep shales of Wufeng-Longmaxi Formation from well D-1.
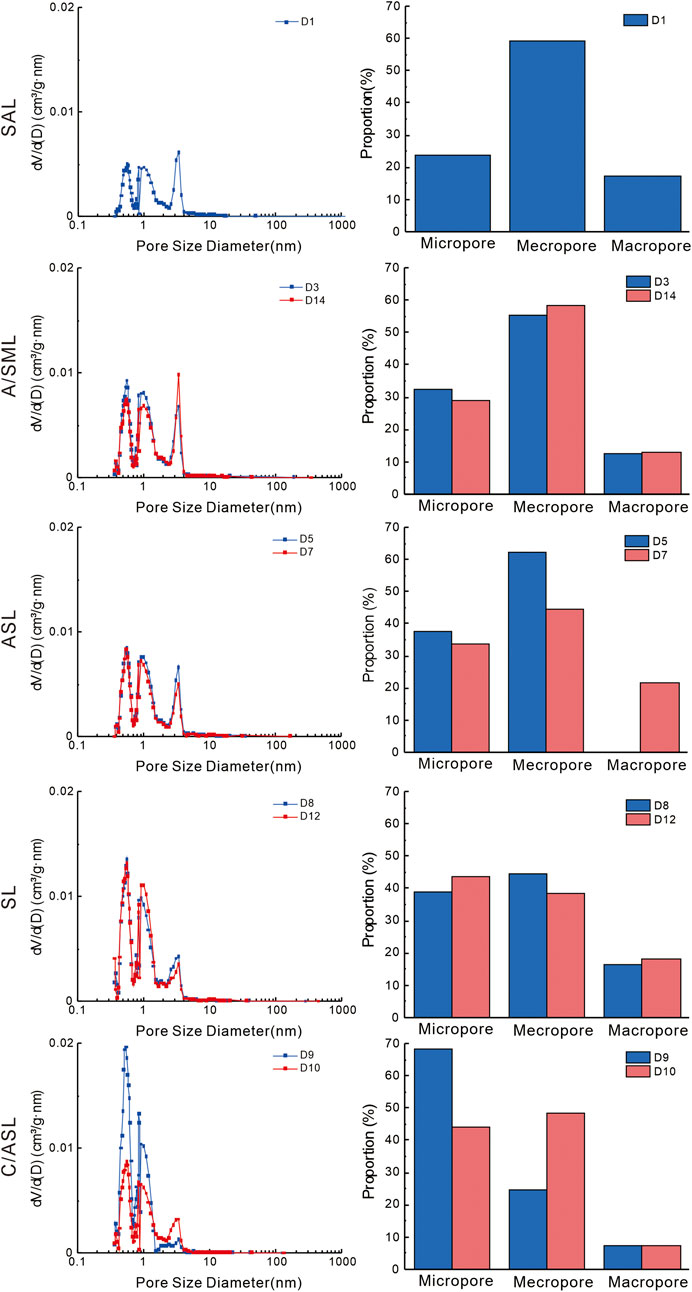
Figure 4. PSD and histogram of PV for over-pressured deep shale from Wufeng-Longmaxi Formation in well D-1.
Table 2 exhibits significant variations in pore structure parameters across different shale lithofacies, confirming the influence of shale lithofacies on the pore development within deep shales. Notably, SAL exhibits the smallest micropore PV (0.0038 cm3/g), while SL contains the largest micropore PV (0.0080 cm3/g) and macropore PV (0.0034 cm3/g). Analyzing the proportions of PV among different shale lithofacies reveals that C/ASL shows the highest proportion of micropores and the lowest proportion of macropores. In contrast, SAL has the smallest proportion of micropores and the largest proportion of mesopores. Across all shale lithofacies, micropores and mesopores collectively dominate the total PV, with mesopores contributing the majority (36.42%–59.15%, averaging at 49.42%), followed by micropores (23.58%–56.30%, averaging at 37.54%), and macropores constituting the smallest proportion (7.26%–17.7%, averaging at 13.03%). These findings reconfirm the complex relations between shale lithofacies and pore structures of deep shales.
4.4 Multi-fractal analysis
4.4.1 Micropore
According to the CO2 adsorption data, multi-fractal characteristics of micropores (<2 nm) of shales were analyzed. The results show a noticeable linear correlation between log u(q,ε) and logε for the samples from well D-1 (Figure 5A), indicating the multi-fractal nature of micropore distribution in these shales (Ferreiro et al., 2009). Specifically, when q < 0, a significant positive correlation between log u(q,ε) and logε is obtained, while for q > 0, a significant negative correlation between log u(q,ε) and logε is obtained. Furthermore, the fitting lines of log u(q,ε) and logε gradually converge, suggesting a relatively concentrated distribution of micropores within a narrower range of pore sizes (Ferreiro et al., 2009).
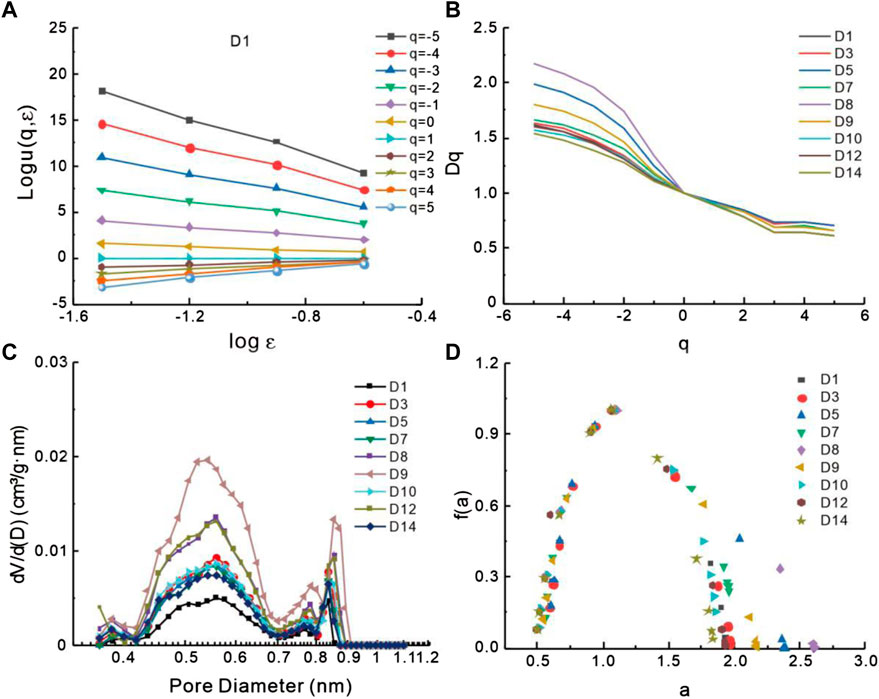
Figure 5. (A). Log-log plots of the partition function versus box scale of sample D1 from well D-1 from CO2 adsorption isotherms. (B). The correlation of Dq and q of shales from well D-1. (C). PSD of shales from the CO2 adsorption. (D). Multi-fractal singularity spectra f (a) for shales from the CO2 adsorption isotherms.
For all shale samples from well D-1, the generalized dimension D(q) exhibits a monotonic decrease as q increases (Figure 5B), with D0 > D1 > D2, indicative of the multi-fractal nature of micropore distribution in these samples. Here, D0 represents the singularity of non-empty boxes containing a specific porosity value within a continuous range of micropore ranges, regardless of the porosity probability within the box (Liu et al., 2019). Table 3 exhibits that all shale samples from well D-1 have the same D0 value (1.003). D1, representing entropy information, can be used to characterize the concentration of pore distribution within the micropore. Thus, D0-D1 can be used to represent the uniformity of pore distribution within a specific pore size range (Li et al., 2015; Song et al., 2018). The D0-D1 values of samples range from 0.076 to 0.130, averaging at 0.094, suggesting a relatively concentrated PSD within the micropores in these samples.
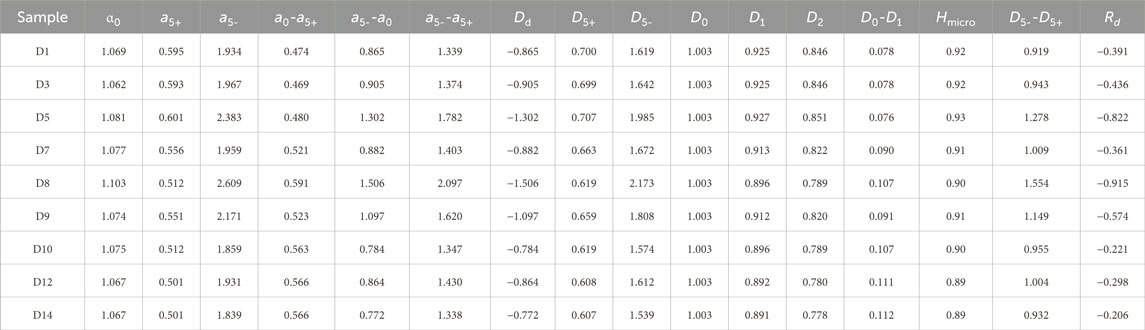
Table 3. Multi-fractal parameters of shale samples from well D-1 based on CO2 adsorption isotherms.
Examining the PSD curve (Figure 5C), micropores in the shale samples from well D-1 predominantly distribute within the ranges of 0.40–0.70 nm and 0.80–0.85 nm, further confirming the concentrated distribution within the micropore range. The H index, known as the Hurst index (H = (D2+1)/2), can characterize the pore connectivity (Holmes et al., 2017). The Hmicro values in samples from well D-1 range from 0.89 to 0.93, averaging at 0.91, indicating relative high micropore connectivity. Moreover, the multi-fractal spectrum (D5--D5+) can serve as a parameter for characterizing the heterogeneity of PSD within the pore size range (Liu et al., 2019). The (D5--D5+)micro values of samples range from 0.919 to 1.554, averaging at 1.083, indicating a high heterogeneity in PSD within the micropore range.
The singularity spectra f(a) and scaling exponent a of shale samples exhibit a clear asymmetry (Figure 5D), further confirming the multi-fractal nature of micropore distribution. The (a0)micro values range from 1.062 to 1.103, averaging at 1.075, exhibiting a relatively concentrated distribution of micropores within this range. Furthermore, the (a5--a5+)micro values, indicative of the degree of heterogeneity in pore distribution, range from 1.338 to 2.097, averaging at 1.526, showing significant internal disparities and high heterogeneity in PSD within the micropore range (Do and Do, 2003). The Rd value, calculated as Rd = ((a0-a5+) - (a5--a0)), reflects the deviation of the symmetry line of the f(a) spectrum, averaging at −0.469, suggesting that micropores in these shales are primarily concentrated within the high-probability region or the concentrated region of PSD.
4.4.2 Meso-macropore
According to the N2 adsorption data, the multi-fractal characteristics of meso-macropores (2–200 nm) were studied. It shows a clear positive linear relationship between log u(q,ε) and logε for all shale samples, with the fitting lines gradually closing each other (Figure 6A). The generalized dimension D(q) exhibits a monotonic decrease as q increases (Figure 6B), indicating the presence of multi-fractal nature in PSD within the meso-macropore range. Table 2 shows relative low values of D0-D1 (average 0.214) within meso-macropore range, reflecting a more uniform pore distribution, consistent with the PSD curve (Figure 6C). The Hmeso-macro values of the shale samples range from 0.74 to 0.86, with an average of 0.80, indicating relative low meso-macropore connectivity. The (D5--D5+)meso-macro values range from 0.806 to 1.547, with an average of 1.212, indicating high heterogeneity in PSD within the mesopore-macropore range. Moreover, the singularity spectra f(a) and scaling exponent a exhibits a clear asymmetry (Figure 6D), also confirming the multi-fractal nature of pore distribution within the meso-macropore range. The (a5--a5+)meso-macro values of the shale samples range from 0.950 to 2.029, with an average of 1.616, reflecting a high heterogeneity of pore distribution within the meso-macropore range. The average Rd value for the shale samples is 0.046, indicating that the pores within the meso-macropore range are mainly distributed in the lower-probability region or the sparse region of PSD.
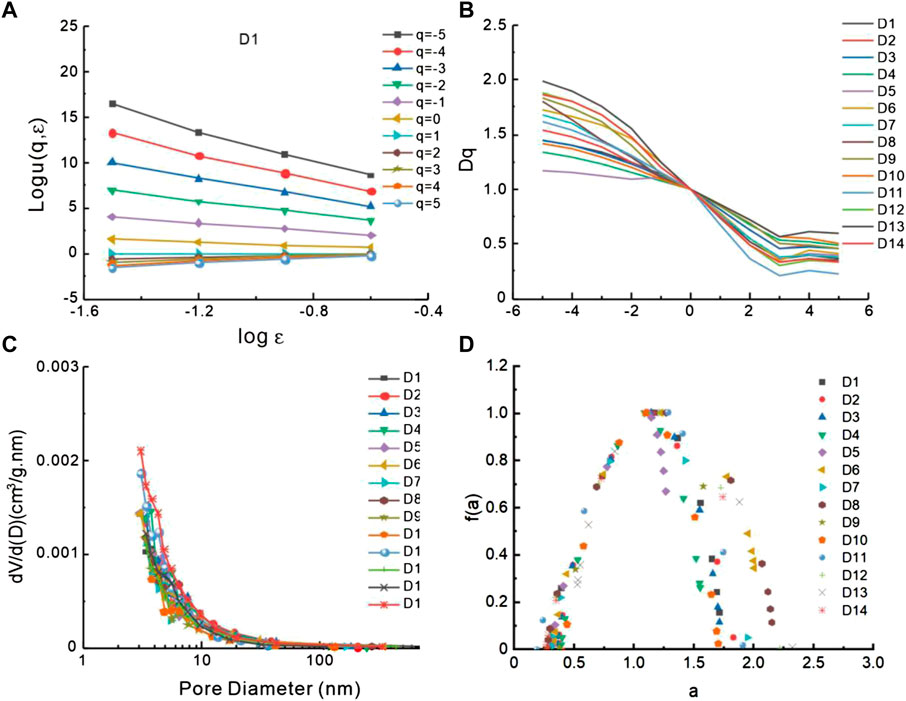
Figure 6. (A). Log-log plots of the partition function versus box scale of sample D1 from well D-1 from N2 adsorption isotherms. (B). The correlation of Dq and q of shales from well D-1. (C). PSD of shales from the N2 adsorption. (D). Multi-fractal singularity spectra f (a) for shales from the N2 adsorption isotherms.
5 Discussion
5.1 Factors influencing PV
Micropore and meso-macropore in different shale lithofacies exhibit significant differences in PV, emphasizing the role of TOC content and mineral composition in controlling PV of shale. The TOC content of shale samples exhibits a strong positive correlation with micropore PV (R2 = 0.78), while displaying a decreasing trend with meso-macropore PV (Figure 7A). The TOC content of shale can reflect the OM abundance. During thermal maturation, pores within the OM develop at the nano-micrometer scale (Curtis et al., 2012; Ma and Xie, 2018). Thus, OM pores existing in the form of meso-macropores are susceptible to be compacted during deep burial.
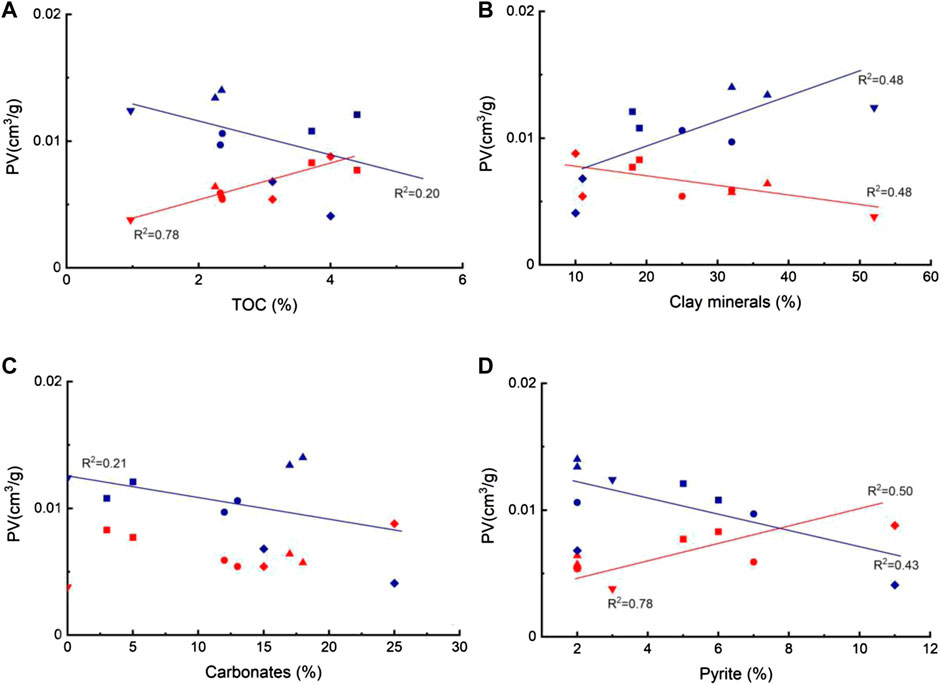
Figure 7. The relationship of micropores and meso-macropores PV and (A) TOC content, (B) clay minerals, (C) carbonates, and (D) pyrite contents of samples from well D-1. Lower triangle represents SAL, upper triangle refers to A/SML, circle refers to ASL, rectangle represents SL, and diamond represents C/ASL. Moreover, red represents micropore whereas blue refers to meso-macropores.
In addition to TOC content, the PV is also influenced by mineral composition of shale. Clay mineral content shows a good positive correlation with meso-macropore PV, while exhibiting a negative correlation with micropore PV (Figure 7B), which is supported by the SEM observation that pores associated with clays are mainly meso-macropores. Interestingly, shales with high carbonates content correspond to a notable decrease in mesopore PV, possibly indicating that the intense calcium cementation can block the pore throat, leading to a reduction in mesopores (Zheng Y. J. et al., 2022). The weak negative correlation between carbonates and meso-macropores PV may also prove it (Figure 7C). Notably, pyrite exhibits a significant effect on the PV of shale. Figure 7D reveals that as pyrite content increases, the micropore PV increases, while the meso-macropore PV exhibits an obvious decrease. In this study, pyrite in the shale is predominantly pyrite framboids and euhedral-subhedral pyrite (Figures 3D, E). Pyrite framboid is often associated with OM, in which a small amount of pores are developed. Euhedral-subhedral pyrite generally coexists with pyrite framboid or OM (Figure 3E), filling in inter-P pores, significantly reducing the meso-macropore PV.
5.2 Factors influencing the heterogeneity and connectivity
Tables 3, 4 demonstrate that micropore in the deep shales from well D-1 exhibits lower heterogeneity and higher connectivity compared to meso-macropore. There is no noticeable correlation between Hmicro and Hmeso-macro, and between (D5--D5+)micro and (D5--D5+)meso-macro, emphasizing the need for separate analyses of micropore and meso-macropore in shale reservoirs.
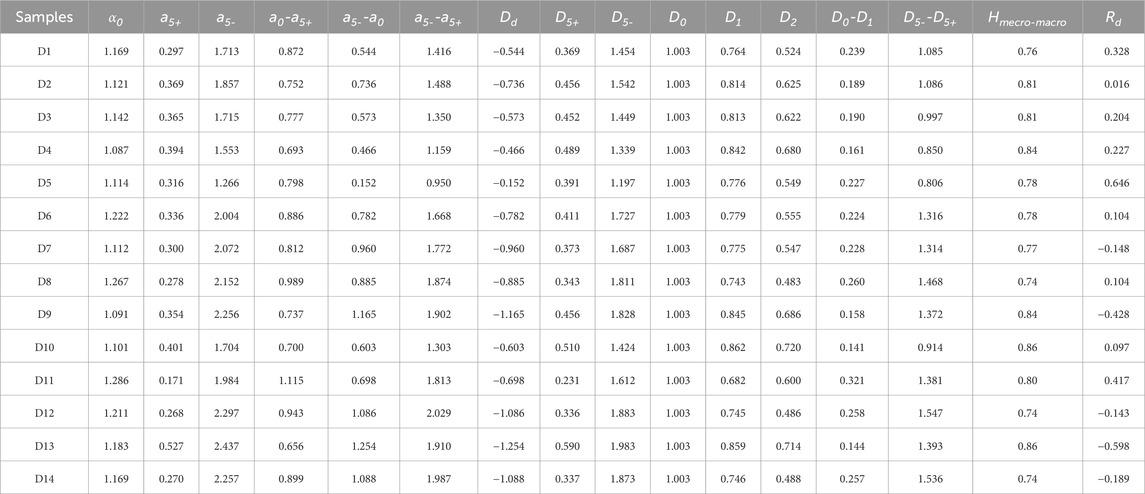
Table 4. Multi-fractal characteristics of shale samples from well D-1 from the N2 adsorption isotherms.
5.2.1 Mineral composition
Figure 8 illustrates the relationship between shale mineral composition and multi-fractal parameters. TOC is positively associated with Hmicro and inversely related to (D5--D5+)micro (Figures 8A, B), indicating that OM can increase micropore connectivity while reducing micropore heterogeneity, which is consistent with previous study that OM can generate a lot of micropores and mesopores during maturation (Wang et al., 2020; Teng et al., 2022). Quartz exhibits a negative correlation with (D5--D5+)micro (Figure 8C), suggesting a role in decreasing micropore heterogeneity, which is due to that silica in Wufeng-Longmaxi shale partially sources from biogenic silica (Xu et al., 2021). Moreover, clay minerals and feldspar show a positive correlation with (D5--D5+)micro (Figures 8D, E), suggesting an increase in micropore heterogeneity by these minerals.
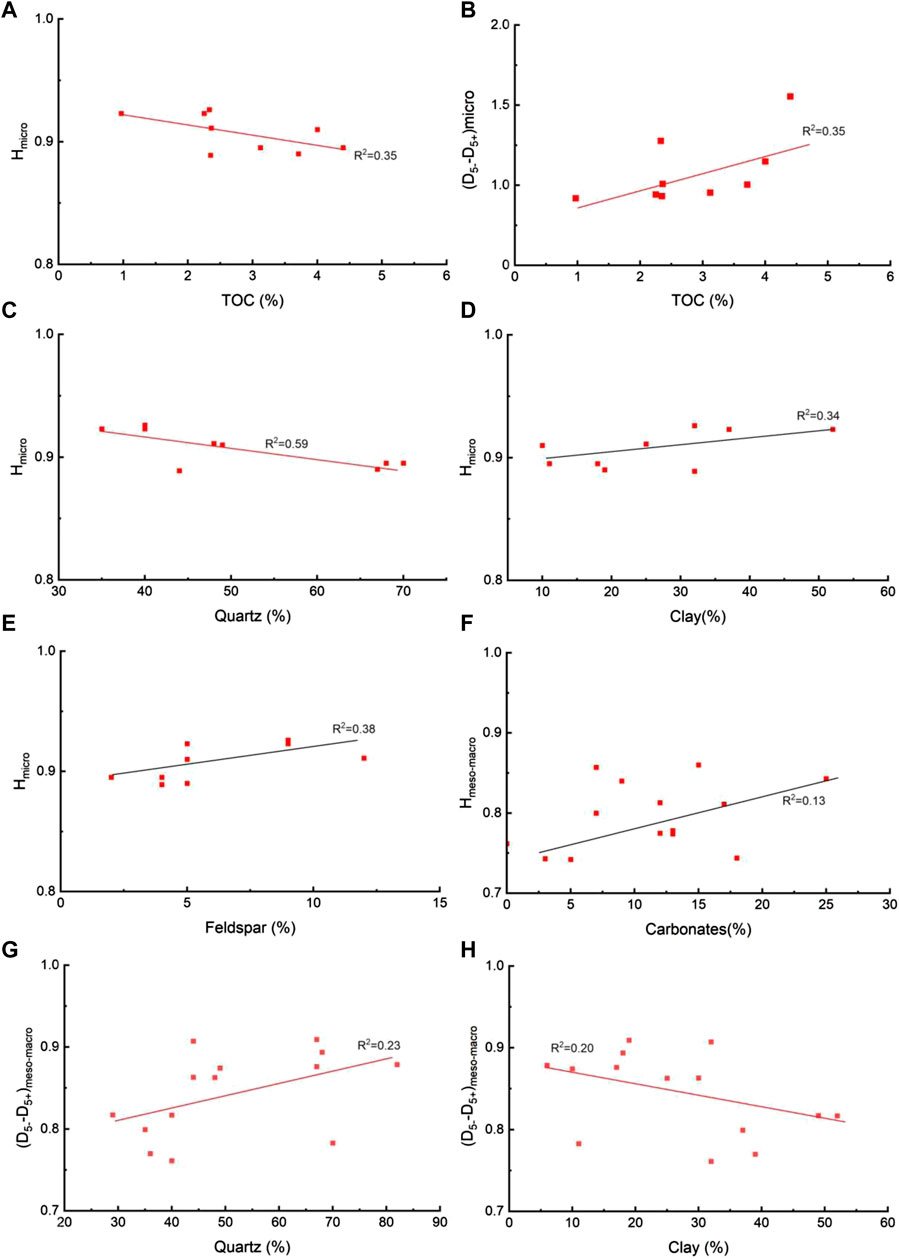
Figure 8. The correlation of mineral composition and micropore and meso-macropore heterogeneity and connectivity. (A). TOC contents versus Hmicro. (B). TOC contents versus (D5--D5+)micro. (C). Quartz contents versus Hmicro. (D). Quartz contents versus (D5--D5+)micro; (E). Feldspar contentsversus Hmicro. (F). Feldspar contents versus (D5--D5+)micro. (G). Quartz contents versus (D5--D5+)meso-macro. (H). Clay contents versus (D5--D5+)meso-macro.
Regarding meso-macropores, there is a slight positive correlation between carbonates content and Hmeso-macro (Figure 8F), indicating that dissolution pores associated with carbonates can slightly increase meso-macropore connectivity, which is consistent with SEM observation (Figure 3E). In addition, quartz exhibits a weak positive correlation with (D5--D5+)meso-macro (Figure 8G) and a weak negative correlation is obtained between clay minerals ad (D5--D5+)meso-macro (Figure 8H), implying that quartz can increase meso-macropore heterogeneity while clays reduce it.
5.2.2 Over-pressure
The TOC content and mineral composition of shales from well D-1 demonstrate weak correlations with the heterogeneity and connectivity of micropore and meso-macropore. These suggest that other geological factors, such as overpressure and burial depth, may play a significant role in controlling the heterogeneity and connectivity of these pores. Overpressure can affect the pore structure of shale by resisting compaction effectively, thereby preserving pores, particularly OM pores (Xie and Hao, 2022). The multi-fractal characteristics of deep shales from well D-1 and well N-1 with similar burial depths but different pressure coefficients (1.86 and 1.1, respectively), reveal distinct differences. Shale samples from the overpressured well D-1 exhibit higher values of Hmicro compared to the normal-pressure well N-1 (Figure 9), suggesting that overpressure may increase micropore connectivity. Notably, there is no significant difference in meso-macropore connectivity between well D-1 and well N-1. Moreover, shale samples from the normal-pressure well N-1 exhibit higher values of (D5--D5+)micro, indicating higher micropore heterogeneity compared to shales from well D-1.
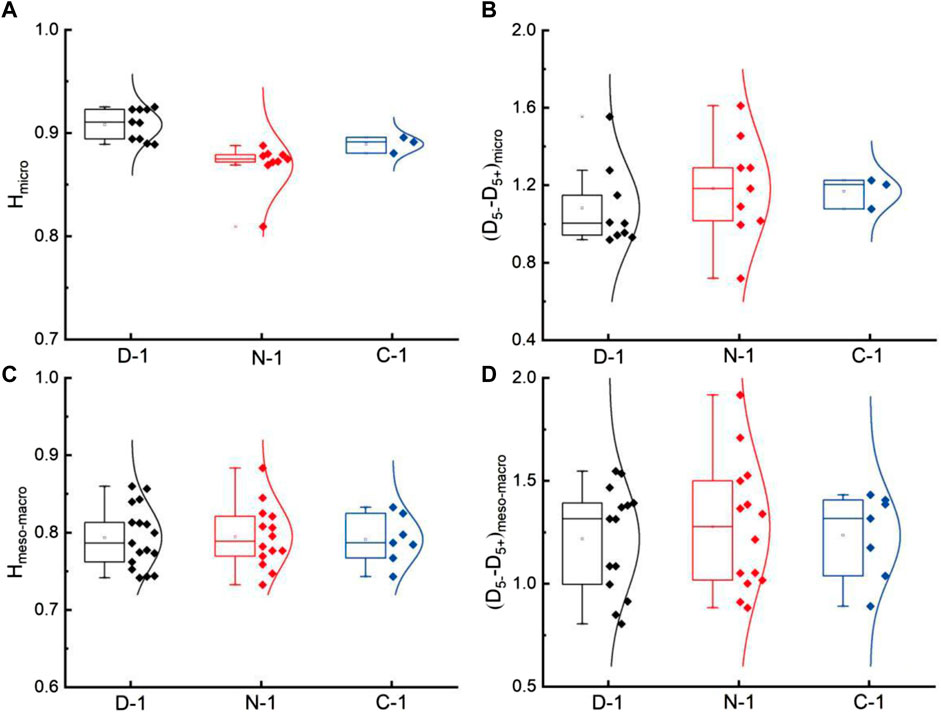
Figure 9. Multi-fractal parameters including (A) Hmicro, (B) (D5--D5+)micro, (C) Hmeso-macro, and (D) (D5--D5+)meso-macro. of micropores and meso-macropores of deep shale from wells D-1, N-1 and C-1.
Comparing samples from the same shale lithofacies (Table 5) helps mitigate the impact of shale composition on pore heterogeneity and connectivity. It reveals that overpressured deep shales exhibit higher micropore connectivity and lower micropore heterogeneity, indicating that overpressure can increase micropore connectivity while reducing micropore heterogeneity. Notably, SL and C/ASL, as the primary shale gas exploration intervals for the Wufeng-Longmaxi shales, display high micropore connectivity and large micropore heterogeneity, as well as low meso-macropore connectivity. These imply that high micropore connectivity and wide pore distribution may be conductive to the accumulation of shale gas.
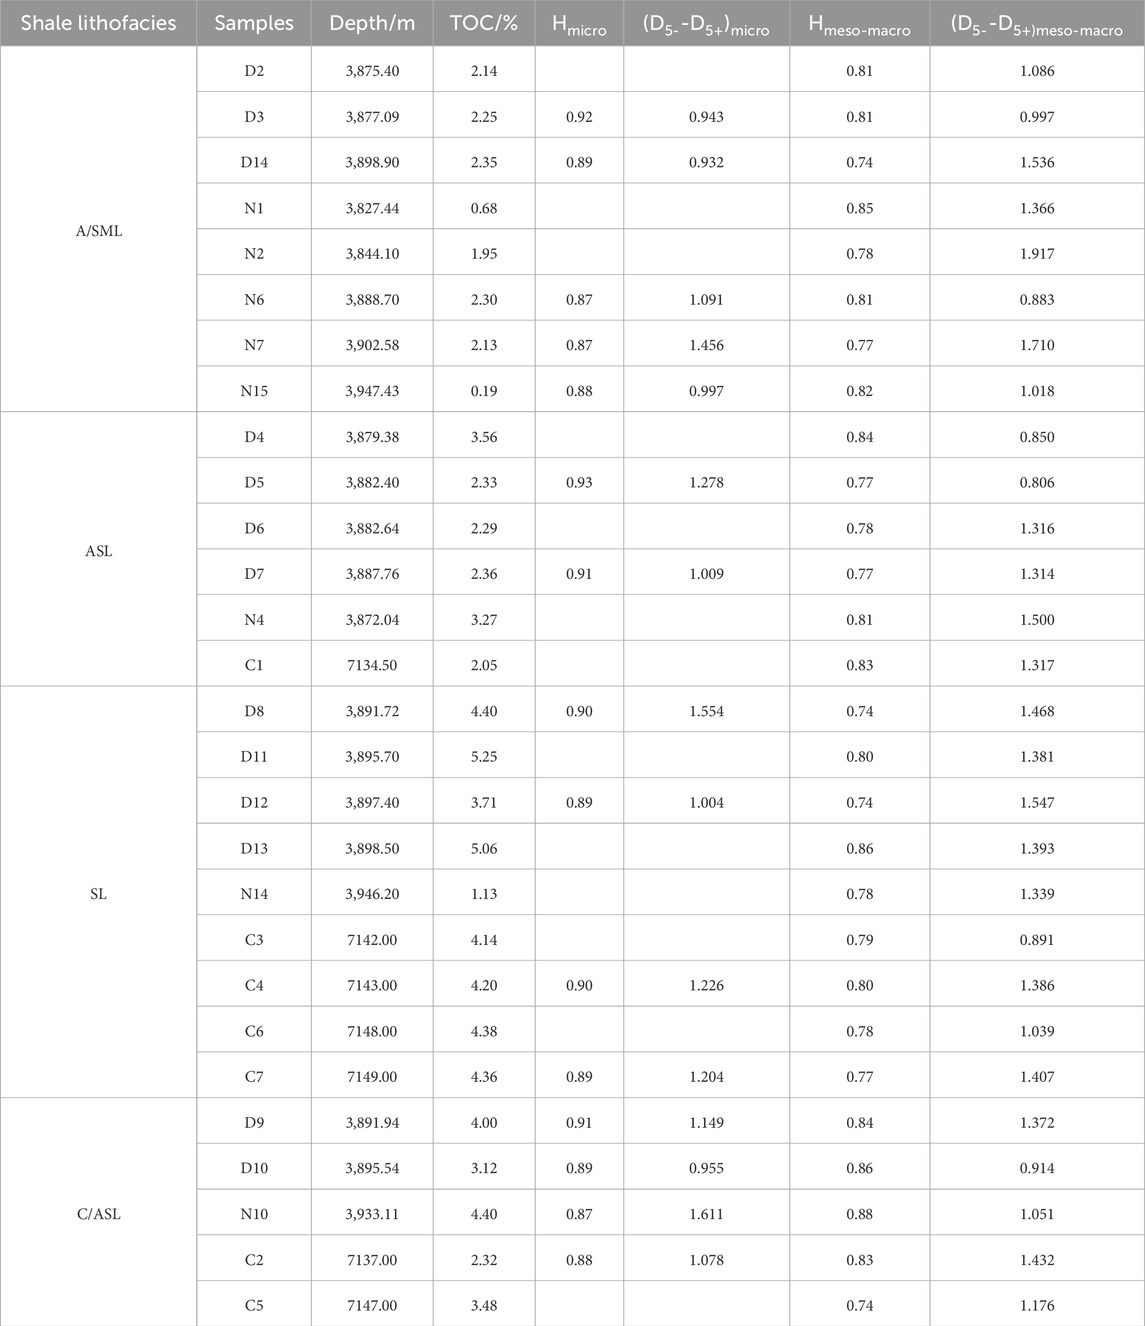
Table 5. The connectivity and heterogeneity of micropore and meso-macropore of different shale lithofacies from well D-1 and N-1.
For the deep shales of well D-1, low meso-macropore connectivity suggests that the formation of isolated pressure-sealed compartments within overpressured shales occurs more readily. During the Yanshanian to Himalayan period, the Sichuan Basin experienced considerable uplift and erosion, facilitating the depressurization of strata. The relative low meso-macropore connectivity in these intervals indicates the presence of numerous isolated pressure-sealed compartments within shales, which hinders pressure release during tectonic uplift, favorable for the shale gas accumulation.
5.2.3 Burial depth
Burial depth can significantly influence shale pore structure, primarily reducing OM pores and residual interparticle pores through mechanical compaction (Xie and Hao, 2022). Chen et al. (2022) observed that there is no significant difference in pore type and size at different depths, but shale porosity decreases with increased buried depth. Compared to shallow shales, deep shales contain a higher PV, with both being dominated by mesopores. In deep well D-1 and ultra-deep well C-1, both characterized by overpressure, but no significant differences are observed in micropore PV. However, a notable difference emerges in meso-macropore PV. These may reflect the significant influence of ultra-deep buried depth on the development of meso-macropore. Our previous studies suggested that ultra-deep burial depths and the subsequent intense compaction contribute to the “homogenization” of shale pore structures, leading to the enlargement of pores and a higher proportion of mesopores (Xie and Hao, 2022). The ultra-deep shales from well C-1 exhibit significantly lower Hmicro values and larger (D5--D5+)micro values than the deep shales from well D-1. This means that ultra-deep burial depth can notably reduce micropore connectivity and increase micropore heterogeneity. Conversely, minimal differences are observed in meso-macropore connectivity and heterogeneity for the both wells, suggesting that buried depth likely exhibit little influence on meso-macropore connectivity and heterogeneity in shales.
5.3 Relationship between multi-fractal characteristics and pore structure and significance for shale gas exploration
Figure 10 shows the correlation between the multi-fractal characteristics of micropores and meso-macropores in different shale lithofacies of overpressured deep shales from well D-1. Noticeable discrepancies are observed in the connectivity and heterogeneity of micropores and meso-macropores. Micropores are characterized by high connectivity, low heterogeneity, low PV, and a more concentrated distribution, while meso-macropores display low connectivity, large heterogeneity, high PV, and a dispersed distribution. These distinctions stem from the pronounced heterogeneity of micropores and meso-macropores within the overpressured deep shales. Micropores primarily form within OM, exhibiting high connectivity and a concentrated size range. Conversely, meso-macropores comprise both OM pores and mineral matrix pores, resulting in varied pore sizes and large heterogeneity. Moreover, the low connectivity of mineral matrix pores contributes to the relatively low connectivity of meso-macropores.
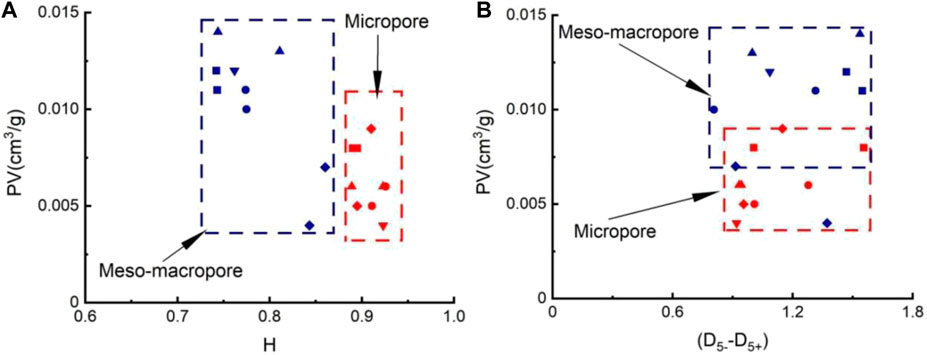
Figure 10. (A). Cross plot between H value and PV showing the relationship between pore connectivity and PV of shale. (B). Cross plot between (D5--D5+) value and PV showing the relationship between pore heterogeneity and PV of shale. Lower triangle represents SAL, upper triangle refers to A/SML, circle represents ASL, square represents SL, diamond represents C/ASL.
The SL and C/ASL, as the primary shale gas exploitation targets within the Wufeng-Longmaxi shales, exhibit lower micropore connectivity, higher micropore heterogeneity, higher micropore PV, and lower meso-macropore connectivity compared to other shale facies like SAL, ASL and A/SML. These observations suggest that the increased silica content in these shales contributes to the complex micropore network. This complexity is likely a result of the prevalence of biogenic silica in the Wufeng-Longmaxi shale (Cai et al., 2022). The SAL and A/SML demonstrate higher micropore connectivity, lower micropore heterogeneity, and lower micropore PV. This can be attributed to the formation of organic-clay complexes within these formations (Gu et al., 2023). The presence of these complexes facilitates the interconnectedness among the dispersed OM particles, leading to increased micropore connectivity and reduced micropore heterogeneity. However, the low TOC content in SAL limits the development of OM pores, resulting in lower micropore PV. The significant variations in pore characteristics, including pore proportion, types, and multi-fractal characteristics such as connectivity and heterogeneity, among different shale lithofacies highlight the pronounced micropore and meso-macropore heterogeneity within deep overpressure shales. Factors such as diagenesis, thermal evolution, shale composition (TOC and mineralogy), burial depth, and pressure coefficient influence pore connectivity and heterogeneity in deep shales. Recognized as sweet spots for current shale gas extraction, C/ASL and SL exhibit specific features like relative low micropore connectivity, high micropore heterogeneity, high micropore PV and low meso-macropore connectivity. Therefore, a comprehensive analysis of shale reservoir quality and multi-fractal characteristics can offer valuable insights for optimizing shale gas favorable areas.
6 Inclusions
(1) The CO2 and N2 adsorption isotherms reveal the multifractal nature of the pore system within the deep shales of the Sichuan Basin. Various shale lithofacies, distinguished by differing TOC content and mineral composition, exhibit significant disparities in the PV of micropores, mesopores, and macropores.
(2) The heterogeneity and connectivity of micropores and meso-macropores of deep shales in the Sichuan Basin are influenced by various factors, including TOC content, mineral composition, burial depth, and pressure coefficient. Overpressure plays a role in enhancing the micropore connectivity while reducing their heterogeneity. The meso-macropore connectivity and heterogeneity are more susceptible to the influence of different shale lithofacies. Ultra-deep burial depth tends to decrease micropore connectivity while simultaneously increasing their heterogeneity. However, its impact on the connectivity and heterogeneity of meso-macropores within shale remains insignificant.
(3) The C/ASL and SL, known as sweet spot for current shale gas exploitation for the Wufeng-Longmaxi shale, displays characteristics such as low micropore connectivity, large micropore heterogeneity, high micropore PV. This implies that independent pressure containment compartments are more susceptible to form within overpressured siliceous shale lithofacies of the Wufeng-Longmaxi Formation. Pressure in these shales is less likely to release during the Yanshanian-Xishanian tectonic uplift process, favoring the preservation of OM pores and intergranular residual pores, which is conducive to the accumulation of deep shale gas dominated by free gas.
Data availability statement
The raw data supporting the conclusions of this article will be made available by the authors, without undue reservation.
Author contributions
GgX: Data curation, Formal Analysis, Methodology, Software, Visualization, Writing–original draft. GlX: Conceptualization, Funding acquisition, Investigation, Writing–original draft, Writing–review and editing. KJ: Methodology, Resources, Writing–review and editing.
Funding
The author(s) declare that financial support was received for the research, authorship, and/or publication of this article. The work was supported by Natural Science Foundation of Anhui Province (No. 2208085QD110), Natural Science Foundation of Sichuan Province (2023NSFSC0262), National Natural Science Foundation of China (No. 42207293), Key Scientific Research Foundation of the Education Department of the Province Anhui (No. 2022AH051748), Key Programs of the Tongling University (No. 2021tlxyZD03), Tongling University Starting Research Project (No. 2021tlxyrc16), Anhui University Excellent Research and Innovation Project (No. 2022AH010094), and National College Student Innovation and Entrepreneurship Training Program of Tongling University (No. 202310383117).
Conflict of interest
The authors declare that the research was conducted in the absence of any commercial or financial relationships that could be construed as a potential conflict of interest.
Publisher’s note
All claims expressed in this article are solely those of the authors and do not necessarily represent those of their affiliated organizations, or those of the publisher, the editors and the reviewers. Any product that may be evaluated in this article, or claim that may be made by its manufacturer, is not guaranteed or endorsed by the publisher.
References
Bernard, S., Horsfield, B., Schulz, H. M., Wirth, R., Schreiber, A., and Sherwood, N. (2012). Geochemical evolution of organic-rich shales with increasing maturity: a STXM and TEM study of the Posidonia Shale (Lower Toarcian, northern Germany). Mar. Petrol. Geol. 31, 70–89. doi:10.1016/j.marpetgeo.2011.05.010
Cai, Q. S., Hu, M. Y., Zhang, B. M., Ngia, N., Liu, A., Liao, R. Q., et al. (2022). Source of silica and its implications for organic matter enrichment in the Upper Ordovician-Lower Silurian black shale in western Hubei Province, China: insights from geochemical and petrological analysis. Petrol. Sci. 19, 74–90. doi:10.1016/j.petsci.2021.10.012
Chalmers, G. R., Bustin, R. M., and Power, I. M. (2012). Characterization of gas shale pore systems by porosimetry, pycnometry, surface area, and field emission scanning electron microscopy/transmission electron microscopy image analyses: examples from the Barnett, Woodford, Haynesville, Marcellus, and Doig units. AAPG Bull. 96, 1099–1119. doi:10.1306/10171111052
Chen, Y., Tang, H. M., Liao, J. J., Luo, C., Zhao, S. X., Zheng, M. J., et al. (2022). Analysis of shale pore characteristics and controlling factors based on variation of buried depth in the Longmaxi Formation, Southern Sichuan Basin. Geol. China 49 (2), 472–484. doi:10.12029/gc20220209
Clarkson, C. R., Solano, N., Bustin, R. M., Bustin, A. M. M., Chalmers, G. R. L., He, L., et al. (2013). Pore structure characterization of North American shale gas reservoirs using USANS/SANS, gas adsorption, and mercury intrusion. Fuel 103, 606–616. doi:10.1016/j.fuel.2012.06.119
Curtis, M. E., Cardott, B. J., Sondergeld, C. H., and Rai, C. S. (2012). Development of organic porosity in the Woodford Shale with increasing thermal maturity. Inter. J. Coal Geol. 103, 26–31. doi:10.1016/j.coal.2012.08.004
Do, D. D., and Do, H. D. (2003). Pore characterization of carbonaceous materials by DFT and GCMC simulations: a review. Adsorpt. Sci. Technol. 21 (5), 389–423. doi:10.1260/026361703769645753
Ferreiro, J. P., Wilson, M., and Vázquez, E. V. (2009). Multifractal description of nitrogen adsorption isotherms. Vadose Zone J. 8, 209–219. doi:10.2136/vzj2008.0007
Gao, J., Zhang, J. K., He, S., Zhao, J. X., He, Z. L., Wo, Y. J., et al. (2019). Overpressure generation and evolution in Lower Paleozoic gas shales of the Jiaoshiba region, China: implications for shale gas accumulation. Mar. Petrol. Geol. 102, 844–859. doi:10.1016/j.marpetgeo.2019.01.032
Gu, Y., Wan, Q., Li, X., Han, T., Yang, S., and Hu, Q. (2023). Structure and evolution of clay-organic nanocomposites in three leading shales in China. J. Earth Sci. 34, 824–837. doi:10.1007/s12583-022-1717-y
Guo, X. D., Hu, D. F., Li, Y. P., Wei, Z. H., Wei, X. F., and Liu, Z. J. (2017). Geological factors controlling shale gas enrichment and high production in Fuling shale gas field. Petrol. explor. Dev. 44 (4), 513–523. doi:10.1016/s1876-3804(17)30060-5
Guo, X. S., Borjigin, T., Wei, X. F., Yu, L. J., Lu, X. C., Sun, L., et al. (2022). Occurrence mechanism and exploration potential of deep marine shale gas in Sichuan Basin. Acta Pet. Sin. 43 (4), 453–468. doi:10.7623/syxb202204001
He, X., Chen, G. S., Wu, J. F., Liu, Y., Wu, S., Zhang, J., et al. (2023). Deep shale gas exploration and development in the southern Sichuan Basin: new progress and challenges. Nat. Gas. Ind. B 10 (1), 32–43. doi:10.1016/j.ngib.2023.01.007
He, Z. L., Li, S. J., Nie, H. K., Yuan, Y., and Wang, H. (2019). The shale gas “sweet window”: “the cracked and unbroken” state of shale and its depth range. Mar. Petrol. Geol. 101, 334–342. doi:10.1016/j.marpetgeo.2018.11.033
He, Z. L., Nie, H. K., Hu, D. F., Jiang, T. X., Wang, R. Y., Zhang, Y. Y., et al. (2020). Geological problems in the effective development of deep shale gas: a case study of Upper Ordovician Wufeng-Longmaxi formation in Sichuan Basin and its periphery. Acta Pet. Sin. 41 (4), 379–391. doi:10.7623/syxb202004001
Holmes, R., Rupp, E. C., Vishal, V., and Wilcox, J. (2017). Selection of shale preparation protocol and outgas procedures for applications in low-pressure analysis. Energy fuels. 31 (9), 9043–9051. doi:10.1021/acs.energyfuels.7b01297
Jiao, K., Ye, Y. H., Liu, S. G., Ran, B., Deng, B., Li, Z. W., et al. (2018). Characterization and evolution of nanoporosity in superdeeply buried shales: a case study of the Longmaxi and Qiongzhusi shales from MS well #1, North Sichuan Basin, China. Energy fuels. 32 (1), 191–203. doi:10.1021/acs.energyfuels.7b02932
Li, G. F., Jin, Z. J., Li, X., Zhang, P. Y., Liang, X. P., Zhang, R., et al. (2023). Shallow burial shale gas accumulation pattern of the Wufeng-Longmaxi Formations in the northern Guizhou area, western Yangtze platform. Geoenergy Sci. Eng. 225, 211683. doi:10.1016/j.geoen.2023.211683
Li, W., Liu, H. F., and Song, X. X. (2015). Multifractal analysis of Hg pore size distributions of tectonically deformed coals. Inter. J. Coal Geol. 144-145, 138–152. doi:10.1016/j.coal.2015.04.011
Li, X., Lu, S. F., Zhao, S. X., Li, W. B., Li, J. Q., Zhang, X. G., et al. (2014). Gas-in-place content and occurrence state of deep shale gas in the Luzhou area, Sichuan Basin, China. China. Mar. Petrol. Geol. 160, 106662. doi:10.1016/j.marpetgeo.2023.106662
Liu, K. Q., and Ostadhassan, M. (2017). Multi-scale fractal analysis of pores in shale rocks. J. Appl. Geophys. 140, 1–10. doi:10.1016/j.jappgeo.2017.02.028
Liu, K. Q., Ostadhassan, M., Sun, L. W., Zou, J., Yuan, Y. J., Gentzis, T., et al. (2019). A comprehensive pore structure study of the Bakken Shale with SANS, N2 adsorption and mercury intrusion. Fuel 245, 274–285. doi:10.1016/j.fuel.2019.01.174
Liu, S. G., Deng, B., Li, Z. L., Sun, W., Wu, J., Luo, C., et al. (2024). The qiongzhusi-dengying petroleum system in the Sichuan Basin, China. AAPG Bull. 108 (4), 663–689. doi:10.1306/12052321155
Liu, S. G., Yang, Y., Deng, B., Zhong, Y., Wen, L., Sun, W., et al. (2021). Tectonic evolution of the Sichuan Basin, southwest China. Earth-Sci. Rev. 213, 103470. doi:10.1016/j.earscirev.2020.103470
Loucks, R. G., Reed, R. M., Ruppel, S. C., and Hammes, U. (2012). Spectrum of pore types and networks in mudrocks and a descriptive classification for matrix-related mudrock pores. AAPG Bull. 96 (6), 1071–1098. doi:10.1306/08171111061
Ma, X. h., and Xie, J. (2018). The progress and prospects of shale gas exploration and exploitation in southern Sichuan Basin, NW China. Petrol. explor. Dev. 45 (1), 161–169. doi:10.11698/PED.2018.01.18
Ma, X. H., Xie, J., Yong, R., and Zhu, Y. Q. (2020). Geological characteristics and high production control factors of shale gas reservoirs in Silurian Longmaxi Formation, southern Sichuan Basin, SW China. Petrol. explor. Dev. 47 (5), 901–915. doi:10.1016/s1876-3804(20)60105-7
Ma, Y. S., Cai, X. Y., and Zhao, P. R. (2018). China's shale gas exploration and development: understanding and practice. Petrol. explor. Dev. 45 (4), 589–603. doi:10.1016/s1876-3804(18)30065-x
Mandelbrot, B. B. (1975). Stochastic models for the Earth's relief, the shape and the fractal dimension of the coastlines, and the number-area rule for islands. P. Natl. Acad. Sci. USA. 72 (10), 3825–3828. doi:10.1073/pnas.72.10.3825
Nie, H. K., Li, P., Dang, W., Ding, J. H., Sun, C. X., Liu, M., et al. (2022). Enrichment characteristics and exploration directions of deep shale gas of Ordovician-Silurian in the Sichuan Basin and its surrounding areas, China. Petrol. Explor. Dev. 49 (4), 648–659. doi:10.1016/S1876-3804(22)60307-0
Okolo, G. N., Everson, R. C., Neomagus, H. W. J. P., Roberts, M. J., and Sakurovs, R. (2015). Comparing the porosity and surface areas of coal as measured by gas adsorption, mercury intrusion and SAXS techniques. Fuel 141, 293–304. doi:10.1016/j.fuel.2014.10.046
Shan, C. A., Shi, Y. K., Liang, X., Zhang, L., Wang, G. C., Jiang, L. W., et al. (2024). Diagenetic characteristics and microscopic pore evolution of deep shale gas reservoirs in Longmaxi Formation, Southeastern Sichuan basin, China. Unconv. Resour. 4, 100090. doi:10.1016/j.uncres.2024.100090
Song, Y., Jiang, B., Shao, P., and Wu, J. H. (2018). Matrix compression and multifractal characterization for tectonically deformed coals by Hg porosimetry. Fuel 211, 661–675. doi:10.1016/j.fuel.2017.09.070
Tang, L., Wang, P. F., Zhao, Z. G., Song, Y., Chen, X. Z., Jiang, Z. X., et al. (2024). Overpressure origin and evolution during burial in the shale gas plays of the Wufeng-Longmaxi formations of southern Sichuan basin. Geoenergy Sci. Eng. 236, 212729. doi:10.1016/j.geoen.2024.212729
Teng, J., Liu, B., Mastalerz, M., and Schieber, J. (2022). Origin of organic matter and organic pores in the overmature ordovician-silurian wufeng-longmaxi shale of the Sichuan Basin, China. Inter. J. Coal Geol. 253, 103970. doi:10.1016/j.coal.2022.103970
Tong, Z. Z., Zhang, J. C., Li, Z., Wu, Y. N., Wang, D. S., and Gong, D. J. (2022). Investigation of organic-shale nanopores in the Lower Cambrian Niutitang Formation using low temperature N2 and CO2 adsorption: multifractality and classification. Micropor. Mesopor. Mat. 337, 111935. doi:10.1016/j.micromeso.2022.111935
Wang, G. C. (2020). Deformation of organic matter and its effect on pores in mud rocks. AAPG Bull. 103 (1), 21–36. doi:10.1306/04241918098
Wang, P. F., Zhang, C., Li, X., Zhang, K., Yuan, Y., Zang, X. P., et al. (2020a). Organic matter pores structure and evolution in shales based on the he ion microscopy (HIM): a case study from the Triassic Yanchang, Lower Silurian Longmaxi and Lower Cambrian Niutitang shales in China. J. Nat. Gas. Sci. Eng. 84, 103682. doi:10.1016/j.jngse.2020.103682
Wang, R. Y., Hu, Z. Q., Dong, L., Gao, B., Sun, C. X., Yang, T., et al. (2021). Advancement and trends of shale gas reservoir characterization and evaluation. Oil Gas Geol. 42 (1), 54–65. doi:10.11743/ogg20210105
Wang, R. Y., Hu, Z. Q., Long, S. X., Liu, G. X., Zhao, J. H., Dong, L., et al. (2019). Differential characteristics of the Upper Ordovician-Lower Silurian Wufeng-Longmaxi shale reservoir and its implications for exploration and development of shale gas in/around the Sichuan Basin. Acta Geol. sin-engl. 93 (3), 520–535. doi:10.1111/1755-6724.13875
Wang, Y., Liu, L. F., Hu, Q. H., Hao, L. W., Wang, X. M., and Sheng, Y. (2020b). Nanoscale pore network evolution of Xiamaling marine shale during organic matter maturation by hydrous pyrolysis. Energy fuels. 34, 1548–1563. doi:10.1021/acs.energyfuels.9b03686
Wang, Y., Wu, C. F., Zhu, Y. M., Chen, S. B., Liu, S. M., and Zhang, R. (2018). Morphology and fractal characterization of multiscale pore structures for organic-rich lacustrine shale reservoirs. Fractals 26 (2), 1840013. doi:10.1142/s0218348x18400133
Wei, M. M., Zhang, L., Xiong, Y. Q., Li, J. H., and Peng, P. A. (2016). Nanopore structure characterization for organic-rich shale using the non-local-density functional theory by a combination of N2 and CO2 adsorption. Micropor. Mesopor. Mat. 227, 88–94. doi:10.1016/j.micromeso.2016.02.050
Xi, Z. D., Tang, S. H., Zhang, S. H., Yi, Y. X., Dang, F., and Ye, Y. P. (2019). Characterization of quartz in the Wufeng Formation in northwest Hunan Province, south China and its implications for reservoir quality. J. Petrol. Sci. Eng. 179, 979–996. doi:10.1016/j.petrol.2019.04.051
Xie, G. L., and Hao, W. D. (2022). Identifying organic matter (OM) types and characterizing OM pores in the Wufeng-Longmaxi shales. ACS Omega 7 (43), 38811–38824. doi:10.1021/acsomega.2c04497
Xu, H., Zhou, W., Hu, Q. H., Yi, T., Ke, J., Zhao, A. K., et al. (2021). Quartz types, silica sources and their implications for porosity evolution and rock mechanics in the Paleozoic Longmaxi Formation shale, Sichuan Basin. Mar. Petrol. Geol. 128, 105036. doi:10.1016/j.marpetgeo.2021.105036
Xu, H., Zhou, W., Zhang, R., Liu, S. M., and Zhou, Q. M. (2019). Characterizations of pore, mineral and petrographic properties of marine shale using multiple techniques and their implications on gas storage capability for Sichuan Longmaxi gas shale field in China. Fuel 241, 360–371. doi:10.1016/j.fuel.2018.12.035
Yun, L. (2023). Accumulation characteristics and exploration enlightenment of shallow normal-pressure shale gas in southeastern Sichuan Basin, SW China. Petrol. explor. Dev. 50 (6), 1140–1149. doi:10.1016/S1876-3804(24)60468-4
Zhang, J. C., Li, Z., Wang, D. S., Xu, L. F., Li, Z. M., Niu, J. L., et al. (2023a). Shale gas accumulation patterns in China. Nat. Gas. Ind. B 10 (1), 14–31. doi:10.1016/j.ngib.2023.01.004
Zhang, N., Wang, S. D., Li, Z., Guo, S. H., and Wang, R. C. (2023b). Application of multifractal theory for determination of fluid movability of coal-measure sedimentary rocks using nuclear magnetic resonance (NMR). Fractal Fract. 7, 503. doi:10.3390/fractalfract7070503
Zhao, L., Mao, W. J., Liu, Z. B., and Cheng, S. J. (2023). Research on the differential tectonic-thermal evolution of Longmaxi shale in the southern Sichuan Basin. Adv. Geo-Energy Res. 7 (3), 152–163. doi:10.46690/ager.2023.03.02
Zheng, S., Sang, S., Yao, Y., Liu, D., Liu, S., Wang, M., et al. (2022a). A multifractal-based method for determination NMR dual T2 cutoffs in coals. J. Pet. Sci. Eng. 214, 110488. doi:10.1016/j.petrol.2022.110488
Zheng, Y. J., Liao, Y. H., Wang, J., Xiong, Y. Q., Wang, Y. P., and Peng, P. A. (2024). Factors controlling the heterogeneity of shale pore structure and shale gas production of the Wufeng-Longmaxi shales in the Dingshan plunging anticline of the Sichuan Basin, China. Int. J. Coal Geol. 282, 104434. doi:10.1016/j.coal.2023.104434
Zheng, Y. J., Liao, Y. H., Wang, Y. P., Xiong, Y. Q., and Peng, P. A. (2022b). The main geological factors controlling the WufengLongmaxi shale gas content. AAPG Bull. 106 (10), 2073–2102. doi:10.1306/07132218243
Keywords: multi-fractal analysis, heterogeneity, deep shale reservoir, Wufeng-Longmaxi shale, Sichuan Basin
Citation: Xie G, Xie G and Jiao K (2024) Multi-fractal characteristics of pore system in deep organic-rich shales of the Wufeng-Longmaxi formation in the Sichuan Basin and their geological significance. Front. Earth Sci. 12:1430466. doi: 10.3389/feart.2024.1430466
Received: 10 May 2024; Accepted: 24 June 2024;
Published: 15 July 2024.
Edited by:
Guochang Wang, Saint Francis University, United StatesReviewed by:
Ruyue Wang, State Key Laboratory of Shale Oil and Gas Enrichment Mechanisms and Efficient Development, ChinaShaoke Feng, SINOPEC, Southwest Oil and Gas Branch, China
Copyright © 2024 Xie, Xie and Jiao. This is an open-access article distributed under the terms of the Creative Commons Attribution License (CC BY). The use, distribution or reproduction in other forums is permitted, provided the original author(s) and the copyright owner(s) are credited and that the original publication in this journal is cited, in accordance with accepted academic practice. No use, distribution or reproduction is permitted which does not comply with these terms.
*Correspondence: Guoliang Xie, Z2x4aWUxOTg5QHRsdS5lZHUuY24=