 Pingfeng Li1,2
 Mengyuan Li
 Xiaopeng Peng
94% of researchers rate our articles as excellent or good
Learn more about the work of our research integrity team to safeguard the quality of each article we publish.
Find out more
ORIGINAL RESEARCH article
Front. Earth Sci., 26 June 2024
Sec. Geohazards and Georisks
Volume 12 - 2024 | https://doi.org/10.3389/feart.2024.1430046
This article is part of the Research TopicInvestigation, Monitoring, Stability and Risk Assessment of GeohazardsView all 15 articles
The flow characteristics of blasthole stemming slurry (BSS), predominantly comprising yellow mud (YM), tail mud (TM), or drilling cuttings (DC), were systematically investigated. Various influencing factors, including slurry mass concentration, the addition of TM or DC, and the mass ratio of TM to YM (TM/YM) and DC to YM (DC/YM), were meticulously examined. Experiments were conducted to assess the fluidity, rheological properties, and bleeding rate of BSS samples, which were prepared by manipulating slurry mass concentration and the proportions of TM or DC. The results indicate that the rheological properties of BSS are suitably described by the Herschel-Bulkley model. A critical mass concentration was identified, beyond which the flowability of BSS rapidly deteriorates. Replacing YM with an equivalent amount of TM at a mass concentration of 59% increased the yield stress by 167.30%, while reducing the bleeding rate to 0 within the 53%–59% mass concentration range. Conversely, replacing YM with DC at a mass concentration of 62% reduced the yield stress by 63.96%, while increasing the 60-minute bleeding rate from 0% to 1.44%. Increasing the TM/YM ratio resulted in reduced fluidity, elevated yield stress, and a variable degree of shear thickening. The degree of shear thickening was highest when the TM/YM ratio was 1, with significant impacts on differential viscosity at higher shear rates. On the other hand, increasing the DC/YM ratio enhanced fluidity, decreased yield stress, and influenced the degree of shear thickening and differential viscosity, with the highest shear thickening and lowest differential viscosity observed at a DC/YM ratio of 3. The bleeding rate of BSS consistently rose with the increase in the DC/YM ratio.
Currently, medium-depth hole blasting techniques are commonly employed in open-pit mining operations across China (Zhang et al., 2021; Li et al., 2023; Zhang et al., 2024). This technology offers significant advantages, including a low incidence of safety accidents. It allows for a direct assessment of the geological conditions for explosive placement and the relationship with the open-pit surface. Moreover, the post-blasting outcomes are notably favorable, enabling precise control over the collapse range, direction, and height of the blast pile, all in accordance with pre-designed parameters. This facilitates swift and smooth production processes, further supporting drilling and blasting production methods and mechanized construction throughout the production phase.
Typically, the construction process for medium-depth hole blasting techniques in open-pit mining terraces comprises various stages, including preparation, hole layout, drilling, hole inspection, charging, stemming, re-inspection, network linking, and initiation (Chaudhary, 2017; Lu et al., 2024). Among these steps, stemming, a pivotal element of the blasting operation, holds special significance. Stemming serves the purpose of ensuring the effective utilization of explosive energy, enhancing the fragmentation of rock, extending the duration of explosive gases within the rock mass, and regulating the explosive pressure within the blastholes to optimize the efficiency of explosive energy. Additionally, proper stemming minimizes the hazards associated with air blast waves, noise, and the projection of individual rock fragments (Chaudhary, 2017; Xie et al., 2022). Consequently, the quality of stemming directly influences the quality of the blasting operation (Chen et al., 2021).
Traditionally, the placement of blasthole stemming material into blastholes has been carried out manually. Following stemming, a gentle compaction is typically applied. This manual approach is time-consuming, less efficient, and involves a significant labor investment (Li et al., 2023b). With the continuous advancement of smart mining practices, some mines have taken the lead in employing intelligent stemming vehicles for blasthole stemming operations. The intelligent stemming vehicle generally offers comprehensive capabilities, including material storage and long-distance transportation, automatic unloading, preparation of blasthole stemming material, pipeline transport of stemming material, blasthole positioning, and efficient stemming, integrating the efficient preparation and placement of blasthole stemming material. The material, when conveyed to the blastholes under high pressure, becomes more compact due to the impact, thereby enhancing blasthole sealing effectiveness. This integrated approach to blasthole stemming material preparation and placement enables the rapid, efficient, and safe achievement of blasthole stemming goals.
Selecting the appropriate blasthole stemming material is one of the critical factors in ensuring the quality of blasthole stemming. Traditional blasthole stemming materials primarily include clay slurry, water-based slurry, cement-based materials, polyurethane materials, and the like (Li et al., 2023). With the development and usage of equipment like the intelligent stemming vehicle described above, there is a heightened demand for the performance of blasthole stemming materials. Firstly, the prepared blasthole stemming material must meet the requirements for pipeline transport and post-stemming compaction. In essence, it should exhibit excellent flowability and uniformity, with no bleeding. Secondly, it should be cost-effective and readily available in terms of raw materials. Presently, academic research on blasthole stemming materials in open-pit mining, particularly regarding their flow performance, is insufficient both domestically and internationally. Hence, this study utilizes cost-effective raw materials available at a specific granite open-pit mine to prepare blasthole stemming material and focuses on researching its flow performance.
In the process of blasting, the selection of appropriate stemming materials holds significant importance for enhancing stemming quality and improving blasting results. Blasthole stemming materials can be categorized into three major classes: solid particulate stemming materials, chemical stemming materials, and liquid stemming materials.
Solid particulate stemming materials primarily include solid granular materials such as clay, gravel, drilling cuttings, and mixtures prepared from them. During drilling operations in open-pit mines, rock is continuously cut by high-speed drilling equipment to create blastholes. The drilling process generates drilling cuttings, which are often found near the blastholes. Due to their ease of accessibility, drilling cuttings are widely used for stemming in open-pit mines. However, research has shown (Chaudhary, 2017) that drilling cuttings rapidly move under the influence of the high-pressure gases generated during the explosion. When used as sole stemming material, they limit the duration of the explosion, often resulting in lower efficiency in utilizing explosive energy within the rock. Additionally, clay-based stemming materials made from a specific proportion of clay, gravel, and water have been employed for blasthole stemming in open-pit mining. However, these clay-based stemming materials possess high viscosity and poor flowability, making them prone to blasthole blockages and subsequently reducing the efficiency of subsequent explosive charging (Qiu et al., 2018).
Chemical stemming materials primarily consist of two types: organic materials and inorganic materials. Organic materials include polyurethane, phosphogypsum, and organic components in quick-setting gel solution. Inorganic materials encompass substances like lime, gypsum, cement, and fly ash, often combined with various additives to create quick-setting gel solution materials. For instance, gypsum, with its rapid-setting properties, can form robust plugs after hardening. Compared to traditional drilling cuttings as stemming materials, gypsum offers higher hardness and greater frictional resistance against the borehole walls. In open-pit blasting, using gypsum stemming can reduce stemming length, increase explosive loading length, and enhance blasting efficiency. Field blasting experiments (Cevizci, 2014) have also demonstrated that gypsum-based stemming materials exhibit a more pronounced blast-inhibiting effect compared to traditional rock powder stemming materials and are more cost-effective. Similarly, concrete plugs made from materials like cement also have distinct advantages in controlling blast spalling and mitigating fly rock issues (Eloranta, 1994).
Liquid stemming materials primarily include water-filled sandbags, which are created by injecting water into cylindrical plastic bags and sealing them. During actual application, a portion of solid granular material is added at the blasthole entrance for stemming. As a result of the explosive action of the detonation, the water in the sandbags is atomized and dispersed into the air under the impact of the explosive gases. This plays a crucial role in reducing the explosion temperature, mitigating dust, and absorbing harmful gases from the blast fumes. Relevant study (Ghose and Majee, 2001) has shown that in comparison to clay stemming, water-filled sandbags substantially reduce dust concentration, thus contributing to an improved working environment.
In summary, there is currently limited academic research on blasthole stemming materials in open-pit mining, and there is a significant gap in the study of the flow performance of these materials. Therefore, to advance the process of intelligent mining, it is essential to develop stemming materials suitable for storage, transportation, preparation, conveyance, and stemming by intelligent stemming vehicles. Additionally, it is imperative to conduct flow-related experimental and theoretical research on these developed stemming materials.
In this study, the powder materials used to prepare blasthole stemming slurry (BSS) include yellow mud (YM), tail mud (TM) and drilling cuttings (DC). The chemical composition of these three raw materials is detailed in Table 1. The physical properties of these materials are summarized in Table 2. The particle size distribution characteristics of YM, TM, and DC are depicted in Figure 1. Tap water was used as ingredients for sample preparation.
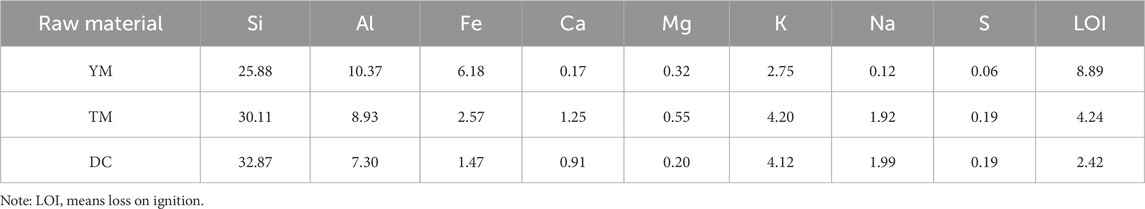
Table 1. Chemical compositions of raw materials/%.
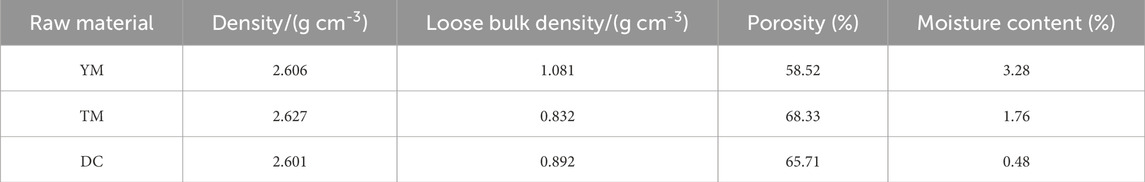
Table 2. Physical parameters of raw materials.
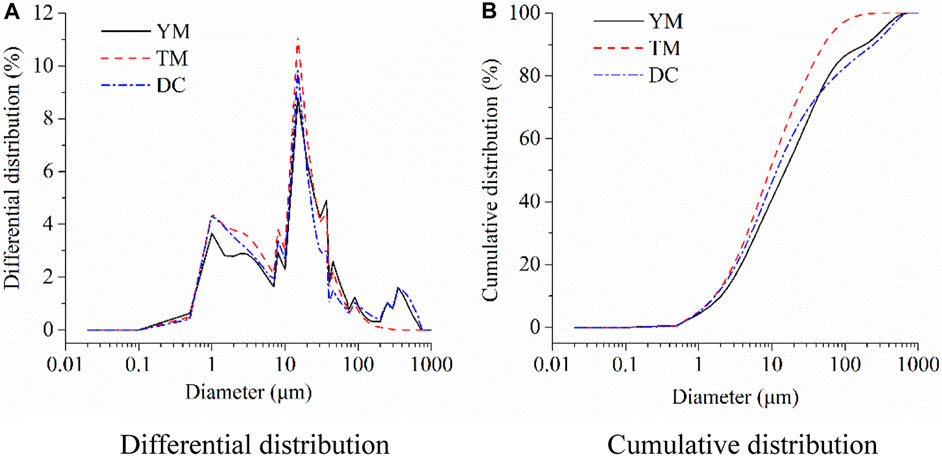
Figure 1. Particle size distribution of raw materials. (A) Differential distribution. (B) Cumulative distribution.
Figure 1 provides a clear illustration of the average particle size, showing that TM has a smaller average particle size than YM, and YM has a smaller average particle size than DC.
A total of eighteen distinct BSS samples were prepared by manipulating slurry mass concentration and the proportions of TM or DC. The mix proportions of these slurries are detailed in Table 3. The design of these groups was based on extensive exploratory experiments, taking into account various factors such as the appropriate range of slurry fluidity differences, suitable concentrations for slurries prepared from different raw materials, and the optimal design of the mass ratio of TM to YM (TM/YM) and the mass ratio of DC to YM (DC/YM).
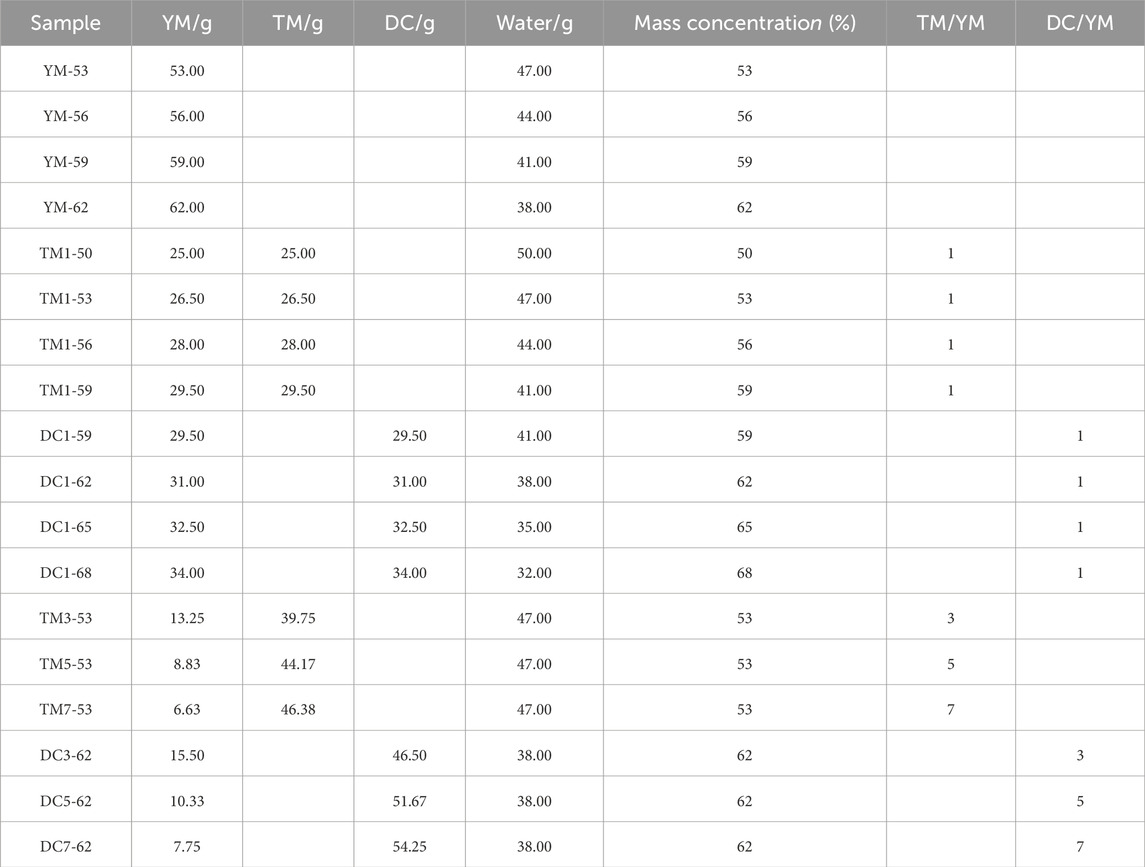
Table 3. Mix proportion of the test.
In this study, the fluidity of the BSS was characterized by spread diameter in a mini-cone test, in which a copper cone with a top diameter of 36 mm, bottom diameter of 60 mm and height of 60 mm was employed (Fang et al., 2023; Zhang et al., 2023). After well mixed, the BSS was promptly poured into the cone, and the cone was swiftly lifted to initiate the flow of BSS. After the BSS came to a halt, the spread diameter was measured by considering two perpendicular crossed diameters, as shown in Figure 2. The entire experimental process conformed to the standard GB/T 8077-2012 (GB/T 8077, 2012).
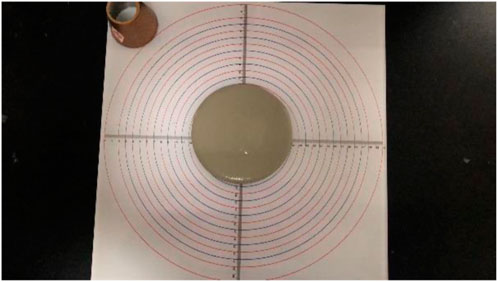
Figure 2. The fluidity test of slurry.
Eight minutes after the water-powder mixture, which included YM, TM, or DC, came into contact, the BSS underwent rheological testing using a Brookfield rheometer (Brookfield RST, United States) equipped with a VT-40-20 vane spindle. The shear process of the rheological test is as follows. Initially, the BSS underwent pre-shearing at a shear rate of 150 s−1 for 0.5 min. Subsequently, the shear rate was gradually increased from zero to 150 s−1. Data points were recorded every second. To mitigate the impact of plug flow on the rheological testing process, data within the range of 50–150 s−1 were used to construct the shear stress-shear rate curve of the BSS. Figure 3 shows the rheological test of slurry, The experiments revealed that BSS exhibits a discernible yield stress and either shear thickening or shear thinning characteristics. Both the modified Bingham model and the Herschel-Bulkley model can describe fluids with yield stress and shear thickening or shear thinning features (Song et al., 2023; Zhaidarbek et al., 2023). Several studies (Savage and Sayed, 1984; Chen and Ling, 1996; Feys et al., 2009; Li et al., 2021) have indicated that the quadratic term in the modified Bingham model lacks practical physical significance when describing shear thickening behavior in fluids. Additionally, in this study, the use of the modified Bingham model to fit the rheological data of BSS revealed that some samples exhibited a decrease in shear stress as the shear rate increased when the shear stress was close to zero, as illustrated in Figure 4. This phenomenon significantly reduces the reliability of calculating the yield stress of BSS. Therefore, this paper utilizes the Herschel-Bulkley model to characterize the rheological properties of BSS. The rheological expression for the Herschel-Bulkley model is provided in Eq. 1 (Basso and Franco, 2024; Bui and Luong, 2024).
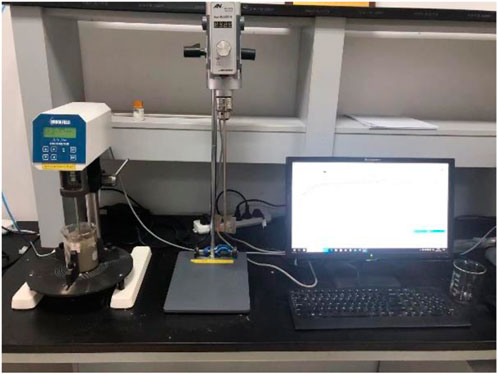
Figure 3. Rheological test of slurry.
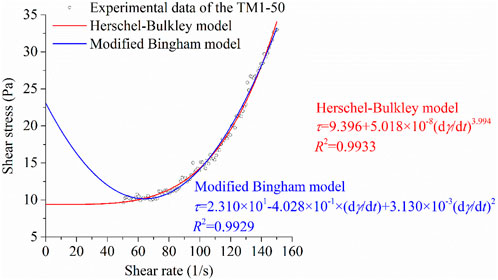
Figure 4. Rheological data of the TM1-50 and the rheological curves fitted by the modified Bingham model and the Herschel-Bulkley model.
Where τ is shear stress (Pa); τ0 is yield stress (Pa); γ is shear strain (−); dγ/dt is shear rate (s−1); κ is the consistency coefficient (Pa·sn); and n is the consistency index (−).
For fluids that exhibit yield stress and shear-thickening or shear-thinning behavior, the viscosity of the fluid is often represented by the differential viscosity. In the Herschel-Bulkley model, the formula for calculating differential viscosity is provided in Eq. 2. When the parameter n deviates from 1, the fluid demonstrates shear-thickening or shear-thinning behavior. In this case, the differential viscosity varies with changes in shear rate and it is not a fixed value. When the parameter n equals 1, the Herschel-Bulkley model transforms into the Bingham model, and the differential viscosity becomes the plastic viscosity, which maintaining a constant value that remains unaffected by changes in shear rate.
Where ηd is differential viscosity (Pa·s).
For the bleeding test, thoroughly mixed slurry was poured into a conical flask, ensuring that the slurry surface remained below the flask’s opening, and the flask was sealed to prevent moisture evaporation. The entire operation was completed within 8 min of water coming into contact with the powder materials. The timing began when water and powder materials came into contact, and subsequently, at 15-minute, 30-minute, and 60-minute intervals, a straw was used to extract the bleeding water. Each collected sample of bleeding water was transferred to a graduated cylinder with a stopper. The bleeding rate of the slurry was calculated according to Eq. 3. (Li et al., 2023d; Wang et al., 2023).
where B is the bleeding rate (%); W1 is the total water absorbed (g); W is the amount of water used in the slurry mixture (g); m is the total mass of the slurry mixture (g); m1 is the mass of the conical flask and sample (g); and m2 is the mass of the conical flask (g).
Figure 5 illustrates the influence of mass concentration on the fluidity of BSS. It is evident that the fluidity of BSS decreases with an increase in mass concentration, primarily due to the reduced water content in high-concentration slurries (Fang et al., 2023; Zhang et al., 2023). It is worth noting that the influence of slurry mass concentration on the fluidity of BSS varies depending on the different raw materials used in its preparation. Taking slurry YM-53 as a reference, slurry YM-56 exhibited a 7.17% reduction in fluidity, while the fluidity of slurry YM-56 exceeded 210 mm. This indicates that the fluidity of slurries YM-53 and YM-56 is quite similar, and both exhibit relatively high fluidity. Compared to slurry YM-53, the fluidity of slurries YM-59 and YM-62 decreases by 36.52% and 50.87%, respectively. Notably, the fluidity of slurry YM-59 approaches 150 mm, while the fluidity of slurry YM-62 exhibits less than 115 mm. This suggests that when the mass concentration of slurry YM reaches 59% or higher, a significant reduction in fluidity occurs.
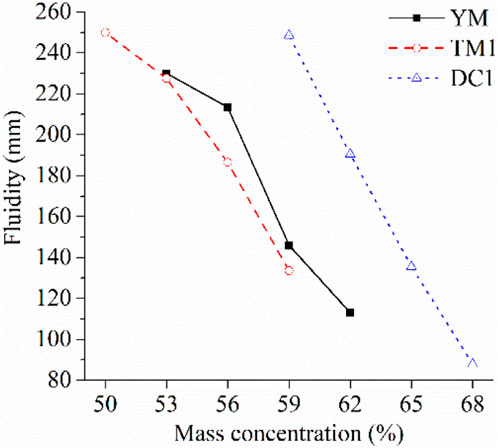
Figure 5. Effect of mass concentration on the fluidity of BSS.
Taking slurry TM1-50 as a reference, the fluidity of slurries TM1-53, TM1-56 and TM1-59 decreases by 9.00%, 25.40% and 46.60%, respectively. Notably, the fluidity of slurry TM1-56 surpasses 180 mm, while the fluidity of slurry TM1-59 approached 130 mm. With an increase in mass concentration, the reduction in fluidity of slurries TM1 becomes more pronounced.
Taking slurry DC1-59 as a reference, the fluidity of slurries DC1-62, DC1-65 and DC1-68 decreases by 23.34%, 45.47% and 64.59%, respectively. Significantly, slurry DC1-62 shows a fluidity exceeding 190 mm, while slurry DC1-65 demonstrates fluidity approaching 135 mm, and slurry DC1-68 falls below 90 mm. Even a slight increase in mass concentration results in a substantial decrease in fluidity for slurries DC1.
Figure 6 illustrates the relationship between shear stress and shear rate for BSS at different mass concentrations. In Figure 6A, Taking slurry YM-53 as a reference, at the same shear rate, the shear stress of slurry YM-56 is slightly higher than that of slurry YM-53, while the shear stress of slurry YM-59 is several times that of slurry YM-53, and slurry YM-62’s shear stress is several times that of slurry YM-59. This trend aligns with the observed effect of mass concentration on the fluidity of slurry YM, as presented in Figure 5A.
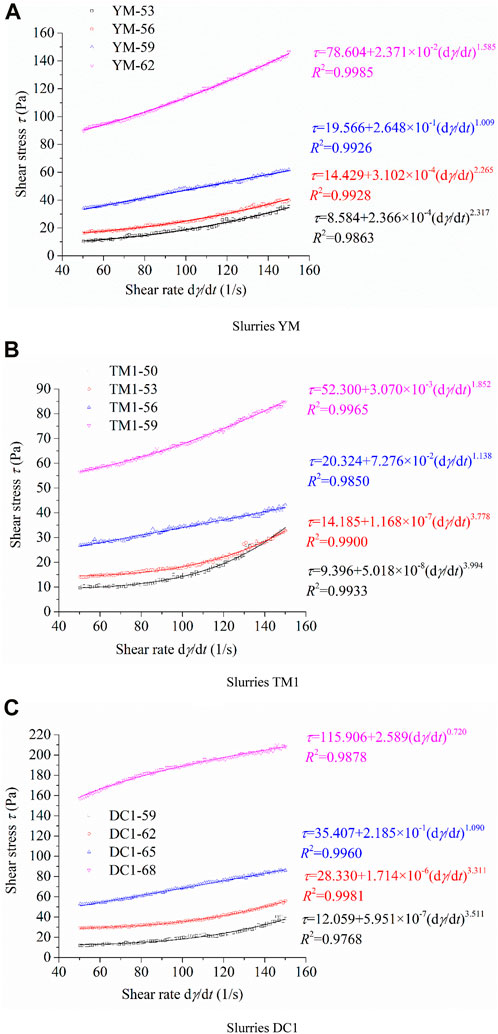
Figure 6. Relationship between shear stress and shear rate of BSS with different mass concentrations. (A) Slurries YM. (B) Slurries TM1. (C) Slurries DC1.
In Figure 6B, taking slurry TM1-50 as a reference, when the shear rate is below 140 1/s, slurry TM1-53 shows slightly higher shear stress compared to slurry TM1-50 at the same shear rate. However, at shear rates exceeding 140 1/s, the shear stress for slurry TM1-53 becomes slightly lower than that of slurry TM1-50 at the same shear rate. Additionally, at the same shear rate, the shear stress of slurry TM1-56 is significantly higher than that of slurry TM1-53, and the shear stress of slurry TM1-59 is much higher than that of slurry TM1-56. These observations correspond with the influence of mass concentration on the fluidity of slurry TM1, as shown in Figure 5B.
In Figure 6C, at the same shear rate, slurry DC1-62 shows higher shear stress compared to slurry DC1-59, slurry DC1-65 has higher shear stress than slurry DC1-62, and slurry DC1-68 has significantly higher shear stress than slurry DC1-65. These trends are consistent with the effect of mass concentration on the fluidity of slurries DC1, as presented in Figure 5C.
The fluidity of the slurries is closely related to their yield stress. In general, the lower the fluidity of a slurry, the higher its yield stress (Luo et al., 2019; Dong et al., 2023). Yield stress represents the minimum stress required for the slurry to initiate flow (Qian and Kawashima, 2018; Rubio-Hernández et al., 2020). However, the flow performance of the slurries is not solely determined by yield stress but also depends on their viscosity and the degree of shear-thickening or shear-thinning (Zhu et al., 2022; Shen et al., 2024). To gain a more comprehensive understanding of the rheological properties of BSS, the data in Figure 6 were further analyzed. The rheological parameters of the slurry were calculated by fitting the data with the Herschel-Bulkley model. It is observed that the fitting curves exhibit correlation coefficients exceeding 0.97, indicating the suitability of using the Herschel-Bulkley model to characterize the rheological behavior of BSS, as demonstrated in Figure 6.
Figure 7 depicts the effects of mass concentration on the yield stress, consistency coefficient, and consistency index of BSS. In Figure 7A, it is evident that, as mass concentration increases, the yield stress of slurry YM continuously rises. When the mass concentration increases from 53% to 59%, the yield stress of slurry YM gradually increases from 8.584 MPa to 19.566 MPa. Further increasing the mass concentration to 62% leads to a sharp rise in the yield stress of slurry YM, reaching 78.604 MPa. The impact of mass concentration on the yield stress of slurry YM aligns with its effect on fluidity. As mass concentration increases, the consistency coefficient of slurry YM initially rises and then decreases, while the consistency index first decreases and subsequently increases. Within the Herschel-Bulkley model, the consistency index n serves as a key indicator of whether the fluid displays shear thickening or shear thinning behavior (Liu et al., 2020; Ji et al., 2023). When the consistency index n exceeds 1, it signifies shear thickening within the fluid. Furthermore, a higher value of the consistency index n indicates a more pronounced degree of shear thickening. Conversely, when the consistency index n falls between 0 and 1, it is indicative of shear thinning in the fluid. The closer the consistency index n approaches zero, the more pronounced the shear thinning behavior becomes. In cases where the consistency index n equals 1, this corresponds to the Bingham model, wherein the slurry’s viscosity remains constant, irrespective of changes in shear stress (Liu et al., 2020; Ji et al., 2023). Notably, the consistency index n for slurry YM consistently exceeds 1, signifying shear thickening characteristics. As the slurry mass concentration increases, the degree of shear thickening initially diminishes before rebounding. At a mass concentration of 59%, the consistency index of slurry YM is 1.009, nearing the value of 1. At this juncture, the slurry does exhibit shear thickening behavior, albeit to a lesser extent.
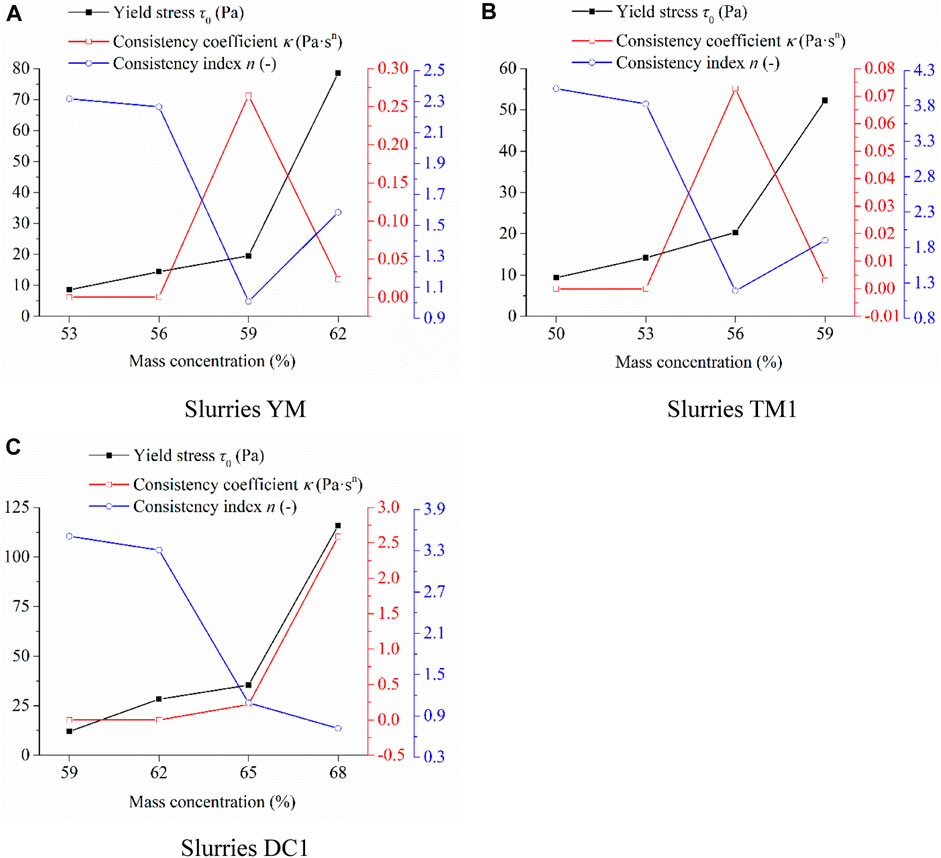
Figure 7. Effect of mass concentration on Herschel-Bulkley model parameters of BSS. (A) Slurries YM. (B) Slurries TM1. (C) Slurries DC1.
In Figure 7B, as the slurry mass concentration increases, the yield stress of slurry TM1 consistently rises. Taking slurry TM1-50 as a reference, the yield stress of slurry TM1-53, TM1-56 and TM1-59 increases by 50.97%, 116.30% and 456.62%, respectively. The growth in yield stress of slurry TM1 becomes more pronounced with increasing mass concentration, aligning with the observed pattern of mass concentration’s impact on the fluidity of slurry TM1. Furthermore, with increasing mass concentration, the consistency index of slurry TM1 initially rises before tapering off. The consistency index n of slurry TM1 consistently exceeds 1, signifying shear thickening behavior. As the slurry mass concentration increases, the extent of shear thickening in slurry TM1 initially decreases before rising again. At a mass concentration of 56%, the consistency index of slurry TM1 is 1.138, approaching 1, indicating a relatively lower degree of shear thickening at this point.
In Figure 7C, it is evident that as the slurry mass concentration increases, the yield stress of slurry DC1 continuously rises. Taking slurry DC1-59 as a reference, the yield stress of slurry DC1-62, DC1-65 and DC1-68 increases by 134.93%, 193.61% and 861.15%, respectively. The yield stress of slurry DC1-68 is significantly higher than that of slurry DC1-59, DC1-62 and DC1-65. Therefore, a minor increase in mass concentration leads to a substantial increase in the yield stress of slurry DC1, aligning with the observed pattern in the impact of mass concentration on slurry DC1’s fluidity. As the slurry mass concentration increases, the consistency coefficient of slurry DC1 steadily rises, while the consistency index decreases continuously. The consistency indices of slurries DC1-59 and DC1-62 both exceed 3, indicating that these slurries exhibit significant shear thickening. Slurry DC1-65 has a consistency index of 1.090, approaching 1, suggesting that although it exhibits shear thickening, and the effect is not pronounced. Slurry DC1-68 has a consistency index less than 1, signifying shear-thinning behavior.
Figure 8 depicts the influence of mass concentration on the differential viscosity of BSS. As shown in Figure 8A, the differential viscosity of both BSS samples, YM-53 and YM-56, increases with higher shear rates. Furthermore, the “differential viscosity vs shear rate” curves for these two samples nearly coincide. This not only confirms the shear-thickening behavior exhibited by YM-53 and YM-56 but also implies that their differential viscosities are roughly equivalent. In contrast, the differential viscosity of slurry YM-59 remains almost constant as shear rate increases. The “differential viscosity vs shear rate” curve for slurry YM-59 approximates a horizontal line, primarily due to its consistency index n approaching 1. Meanwhile, for slurry YM-62, the differential viscosity rises as shear rate increases, indicating shear-thickening characteristics. Notably, the differential viscosity of slurry YM-62 significantly surpasses that of slurries YM-53, YM-56, and YM-59. Furthermore, slurry YM-62 exhibits a much higher yield stress than slurries YM-53, YM-56, and YM-59 (as illustrated in Figure 7A). Consequently, the flow performance of slurry YM-62 is considerably inferior to that of slurries YM-53, YM-56, and YM-59.
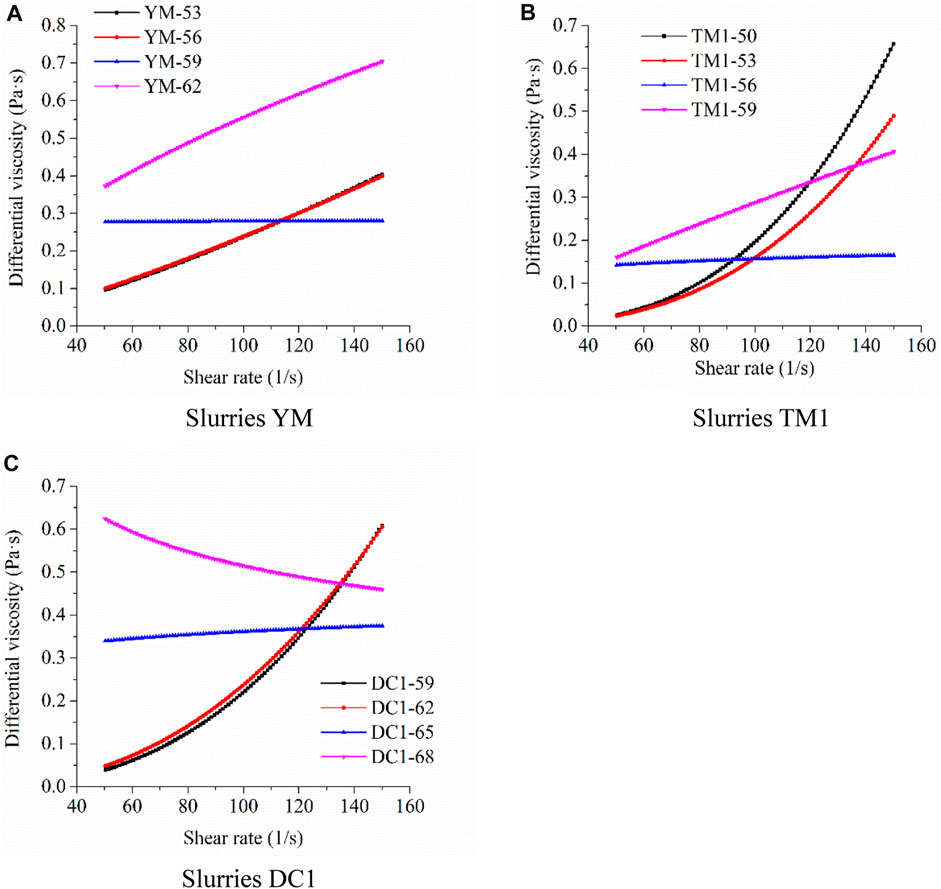
Figure 8. Effect of mass concentration on the differential viscosity of BSS. (A) Slurries YM. (B) Slurries TM1. (C) Slurries DC1.
In Figure 8B, it is evident that both slurries TM1-50 and TM1-53 exhibit an increase in their differential viscosity as the shear rate escalates. Moreover, the rate at which the differential viscosity augments in response to higher shear rates experiences a significant boost. This behavior can be attributed to the pronounced shear-thickening characteristics displayed by slurries TM1-50 and TM1-53, which is substantiated by their considerably high consistency indexes, both exceeding 3.5. Conversely, slurry TM1-56 demonstrates a more gradual increment in its differential viscosity with the increasing shear rate. Its “differential viscosity vs shear rate” curve closely resembles a nearly horizontal line. This phenomenon predominantly stems from slurry TM1-56’s lower degree of shear-thickening, indicated by a consistency index that approximates 1. Furthermore, slurry TM1-59’s differential viscosity demonstrates a near-linear increase in response to variations in shear rate. At lower shear rates, the differential viscosity of slurries TM1-56 and TM1-59 surpasses that of slurries TM1-50 and TM1-53. However, at higher shear rates, the differential viscosity of slurries TM1-56 and TM1-59 is lower than that of slurries TM1-50 and TM1-53. Consequently, the differential viscosity in TM-incorporated BSS is intricately intertwined with both mass concentration and shear rate.
Figure 8C illustrates that the differential viscosity of slurries DC1-59 and DC1-62 increases with shear rate, with their “differential viscosity vs shear rate” curves nearly overlapping. This not only confirms the shear-thickening behavior of these slurries but also suggests that the differential viscosities of slurries DC1-59 and DC1-62 are nearly identical. In the case of slurry DC1-65, its differential viscosity remains almost constant, and its “differential viscosity vs shear rate” curve approximates a horizontal line, mainly due to the consistency index n of slurry DC1-65 nearing 1. Conversely, the differential viscosity of slurry DC1-68 decreases as shear rate increases, indicating shear-thinning behavior, which aligns with the consistency index n being less than 1. At lower shear rates, the differential viscosity of slurries DC1-65 and DC1-68 exceeds that of DC1-59 and DC1-62. However, at higher shear rates, the differential viscosity of slurries DC1-65 and DC1-68 is lower compared to DC1-59 and DC1-62.
Figure 9 provides insights into the impact of slurry mass concentration on the bleeding rate of BSS. In Figure 9A, it is clear that the bleeding rate of slurry YM increases linearly with time. Remarkably, slurry YM-62 maintains a bleeding rate of 0 throughout 1 hour, possibly due to its higher concentration. As the mass concentration of slurry YM decreases, the bleeding rate gradually rises. Taking slurry YM-59 as a reference, the bleeding rates of slurry YM-56 and slurry YM-53 increase by 107.49% and 314.98%, respectively, at the one-hour mark. This highlights the significant influence of mass concentration on the bleeding rate of slurry YM. Even a slight reduction in mass concentration results in a considerable increase in the bleeding rate of slurries YM.
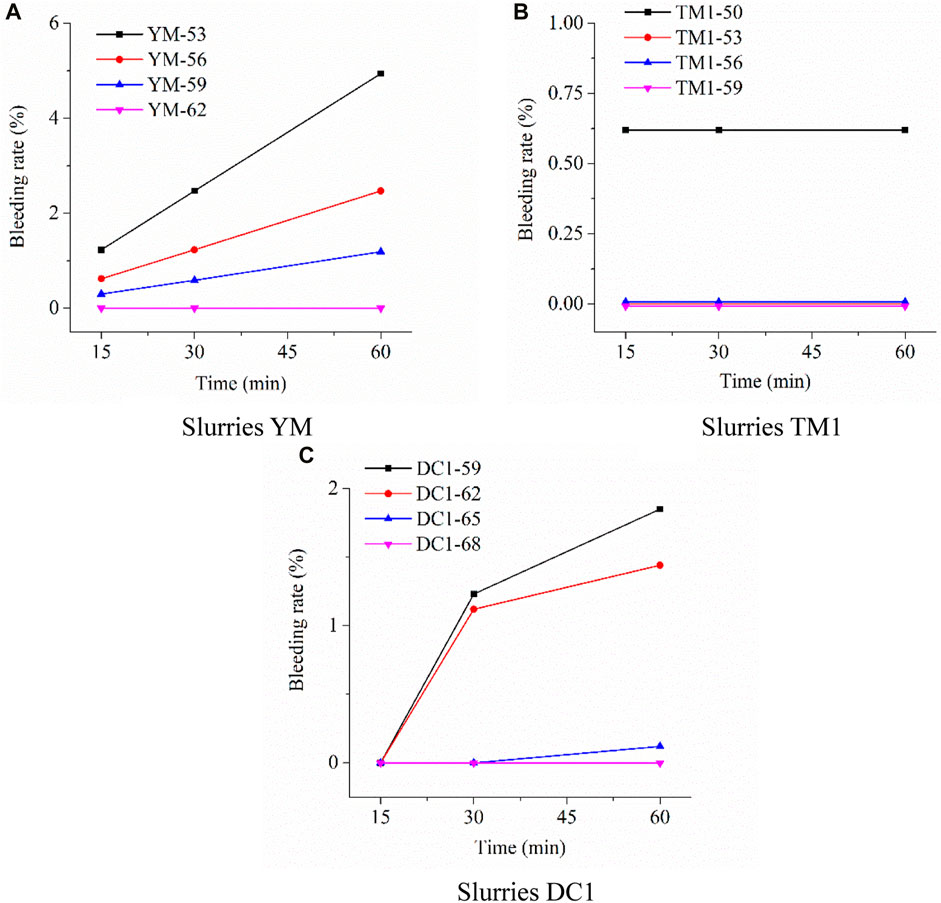
Figure 9. Effect of mass concentration on the bleeding rate of BSS. (A) Slurries YM. (B) Slurries TM1. (C) Slurries DC1.
In Figure 9B, it is worth noting that slurries TM1-53, TM1-56 and TM1-59 exhibit no bleeding within the first hour. This suggests that slurry TM1 does not experience bleeding phenomena during the initial hour when the mass concentration exceeds 53%. Slurry TM1-50 shows a bleeding rate of 0.62% at 15 min, which remains constant at 30 and 60 min. Consequently, BSS containing TM demonstrate excellent water-retention properties.
Figure 9C reveals that slurry DC1-68 consistently maintains a bleeding rate of 0 throughout 1 hour, likely due to its higher concentration. Slurry DC1-65 shows no bleeding at 15 and 30 min and only a minimal bleeding rate of 0.12% at 60 min, which remains at a relatively low level. In contrast, slurry DC1-59 and slurry DC1-62 exhibit no bleeding at 15 min, but by the 30-min mark, the bleeding rate for both surpasses 1%. Furthermore, at the 60-min point, the bleeding rates for slurry DC1-59 and slurry DC1-62 continue to rise.
Figure 10 illustrates the influence of introducing 50% TM or DC into the dry powder ingredients used for preparing BSS under identical mass concentration conditions on the fluidity. In Figure 10A, it is evident that at a mass concentration of 53%, the fluidity of slurry TM1 is slightly lower than that of the slurry YM. As the mass concentration increases to 56% and 59%, slurry TM1 exhibits significantly lower fluidity compared to the slurry YM.
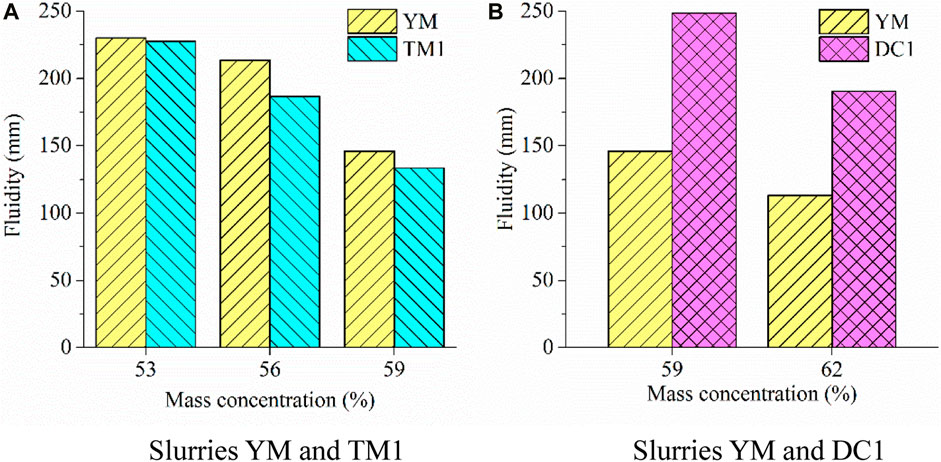
Figure 10. Effect of TM or DC incorporation on the fluidity of BSS at the same mass concentrations. (A) Slurries YM and TM1. (B) Slurries YM and DC1.
Figure 10B reveals that at a mass concentration of 59%, introducing 50% DC into the dry powder ingredients used for slurry preparation significantly increases the fluidity of the slurry by 70.21% compared to the slurry without DC. Similarly, at a mass concentration of 62%, incorporating 50% DC into the dry powder ingredients results in a 68.58% higher fluidity compared to the slurry without DC. Therefore, the addition of DC substantially enhances the fluidity of the slurry.
Figure 11 depicts the influence of introducing 50% TM or DC into the dry powder material used for slurry preparation on the relationship between shear stress and shear rate within the slurries. In Figure 11A, at a mass concentration of 53%, when the shear rate is below 90 1/s, slurry TM1 exhibits higher shear stress than slurry YM at equivalent shear rates. However, at shear rates exceeding 90 1/s, slurry TM1 demonstrates lower shear stress than slurry YM at the same shear rates. At mass concentrations of 56% and 59%, slurry TM1’s shear stress surpasses that of slurry YM at the same shear rate. This trend aligns with the effect of incorporating TM on the fluidity of BSS under similar mass concentration conditions, as depicted in Figure 10A.
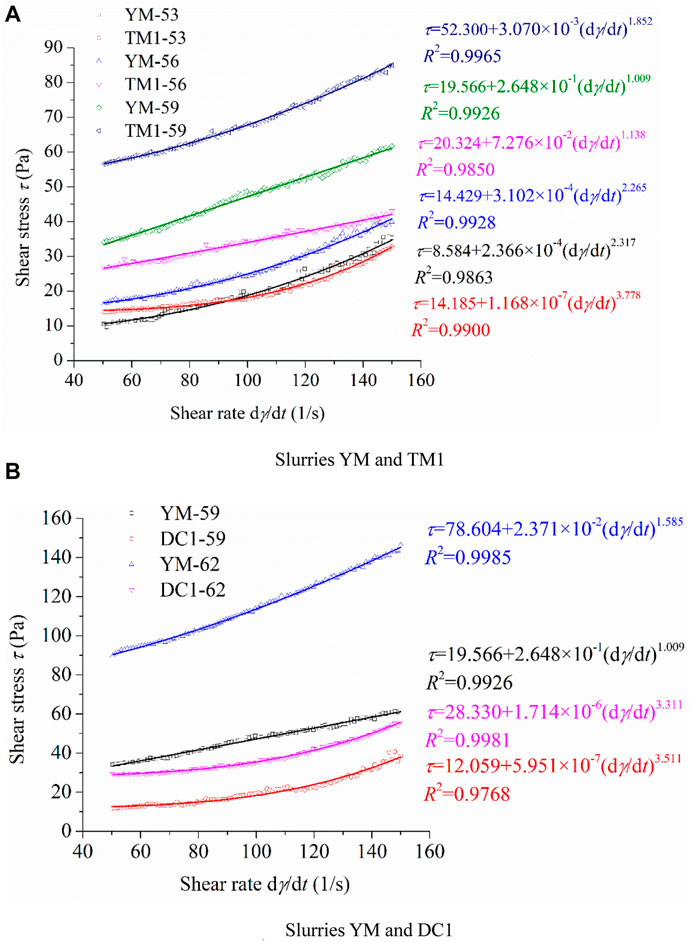
Figure 11. Effect of TM or DC incorporation on the relationship between shear stress and shear rate of BSS at the same mass concentrations. (A) Slurries YM and TM1. (B) Slurries YM and DC1.
Figure 11B reveals that at a mass concentration of 59%, the shear stress in slurry DC1 is lower than that in slurry YM at the same shear rate. When the mass concentration is 62%, slurry DC1’s shear stress is significantly lower than that in slurry YM at the same shear rate. This pattern corresponds with the impact of adding DC on the fluidity of BSS under analogous mass concentration conditions, as presented in Figure 10B.
To further explore the influence of incorporating TM or DC on the rheological properties of BSS, the rheological data in Figure 11 were subjected to fitting based on the Herschel-Bulkley model, and the rheological parameters of the slurries were calculated. It is evident from Figure 11 that the correlation coefficients of the fitted curves all exceed 0.97.
Figure 12 illustrates the influence of incorporating 50% TM into the dry powder material used for slurry preparation on BSS’s yield stress, consistency coefficient and consistency index under consistent mass concentration conditions. As depicted in Figure 12A, at equivalent mass concentrations, the introduction of 50% TM leads to an increase in the slurry’s yield stress. At mass concentrations of 53% and 56%, the addition of TM results in yield stress increments of 65.26% and 40.86%, respectively. Notably, at a mass concentration of 59%, the incorporation of TM leads to a substantial 167.30% elevation in the slurry’s yield stress.
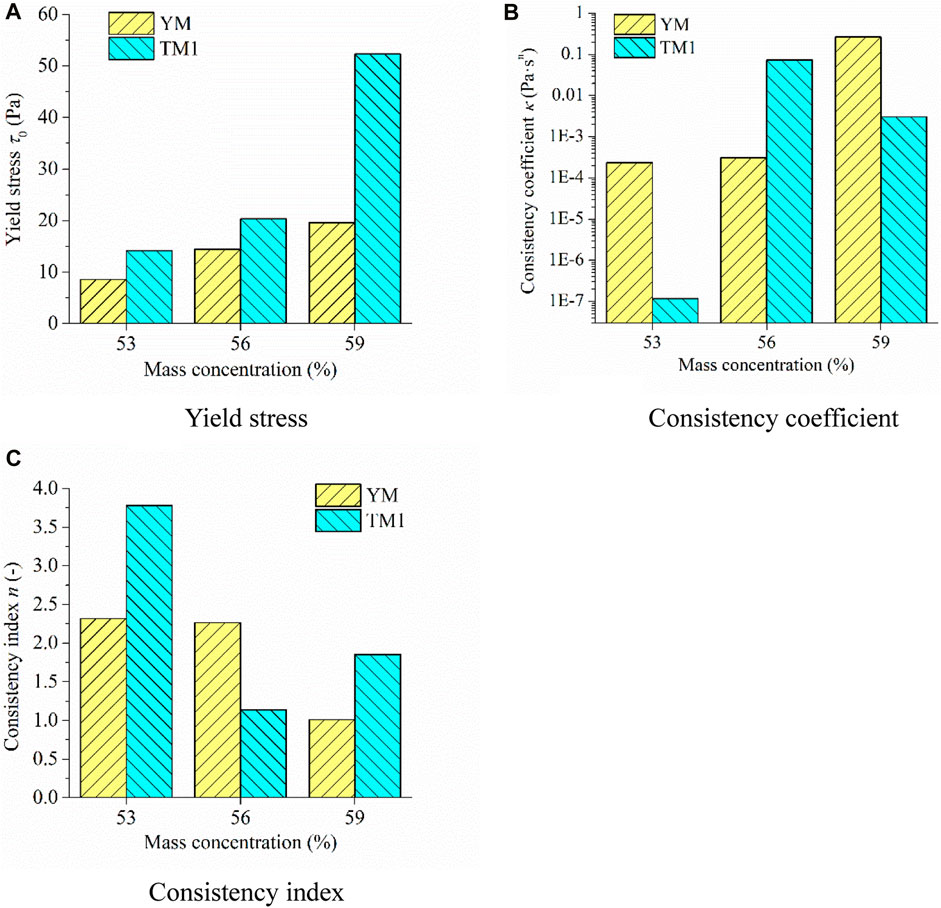
Figure 12. Effect of TM incorporation on Herschel-Bulkley model of BSS at the same mass concentrations. (A) Yield stress. (B) Consistency coefficient. (C) Consistency index.
As depicted in Figure 12B, it becomes apparent that, under the same mass concentration conditions, the impact of introducing 50% TM into the dry powder material on the slurry’s consistency coefficient is notably intricate. When the mass concentration is at 53% and 59%, the consistency coefficient of the TM-added slurry is significantly lower compared to the slurry without TM. In contrast, at a mass concentration of 56%, the TM-incorporated slurry exhibits a considerably higher consistency coefficient than the slurry without TM.
Figure 12C unveils that all slurry samples consistently maintain a consistency index above 1, indicative of shear-thickening behavior. The consistency index for both slurries YM-59 and TM1-56 closely hovers around 1, implying that these two sets of slurries indeed exhibit shear-thickening tendencies, albeit not to a highly pronounced degree. Specifically, at mass concentrations of 53% and 59%, the introduction of TM leads to a substantial increase in the consistency index, signifying an augmentation in the degree of shear-thickening. However, at a mass concentration of 56%, the inclusion of TM results in a notable decrease in the consistency index, signifying a reduction in the extent of shear-thickening.
Figure 13 illustrates the impact of introducing 50% DC into the dry powder material on BSS yield stress, consistency coefficient, and consistency index under the same mass concentration conditions. At a mass concentration of 59%, the addition of DC leads to a significant 38.37% reduction in the slurry’s yield stress. The consistency coefficient experiences a remarkable decrease of approximately six orders of magnitude, while the consistency index increases by a factor of 2.48. When the mass concentration is 62%, the introduction of DC results in a substantial 63.96% reduction in the slurry’s yield stress. The consistency coefficient decreases by around five orders of magnitude, and the consistency index increases by 1.09 times. Therefore, under equivalent mass concentration conditions, incorporating 50% DC into the dry powder material substantially lowers the yield stress, significantly reduces the consistency coefficient, markedly enhances the consistency index, and improves the degree of shear-thickening.
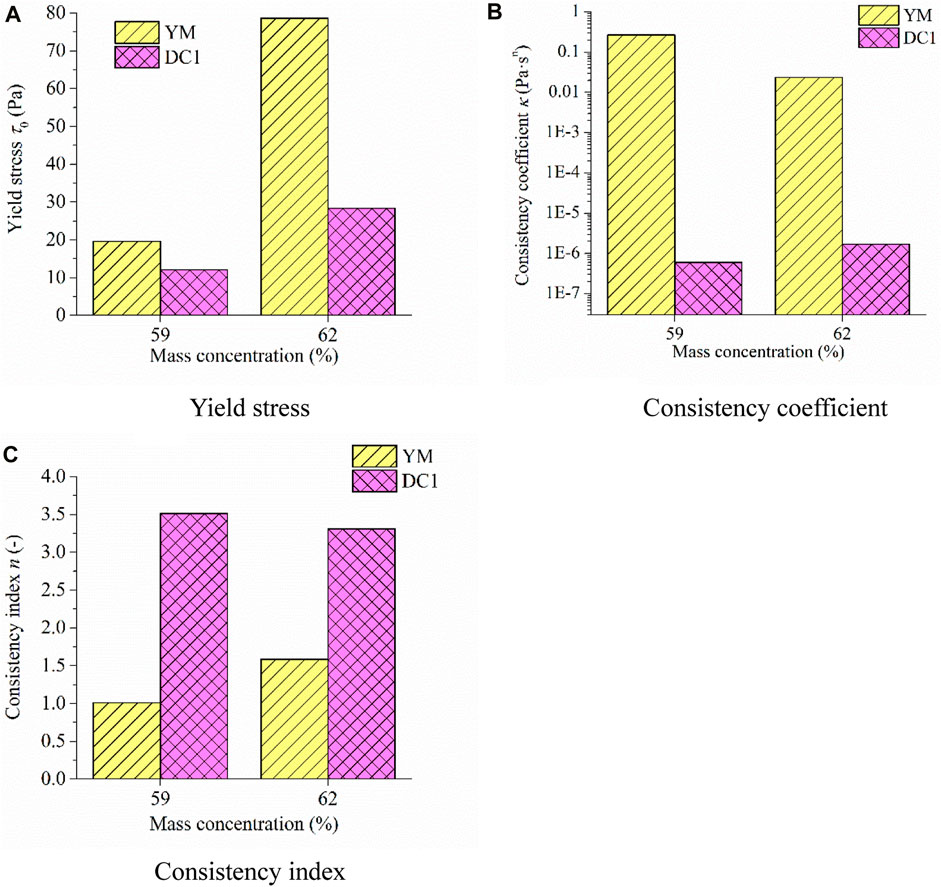
Figure 13. Effect of DC incorporation on rheological parameters of BSS at the same mass concentrations. (A) Yield stress. (B) Consistency coefficient. (C) Consistency index.
Figure 14 illustrates how the inclusion of 50% TM or DC in the dry powder material impacts BSS differential viscosity under consistent mass concentration conditions. In Figure 14A, it is evident that at mass concentrations of 53% and 59%, when shear rates are relatively low, the slurry with TM exhibits lower differential viscosity compared to the TM-free slurry. However, at higher shear rates, the slurry with TM shows higher differential viscosity than the TM-free slurry. At a mass concentration of 56%, for low shear rates, the slurry with TM displays higher differential viscosity than the TM-free slurry, while at higher shear rates, the slurry with TM demonstrates lower differential viscosity than the TM-free slurry.
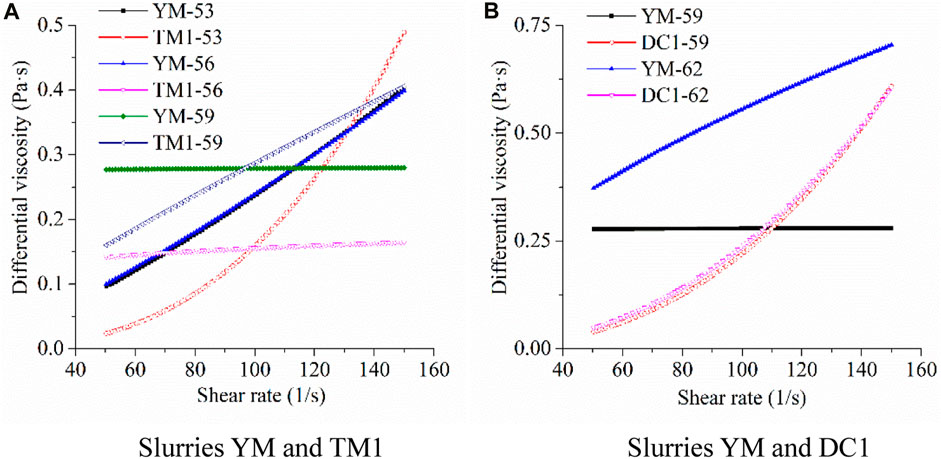
Figure 14. Effect of TM or DC incorporation on the differential viscosity of BSS at the same mass concentrations. (A) Slurries YM and TM1. (B) Slurries YM and DC1.
Figure 14B reveals that at a mass concentration of 59%, for lower shear rates, the slurry with DC displays lower differential viscosity compared to the DC-free slurry, while at higher shear rates, the slurry with DC exhibits higher differential viscosity than the DC-free slurry. At a mass concentration of 62%, the slurry with DC exhibits lower differential viscosity than the DC-free slurry.
Figure 15 presents the impact of introducing 50% of TM or DC into dry powder material during the preparation of BSS slurries on the bleeding rate under consistent mass concentration conditions. In Figure 15A, it is evident that slurry samples YM-53, YM-56 and YM-59 exhibit a certain level of bleeding rate at 15 min. As time progresses to 30 min and 60 min, the bleeding rates for these samples steadily increase. In contrast, slurry samples TM1-53, TM1-56 and TM1-59 consistently maintain a bleeding rate of 0 at 15 min, 30 min, and 60 min. Therefore, regardless of the slurry’s mass concentration, the addition of TM significantly reduces the bleeding rate.
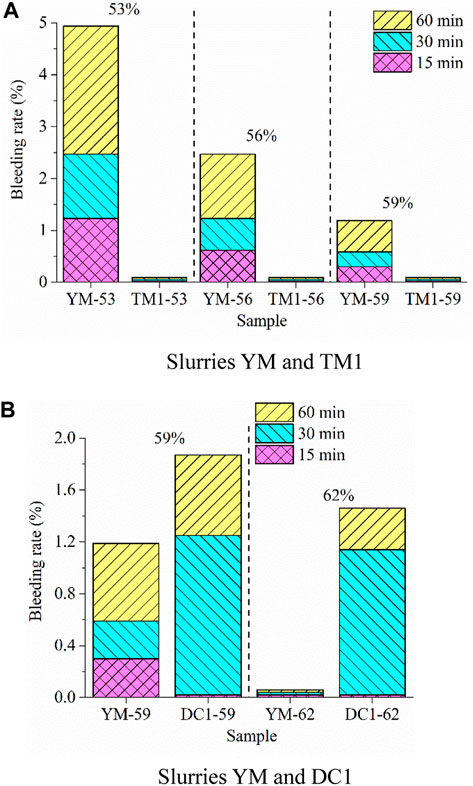
Figure 15. Effect of TM or DC incorporation on the bleeding rate of BSS at the same mass concentrations. (A) Slurries YM and TM1. (B) Slurries YM and DC1.
Figure 15B demonstrates that, at a mass concentration of 59%, the slurry YM without DC shows a certain bleeding rate at 15 min, which continues to increase at 30 min and 60 min. In contrast, the slurry with DC, despite exhibiting a bleeding rate of 0 at 15 min, displays significantly higher bleeding rates at 30 min and 60 min compared to the slurry YM. At a mass concentration of 62%, the slurry YM maintains a bleeding rate of 0 at 15 min, 30 min and 60 min. However, for slurries containing DC, although the bleeding rate is 0% at 0 min and 15 min, it can reach 1.12% at 30 min and 1.44% at 60 min. Therefore, regardless of the slurry’s mass concentration, the addition of DC significantly increases the bleeding rate.
Figure 16 illustrates how different TM/YM and DC/YM ratios affect the fluidity of BSS. In Figure 16A, it becomes apparent that as the TM/YM ratio increases, the fluidity of the BSS consistently decreases. Taking slurry YM-53 as a reference, the fluidity of slurry samples TM1-53, TM3-53, TM5-53 and TM7-53 decreased by 1.09%, 15.65%, 18.91% and 24.57%, respectively. However, when the TM/YM ratio exceeds 3, the impact of increasing the TM/YM ratio on the fluidity of the BSS becomes less pronounced.

Figure 16. Effect of TM/YM and DC/YM on the fluidity of BSS. (A) TM/YM. (B) DC/YM.
Figure 16B demonstrates that as the DC/YM ratio increases, the fluidity of the BSS continuously increases. Taking slurry YM-62 as a reference, the fluidity of slurry samples DC1-62, DC3-62, DC5-62 and DC7-62 increased by 68.58%, 96.02%, 104.42% and 112.83%, respectively. Nevertheless, when the DC/YM ratio exceeds 3, the effect of increasing the DC/YM ratio on the fluidity of the BSS becomes less significant.
Figure 17 illustrates the relationship between shear stress and shear rate in BSS with varying TM/YM and DC/YM ratios. In Figure 17A, it is evident that as the TM/YM ratio increases from 1 to 7, the shear stress of the slurry consistently rises at the same shear rate. When compared to slurry YM-53, the inclusion of TM results in higher shear stress at lower shear rates and lower shear stress at higher shear rates.
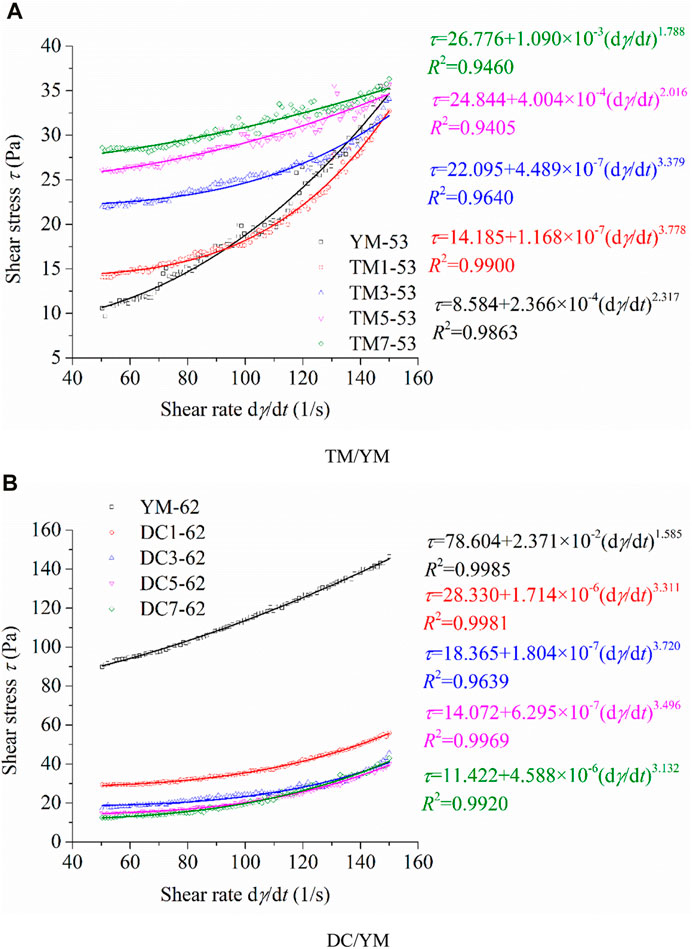
Figure 17. Effect of TM/YM and DC/YM on the relationship between shear stress and shear rate of BSS. (A) TM/YM. (B) DC/YM.
Figure 17B reveals that with an increase in the DC/YM ratio, the shear stress of the slurry at the same shear rate progressively decreases. However, when the DC/YM ratio surpasses 3, the effect of elevating the DC/YM ratio on the shear stress of the slurry at the same shear rate becomes less pronounced. This pattern aligns with the impact of DC/YM ratios on the fluidity of BSS.
Figure 18 illustrates how different TM/YM and DC/YM ratios impact the yield stress, consistency coefficient and consistency index of the BSS. In Figure 18A, it is evident that an increase in the TM/YM ratio leads to a continuous rise in the slurry’s yield stress. Moreover, when the TM/YM ratio exceeds 3, the effect of increasing the TM/YM ratio on the BSS’s yield stress becomes less significant. This pattern mirrors the impact of TM/YM ratios on the slurry’s fluidity (Figure 16A). As the TM/YM ratio gradually increases from 1 to 7, the slurry’s consistency coefficient steadily rises, while the consistency index decreases, resulting in a reduced level of shear-thickening in the slurry. Notably, when compared to slurry YM-53, slurry TM1-53 exhibits a lower consistency coefficient and a higher consistency index.
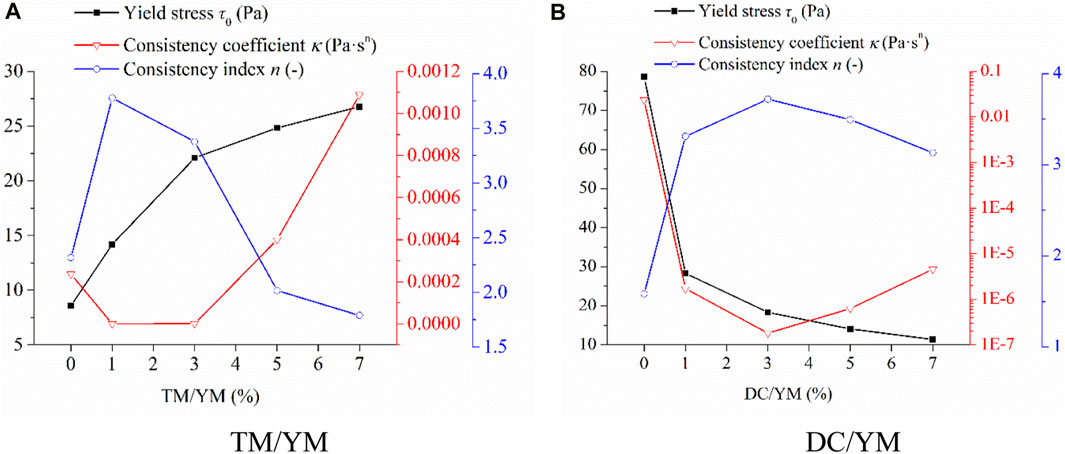
Figure 18. Effect of TM/YM and DC/YM on Herschel-Bulkley model of BSS. (A) TM/YM. (B) DC/YM.
In Figure 18B, it is demonstrated that as the DC/YM ratio increases, the yield stress of the slurry consistently decreases. Furthermore, when the DC/YM ratio surpasses 3, the increase in the DC/YM ratio has a less significant impact on reducing the yield stress of the BSS. This trend aligns with the impact of DC/YM ratios on the slurry’s fluidity (Figure 16B). With an increase in the DC/YM ratio, the slurry’s consistency coefficient initially decreases and then increases, while the consistency index initially increases and then decreases. Among the slurries YM-62, DC1-62, DC3-62, DC5-62 and DC7-62, slurry DC3-62 exhibits the lowest consistency coefficient and the highest consistency index.
Figure 19 illustrates the impact of different TM/YM and DC/YM ratios on the differential viscosity of the slurry. In Figure 19A, both slurries YM-53 and TM-53 exhibit an increase in differential viscosity with an increase in shear rate, indicating shear-thickening behavior in both cases. This observation aligns with the fitting results, where consistency indexes greater than 1 are found for these slurries. When compared to slurry YM-53, TM1-53 shows lower differential viscosity at lower shear rates and higher differential viscosity at higher shear rates. Furthermore, slurries TM3-53, TM5-53 and TM7-53, with higher TM/YM ratios, demonstrate significantly lower differential viscosity than slurry YM-53. As the TM/YM ratio gradually increases from 1 to 7, the differential viscosity of the slurry exhibits minimal variation at low shear rates but decreases as the TM/YM ratio increases at high shear rates. This supports the trend of reduced shear-thickening behavior with increasing TM/YM ratio (Figure 18A).
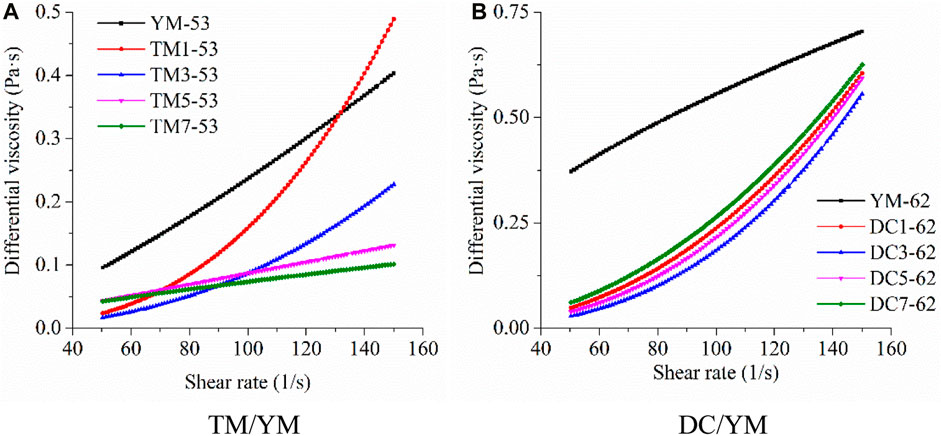
Figure 19. Effect of TM/YM and DC/YM on the differential viscosity of BSS. (A) TM/YM. (B) DC/YM.
In Figure 19B, both slurries YM-62 and DC-62 display an increase in differential viscosity with an increasing shear rate, signifying shear-thickening behavior in these slurries. This aligns with the fitting results, which indicate consistency indexes greater than 1 for these slurries. As the DC/YM ratio increases, the differential viscosity of the slurry, at the same shear rate, initially decreases and then increases. Slurry DC3-62 exhibits the lowest differential viscosity. For slurries containing DC, specifically DC1-62, DC3-62, DC5-62 and DC7-62, the differential viscosity is significantly lower compared to slurry YM-62, at the same shear rate. The differential viscosity of slurries DC1-62, DC3-62, DC5-62 and DC7-62 is relatively consistent at the same shear rate.
Figure 20 illustrates the impact of different TM/YM and DC/YM ratios on the slurry’s bleeding rate. In Figure 20A, it is evident that slurry YM-53 exhibits a bleeding rate exceeding 1% at 15 min, with the bleeding rate linearly increasing over time. However, when the TM/YM ratio is no less than 1, the bleeding rate of the slurry remains at 0% within 1 hour. This confirms that adding TM significantly reduces the slurry’s bleeding rate.
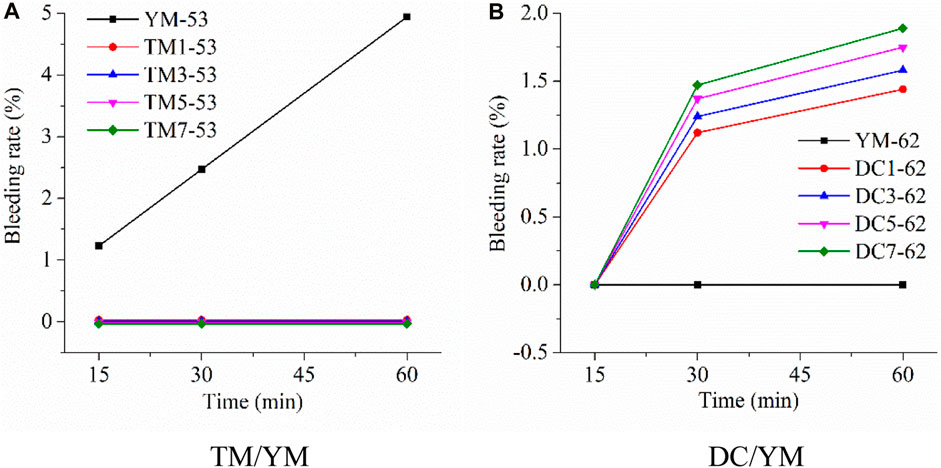
Figure 20. Effect of TM/YM and DC/YM on the bleeding rate of BSS. (A) TM/YM. (B) DC/YM.
Figure 20B reveals that slurry YM-62 maintains a bleeding rate of 0% within 1 hour. Under conditions of 62% mass concentration, slurry with added DC exhibits a bleeding rate of 0% at 15 min and experiences a substantial increase in bleeding rate at 30 min and 60 min. As the DC/YM ratio increases, the bleeding rate of the slurry continues to rise at 30 min and 60 min. Consequently, the addition of DC significantly enhances the bleeding rate of the slurry at 30 min and 60 min.
It is well known that the higher the mass concentration of a slurry, the less water is required to prepare a slurry of the same mass, resulting in poorer fluidity (Hu et al., 2023; Shao et al., 2024). Therefore, whether the powder material used to prepare the slurry is YM or YM replaced with an equivalent amount of TM or DC, the fluidity of the slurry decreases with increasing mass concentration (Figure 5), while the yield stress increases with increasing mass concentration (Figure 7). At the same time, the less water used to prepare a slurry of the same mass, the lower the bleeding rate of the slurry. Consequently, slurries with higher mass concentrations generally have lower bleeding rates (Figure 9).
The mechanism by which mass concentration affects the differential viscosity (Figure 8) and the degree of shear thickening or shear thinning (consistency index n in Figure 7) is not yet clear. As shown in Figure 8, the effect of mass concentration on the differential viscosity of slurries prepared from different powder materials is complex. Figure 7 shows that the impact of mass concentration on the degree of shear thickening or shear thinning of slurries made from different powder materials is also inconsistent. Further research is needed to explore the underlying mechanisms.
When studying the fluidity of BSS, the concentration of the slurry must be appropriate. Taking slurry DC1 as an example, the minimum mass concentration of the slurry used in the study was 59%. When the mass concentration of slurry DC1 was below 59%, the slurry exhibited significant bleeding and separation characteristics, meaning it could no longer be considered a homogeneous fluid, and the fluidity results obtained from testing could not accurately reflect the slurry’s true flowability. Therefore, the mass concentration of slurry DC1 was designed to be no less than 59%. This is also evident from the results shown in Figure 9C regarding the bleeding rate of slurry DC1. The maximum mass concentration of slurry DC1 used in the study was 68%. When the mass concentration exceeded 68%, the slurry’s fluidity was very low (as shown in Figure 5), and the shear stress measured with a rheometer was also very high (as shown in Figure 6C). Further increasing the mass concentration not only increases wear on the testing equipment but may also introduce measurement errors. These errors mainly arise because voids easily form within the slurry around the rotor during rheometer testing.
The change in slurry flowability is not linear with changes in mass concentration. Again, taking slurry DC1 as an example, Figure 6C shows that when the mass concentration of slurry DC1 increased from 59% to 62%, the difference in shear stress at the same shear rate was small. However, when the mass concentration increased from 65% to 68%, the difference in shear stress at the same shear rate was significantly higher. The same conclusion can be drawn from the changes in yield stress shown in Figure 7C. However, the fluidity of slurry DC1 shown in Figure 5 does not appear to change as markedly with mass concentration. In fact, according to the GB/T 8077-2012 standard (GB/T 8077, 2012) for testing slurry fluidity, the diameter of the bottom of the fluidity cylinder used (Figure 2) is 60 cm, meaning the minimum measurable fluidity is 60 cm. As shown in Figure 5, the fluidity of slurries DC1-59, DC1-62, DC1-65, and DC1-68 are 248.5 cm, 190.5 cm, 135.5 cm, and 88 cm, respectively. Therefore, the fluidity of DC1-68 is very close to the minimum value measurable by the test, indicating very poor fluidity. In contrast, the fluidity of slurry DC1-65 is much higher than 60 cm, which is reflected in Figure 6C by the large difference in shear stress between slurries DC1-68 and DC1-65 at the same shear rate. Similar conclusions can be drawn for slurries YM and TM1. Therefore, regardless of whether the slurry BSS is prepared using YM powder or with an equivalent amount of TM or DC replacing YM, there is a critical mass concentration. When the mass concentration exceeds this critical level, the flowability of the slurry deteriorates rapidly.
The powder particles in slurry YM are entirely composed of YM, while the powder particles in slurry TM1 consist of a mixture of 50% YM and 50% TM. Since the average particle size of TM is smaller than that of YM (Figure 1), the average particle size of the powder particles in slurry TM1 is smaller than that of the powder particles in slurry YM. Generally, the smaller the average particle size, the higher the specific surface area of the particles (Zhang et al., 2023). Therefore, at the same mass concentration, more water is required to coat the powder particles in slurry TM1 compared to slurry YM. This results in the flowability of slurry TM1 being poorer than that of slurry YM. Consequently, at the same mass concentration, the fluidity of slurry TM1 is lower than that of slurry YM (Figure 10A), the shear stress of slurry TM1 is higher than that of slurry YM at the same shear rate (Figure 11A), and the yield stress of slurry TM1 is higher than that of slurry YM (Figure 12A). Additionally, since more water is required to coat the powder particles in slurry TM1 compared to slurry YM, the bleeding rate of slurry TM1 is lower than that of slurry YM (Figure 15A).
The powder particles in slurry DC1 consist of a mixture of 50% YM and 50% DC. Since the average particle size of DC is larger than that of YM (Figure 1), the average particle size of the powder particles in slurry DC1 is larger than that of the powder particles in slurry YM. Therefore, at the same mass concentration, less water is required to coat the powder particles in slurry DC1 compared to slurry YM. This results in the flowability of slurry DC1 being better than that of slurry YM. Consequently, at the same mass concentration, the fluidity of slurry DC1 is higher than that of slurry YM (Figure 10B), the shear stress of slurry DC1 is lower than that of slurry YM at the same shear rate (Figure 11B), and the yield stress of slurry DC1 is lower than that of slurry YM (Figure 13A). Additionally, since less water is required to coat the powder particles in slurry DC1 compared to slurry YM, the bleeding rate of slurry DC1 is higher than that of slurry YM (Figure 15B).
The mechanisms by which the addition of 50% TM or DC to replace YM affects the differential viscosity (Figure 14) and the degree of shear thickening or shear thinning (Figures 12C, 13C) are not yet clear. As shown in Figure 14, the impact of adding 50% TM or DC to replace YM on the differential viscosity of the slurry is complex. Figures 12C, 13C indicate that the effect of adding 50% TM or DC to replace YM on the degree of shear thickening or shear thinning is also complex. Further research is needed to explore these underlying mechanisms.
At the same mass concentration, further increasing the TM/YM ratio in the slurry results in a further decrease in the average particle size of the powder particles, leading to an increase in the specific surface area. Consequently, as the TM/YM ratio in the slurry increases, the fluidity of the slurry continuously decreases (Figure 16A), and the yield stress continuously increases (Figure 18A). Theoretically, the bleeding rate of the slurry should also decrease with the increasing TM/YM ratio. However, since the bleeding rate of slurry TM1-53 is already zero (Figure 20A), the bleeding rates of TM3-53, TM5-53, and TM7-53 slurries are also zero.
At the same mass concentration, further increasing the DC/YM ratio in the slurry results in a further increase in the average particle size of the powder particles, leading to a decrease in the specific surface area. Consequently, as the DC/YM ratio in the slurry increases, the fluidity of the slurry continuously increases (Figure 16B), the yield stress continuously decreases (Figure 18B), and the bleeding rate continuously increases (Figure 20B).
The effect of the TM/YM ratio on the degree of shear thickening or shear thinning (consistency index n in Figure 18A) appears to be consistent with the effect of the DC/YM ratio on the degree of shear thickening or shear thinning (consistency index n in Figure 18B). The impact of TM/YM and DC/YM ratios on the differential viscosity of the slurry is also complex. Further research is needed to explore the underlying mechanisms of these effects.
This study involved the preparation of BSS using three distinct raw materials: YM, TM and DC. The research focused on investigating the impact of slurry mass concentration, the incorporation of TM or DC, and the ratios of TM/YM and DC/YM on the fluidity, rheological properties, and bleeding characteristics of BSS. Based on the results of this study, the following conclusions can be drawn.
(1) BSS exhibits characteristics of a yield stress fluid with shear-thickening or shear thinning behavior, making it suitable for characterization using the Herschel-Bulkley model.
(2) The change in slurry flowability is not linear with changes in mass concentration. Regardless of whether the slurry BSS is prepared using YM powder or with an equivalent amount of TM or DC replacing YM, there is a critical mass concentration. When the mass concentration exceeds this critical level, the flowability of the slurry deteriorates rapidly.
(3) Compared to YM powder particles, TM powder particles have a smaller average particle size and a higher specific surface area, requiring more water to coat the particles when preparing a slurry of the same mass concentration. Consequently, replacing YM with an equivalent amount of TM in the preparation of BSS slurry results in reduced fluidity, increased yield stress, and decreased bleeding rate of the slurry. Notably, when the mass concentration is 59%, replacing YM with TM increases the yield stress of the BSS slurry by 167.30%. Within the mass concentration range of 53%–59%, replacing YM with an equivalent amount of TM reduces the bleeding rate of the BSS slurry to 0.
(4) Compared to DC powder particles, TM powder particles have a larger average particle size and a smaller specific surface area, requiring less water to coat the particles when preparing a slurry of the same mass concentration. Consequently, replacing YM with an equivalent amount of DC in the preparation of BSS slurry results in increased fluidity, decreased yield stress, and increased bleeding rate of the slurry. Notably, when the mass concentration is 62%, replacing YM with an equivalent amount of DC reduces the yield stress of the BSS slurry by 63.96%, and the 60-min bleeding rate increases from 0% to 1.44%.
(5) As the TM/YM ratio increases, BSS’s fluidity decreases, yield stress increases, and the degree of shear thickening initially increases and subsequently decreases. The degree of shear thickening in the slurry is highest when the TM/YM ratio is 1. The impact of TM incorporation on BSS differential viscosity is minimal at low shear rates but becomes more significant at higher shear rates.
(6) As the DC/YM ratio increases, BSS’s fluidity increases, yield stress decreases, the degree of shear thickening initially increases and subsequently decreases, and differential viscosity initially decreases and subsequently increases. The degree of shear thickening in the slurry is highest and the differential viscosity is lowest when the DC/YM ratio is 3. With the increase in the DC/YM ratio, the bleeding rate of BSS consistently rises.
These findings reveal the influence of raw material composition and mix proportions on BSS performance in open-pit mining blasting operations. These observed patterns can be utilized to guide the optimization of material proportions, contributing to the improvement of blasting stemming effectiveness. However, further research and experimentation are needed to gain a comprehensive understanding of BSS behavior in real-world mining scenarios.
The original contributions presented in the study are included in the article/supplementary material, further inquiries can be directed to the corresponding author.
PL: Conceptualization, Funding acquisition, Investigation, Project administration, Resources, Supervision, Writing–review and editing. SX: Conceptualization, Funding acquisition, Investigation, Methodology, Project administration, Resources, Validation, Writing–review and editing. JL: Conceptualization, Funding acquisition, Investigation, Project administration, Resources, Writing–review and editing. ML: Data curation, Formal Analysis, Funding acquisition, Investigation, Methodology, Project administration, Software, Writing–original draft, Writing–review and editing. XP: Conceptualization, Data curation, Funding acquisition, Investigation, Project administration, Resources, Supervision, Writing–review and editing. KY: Funding acquisition, Project administration, Validation, Visualization, Writing–review and editing. LZ: Funding acquisition, Project administration, Validation, Writing–review and editing.
The author(s) declare financial support was received for the research, authorship, and/or publication of this article. This study was supported by the National Natural Science Foundation of China (No. 52274122), the Research Fund of BGRIMM Technology Group (No. 02-2136) and the Youth Innovation Fund of BGRIMM Technology Group (Nos. 04-2306, 04-2342, 04-2208).
Authors PL, SX, and JL were employed by Hongda Blasting Engineering Group Co. Ltd. and Hunan Lianshao Construction Engineering (Group) Co. Ltd. Authors ML, XP, KY, and LZ were employed by BGRIMM Technology Group.
All claims expressed in this article are solely those of the authors and do not necessarily represent those of their affiliated organizations, or those of the publisher, the editors and the reviewers. Any product that may be evaluated in this article, or claim that may be made by its manufacturer, is not guaranteed or endorsed by the publisher.
Basso, F. O., and Franco, A. T. (2024). Numerical investigation of turbulent flow of Herschel–Bulkley fluids in a concentric annulus with inner cylinder rotation. J. Newt. Fluid Mech. 327, 105219. doi:10.1016/j.jnnfm.2024.105219
Bui, B. T., and Luong, L. H. (2024). Effect of field viscometer dial readings on the estimation of drilling fluid frictional pressure loss using Herschel–Bulkley model. Geoenergy Sci. Eng. 236, 212697. doi:10.1016/j.geoen.2024.212697
Cevizci, H. (2014). Fragmentation, cost and environmental effects of plaster stemming method for blasting at A basalt quarry. Arch. Min. Sci. 59 (3), 835–846. doi:10.2478/amsc-2014-0058
Chaudhary, B. S. (2017). Rajesharora, Screened drill cuttings in blasthole for tamping of stemming to reduce generation of fly rock. J. Mines, Mater. Fuels 65 (1), 19–23+38.
Chen, C., and Ling, C. (1996). Granular-flow rheology: role of shear-rate number in transition regime. J. Eng. Mech. 122, 469–480. doi:10.1061/(asce)0733-9399(1996)122:5(469)
Chen, M., Ye, Z., Wei, D., Lu, W., and Yan, P. (2021). The movement process and length optimization of deep-hole blasting stemming structure. Int. J. Rock Mech. Min. 146, 104836. doi:10.1016/j.ijrmms.2021.104836
Dong, D., Huang, Y., Pei, Y., Zhang, X., Cui, N., Zhao, P., et al. (2023). Effect of spherical silica fume and fly ash on the rheological property, fluidity, setting time, compressive strength, water resistance and drying shrinkage of magnesium ammonium phosphate cement. J. Build. Eng. 63, 105484. doi:10.1016/j.jobe.2022.105484
Eloranta, J. (1994). Stemming selection for large-diameter blastholes. Annu. Conf. Explos. blasting Tech. Conf. Explos. blasting Tech.
Fang, K., Zhang, D., Wang, D., Liu, Z., Zhang, M., and Zhang, S. (2023). The impact of coal gasification slag powder on fluidity, rheology and viscoelasticity properties of fresh cement paste. J. Build. Eng. 69, 106237. doi:10.1016/j.jobe.2023.106237
Feys, D., Verhoeven, R., and De Schutter, G. (2009). Why is fresh self-compacting concrete shear thickening. Cem. Concr. Res. 39, 510–523. doi:10.1016/j.cemconres.2009.03.004
Ghose, M. K., and Majee, S. R. (2001). Air pollution caused by opencast mining and its abatement measures in India. J. Environ. Manage. 63 (2), 193–202. doi:10.1006/jema.2001.0434
Hu, Y., Li, K., Zhang, B., and Han, B. (2023). Effect of nano-SiO2 on mechanical properties, fluidity, and microstructure of superfine tailings cemented paste backfill. Mat. Today sustain. 24, 100490. doi:10.1016/j.mtsust.2023.100490
Ji, D., Wu, Z., Gao, D., Gu, Z., and Fang, D. (2023). Analysis on rheological and workability properties of steel-polypropylene fibers reinforced self-compacting concrete with recycled coarse and fine aggregates. J. Build. Eng. 79, 107931. doi:10.1016/j.jobe.2023.107931
Li, C., Li, X., Ruan, Z., Huang, Z., and Wang, H. (2023d). Analysis of homogeneity and rheological properties of filling slurry during the mixing process through electrical resistance tomography. Powder Technol. 428, 118850. doi:10.1016/j.powtec.2023.118850
Li, C., Yang, R., Wang, Y., Kang, Y., and Zhang, Y. (2023b). Theory and numerical simulation of deep hole cut blasting based on dispersed charge and staged detonation. Int. J. Rock Mech. Min. 169, 105453. doi:10.1016/j.ijrmms.2023.105453
Li, M., Han, J., Zhou, Y., and Yan, P. (2021). A rheological model for evaluating the behavior of shear thickening of highly flowable mortar. Molecules 26, 1011. doi:10.3390/molecules26041011
Li, R., Xu, S., Li, Z., Suorineni, F. T., and Zhu, G. (2023c). Development and testing of self-swelling cartridge for use as stemming material in open-pit blasting —a quarry case study. Int. J. Rock Mech. Min. 170, 105503. doi:10.1016/j.ijrmms.2023.105503
Li, X., Liu, K., Sha, Y., Yang, J., and Song, R. (2023a). Numerical investigation on rock fragmentation under decoupled charge blasting. Comput. Geotech. 157, 105312. doi:10.1016/j.compgeo.2023.105312
Liu, Y., Shi, C., Yuan, Q., An, X., Jiao, D., Zhu, L., et al. (2020). An amendment of rotation speed-torque transformation equation for the Herschel-Bulkley model in wide-gap coaxial cylinders rheometer. Constr. Build. Mat. 237, 117530. doi:10.1016/j.conbuildmat.2019.117530
Lu, Y., Jin, C., Wang, Q., Li, G., and Han, T. (2024). Deformation and failure characteristic of open-pit slope subjected to combined effects of mining blasting and rainfall infiltration. Eng. Geol. 331, 107437. doi:10.1016/j.enggeo.2024.107437
Luo, T., Qiang, W., and Zhuang, S. (2019). Effects of ultra-fine ground granulated blast-furnace slag on initial setting time, fluidity and rheological properties of cement pastes. Powder Technol. 345, 54–63. doi:10.1016/j.powtec.2018.12.094
Qian, Y., and Kawashima, S. (2018). Distinguishing dynamic and static yield stress of fresh cement mortars through thixotropy. Cem. Concr. Compos. 86, 288–296. doi:10.1016/j.cemconcomp.2017.11.019
Qiu, X., Shi, X., Shu, Z., Liu, B., and Jian, Z. (2018). Experimental study on the blasting performance of water-soil composite stemming in underground mines. Adv. Mat. Sci. Eng. 1, 1–11. doi:10.1155/2018/3523509
Rubio-Hernández, F. J., Adarve-Castro, A., Velázquez-Navarro, J. F., Páez-Flor, N. M., and Delgado-García, R. (2020). Influence of water/cement ratio, and type and concentration of chemical additives on the static and dynamic yield stresses of Portland cement paste. Constr. Build. Mat. 235, 117744. doi:10.1016/j.conbuildmat.2019.117744
Savage, S. B., and Sayed, M. (1984). Stresses developed by dry cohesionless granular materials sheared in an annular shear cell. J. Fluid Mech. 142, 391–430. doi:10.1017/s0022112084001166
Shao, C., Liu, L., Zhang, X., Xie, L., Ruan, S., Zhu, M., et al. (2024). Influence of internal and external factors on the fluidity of modified magnesium slag-based backfill materials. J. Environ. Chem. Eng. 12 (1), 111867. doi:10.1016/j.jece.2023.111867
Shen, W., Cui, H., and Jiao, D. (2024). Experimental observations on factors influencing shear-thickening characteristics of cement-based materials. J. Build. Eng. 86, 108620. doi:10.1016/j.jobe.2024.108620
Song, Y., Xiang, J., Cui, W., and Xiong, G. (2023). Anhydrous ethanol as a medium used to grind soda-lime glass for cement-based materials preparation: evaluating its rheological behavior by the Herschel–Bulkley and Modified–Bingham models. J. Build. Eng. 63, 105553. doi:10.1016/j.jobe.2022.105553
Wang, S., Li, Y., Yang, R., Xu, B., and Lu, B. (2023). Rheological behavior with time dependence and fresh slurry liquidity of cemented aeolian sand backfill based on response surface method. Constr. Build. Mat. 371, 130768. doi:10.1016/j.conbuildmat.2023.130768
Xie, Z., Huang, C., Zhao, Z., Xiao, Y., Zhao, Q., and Lin, J. (2022). Review and prospect the development of dust suppression technology and influencing factors for blasting construction. Tunn. Undergr. Sp. Tech. 125, 104532. doi:10.1016/j.tust.2022.104532
Zhaidarbek, B., Tleubek, A., Berdibek, G., and Wang, Y. (2023). Analytical predictions of concrete pumping: extending the khatib–khayat model to herschel–bulkley and modified Bingham fluids. Cem. Concr. Res. 163, 107035. doi:10.1016/j.cemconres.2022.107035
Zhang, C., Wang, M., Liu, R., Li, X., Liu, Y., Jiang, P., et al. (2023). Rheological properties of cement-based slurry and evaluation of rheological model: influence of particle size and shape. Constr. Build. Mat. 406, 133498. doi:10.1016/j.conbuildmat.2023.133498
Zhang, J., Tang, H., Li, C., Gong, W., Zhou, B., and Zhang, Y. (2024). Deformation stage division and early warning of landslides based on the statistical characteristics of landslide kinematic features. Landslides 21, 717–735. doi:10.1007/s10346-023-02192-7
Zhang, Z., Qiao, Y., Chi, L. Y., and Hou, D. (2021). Experimental study of rock fragmentation under different stemming conditions in model blasting. Int. J. Rock Mech. Min. 143, 104797. doi:10.1016/j.ijrmms.2021.104797
Keywords: blasthole stemming slurry, blasthole stemming technique, yield stress, shear thickening, differential viscosity, slurry composition
Citation: Li P, Xie S, Lu J, Li M, Peng X, Yang K and Zhang L (2024) Research on the flow characteristics of blasthole stemming slurry in open-pit mining. Front. Earth Sci. 12:1430046. doi: 10.3389/feart.2024.1430046
Received: 09 May 2024; Accepted: 31 May 2024;
Published: 26 June 2024.
Edited by:
Tao Wen, Yangtze University, ChinaReviewed by:
Jiawei Xu, Chang’an University, ChinaCopyright © 2024 Li, Xie, Lu, Li, Peng, Yang and Zhang. This is an open-access article distributed under the terms of the Creative Commons Attribution License (CC BY). The use, distribution or reproduction in other forums is permitted, provided the original author(s) and the copyright owner(s) are credited and that the original publication in this journal is cited, in accordance with accepted academic practice. No use, distribution or reproduction is permitted which does not comply with these terms.
*Correspondence: Mengyuan Li, bGltZW5neXVhbkBiZ3JpbW0uY29t
Disclaimer: All claims expressed in this article are solely those of the authors and do not necessarily represent those of their affiliated organizations, or those of the publisher, the editors and the reviewers. Any product that may be evaluated in this article or claim that may be made by its manufacturer is not guaranteed or endorsed by the publisher.
Research integrity at Frontiers
Learn more about the work of our research integrity team to safeguard the quality of each article we publish.