 Pengfei Shan1,2,3*
 Zheng Meng1,2*
 Xingping Lai1,2,3
 Xiongfei Xue4Chenwei Li1,2Jindong Wang5Wei Li1,2Long Zhang1,2Bojia Xi1,2Hongjun Jiang6
- 1College of Energy Engineering, Xi’an University of Science and Technology, Xi’an, China
- 2Key Laboratory of Western Mine Exploration and Hazard Prevention, Ministry of Education, Xi’an University of Science and Technology, Xi’an, China
- 3Yulin Coal Institute, Xi’an University of Science and Technology, Yulin, China
- 4Shaanxi Nonferrous Yulin Coal Industry Co. Ltd., Yulin, China
- 5College of Energy Engineering, Yulin University, Yulin, China
- 6Inner Mongolia Coal Mine Design and Research Institute, Hohhot, China
In this paper, the No. 30201 working face of a specific colliery was determined as the study area in the Yushen mining area, China. The objective of this paper is to determine the optimal position for pressure regulation measures during the final mining stage. A mechanical calculation model for stabilized coal pillar was developed. The analytical solution for the front abutment pressure function was obtained. Limit equilibrium theory and beam theory were employed to compute the critical width value of the stabilized coal pillar. The analysis focused on examining the spatiotemporal relationship between the rotational deformation of the main roof and the stability of the retracement channel. The study utilized numerical simulation to investigate the failure characteristics of the surrounding rock and the stress redistribution in the stabilized coal pillar within the working face. Through comprehensive analysis, a reasonable width of 15 m for the stabilized coal pillar was determined and successfully implemented in field practices. A method of using Artificial Neural Network (ANN) to select the stabilized coal pillar width was proposed. The input characteristics of ANN were determined through theoretical analysis. Four models of BP, WOA-BP, PSO-BP, and CPSO-BP were trained. The calculation accuracy of each model is evaluated by three quantitative metrics: MAE, MRE, and RMSE. The MAE value of the CPSO-BP model is 0.9489, showing a reduction of 70.87% compared to the BP model, 55.84% compared to the WOA-BP model, and 51.26% compared to the PSO-BP model. The MRE value is 0.0559, which is 71.51%, 56.29%, and 53.24% lower than the other models, respectively. The RMSE value is 1.0617, which is 68.92%, 56.13%, and 53.03% lower than other models, respectively. The four models were employed to compute the width of the stabilized coal pillar. The values for the BP, WOA-BP, PSO-BP, and CPSO-BP models were 12.7 m, 16.3 m, 14.1 m, and 15.2 m, respectively, indicating that the CPSO-BP model can effectively determine the width of the stabilized coal pillar.
1 Introduction
China’s coal industry has experienced significant improvement. The intensity of coal mining has gradually increased. The rapid and safe retracement of mining equipment has become a critical factor in achieving high yield and high efficiency in mines (Kang et al., 2021; Xie et al., 2021). The pre-excavation of the retraction channel technology has the potential to considerably reduce the relocation time for the equipment on the working face. Still, it is prone to roof caving and hydraulic power support crushing accidents during penetration, which affects the relocation speed (Dai et al., 2024; Gong et al., 2024; Yang et al., 2024). Before the mining face is penetrated, implementing pressure regulation technology is crucial to ensure no pressure issues during the penetration. This measure has the capability to prevent hydraulic power support crushing accidents. It contributes to the enhancement of the moving speed of the working face. Moreover, it ensures the efficient production of the mine.
For a long time, many scholars have conducted extensive research on the stability of retracement channels (Huang et al., 2022; Wang Y. et al., 2023; Feng et al., 2024; Lai et al., 2024; Zhang et al., 2024). Lv (2014) systematically studied the influencing factors of the constancy of the pre-excavation retracement channels and revealed its dynamic mechanical characteristics. Zhang (2015) conducted a study wherein they divided the influence of mining on the main retracement channel into various stages. This division was achieved by analyzing the roof pressure characteristics and support resistance during both the final mining period and the retracement period. Gu et al. (2017) established a mechanical analysis model to solve the coal pillar width and analyzed the influence of related parameters on the stability of the surrounding rock. Wang et al. (2021) conducted an analysis on the fracture form and pressure regulation mechanism of the main roof. At the same time, many scholars have employed numerical simulation methods to study the failure characteristics and stress redistribution of surrounding rock (He F. L. et al., 2022; Li W. L. et al., 2022; Vinay et al., 2022; Zhu and Li, 2022; Ma et al., 2023; Xu et al., 2023). He et al. (2021) conducted an analysis of the failure characteristics and stress redistribution within the retracement channel. Their analysis was based on laboratory tests and numerical simulation. Song et al. (2024) conducted a comprehensive analysis of the migration law of overlying strata in the retracement channel of a fully mechanized caving face. Their analysis involved theoretical analysis and numerical simulation techniques. Additionally, they proposed a corresponding combined support scheme based on their findings. He Y. J. et al. (2022) analyzed the failure characteristics of the surrounding rock during the final mining period through numerical simulation and explored the importance of controlling the constancy of the front side of the channel. The astable law of stabilized coal pillar is analyzed comprehensively. Qin et al. (2021) studied the impact of the roof rotation angle on the yield load of the hydraulic power support and ensured the stability of the surrounding rock of the retracement channel. Zhang et al. (2017) analyzed the yielding degree of different coal pillar widths under high stress through numerical simulation methods. Wu et al. (2019) used UDEC numerical simulation software study the damage mechanism during the formation of coal pillar and evaluate the degree of damage to coal pillar.
Currently, empirical formulas are predominantly utilized for calculating the width of stabilized coal pillar, with limited analyses addressing channel failure resulting from main roof breaking and rotary deformation. Hence, this paper concentrates on the No. 30201 working face located within the Yushen mining area. It aims to resolve the analytical solution for the front abutment pressure function, determine the critical width of stabilized coal pillar, and analyzed the spatiotemporal correlation between the stability of the channel’s surrounding rock and main roof breakage. Through integration with numerical simulation, the study endeavors to effectively determine the appropriate width of stabilized coal pillar. Additionally, it proposes a method for selecting the width of coal pillar utilizing the CPSO-BP model.
2 Engineering background
The main coal seam of a mine in the Yushen mining area is Yan’an group’s 3 # coal seam. The northeast side of the No. 30201 working face of the colliery is occupied by the 3# coal central roadway, while the southwest side is demarcated by the mine field boundary. On the other hand, both the southeast and northwest sides consist entirely of solid coal (Figure 1). The working face adopts the fully-mechanized coal mining method to mining the whole height at one time. The fully caving method manages the roof. The thickness of the coal seam is 6.4–8.5 m, the average is 7.5 m, and the average dip is 0.3°. The buried depth of the coal seam is 205–260 m, and the average is 237 m. The immediate roof and floor are mainly siltstone and mudstone, and the main roof is medium-grained feldspar sandstone.
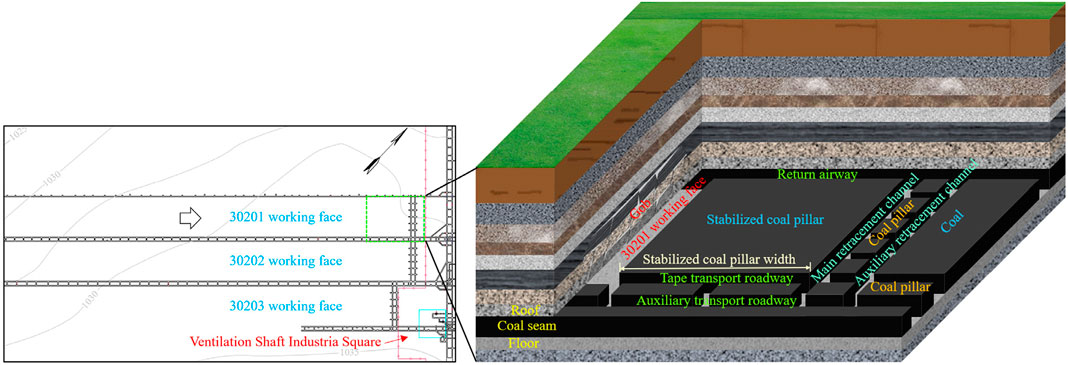
Figure 1. Schematic diagram of working face layout.
3 Stability analysis of stabilized coal pillar
3.1 Main controlling factors of retracement channel stability
When mining reaches the designated position, both the main and auxiliary retracement channels are excavated along the stop line. Furthermore, multiple contact roadways are arranged between the retracement channels. This arrangement facilitates multi-head parallel retracement support and accelerates the relocation of the mining face. Figure 2 shows a schematic diagram of the stabilized coal pillar. As the working face continues to advance, the width of the stabilized coal pillar gradually shrinks. When the width reaches a specific value, brittle failure occurs, resulting in the loss of bearing capacity. The roof rotates with the protective coal body as a support point. Meanwhile, the hydraulic power support is crushed (Figure 3).
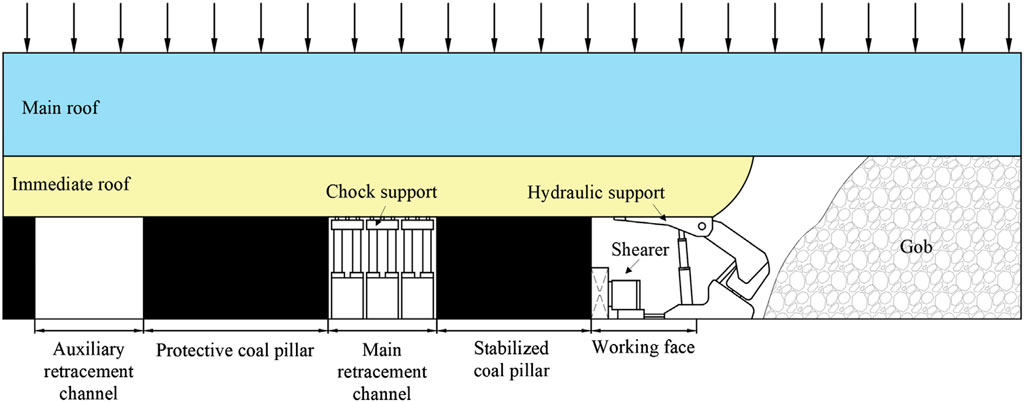
Figure 2. Schematic diagram of stabilized coal pillar.
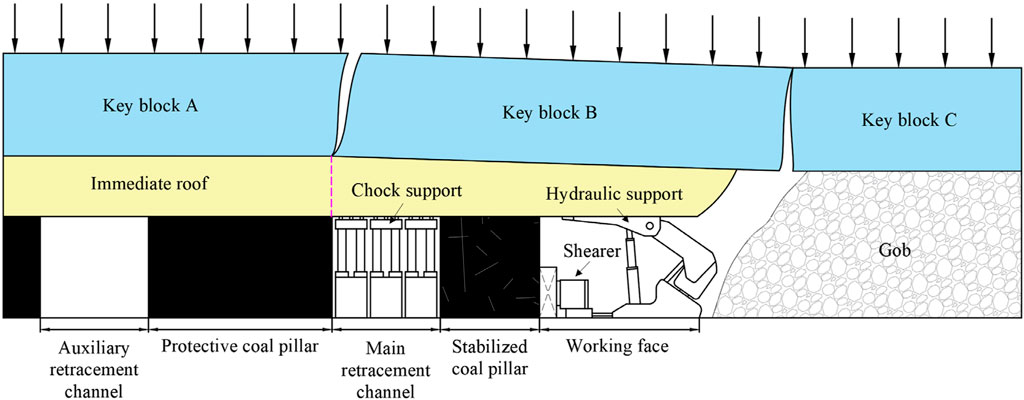
Figure 3. Schematic diagram of the damage to the stabilized coal pillar.
During the final mining period, the mining height must be gradually reduced to match that of the main retracement channel. As the mining height is gradually reduced, the stroke of the hydraulic power support column decreases, making the roof pressure more susceptible to occurrence when the working face is penetrated. The width of the stabilized coal pillar serves as a basis for determining the stress-regulating position of the mining face, ensuring that the roof remains stress-free upon penetration with the main retracement channel. This condition facilitates the swift and safe retracement of mining equipment.
3.2 The critical width of stabilized coal pillar
Figure 4 shows the mechanical model of the stabilized coal pillar. The loads it receives include the load P1 transferred by the roof of the retracement channel, the load P2 transferred by the roof of the working face, and the overlying strata load P3 of the overlying strata.
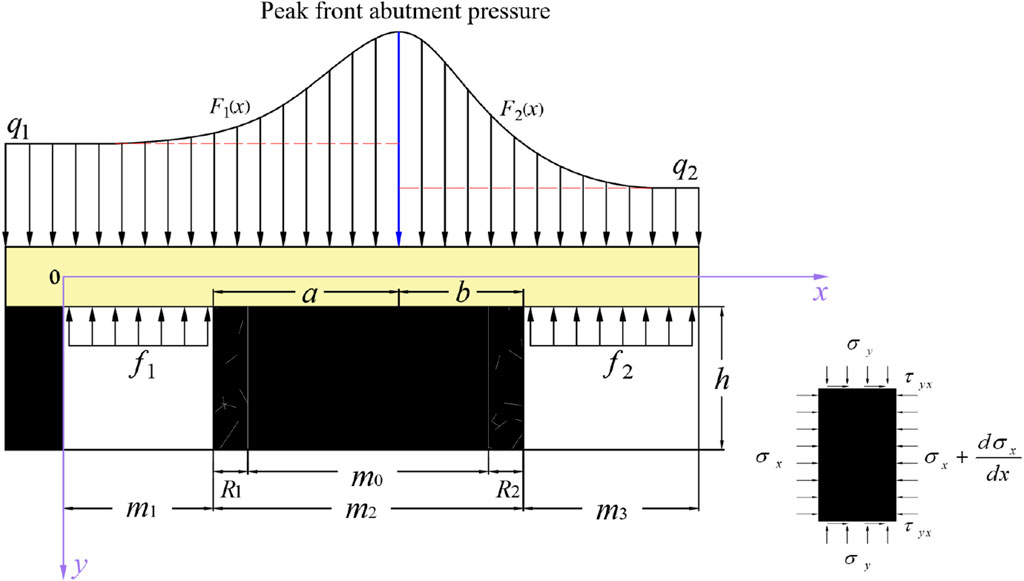
Figure 4. Mechanical analysis model of the stabilized coal pillar.
Where F1 (x) and F2 (x) are the main roof load distribution function expressions above the stabilized coal pillar, q1 is the uniformly distributed load in front of the mining face, q2 is the uniformly distributed load behind the rear gob. Where m0 is the width of the pressure-bearing area of the stabilized coal pillar, m1 is the width of the main retracement channel, m2 is the width of the stabilized coal pillar, m3 is the roof control distance of mining face, h is the mining height, R1 and R2 are the width of the limited equilibrium zone of the coal body. Where f1 is the yield load of the chock support, f2 is the yield load of the hydraulic power support, a is the distance from the peak pressure to the main retracement channel, b is the distance from the peak pressure to the mining face.
The advance abutment stress pressurization load of the main roof can be expressed as (Pan et al., 2012; Pan et al., 2015)
Where fc1 is the maximum value of function f1(x) within the interval; fc2 is the maximum value of function f2(x) within the interval. Where xc1 is the abscissa of the peak position of function f1(x); xc2 is the abscissa of the peak position of function f2(x).
According to Eqs 1, 2, the expression of the load distribution function of the front and rear roofs before the peak abutment pressure as
According to the stress distribution law and the continuity of stress boundary conditions, it is known that F1(0) = F2(0). This implies that q1 + fc1 = q2 + fc2, where q1 > q2.
According to the measured data of No.30201 working face, xc1 = 6, xc2 = 4, f1 = 0.67 MPa, f2 = 0.95 MPa, k = 1.5, q1 = 5.825 MN/m, q2 = 3.495 MN/m, fc1 = 1.5 q1 = 8.74 MN/m, fc2 = fc1 + q1-q2 = 11.07 MN/m.
According to Eq. 3, Eq. 4, the continuous incremental load distribution function can be obtained as
The roof of the main retracement channel is considered a fixed beam, while the roof of the mining face is regarded as a cantilever beam consolidated by the stabilized coal pillar.
According to Eqs 5, 6, the roof transfer load, denoted as P1, of the main retracement channel is expressed as
Where t is the inclined length, which is take as 1 m.
The roof transfer load, denoted as P2, of working face is expressed as
The transfer load, denoted as P3, of overlying strata on stability coal pillar is expressed as
According to Eqs 7–9, the total load, denoted as Pc, of stabilized coal pillar is expressed as
The cohesion and friction at the interface between the stabilized coal pillar and the upper and lower rock layers are lower than inside the coal body. They are in an extrusion state under the action of stress, generating shear force at the interface. The side of the main retracement channel is supported by an FRP (Fiber Reinforced Polymer) bolt. The bolt, along with the anchored coal body, constitutes an anchorage zone. At the elastic-plastic boundary of the coal body where Px = 0, the stress within the plastic zone of the coal body as
Where c is cohesion, φ is friction, and λ is the side pressure coefficient.
According to the mechanical model (Figure 4), within the plastic zone of the coal body, any selected microelement exhibits a resultant force of 0 in the x-direction. According to Eq. 11, the width of the plastic zone can be obtained as
Where H is the buried depth.
There is a plastic zone within a specified range in the stabilized coal pillar. The internal elastic zone functions as a bearing structure. Therefore, the average stress acts upon it as
Its strength calculation formula is as
Where σ1 is the compressive strength.
According to the geological data and field measurement data of the No. 30201 working face, it can be seen that H = 233 m, h = 5.0 m, γ = 25.0 kN/m3, λ = 1.03, K = 2.5, σ1 = 25.2 MPa, φ = 28.6°, c = 2.81 MPa a = 9 m, m1 = 6.0 m, m2 = 6.47 m. Let σc = σp. According to Eq. 10 and Eq. 12, Eq. 13, and Eq. 14, the critical width of the stabilized coal pillar m0 = 13.62 m was obtained.
3.3 Determination of the regulating position
Suppose the mining face is under pressure when it advances to a reasonable pressure-regulating position. In that case, the main roof breaks directly above the working face (Figure 5), and there is no need to take pressure-regulating measures. With continuous mining, the pre-fracture position of the main roof is located above the channel coal pillar between two retracement channels. The safe relocation of the working face equipment can be realized when the retracement channel is penetrated.
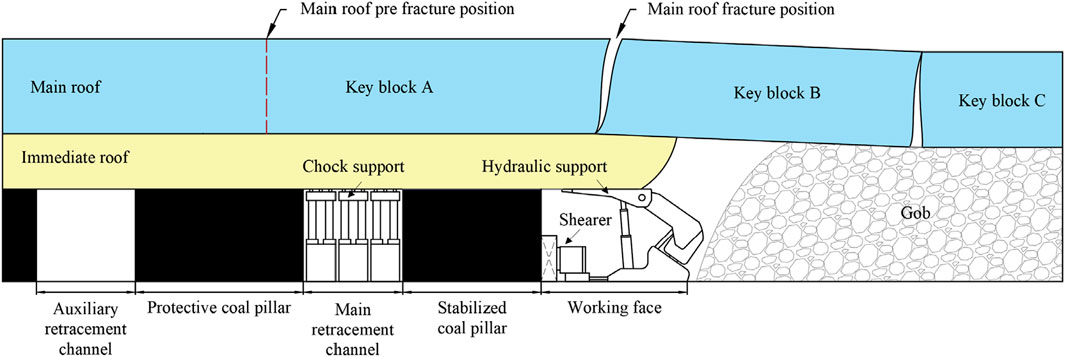
Figure 5. The fracture position is directly above the working face.
Suppose no pressure occurs when advancing to a reasonable pressure-regulating position. In this scenario, it becomes necessary to determine the pre-fracture position of the main roof. This determination is based on factors such as the periodic weighting interval and the extent of continuous pressure during the final mining period.
Suppose the mining distance exceeds the maximum non-weighting length after the last periodic weighting. In that case, the pre-fracture position is near the front of the working face (Figure 6). A periodic weighting is about to occur at this position. Pressure regulation measures must be taken immediately to rotate the main roof fully. The working face commences its advancement subsequent to the implementation of pressure regulation measures. As a result, the extent of continuous pressure diminishes, leading to a rapid cessation of pressure. After implementing pressure regulation measures, the pre-fracture position is located above the coal pillar between the main and auxiliary retracement channels. This position helps in preventing support crushing accidents during penetration and ensures the safe relocation of hydraulic power supports.
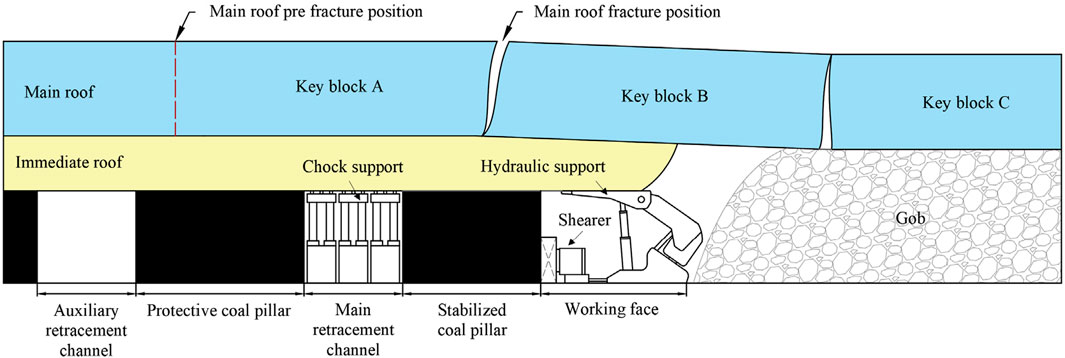
Figure 6. The fracture position is in front of the working face.
If the mining distance is shorter than the minimum non-weighting length following the last periodic weighting, no pressure phenomenon occurs during this period. The pre-fracture position may be located directly above the main retracement channel (Figure 7). During the penetration period, there is a higher probability of roof pressure occurring. This increased likelihood of roof pressure poses a greater risk of support crushing accidents. Consequently, these accidents can result in casualties and property losses.
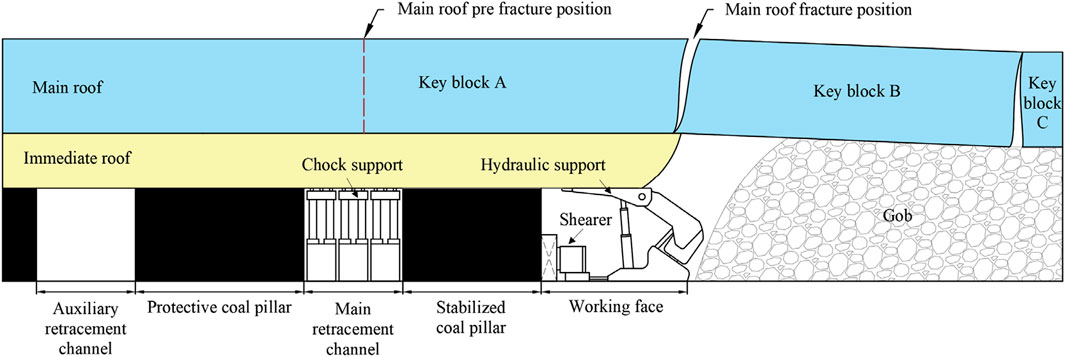
Figure 7. The fracture position is behind the working face.
Figure 8 shows the resistance cloud diagram of the hydraulic power support. In order to ensure that there is no support crushing accident, it is essential to ensure that the width of the coal pillar exceeds the length of continuous pressure during the final mining period. During the final mining period, the mining height gradually reduced to 5.0 m. When the working face is mined normally, the periodic weighting interval L1 = 11.3 m, and the pressure extent l1= 5.2 m (Figure 8A). When the mining height is reduced to 5.0 m, the periodic weighting interval L2 = 12.6 m, and the pressure extent l2 = 6.4 m (Figure 8B). Therefore, the critical width of the stabilized coal pillar exceeds the length of continuous pressure.
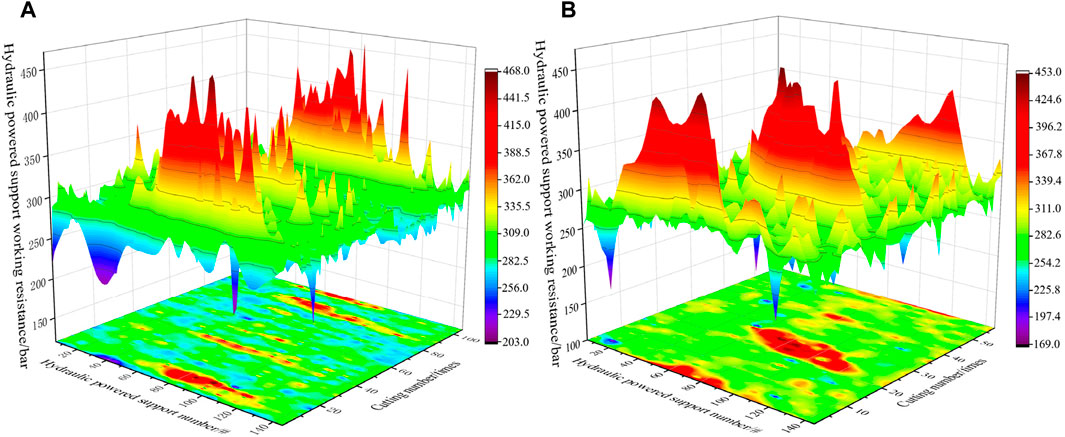
Figure 8. Resistance cloud diagram of hydraulic power support during the final mining period. (A) Normal mining stage; (B) Mining height reduction stage.
4 Simulation results analysis of stabilized coal pillar
4.1 Build model
FLAC3D was used to establish the model (Figure 9), analyze the failure mode and stress redistribution of the plastic zone of the stabilized coal pillar. The model is modeled using the Mohr-Coulomb model. The model has 1243760 units and 1254996 nodes. The working face width is set to 300 m, with a mining length of 140 m, and the model boundary includes a 50 m coal pillar. A stress of 4.2 MPa is applied at the top of the mode, while constraints are applied at the sides and bottom (Figure 10).

Figure 9. Numerical calculation model construction.
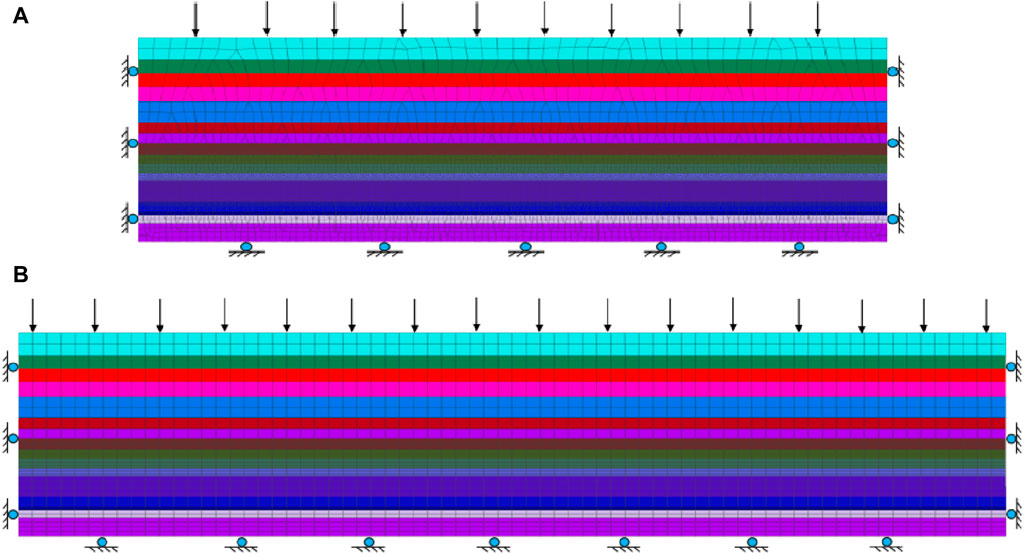
Figure 10. Model boundary constraints. (A) Boundary conditions of XZ plane; (B) Boundary conditions of YZ plane.
4.2 Distribution of plastic zone in coal pillar
Figure 11 illustrates the distribution characteristics of the plastic zone under different widths of the stabilized coal pillar in the working face. When the width of the stabilized coal pillar is 16 m, the plastic zone area on the working face side significantly increases. The area of the plastic zone on the working face side is approximately twice that of the main retracement channel side. Within the coal body, there is an extensive elastic zone observed. When the width of the stabilized coal pillar decreases to 15 m, the plastic zones above the coal pillar become interconnected. The plastic zone of the coal pillar forms an inverted-trapezoid shape on the main retracement channel side. The maximum width of this plastic zone is 6 m and the minimum width is 3 m. Conversely, on the working face side, the plastic zone assumes a positive-trapezoid shape. The maximum width of the plastic zone is 8 m, while the minimum width is 6 m. Within the coal body, the width of the elastic zone is 4 m, which constitutes 25.7% of the total area.
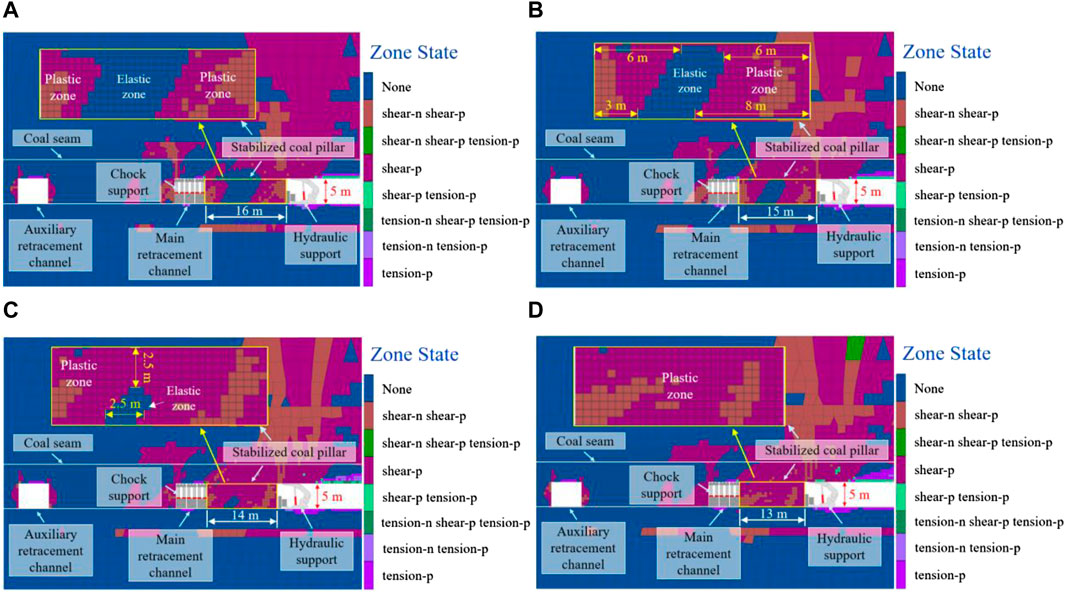
Figure 11. Distribution of plastic zones in coal pillar with different widths. (A) 16 m; (B) 15 m; (C) 14 m; (D) 13 m.
Further reduction of the stabilized coal pillar width to 14 m leads to the connection of plastic zones in the upper part of the coal pillar. A small elastic zone is observed on the side of the floor, with both the maximum width and height measuring 2.5 m. This elastic zone accounts for 6.7% of the total area. As mining continues and the width decreases to 13 m, the plastic zones of the coal pillar fully connect, leading to complete plastic failure. Notwithstanding this, the coal pillar still maintains certain stability under this width.
Figure 12 is the stress cloud diagram of the stabilized coal pillar. The maximum stress is located approximately 2.5 m ahead of the working face. The high-stress area is mainly concentrated in the middle and upper sections on this side. The high-stress area on the side of the main retracement channel primarily concentrates on the lower part of the coal body. The stress peak occurs 2 m away from the side. On the working face side, the area of the high-stress zone is significantly larger than that on the main retracement channel side.
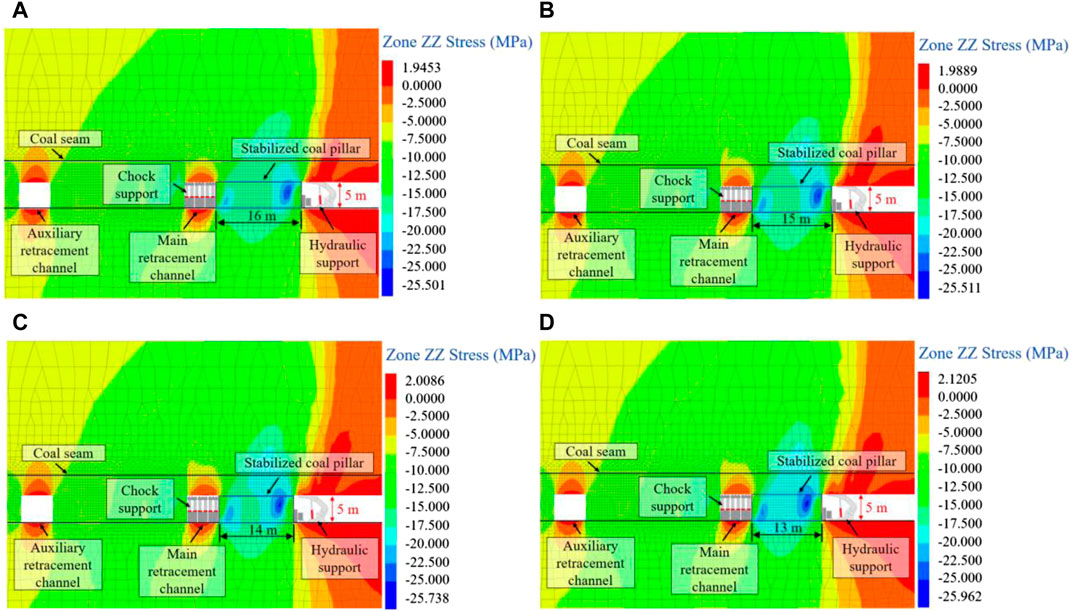
Figure 12. Stress cloud diagram of coal pillar with different widths. (A) 16 m; (B) 15 m; (C) 14 m; (D) 13 m.
As the width continues to decrease, stress concentration intensifies on both sides. This intensification results in increased internal stress peaks. Additionally, high-stress areas become more expansive. The stress of the strata within a certain distance above the coal seam continues to grow, and the high-stress area inside the coal body gradually shifts from the edges towards the middle. The decrease in coal pillar width leads to the gradual expansion and merging of plastic zones on both sides. Consequently, the stability of the coal pillar gradually diminishes. However, the coal pillar is still capable of withstanding higher stress.
4.3 Stress distribution of coal pillar
Figure 13 shows the stress curve of the stabilized coal pillar under different widths. When the width of the stabilized coal pillar is 16 m, the stress exhibits a bimodal distribution, with peak stress located at a depth of 2–4 m inside the coal body. Additionally, the peak stress on the working face side surpasses that on the main retracement channel side.
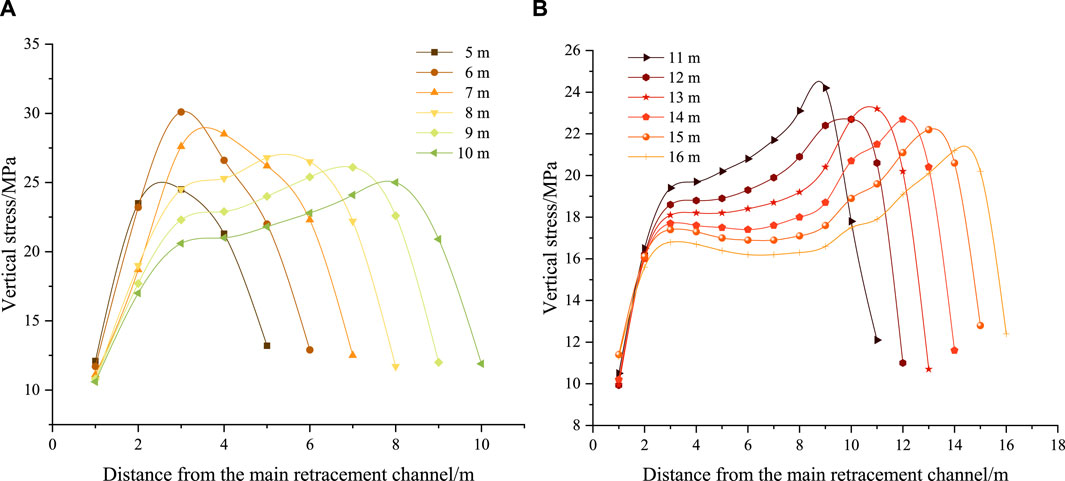
Figure 13. Stress of coal pillar with different widths. (A) Width of coal pillar ranging from 5 to 10 m; (B) Width of coal pillar ranging from 11 to 16 m.
As the width decreases, the difference between the peak stress on the working face side and the peak stress on the main retracement channel side increases. This difference reaches a maximum of 5 MPa. When the width is reduced to 13 m, the elastic zone transitions into a plastic zone due to the high-stress environment. The plastic zones on both sides become connected, and the stress distribution exhibits an asymmetric pattern as a whole. As mining progresses, the coal pillar stress curve gradually evolves from the bimodal to the unimodal, achieving a unimodal distribution at a width of 7 m.
Due to the retracement channel has an obstacle effect on the transfer of the front abutment pressure to the front, the degree of stress concentration increases. As the width of the stabilized coal pillar decreases to 6 m, the stress in the middle of the coal pillar peaks at its maximum value of 30.1 MPa. When the width decreases to 5 m, the coal pillar loses its load-bearing capacity for the overlying strata. The stress value in the coal pillar decreases sharply, and the front abutment pressure is transferred to the coal pillar between the main and auxiliary retracement channels.
At a width of 14 m, the failure characteristics of the stabilized coal pillar in different regions of the working face are shown in Figure 14. The working face is divided into a measuring area every 100 m, which is divided into three measuring areas: upper, middle, and lower. Measuring points are placed on the roof of each measurement area for detection purposes. The stress curve of each measuring point is illustrated in Figure 15.
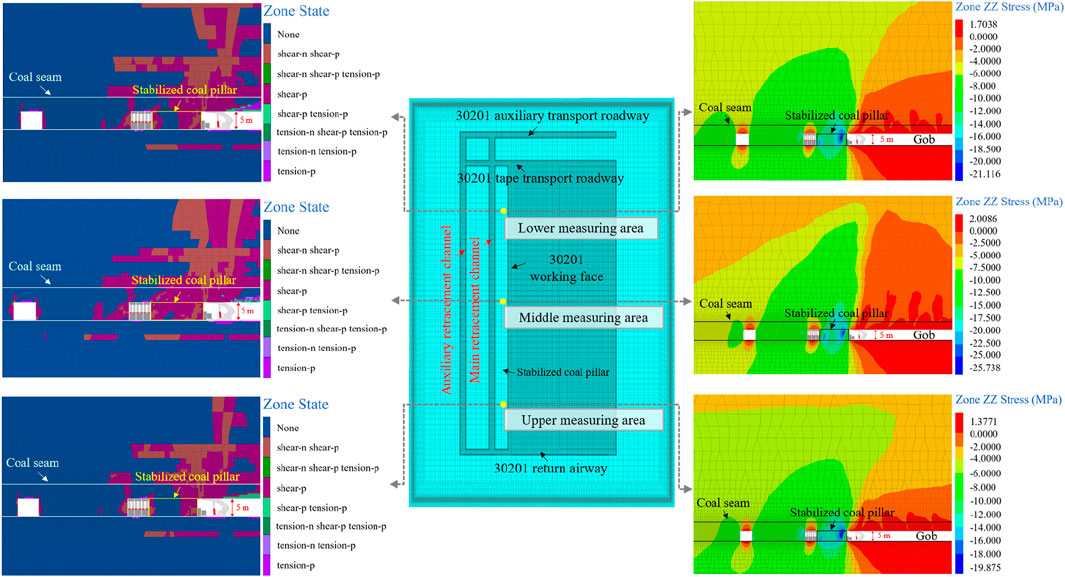
Figure 14. The failure characteristics of coal pillar in different areas.
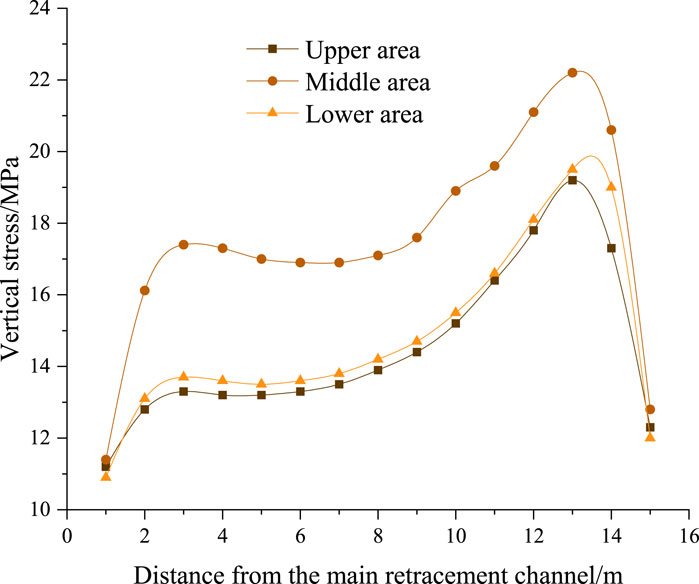
Figure 15. Stress in different areas of coal pillar.
When the width is 14 m, the plastic zones of the coal pillar in the middle measuring area become connected. Inside the coal pillar, there is a small elastic zone. The plastic zones in the upper and lower measuring areas are not connected, the proportion of elastic zone in the upper measuring area is much higher than that in the middle and lower measuring areas (Figure 14). The stress inside the coal pillar in the middle measuring area is the largest, reaching a maximum value of 25.738 MPa. In the lower measuring area, the stress is slightly lower, with a value of 21.116 MPa. The maximum stress in the upper measuring area is 19.875 MPa, which is lower than that in the other measuring areas.
The stress of the coal pillar in the middle area is higher than that in the upper and lower areas. The peak stress in the middle area reaches 22.2 MPa. This value is 13.51% higher than that in the upper area. Additionally, it is 12.16% higher than that in the lower area. Refer to Figure 15 for visualization of these stress distributions. It shows that when the width remains constant, the stability of the coal pillar is highest in the upper area, followed by the lower area, and the lowest in the middle area. The reason is that the roof above the coal pillar can be approximately considered a plate structure with low stiffness. The middle area is the farthest from the roof support point, and its deflection is the largest. The increase in deflection will cause the rock strata to produce downward pressure. The coal pillar is a relatively rigid structure, it bears and transmits the overburden stress, leading to the highest stress in the middle area.
5 Engineering practice
Based on the critical value of stabilized coal pillar and numerical simulation results, a width of 15 m was selected for the stabilized coal pillar of the No. 30201 working face. Measures to stop mining were taken to regulate the pre-fracture position of the roof. Figure 16 shows the amount of roof-to-floor convergence in each area of the main retracement channel of the No. 30201 working face. It can be seen that when the remaining recoverable length between 140 and 24 m, the main retracement channel is in a slow deformation stage. As the working face continues to advance, the amount of roof-to-floor convergence continues to increase, with a deformation rate of 0.28 mm per meter.
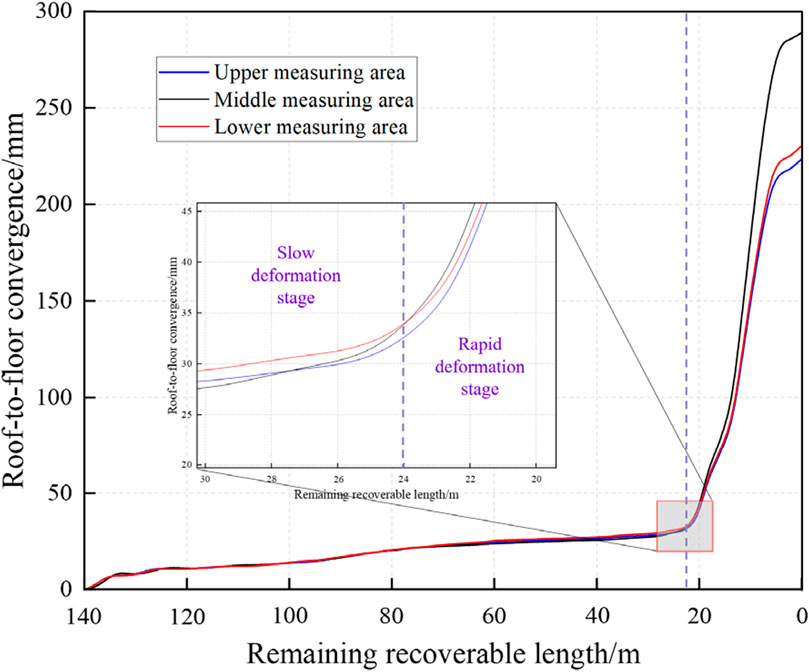
Figure 16. Roof-to-floor convergence of the main retracement channel.
When mining operations advance to a distance of 24 m from the main retracement channel, the roof and floor enter a phase characterized by rapid deformation. Simultaneously, the deformation rate of the main retracement channel experiences a significant increase. This increase culminates in the channel reaching a maximum deformation rate of 13.14 mm per meter. Because the stress in the middle area is higher than in the upper and lower areas, the displacement in the middle area is the largest. In contrast, the displacement in the upper and lower areas is relatively smaller. The maximum displacement of the main retracement channel measures 289.52 mm. Additionally, after penetration, there is no occurrence of hydraulic power support crushing. This absence of crushing guarantees the swift relocation of the working face.
6 Discussions
Due to the heterogeneity, discontinuity, and anisotropy of coal and rock mass, its mechanical behavior under engineering disturbance is highly nonlinear and uncertain. The mechanical model based on continuum mechanics requires more parameters, and the calculation process is more complicated. When employing numerical simulation methods, the rationality of mesh division and parameter selection greatly influences the simulation results.
Artificial neural networks have high nonlinearity, parallelism, and good self-learning and self-adaptive ability. Constructing an ANN model for the calculation can provide a novel approach to determining the reasonable width of stabilized coal pillar in the working face during the final mining period (Wang et al., 2020; Zhao et al., 2020; Li et al., 2021; Mishra et al., 2021; Wang X. et al., 2023; Shan et al., 2024; Zhu et al., 2024).
6.1 CPSO-BP model
The study of the regular foraging behavior of birds inspires the Particle Swarm Optimization (PSO) algorithm. As a random optimization algorithm, it boasts rapid convergence speed and straightforward implementation. However, there is a problem of falling into local optimum (Dai et al., 2023).
The particle velocity and position update equations in the PSO algorithm as
Where vijk is the velocity vector of particle i in the jth dimension during the kth iteration, xijk is the position vector of particle i in the jth dimension during the kth iteration. Where ω is inertia weight, c1 is the individual acceleration coefficient, c2 is the social acceleration coefficient, r1 and r2 are random numbers within the interval [0,1]. Where pijk, pbest is the historical best position of a particle in the jth dimension during the kth iteration, pjk, gbest is the historical best position of the jth dimension during the kth iteration.
The chaotic mapping function has the characteristics of nonlinearity, unpredictability, and ergodicity. The Chaotic Particle Swarm Optimization (CPSO) algorithm employs chaotic mapping functions to generate sequences of random numbers, enhancing the randomness of particles (Li J. L. et al., 2022).
According to Eqs 15, 16, the particle velocity update equation of the CPSO algorithm as
Where α is the scaling factor, u is a random number within the interval [0,1], and f(x) is a chaotic mapping function.
As shown in Eq. 17, the CPSO algorithm disturbs the particle motion by introducing a chaotic mapping function. The chaotic mapping function multiplies the current velocity vijk of the particle by a random number as the input value and returns a chaotic value. The value is scaled by the scaling factor and added to the speed update equation of the PSO algorithm.
In this paper, a Logistic map chaotic system is used, and its iterative formula is as
Where μ is the control variable, its value range is in the interval [0,4].
When 3.569 < μ ≤ 4, the Logistic mapping system enters a chaotic state. According to Eq. 18, the PSO algorithm is improved by the chaotic motion characteristics in a completely chaotic state, and the iterative formula is shown in Eq. 19.
The BP neural network has the capability to classify patterns with arbitrary complexity and excellent multidimensional function mapping ability. It can effectively handle nonlinear relationships and complex data patterns, demonstrating high adaptability and generalization ability. The topology of the BP neural network includes an input layer, one or more hidden layers, and an output layer (Figure 17).
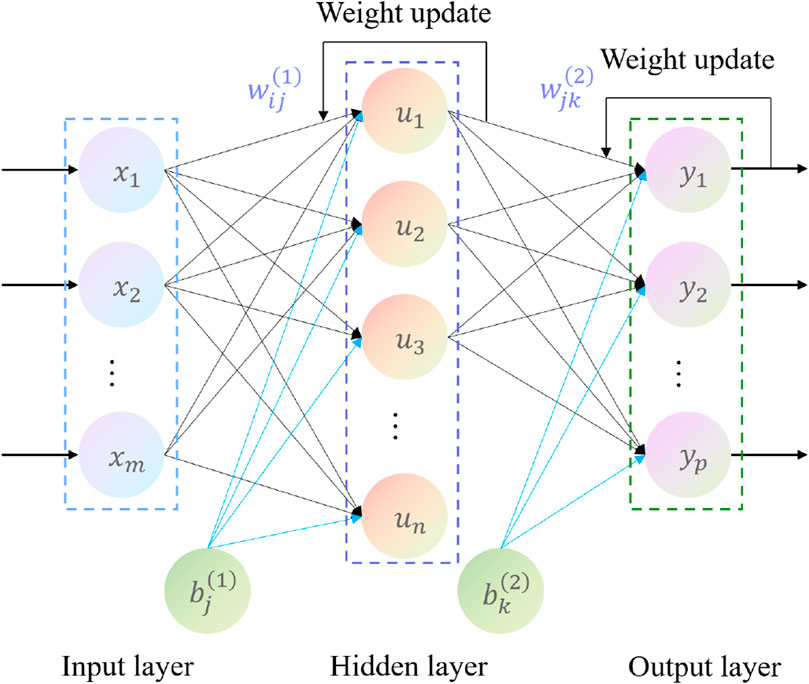
Figure 17. BP neural network topology diagram.
The BP neural network has nonlinear solid mapping and self-learning ability, but it tends to have slow convergence speed, long training time, and is prone to getting stuck in local optima (Jia et al., 2024).
Figure 18 is the flowchart of the CPSO-BP neural network algorithm. Integrating chaotic theory into the improved PSO algorithm enhances the model’s global search capability. This enhancement helps to avoid the issue of falling into local optima. The process of CPSO optimizing the BP neural network is as follows:
1) Determine the BP neural network topology.
2) Initialize the particle swarm.
3) Generate random number sequences through chaotic mapping to update the velocity and position of each particle, and its fitness is calculated.
4) The historical best position of each particle is updated based on its current and historical best positions. Additionally, the global best position is updated using the historical best positions of all particles.
5) Chaotic optimization is performed on the optimal position of the particle, mapping the optimal value to the domain of the Logistic mapping system for iteration. The random number sequence generated by the iteration is returned to the original solution space through inverse mapping.
6) Iteration continues based on the updated speed and position. The search halts when the stop condition is met. Finally, the optimal parameters are outputted.
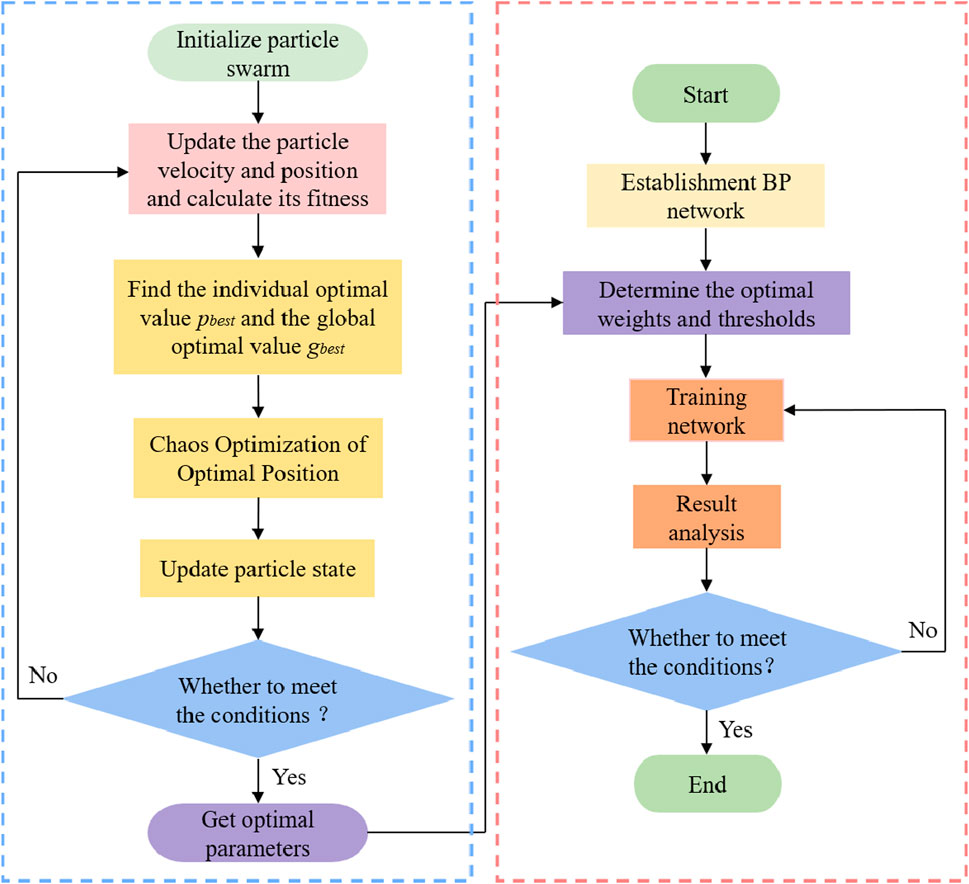
Figure 18. Flowchart of CPSO-BP neural network algorithm.
6.2 Sample data
A total of 196 groups of data were selected from mines sharing identical geological conditions with the coal mine. These sample data were then divided into 147 training sets. Additionally, 49 validation sets were created. According to the main controlling factors and mechanical model of coal pillar stability, a total of 11 input characteristics of the model are determined. These include: periodic weighting interval, pressure extent, coal pillar height, tensile strength, cohesion, elastic modulus, friction, overburden bulk density, Poisson’s ratio, coal seam buried depth and side pressure coefficient. Table 1 is part of the sample data. Normalize the sample data to improve the convergence speed and computational accuracy of the model. After training, perform inverse normalization for visualization of the training results.
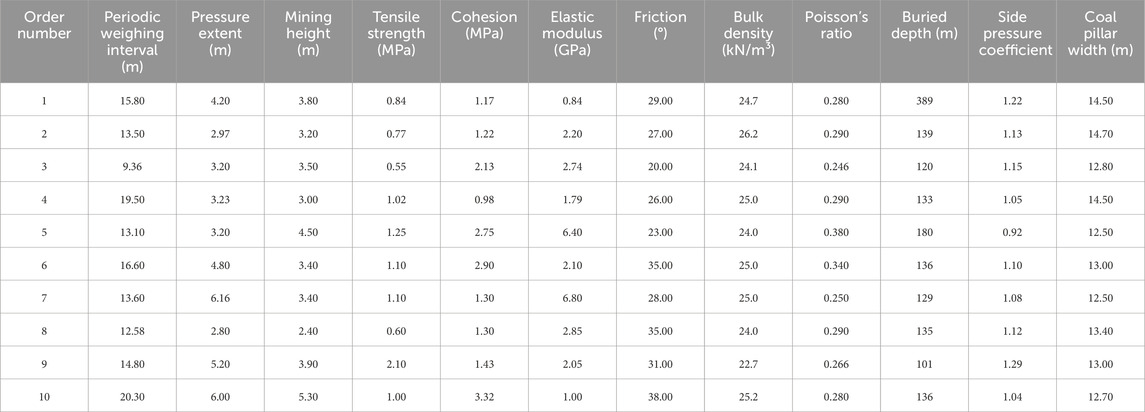
Table 1. Partial sample data.
6.3 Analysis of training results
The BP neural network is optimized by the Whale Optimization Algorithm (WOA), PSO, and CPSO algorithms; all algorithms belong to probabilistic algorithms. The Boids model is used to simulate the behavior of biological groups and find the best fitness in the iterative process. The optimized three models and the unoptimized original model are trained, and the training results of each model are analyzed. Figure 19 shows the fitness iteration curve of the WOA algorithm, PSO algorithm, and CPSO algorithm.
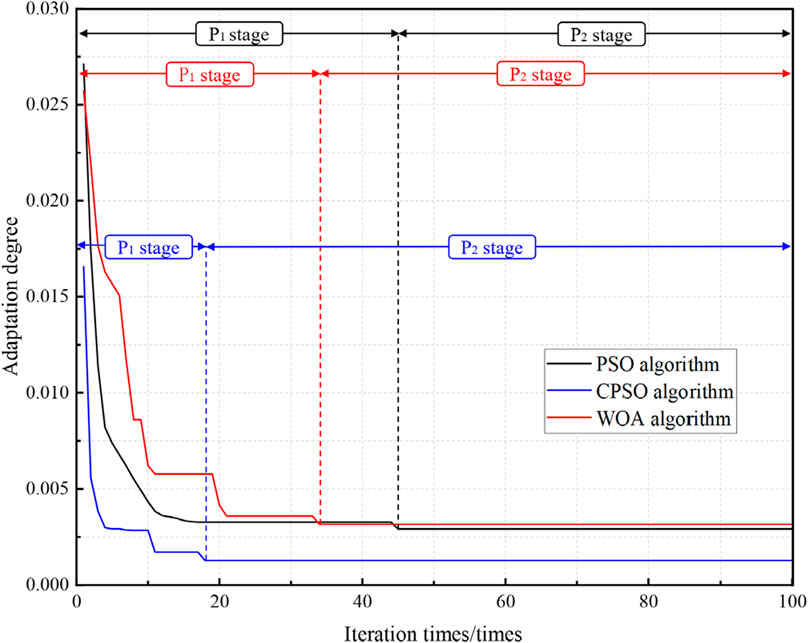
Figure 19. Fitness iteration curve.
The maximum number of iterations for the three algorithms is set at 100. In the iterative curve, the P1 stage signifies the optimization stage. Meanwhile, the P2 stage indicates the convergence stage (Figure 19). The WOA algorithm began to converge when iterated 34 times, and the fitness value was 3.16 × 10⁻³. The PSO algorithm began to converge when iterated 45 times, and the fitness value was 2.91 × 10⁻³. The CPSO algorithm became trapped in a local optimal solution after 11 iterations. It continued iterating by using chaotic optimization to escape the local optimum. After iterating 18 times, the algorithm began to converge. At this point, the fitness value reached 1.28 × 10⁻³. The number of iterations when the CPSO algorithm begins to converge is reduced by 47.05% compared to the WOA algorithm and 60% compared to the PSO algorithm. Therefore, the PSO algorithm improved by chaos theory can efficiently enhance the global search capability and convergence speed.
Figure 20 shows the training results of BP, WOA-BP, PSO-BP, and CPSO-BP models. Figure 21 shows the absolute error of each model.
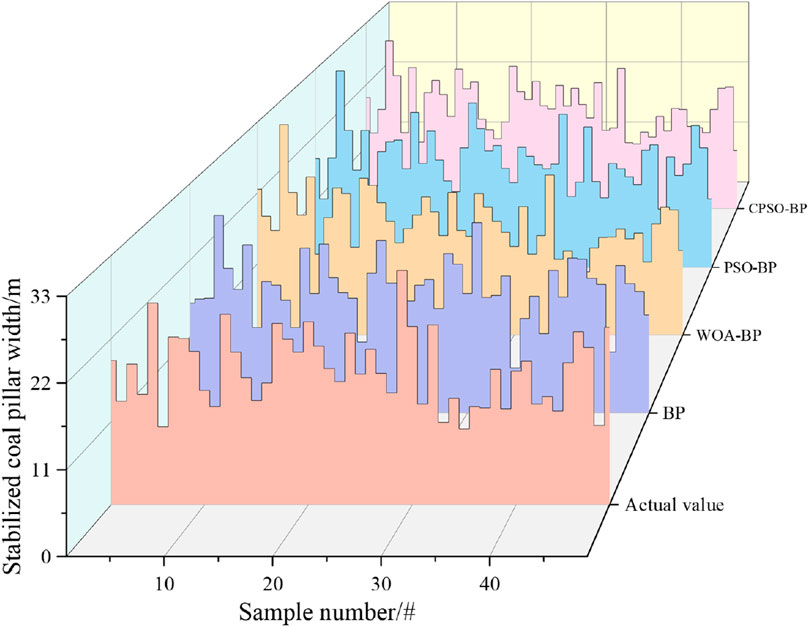
Figure 20. Comparison of the training results of the models.
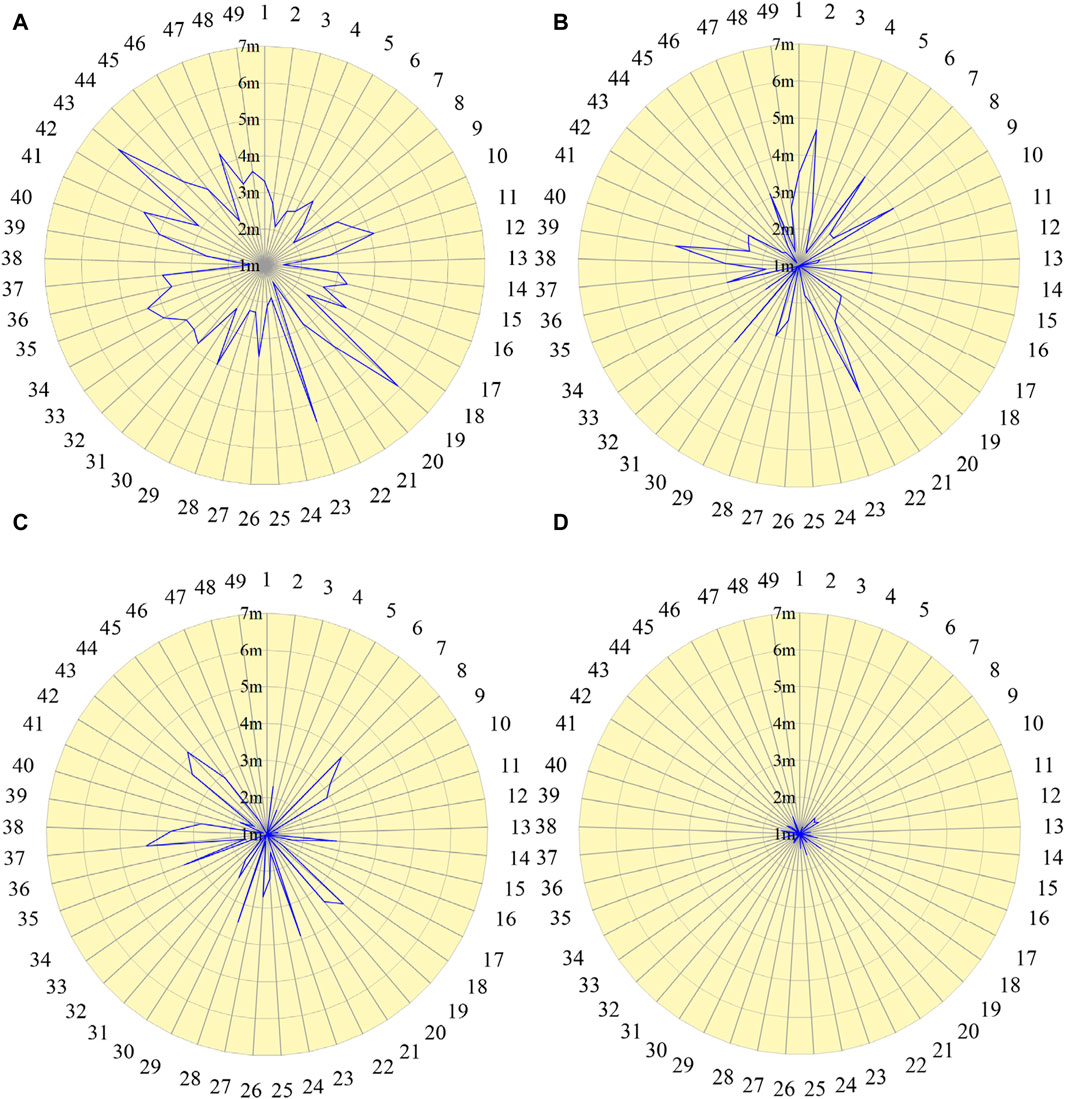
Figure 21. Error values of each model. (A) BP model; (B) WOA-BP model; (C) PSO-BP model; (D) CPSO-BP model.
From Figure 20 and Figure 21, it can be seen that the CPSO-BP model has a maximum absolute error of 1.7 m and a minimum absolute error of 0.0 m. The maximum absolute error of the WOA-BP model is 4.8 m, with a minimum absolute error of 0.5 m. The maximum absolute error of the PSO-BP model is 4.3 m, and the minimum absolute error is 0.4 m. The BP model has a maximum absolute error of 6.1 m and a minimum absolute error of 1.4 m. The CPSO-BP model exhibits comparatively smaller errors, and the training result are the closest to the actual value.
Table 2 shows the calculation accuracy of each model. The accuracy of model training is evaluated using three quantitative metrics: Mean Absolute Error (MAE), Mean Relative Error (MRE), and Root Mean Square Error (RMSE). The MAE follows a Laplace distribution and is more robust compared to the other two metrics for assessing model accuracy. The MAE value of the CPSO-BP model is the smallest, showing a reduction of 51.26% compared to the PSO-BP model, 55.84% compared to the WOA-BP model, and 70.87% compared to the BP model. This indicates that the model has smaller errors.
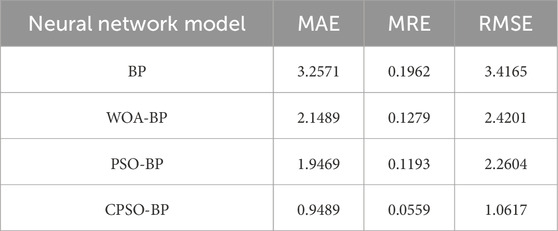
Table 2. The calculation accuracy of each model.
The relative error of the BP model is notably high. It is quantified by an MRE value of 0.1962. This value significantly surpasses those of other models. In contrast, the CPSO-BP model exhibits the lowest MRE value. The unit magnitude of the RMSE value is consistent with the unit magnitude of the sample data, which can better reflect the calculation ability of the model. The RMSE values of the WOA-BP model and the PSO-BP model exhibit relative proximity. In contrast, the RMSE value of the CPSO-BP model is significantly lower than the other three models. Specifically, its value is 68.92% lower than that of the BP model.
The three quantitative metric values of the CPSO-BP model are significantly smaller than those of the other three models. As model accuracy is negatively correlated with quantitative metrics. This indicates that the CPSO-BP model exhibits higher computational accuracy.
6.4 Model calculation
The width of the stabilized coal pillar was calculated using BP, WOA-BP, PSO-BP, and CPSO-BP models. The input characteristic parameters of the model are as follows: L2 = 12.60 m, l2 = 6.40 m, h = 5.00 m, σt = 0.61 MPa, c = 2.81 MPa, E = 3.06 GPa, φ = 28.60°, γ = 25.0 kN/m3, ν = 0.210, H = 233 m, λ = 1.03, as shown in Table 3. The calculation results of each model under this condition are shown in Table 4.
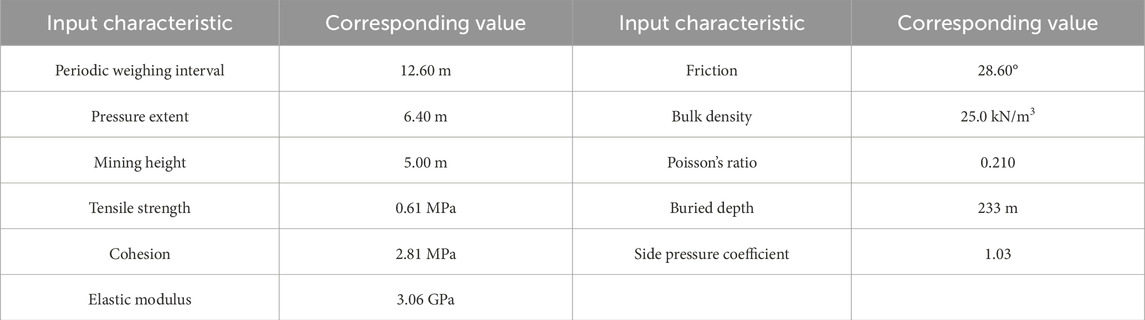
Table 3. The input characteristic parameters of the model.
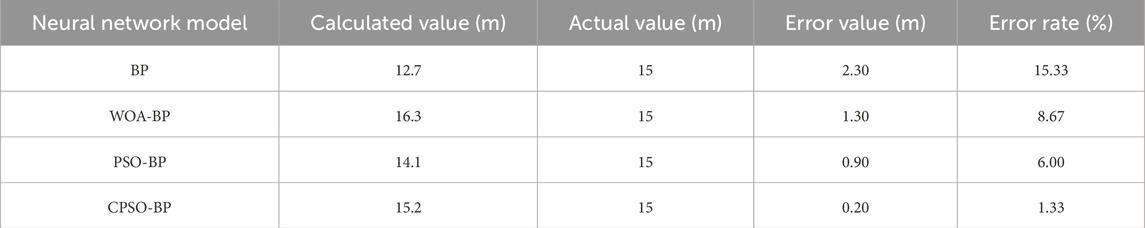
Table 4. Model calculation results.
In the actual production process, a width of 15 m is selected as the reference value. The absolute errors between the calculated results and the actual values of the BP, WOA-BP, PSO-BP, and CPSO-BP models are as follows: 2.3 m, 1.3 m, 0.9 m, and 0.2 m respectively. Correspondingly, the error rates are 15.33%, 8.67%, 6.00%, and 1.33% respectively (Table 4). This indicates that the calculated values of the CPSO-BP model are relatively close to the actual values. Using this model, one can effectively calculate the width of the stabilized coal pillar.
7 Conclusion
(1) By constructing a mechanical model for the stabilized coal pillar, considering the combined effect of the load transferred by the roof of the working face, the load transferred by the roof of the retreat channel, and the load of the overlying strata, the critical width of the stabilized coal pillar of the No.30201 working face is determined to be 13.56 m.
(2) Based on the numerical simulation, the impact of changes in the width of the stabilized coal pillar on its stability was analyzed. The results show that when the width of the stabilized coal pillar is 14 m, the plastic zone on both sides of the coal pillar is almost completely connected, resulting in decreased stability. As the width decreases to 5 m, the bearing capacity on the overlying strata is lost. Through comprehensive analysis of the theoretical calculation and numerical simulation results, the width of the stabilized coal pillar at the No.30201 working face is finally determined to be 15 m.
(3) The MAE value of the CPSO-BP model is 0.9489, the MRE value is 0.0559, and the RMSE value is 1.0617, which are smaller than those of the BP, WOA-BP, and PSO-BP models, indicating that the CPSO-BP model has significantly higher accuracy than the other three models. Taking the 15 m width of the stabilized coal pillar as the reference value, the error rates of the BP, WOA-BP, PSO-BP, and CPSO-BP models are 15.33%, 8.67%, 6.00%, and 1.33%, respectively, indicating that the CPSO-BP model can effectively calculate the width of the stabilized coal pillar.
Data availability statement
The original contributions presented in the study are included in the article/Supplementary Material, further inquiries can be directed to the corresponding author.
Author contributions
PS: Data curation, Methodology, Resources, Writing–review and editing. ZM: Data curation, Methodology, Writing–original draft. XL: Data curation, Methodology, Resources, Writing–review and editing. XX: Data curation, Investigation, Writing–original draft. CL: Investigation, Methodology, Writing–original draft. JW: Conceptualization, Software, Writing–original draft. WL: Data curation, Investigation, Software, Writing–original draft. LZ: Software, Writing - original draft. BX: Conceptualization, Investigation, Writing–original draft. HJ: Data curation, Methodology, Writing–original draft.
Funding
The author(s) declare that financial support was received for the research, authorship, and/or publication of this article. This work was supported by the National Natural Science Foundation of China [grant number 52274138 and 52394191]; the Innovation Capability Support Program of Shaanxi [grant number 2022KJXX-58]; and the Yulin High-tech Zone Science and Technology Plan Project [grant number ZD-2021-01].
Conflict of interest
Author XX was employed by Shaanxi Nonferrous Yulin Coal Industry Co. Ltd.
The remaining authors declare that the research was conducted in the absence of any commercial or financial relationships that could be construed as a potential conflict of interest.
Publisher’s note
All claims expressed in this article are solely those of the authors and do not necessarily represent those of their affiliated organizations, or those of the publisher, the editors and the reviewers. Any product that may be evaluated in this article, or claim that may be made by its manufacturer, is not guaranteed or endorsed by the publisher.
References
Dai, L. P., Pan, Y. S., Xiao, Y. H., Wang, A., Wang, W., Wei, C., et al. (2024). Parameter design method for destressing boreholes to mitigate roadway coal bursts: theory and verification. Rock Mech. Rock Eng. doi:10.1007/s00603-024-04042-x
Dai, X., Li, X. Q., Zhang, Y. G., Li, W., Meng, X., Li, L., et al. (2023). A prediction model of coal seam roof water abundance based on PSO-GA-BP neural network. Water 15, 4117. doi:10.3390/w15234117
Feng, X., Gong, B., Liang, Z., Wang, S., Tang, C., Li, H., et al. (2024). Study of the dynamic failure characteristics of anisotropic shales under impact Brazilian splitting. Rock Mech. Rock Eng. 57, 2213–2230. doi:10.1007/s00603-023-03673-w
Gong, B., Zhao, T., Thusyanthan, I., and Tang, C. (2024). Modelling rock fracturing by a novel implicit continuous to discontinuous method. Comput. Geotechnics 166, 106035. doi:10.1016/j.compgeo.2023.106035
Gu, S. C., Huang, R. B., Li, J. H., and Su, P. (2017). Stability analysis of un-mined coal pillars during the pressure adjustment prior to working face transfixion. J. Min. Saf. Eng. 34, 60–66. doi:10.13545/j.cnki.jmse.2017.01.009
He, F. L., Lv, K., Li, X. B., Qin, B., and Li, L. (2021). Failure mechanism and control of lower retracement channel in close-distance double-thick coal seams. Shock Vib. 2021, 1–19. doi:10.1155/2021/6651099
He, F. L., Xu, X. H., Qin, B. B., Li, L., Lv, K., and Li, X. (2022a). Study on deformation mechanism and control technology of surrounding rock during reuse of gob side entry retaining by roof pre-splitting. Eng. Fail. Anal. 137, 106271. doi:10.1016/j.engfailanal.2022.106271
He, Y. J., Zhang, J. S., and Chen, K. (2022b). Analysis on the superposition effect of stress and the failure law of surrounding rock during the last mining period of pre-excavation return channel. J. Chongqing Univ., 45:58–67. doi:10.11835/j.issn.1000-582X.2020.262
Huang, R. B., Chen, X. Z., Wang, S. M., and Gu, S. (2022). Stability analysis of residual pillar in the adjustment of mine pressure in the final mining stage of fully mechanized face. Arabian J. Geosciences 15, 439. doi:10.1007/s12517-022-09498-1
Jia, C., Lai, X. P., Cui, F., Xu, H., Zhang, S., Li, Y., et al. (2024). Mining pressure distribution law and disaster prevention of isolated island working face under the condition of hard “umbrella arch”. Rock Mech. Rock Eng. doi:10.1007/s00603-024-03961
Kang, H. P., Wang, G. F., Wang, S. M., Liu, J., Ren, S., Chen, P., et al. (2021). High-quality development of China’s coal industry. Strategic Study CAE 23, 130–138. doi:10.15302/J-SSCAE-2021.05.016
Lai, X. P., Xu, H. C., Shan, P. F., Hu, Q., Ding, W., Yang, S., et al. (2024). Research on the mechanism of rockburst induced by mined coal-rock linkage of sharply inclined coal seams. Int. J. Minerals, Metallurgy Mater. 31 (5), 929–942. doi:10.1007/s12613-024-2833-8
Li, J. L., Gao, P. Q., Wang, X. Y., and Zhao, S. (2022b). Prediction of mine water inflow based on chaos-generalized regression neural network. Coal Sci. Technol., 50:149–155. doi:10.13199/j.cnki.cst.2020-0772
Li, Q., Qin, Y. J., and Gao, Z. N. (2021). Research on height prediction of “two zones” of overburden based on BP neural network. Coal Sci. Technol. 49, 53–59. doi:10.13199/j.cnki.cst.2021.08.006
Li, W. L., Tu, S. H., Tu, H. S., Li, Y., Liu, X., and Miao, K. (2022a). Failure characteristics and control techniques for mining roadway affected by stress accumulation of residual pillars in contiguous coal seams. Eng. Fail. Anal. 141, 106646. doi:10.1016/j.engfailanal.2022.106646
Lv, H. W. (2014). The mechanism of stability of pre-driven rooms and the practical techniques. J. China Coal Soc., 39:50–56. doi:10.13225/j.cnki.jccs.2014.0029
Ma, Q., Liu, X. L., Tan, Y. L., Elsworth, D., Shang, J., Song, D., et al. (2023). Numerical study of mechanical properties and microcrack evolution of double-layer composite rock specimens with fissures under uniaxial compression. Eng. Fract. Mech. 289 (2), 109403. doi:10.1016/j.engfracmech.2023.109403
Mishra, D. P., Panigrahi, D. C., Kumar, P., Kumar, A., and Sinha, P. K. (2021). Assessment of relative impacts of various geo-mining factors on methane dispersion for safety in gassy underground coal mines: an artificial neural networks approach. Neural Comput. Appl. 33, 181–190. doi:10.1007/s00521-020-04974-9
Pan, Y., Gu, S. T., and Qi, Y. S. (2012). Analytic solution of tight roof ’s bending moment and deflection under swelling distributive supporting pressure. Chin. J. Rock Mech. Eng. 31, 2053–2063.
Pan, Y., Gu, S. T., and Wang, Z. Q. (2015). Influence of coal seam plastic zone on hard roof mechanical behaviour. Chin. J. Rock Mech. Eng. 34, 2486–2499. doi:10.13722/j.cnki.jrme.2015.0083
Qin, B. B., He, F. L., Zhang, X. B., Xu, X., Wang, W., Li, L., et al. (2021). Stability and control of retracement channels in thin seam working faces with soft roof. Shock Vib. 2021, 1–12. doi:10.1155/2021/8667471
Shan, P. F., Shi, Y. W., Lai, X. P., Li, W., and Yang, T. (2024). Analysis of the evolution characteristics of infrared energy of coal samples under composite disturbance of dynamic and static loads. Environ. Earth Sci. 83 (7), 191. doi:10.1007/s12665-024-11511-7s12665-024-11511-7
Song, W. H., Yu, S. Q., Rong, H., Jiao, H., and Xu, X. (2024). Study on the characteristic of overburden rock structure and support system of the retraction channel in layered fully mechanized caving face. Sci. Rep. 14, 1360. doi:10.1038/s41598-024-52015-5024-52015-5
Vinay, L. S., Bhattacharjee, R. M., Ghosh, N., Budi, G., Kumar, J. V., and Kumar, S. (2022). Numerical study of stability of coal pillars under the influence of line of extraction. Geomatics, Nat. Hazards Risk 13, 1556–1570. doi:10.1080/19475705.2022.2088409
Wang, K., Zhuang, X. W., Zhao, X. H., Wu, W., and Liu, B. (2020). Roof pressure prediction in coal mine based on grey neural network. IEEE Access 8, 117051–117061. doi:10.1109/ACCESS.2020.3001762
Wang, X., Yin, S. X., Xu, B., Min, C., Runqi, Z., Zhongyi, T., et al. (2023b). Study on height optimization prediction model of overburden water-conducting fracture zone under fully mechanized mining. Coal Sci. Technol. 51, 284–297. doi:10.13199/j.cnki.cst.2022-1530
Wang, Y., Gong, B., Tang, C., and Yang, X. (2023a). Size effect and lateral pressure effect on the mechanical resistance of columnar jointed basalt. Int. J. Rock Mech. Min. Sci. 171, 105571. doi:10.1016/j.ijrmms.2023.105571
Wang, Z. Q., Wang, S. S., and Su, Z. H. (2021). New technology of collaborative work between face mining and bracket withdrawal. Coal Sci. Technol. 49, 21–29. doi:10.13199/j.cnki.cst.2021.02.003
Wu, W. D., Bai, J. B., Wang, X. Y., Yan, S., and Wu, S. x. (2019). Numerical study of failure mechanisms and control techniques for a gob-side yield pillar in the Sijiazhuang coal mine, China. Rock Mech. Rock Eng. 52, 1231–1245. doi:10.1007/s00603-018-1654-3
Xie, H. P., Ren, S. H., Xie, Y. C., and Jiao, X. (2021). Development opportunities of the coal industry towards the goal of carbon neutrality. J. China Coal Soc. 46, 2197–2211. doi:10.13225/j.cnki.jccs.2021.0973
Xu, H. C., Lai, X. P., Shan, P. F., Yang, Y., Zhang, S., Yan, B., et al. (2023). Energy dissimilation characteristics and shock mechanism of coal-rock mass induced in steeply-inclined mining: comparison based on physical simulation and numerical calculation. Acta Geotech. 18, 843–864. doi:10.1007/s11440-022-01617-2
Yang, P., Shan, P. F., Xu, H. C., Chen, J., Li, Z., and Sun, H. (2024). Experimental study on mechanical damage characteristics of water-bearing tar-rich coal under microwave radiation. Geomech. Geophys. Geo-energ. Geo-resour 10, 3. doi:10.1007/s40948-023-00726-w
Zhang, G. C., He, F. L., Jia, H. G., and Lai, Y. h. (2017). Analysis of gateroad stability in relation to yield pillar size: a case study. Rock Mech. Rock Eng. 50, 1263–1278. doi:10.1007/s00603-016-1155-1
Zhang, J. H. (2015). Study on movement law of surrounding rock and support adaptability of the broken roof in return channel. Coal Sci. Technol. 43, 28–31. doi:10.13199/j.cnki.cst.2015.12.006
Zhang, L. M., Lai, X. P., Shan, P. F., Zhang, Y., and Zhang, Y. (2024). Experimental investigation on the mixture optimization and failure mechanism of cemented backfill with coal gangue and fly ash. Powder Technol. 440, 119751. doi:10.1016/j.powtec.2024.119751119751
Zhao, Y. X., Yang, Z. L., Ma, B. J., Song, H., and Yang, D. (2020). Deep learning prediction and model generalization of ground pressure for deep longwall face with large mining height. J. China Coal Soc. 45, 54–65. doi:10.13225/j.cnki.jccs.YG19.0903
Zhu, D. F., Yu, B. B., Wang, D. Y., and Zhang, Y. (2024). Fusion of finite element and machine learning methods to predict rock shear strength parameters. J. Geophys. Eng. gxae064. doi:10.1093/jge/gxae064
Keywords: retracement channel, coal pillar, stability analysis, numerical simulation, neural network
Citation: Shan P, Meng Z, Lai X, Xue X, Li C, Wang J, Li W, Zhang L, Xi B and Jiang H (2024) A selection methodology on reasonable width of stabilized coal pillar for retracement channel in longwall working face. Front. Earth Sci. 12:1430018. doi: 10.3389/feart.2024.1430018
Received: 09 May 2024; Accepted: 10 July 2024;
Published: 01 August 2024.
Edited by:
Bin Gong, Brunel University London, United KingdomReviewed by:
Delei Shang, Shenzhen University, ChinaQifeng Guo, University of Science and Technology Beijing, China
Lianpeng Dai, Liaoning University, China
Copyright © 2024 Shan, Meng, Lai, Xue, Li, Wang, Li, Zhang, Xi and Jiang. This is an open-access article distributed under the terms of the Creative Commons Attribution License (CC BY). The use, distribution or reproduction in other forums is permitted, provided the original author(s) and the copyright owner(s) are credited and that the original publication in this journal is cited, in accordance with accepted academic practice. No use, distribution or reproduction is permitted which does not comply with these terms.
*Correspondence: Zheng Meng, MjMyMDMwNzcwNDRAc3R1Lnh1c3QuZWR1LmNu; Pengfei Shan, c2hhbnBlbmdmZWlAeHVzdC5lZHUuY24=