- 1School of Design, Fujian University of Technology, Fuzhou, Fujian, China
- 2Kongju National University, Gongju, South Chungcheong Province, Republic of Korea
- 3China State Construction Bridge COPR., LTD, Chongqing, China
- 4College of Civil Engineering, Chongqing University, Chongqing, China
The dynamic response characteristics of high and steep slopes under the action of earthquakes and blasting was focused on, especially the frequency distribution and propagation laws, which are crucial for slope stability assessment. Using stress wave theory as the theoretical basis and advanced FLAC3D numerical simulation technology, we systematically analyze the frequency response of slope under different joint conditions under seismic waves. The nonlinear characteristics of reflected P-wave coefficient and the significant sensitivity of joint to incident wave frequency are revealed when the Angle of incident P-wave changes. The results show that with the increase of the incidence Angle of the incident P-wave, the reflection coefficient of the reflected P-wave decreases slowly at first and then increases sharply to 1.0. The reflection coefficient of the wave at the joint is more sensitive to the frequency of the incident wave. In a biplanar rock mass, multiple reflections of waves between structural planes produce transmitted waves with different time differences.
1 Introduction
In recent years, with the cross-development of seismic engineering and geotechnical engineering, the propagation characteristics of seismic waves in complex geological structures and their effects on engineering structures have become a research focus. In particular, as a kind of structure with special geological characteristics, the frequency distribution characteristics of ceramic-soil joint slopes under the action of seismic waves have attracted much attention. Yue M simulated the influence of different seismic wave frequencies on ceramic soil joint slope through indoor shaking table test, and found that the existence of joint significantly changed the propagation path and frequency distribution of seismic waves, and the high-frequency component attenuated more significantly when passing through the joint, while the low-frequency component was relatively well preserved (Yue et al., 2024). Sun L used discrete element method (DEM) to simulate the propagation process of seismic waves in ceramic soil joint slopes, revealing the mechanism of the influence of joint geometry (such as spacing and inclination Angle) on the frequency distribution of seismic waves, and pointing out that the complexity of joint network increases the complexity of seismic wave dispersion (Sun et al., 2023). Based on the field monitoring data and numerical simulation results, Han Q established a frequency response model of the ceramic-soil joint slope under the action of seismic waves, which can better predict the frequency distribution characteristics of the slope under different seismic intensity and provide an important basis for slope stability assessment (Han et al., 2023). Edinliler A studied the quantitative relationship between seismic wave frequency and slope joint characteristics (such as joint density and filler properties) through statistical analysis, and proposed slope damage assessment indexes based on frequency distribution, providing a new method for rapid evaluation of slope stability after earthquakes (Edinliler and Yildiz, 2023). Matsumaru T focused on the influence of the frequency distribution of seismic waves on the dynamic response of the slope containing ceramic soil joints. Through dynamic finite element analysis, he found that high frequency seismic waves were more likely to cause local resonance of the slope and aggravate the slope failure. However, low-frequency seismic waves cause overall slope instability mainly through cumulative effect (Matsumaru et al., 2022). Zhang P proposed a comprehensive evaluation framework for the dynamic response of a ceramic-soil joint slope by comprehensively considering multiple factors such as frequency, amplitude and duration of seismic waves, and emphasized the key role of frequency distribution in evaluating the dynamic stability of the slope (Zhang et al., 2022). Huang Q applied the research results of seismic wave frequency distribution to practical projects, optimized the reinforcement design of a ceramic-soil joint slope, and effectively improved the seismic performance of the slope by adjusting the reinforcement measures to reduce the adverse effects of specific frequency seismic waves on the slope (Huang et al., 2022). Combined with the earthquake early warning system, Xie W proposed a slope early warning method based on the frequency distribution characteristics of seismic waves. Through real-time monitoring of the frequency changes of seismic waves, Xie W gave early warning of the possible instability risk of slope, providing strong support for disaster prevention and emergency response (Xie et al., 2024).
The scholars mainly consider the factors such as charge amount, detonation mode, detonation center distance, terrain conditions, etc., and summarize the law of the influence of different factors on blasting vibration frequency (Chen and Liu, 2019; Kaneshiro et al., 2020; Azarafza et al., 2021). However, the influence of the depth of buried blasting source on the blasting vibration frequency is not discussed. When analyzing the frequency propagation law of blasting seismic waves, most scholars rely on a single method to analyze the frequency propagation law of seismic waves, but do not analyze the frequency attenuation characteristics of seismic waves quantitatively and qualitatively from the Angle of spectrum curve change (Nanehkaran et al., 2023; Briffa et al., 2020; Azarafza et al., 2022). Because it does not consider the complex basic characteristics of the frequency component of blasting vibration signal, the proposed frequency prediction formula is not scientific (Zhang et al., 2023). This paper mainly studies the frequency characteristics and propagation laws of blasting seismic waves, but in engineering practice, the impact of blasting seismic waves on structures is the result of the joint action of peak vibration velocity and frequency (Mao et al., 2024). In the future, the research results should be combined with the peak vibration velocity to evaluate the impact of blasting earthquakes. Based on the stress wave theory, the propagation law of seismic wave frequency in slope rock mass is deduced, the rock mass medium and joint fracture are simplified, and the propagation law of longitudinal wave is mainly studied. The conclusion has some limitations in engineering application, so it is necessary to study this theoretical knowledge more systematically in the future.
2 Project overview
Niuhaohao kaolin (China clay ore) is located in Chaozhou City, eastern Guangdong Province, in the administrative division of Chaoan County Wenci town and Dashan town junction. The exploration area of the mining area is located in the subtropical oceanic monsoon climate area, and the China clay deposits are distributed on the hills with relatively slow slopes. In terms of regional structure, the mining area is located to the northwest of the Neocathaysian Chaozhou-Puning fault, and to the south of the middle of the Mesozoic Sanrao volcanic eruption basin. The lithology is mainly rhyoclastic crystalline tuff, interfused tuff and rhyoclastic tuff, and their weathering crust is often China clay ore body. The upper member of Nanshancun Formation (JKnc) is distributed in the southern part of the mining area, and its lithology is mainly gray-dark gray rhyolitic rock debris tuff, which can be partially formed into China clay ore after weathering. A fault can be seen in the north of the mining area, moving toward the northeast, with the occurrence of 350°∠70°. Due to the development of structural cracks in the fracture section, surface water formed by atmospheric rainfall infiltrated along the cracks, polluting the orebodies on both sides of the cracks, and having a greater impact on the ore quality. Meanwhile, China clay ore contains weak structural plane, as shown in Figure 1.
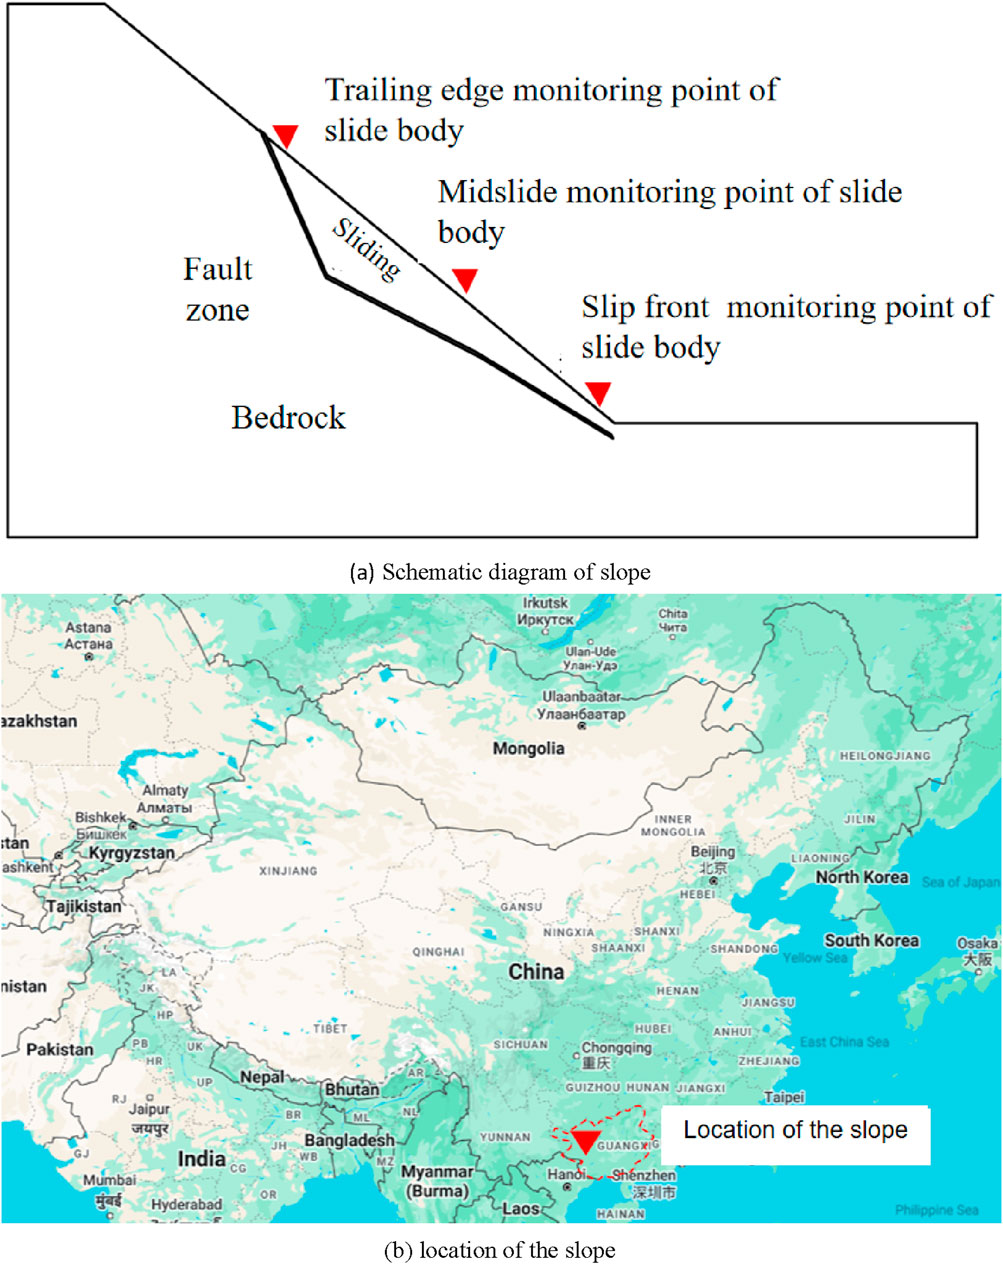
Figure 1. Schematic diagram and location of slope. (A) Schematic diagram of slope (B) location of the slope.
2.1 Model test system
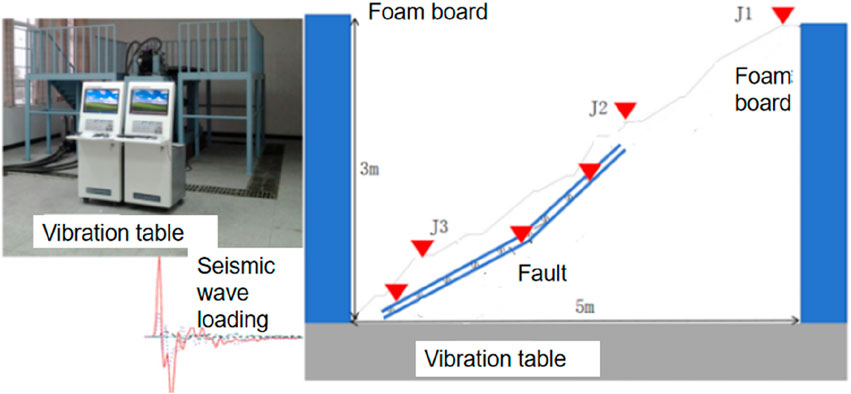
The slope is greatly affected by mining blasting, and the cumulative damage is serious. Vibration table test was used to simulate slope vibration. In-situ rock samples are used as original rock samples to produce similar materials. Material parameters are obtained through physical and mechanical properties testing, in which the prototype material and similar material are determined by the law of similarity, with a similarity ratio of 129. Meanwhile, physical and mechanical properties of similar materials are obtained through conventional physical tests, such as shear test and compressive test, etc. Relevant parameters are shown in Table 1, 2.
Because the blasting seismic wave is difficult to simulate, the test adopts sine wave to simulate the vibration load, which has most of the characteristics of seismic wave and simplifies the calculation. The intensity of blasting vibration load in Daye Iron Mine is converted to vibration table acceleration and corresponding sinusoidal wave is applied. The number of cycle loads is divided into 12 levels from 750 to 12,000. The intensity of cyclic loading is graded on a 4-point scale from 0.5 to 2.2. Horizontal vibration is very important for slope stability, so horizontal X direction loading is adopted, the shaking table system is shown in Figures 2, 3.
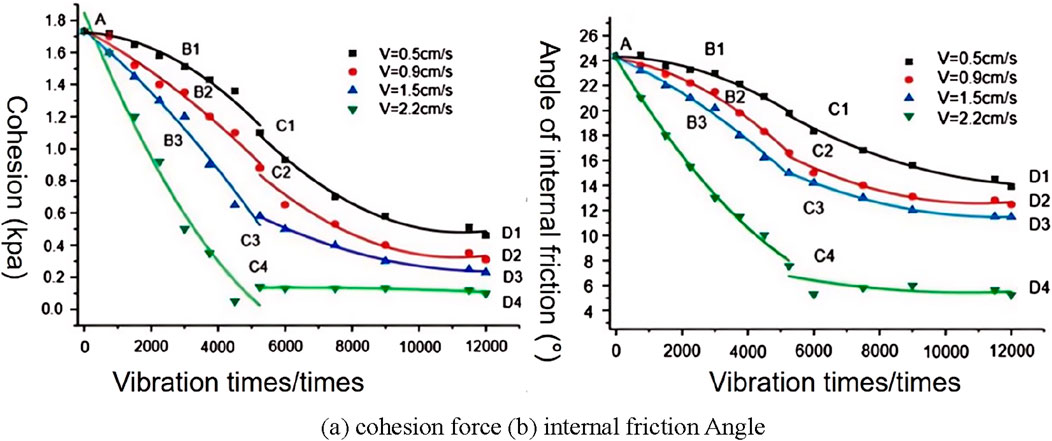
Figure 3. Variation of shear strength parameters of similar materials in fault zones. (A) cohesion force (B) internal friction Angle.
According to the test parameter table, the experiment was carried out, and the shear strength parameters of the fault zone during the statistical test were shown in Figure 3.
As can be seen from Figure 3: Under the same circumstances, the cohesive force of soil in the fault zone of slope changes greatly, followed by the friction Angle. Meanwhile, in the slope failure process, the cohesive force dominates. When the seismic vibration intensity is less than or equal to 1.5 cm/s, the percentage of the cohesive force weakening value increases from 4.73% to 62.47%, and the internal friction Angle increases from 3.29% to 33.32%. When the seismic vibration intensity is equal to 2.2 cm/s, the percentage of cohesion weakening value increases from 30.72% to 97.11%. When the seismic vibration intensity is equal to 2.2 cm/s, the failure is caused by the inertial force.
2.2 Establishment of numerical model of bedding rock landslide
Based on the actual working conditions, a bedding rock slope model is established. The maximum absolute height in the vertical direction is 680 m, the slope height is 423.6 m, the slope Angle is 43°–46°, the fault is 300 m high, and the inclination is 70°. The slope model is shown in Figure 1, where the x direction is east-west and the y direction is north-south. The FLAC3D software is used to simulate the cumulative degradation law of strata rock landslide under the cumulative action of blasting. The materials in this calculation model are shown in Table 1, 2. The mechanical parameters of landslide slip zone (fault zone) are implanted into the numerical model through FISH language, and the mechanical parameters of slide zone that are compatible with the characteristics of landslide evolution are constantly updated. Thus, the dynamic simulation in accordance with the real evolution law of sliding slope is realized.
(1) Numerical model of bedding rock slope with faults established in FLAC3D.
(2) The sliding bed was fixed and set as an elastic material, the sliding strip (fault zone) and the sliding body as an elastic-plastic material, and the whole material was assigned parameters. At the same time, the numerical model was run to equilibrium to form a complete initial stress field.
(3) Remove the displacement stress field after the initial stress balance, assign the mechanical parameters of the material in the fault zone when the slip zone (fault zone) is subjected to 750 times of blasting vibration, and run the model to calculate the equilibrium.
(4) After the above calculation model is balanced, continue to invoke the calculation results of the model. In addition, the mechanical parameters of materials with 1,500, 2,250, 3,000, 3,750, 4,500, 5,250, 6,000, 7,500, 9,000, 11,500 and 12,000 times of blasting vibration were successively assigned to the fault zone materials, and the numerical model convergence calculation was continued.
(5) If the numerical model cannot be calculated to convergence, the calculation is stopped and the corresponding calculation results are output.
(6) The dichotomy calculation principle was adopted to reduce the shear strength value based on the limit equilibrium theory, and the strength reduction principle was adopted to reduce the value of the shear strength, and the iterative accuracy of the stability coefficient was set to be less than or equal to 0.02, and the reduction coefficient was taken as the safety stability coefficient of the slope as the result of this calculation.
(7) Model calculation convergence criteria When the operation is less than the typical time step, the typical time step of the model can be obtained by rough trial calculation, so that the unbalance ratio in the model is less than the critical value, the model can be considered convergence, otherwise the model will not converge. At the same time, the convergence of the model calculation can be combined with the change trend of the displacement monitoring of the key parts of landslide to assist the judgment.
In order to monitor the displacement change at the landslide front in the process of landslide evolution, a numerical monitoring point was set at the front of the model (as shown in Figure 4). In the calculation process of the numerical model under different blasting vibration intensities, the horizontal displacement of the monitoring point changes with the increase of the calculation time step, as shown in Figure 5. Moreover, the model experiment is compared with the displacement obtained in FLAC3D. As can be seen from Figure 5, the displacement variation law of slope is basically the same under different blasting vibration conditions, and the error difference between the data obtained by model experiment and the data obtained by FLAC3D model is not large, thus verifying the accuracy of the model parameters calculated by FLAC3D.
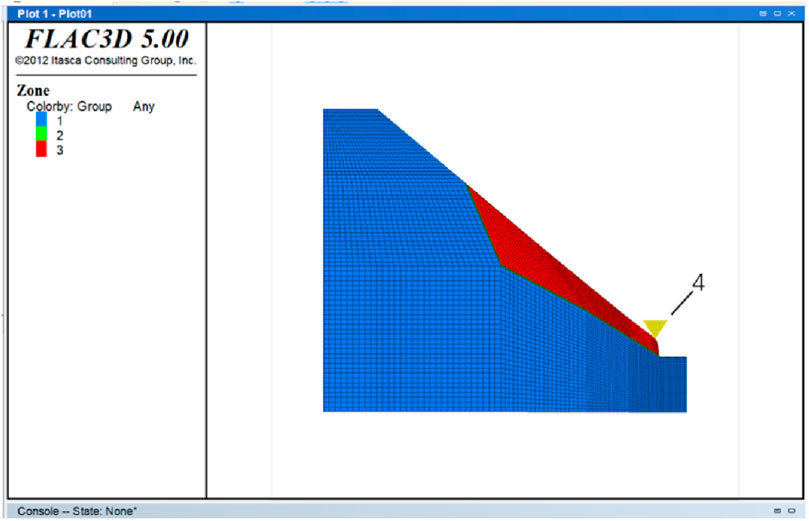
Figure 4. Schematic diagram of numerical model of bedding rock landslide with fault zone as slip zone (1 represents slip bed, 2 represents slip zone (fault zone), 3 represents slip body, and 4 horizontal displacement monitoring points).
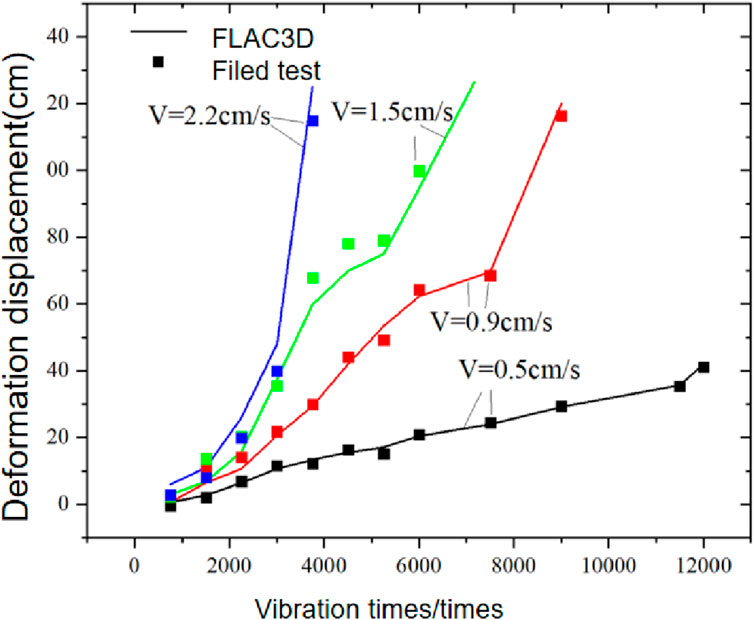
Figure 5. Changes of the horizontal displacement of the monitoring point with the increase of the calculation time step during the calculation of the numerical model.
3 Theoretical analysis of seismic vibration frequency propagation characteristics of rock slope
Based on the stress wave theory of the corresponding medium model, the general law of seismic wave propagation in slope rock mass is analyzed. On this basis, combined with the seismic vibration frequency characteristics of slope rock mass measured on site, the slope rock mass and seismic wave are simplified to some extent, and the characteristics of seismic vibration frequency propagation of slope rock mass are analyzed. The research results will have a certain universal value.
There are two kinds of rock response to seismic loads: transient deformation and non-transient deformation. The transient deformation is time-independent elastic deformation, and the non-transient deformation is time-dependent viscous deformation. When analyzing the response of rocks under dynamic loads, the viscoelastic model takes into account both the elasticity and viscosity of the medium, in which the elastic properties of the medium are described by linear elastic law and the viscous properties of the medium by linear viscous law. The one-dimensional forms of the two are expressed as follows (Equations 1, 2) (Matsumaru et al., 2022):
Under the condition of small deformation, ignoring the difference between Lagrange variable and the Euler variable, the velocity gradient is equal to the strain rate, that is (Equations 3, 4):
Then Formula 2 can be rewritten as:
That is the linear relationship between stress and strain rate.
Where σ is the stress, E is the Young modulus, ƞ is the viscosity constant, ε is the strain, ν is the particle velocity, x is the space position, X is the particle position, is the strain rate, u is the displacement, t is the time.
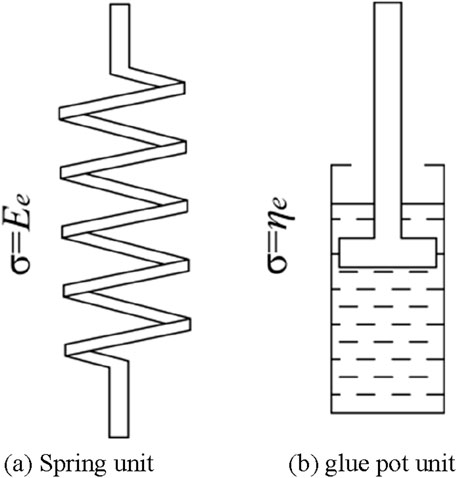
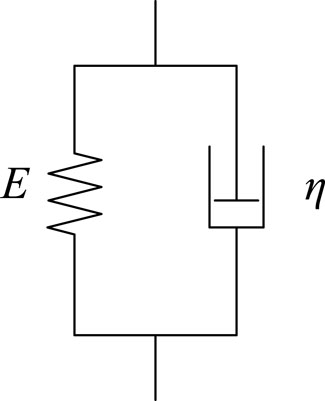
For the viscoelastic medium model, many hypotheses have been proposed: Maxwell solid model, Kelvin solid model, standard linear viscoelastic model and so on. Among them, the Kelvin solid model is one of the most used models in seismic exploration. This model is a parallel connection between an elastic unit (spring) and a linear viscous unit (sticky pot) (Figures 6, 7) to describe the viscoelastic characteristics of the medium.
In the Kelvin solid model, the strain of the spring and the pot is equal , as shown in Equations 5–7 (Azarafza et al., 2021):
The total stress is the sum of the stresses of both:
By connecting the lines (1), (4), (5) and (6), the constitutive relation of the Kelvin solid model can be obtained:
3.1 Influence of viscoelastic joint on seismic wave frequency
The characteristics of stress wave propagation are directly affected by the mineral composition, density, porosity, structural plane property and scale of rock mass medium, especially the structural plane of rock mass. In this section, the joint crack of rock slope is abstracted as viscoelastic joint, and its mechanical properties are described by Kelvin solid model. Seismic waves are reduced to simple harmonics of a single frequency. The transmission characteristics of seismic waves at viscoelastic joints are analyzed, and the influence of rock slope joint cracks on seismic wave frequency is studied.
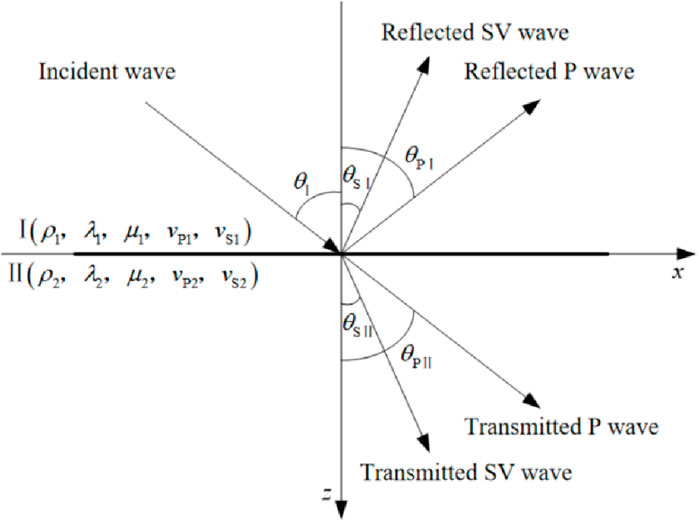
Suppose that a series of harmonic longitudinal waves from medium 1 oblique incident Angle into the viscoelastic joint into medium 2, wave transmission and reflection occur at the joint, and reflection and transmission wave are generated in medium 1 and medium 2 respectively. The schematic diagram of harmonic longitudinal waves oblique incident on the viscoelastic joint is shown in Figure 8.
The displacement function of the P wave is shown in Equation 8 (Nanehkaran et al., 2023):
The displacement function of SV wave is shown in Equation 9.
In Equations 8, 9, when m = 1 and 2, they represent the up and down waves respectively, and r and i represent the real and imaginary parts of the complex numbers respectively. AP and AS are the amplitudes of P and SV waves respectively, t is time and j is an imaginary unit. The complex velocity of P and SV waves is shown in Equation 10 (Zhang et al., 2023):
In Equation 11, ν is Poisson’s ratio.
For both medium 1 and medium 2 calculated according to the Kelvin model, the modulus in complex form can be obtained, as shown in Equation 12.
In Equation 11, E is the elastic modulus, η is the viscosity coefficient, and ω is the angular frequency. The viscoelastic joint satisfies the generalized Snell law is shown in Equation 13.
3.2 Harmonic reflection coefficient in viscoelastic joint
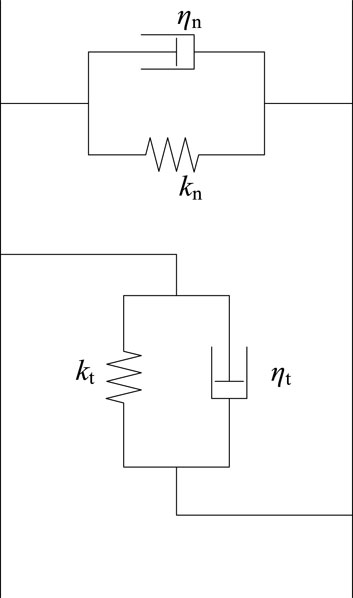
The viscoelastic joint model is shown in Figure 9, where kn and kt are the normal and tangential stiffness of the joint respectively, and ηn and ηt are the normal and tangential viscosity coefficients of the joint respectively.
The most widely developed shear joints of slope rock mass are those cutting diorite rock mass, and the scale is generally small. The slope rock mass joints are simplified, ignoring joint thickness and joint quality. When harmonic transmission passes through the viscoelastic joint, the stress on both sides of the joint is continuous and the displacement is discontinuous, and the displacement discontinuity is equal to the ratio of stress and stiffness on both sides of the joint, namely:
In Equation 14, KX and KZ respectively represent the equivalent tangential stiffness and equal canonical stiffness of the joint, expressed as:
Combined with the above formula, the transmission and reflection coefficients of P-wave oblique incidence of viscoelastic joint are obtained, as shown in Equation 16.
The calculation formula for each matrix is as follows Equation 15:
3.3 Transreflectance of harmonics in viscoelastic joints
According to the above analysis of the in-situ seismic vibration data of the slope, considering that about 95% of the energy of the seismic vibration of the slope is concentrated in 0–80 Hz, assuming that the frequency of the incident harmonic longitudinal wave is 50 Hz and the incident harmonic frequency is kept unchanged, the transmittance and reflection law of the viscoelastic joint at different angles of the stress wave is analyzed.
If the physical and mechanical properties of the rock mass on both sides of the viscoelastic fracture are assumed to be the same, with a density of 2710 kg/m3, a modulus of elasticity of 30.41 GPa, a Poisson’s ratio of 0.23, and a viscosity coefficient of 0.6 MPa s, and the incident harmonic frequency is 50hz, the node parameters are described as follows: the normal viscosity coefficient is 15 MPa s, the shear viscosity coefficient is 15 MPa s, the normal stiffness is 1.0 GPa/m, and the shear stiffness is 1.0 GPa/m. By substituting these parameters into Equation 17, the transmission and reflection coefficients of the incident wave in the viscoelastic fracture can be obtained.
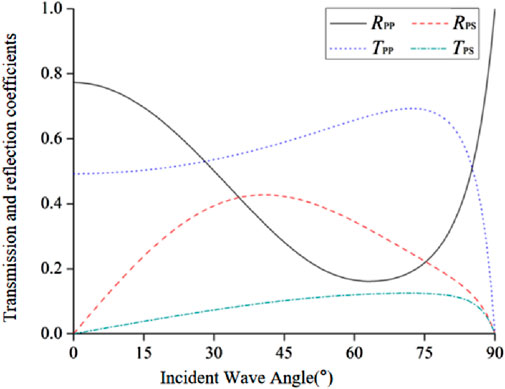
Set the physical and mechanical parameters of the rock mass and joint as described above, change the incident angle of the incident wave, and calculate the transmission coefficient and reflection coefficient of the P-wave incident at different angles of the viscoelastic joint, as shown in Figures 10.
As can be seen from Figures 10, in the case of inclined incidence of a simple harmonic p-wave to a viscoelastic joint, when the incidence Angle varies between 0° and 90°, with the increase of the incidence Angle of the incident P-wave, the reflection coefficient of the reflected P-wave presents a trend of first slowly decreasing and then sharply increasing to 1.0. When the incidence Angle is 65°, the reflection coefficient of the reflected P-wave reaches the minimum value of 0.16. When the incidence Angle is 90°, the reflection coefficient of the reflected P-wave reaches the maximum value of 1.0. The reflection coefficient of the reflected SV wave increases first and then decreases. When the incidence Angle is 0° and 90°, the reflection coefficient of the reflected SV wave reaches the minimum value of 0; when the incidence Angle is 43°, the reflection coefficient of the reflected SV wave reaches the maximum value of 0.43; The transmission coefficient of the transmitted P wave increases slowly first and then decreases sharply. When the incidence Angle is 90°, the transmission coefficient of the transmitted P wave reaches the minimum value of 0. The transmission coefficient of the transmitted SV wave increases slowly at first and then decreases sharply. When the incidence Angle is 0° and 90°, the transmission coefficient of the transmitted SV wave reaches the minimum value of 0.
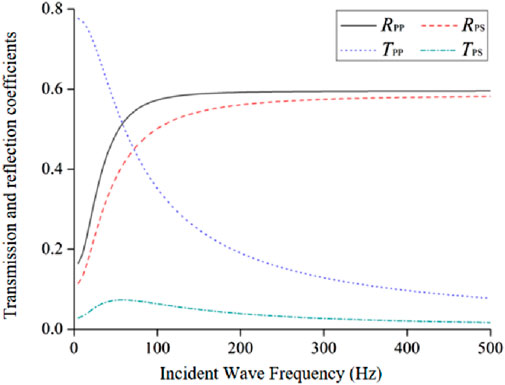
Based on the spectral feature analysis of the seismic vibration data from the site slope, the seismic wave is a composite signal with multiple main frequencies. The signal components in the seismic vibration data from the site slope are mainly concentrated in the range of 0–400 Hz, and the high-frequency components are more abundant in the vibration signals near the seismic source. In order to increase the universality of the analysis work, this section selects simple harmonic waves with different frequencies within the range of 0–500 Hz for analysis. Setting the physical and mechanical parameters of the rock mass and joints, when the incidence angle is 30°, the transmittance and reflection coefficients of the harmonic longitudinal wave incident on the viscoelastic joint with different frequencies are calculated and shown in Figure 11.
As can be seen from Figure 11, when a harmonic p-wave is inclined to incident the viscoelastic joint, the reflection coefficients of reflected P wave and reflected SV wave gradually increase with the increase of incident P wave frequency, and eventually tend to be stable. The transmission coefficient of the transmitted P wave decreases gradually, and finally tends to 0, while the transmission coefficient of the transmitted SV wave increases first and then decreases. When the incident P-wave frequency is less than 100 Hz, the transmission coefficient and reflection coefficient change very fast, and when the incident P-wave frequency is greater than 100 Hz, the transmission coefficient and reflection coefficient change relatively slowly. From the general trend, the greater the frequency of incident P wave, the greater the reflection coefficient of stress wave and the smaller the transmission coefficient, indicating that the joint has the characteristics of high frequency filtering, and the higher the frequency of stress wave passing through the joint, the less the component retained.
When the incident Angle is 30°, the normal and tangential viscosity coefficients of the joint are changed at the same time, and the normal and tangential viscosity coefficients are kept consistent. The transreflectance coefficient of the incident longitudinal wave varies with the incident simple harmonic frequency under different joint viscosity coefficients, as shown in Figure 12.
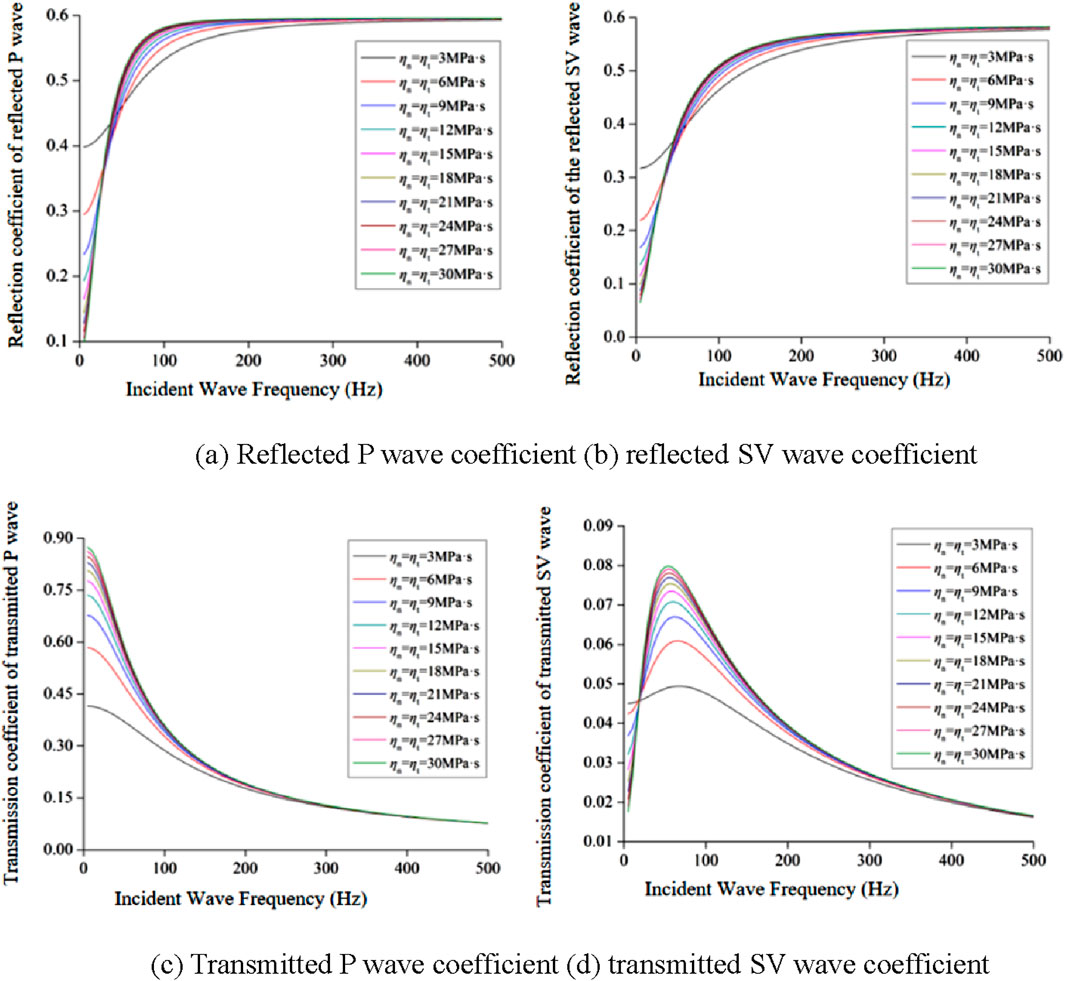
Figure 12. Relation between transreflectance coefficient and frequency under different viscosity coefficients. (A) Reflected P wave coefficient (B) reflected SV wave coefficient (C) Transmitted P wave coefficient (D) transmitted SV wave coefficient.
As can be seen from Figure 12, in the case of a simple harmonic longitudinal wave inclined incident viscoelastic joint, when the joint viscosity coefficient η varies between 3 and 30 MPa s, with the increase of the joint viscosity coefficient, the transreflectance coefficient of the stress wave maintains a constant trend with the frequency of the incident wave, but its variation range gradually increases. As can be seen from Figure 12A, when the frequency of the incident P-wave is greater than 200 Hz, the reflection coefficient of the reflected P-wave is basically unchanged, keeping at about 0.6, while when the frequency of the incident P-wave is less than 50 Hz, the reflection coefficient of the reflected P-wave decreases with the increase of the joint viscosity coefficient. It can be seen from Figure 12B that the influence of the joint viscosity coefficient on the reflection coefficient of reflected SV is basically the same as that of reflected P wave. As can be seen from Figure 12C, when the incident P-wave frequency is less than 100 Hz, the transmission coefficient of transmitted P-wave increases with the increase of joint viscosity coefficient. However, when the incident P-wave frequency is greater than 100 Hz, the joint viscosity coefficient has limited influence on the transmission coefficient of transmitted P-wave. As can be seen from Figure 12D, when the incident P-wave frequency is less than 200 Hz, the transmission coefficient of transmitted P-wave increases with the increase of joint viscosity coefficient. However, when the incident P-wave frequency is greater than 200 Hz, the joint viscosity coefficient has limited influence on the transmission coefficient of transmitted P-wave. The variation law of the transreflectance coefficient with incident wave frequency under different viscosity coefficients in Figure 12 is summarized as follows: With the increase of the joint viscosity coefficient, the greater the fluctuation range of the wave transreflectance coefficient with frequency, indicating that the greater the joint viscosity coefficient, the more sensitive the wave transreflectance coefficient at the joint is to the incident wave frequency.
When stress waves are reflected multiple times between tectonic surfaces (such as joints, faults, etc.), a portion of the energy is absorbed or converted into other forms of energy (such as heat) with each reflection. Therefore, with the increase of the number of reflections, the energy of the transmitted wave will gradually decay. This energy attenuation will cause the amplitude of the transmitted wave to decrease, which will affect its propagation distance and effect.
Multiple reflections will not only lead to energy attenuation, but also cause waveform distortion. Waves of different frequencies may have different attenuation degrees and phase changes during reflection, which makes the transmitted wave waveform complicated and difficult to predict. Waveform distortion may make the transmitted wave no longer maintain the original waveform characteristics, thus affecting the information and energy distribution carried by the transmitted wave.
4 Influence characteristics of slope rock mass structure
4.1 Influence characteristics of slope rock mass structure on blasting vibration frequency propagation
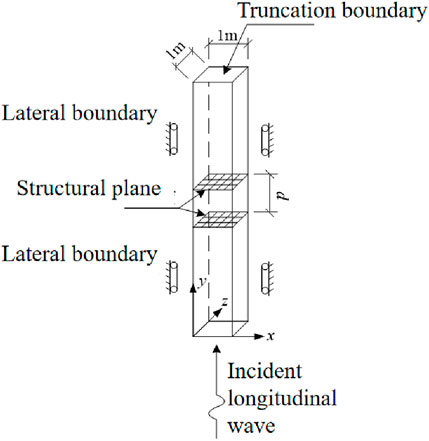
A slender rod model was established, as shown in Figure 13. The model dimensions were 1 m × 400 m × 1 m, with the structural plane located at the position of y = 200 m in the slender rod. In order to ensure the computational accuracy of the numerical simulation of stress wave propagation, the mesh size ∆l of the model must be less than 1/8 to 1/10 of the input waveform wavelength. Considering the model size and the computational accuracy requirements, the grid size in the x and z directions of the rock rod was 0.2 m, and the grid size in the y direction was 1 m. The upper and lower boundaries of the model were non-reflective boundaries, and the normal displacement was constrained on the side. The slender rod material was modeled using a linear elastic model, and the structural plane was modeled using a Coulomb shear model.
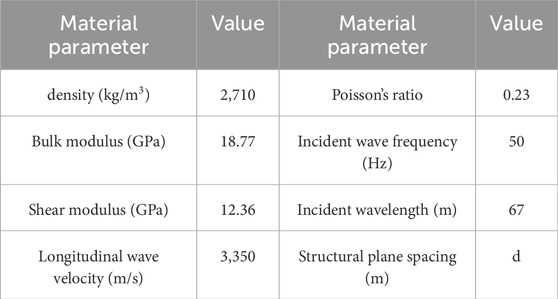
The slope rock mass and blasting seismic wave are simplified to some extent, and the slope rock mass is assumed to be elastic isotropy. With reference to the physical and mechanical parameters of the rock mass of the slope, the density of the rock rod model material is 2710 kg/m3, the elastic modulus is 30 GPa, and the Poisson’s ratio is 0.23. Using the relationship between the elastic modulus, shear modulus, density, and the elastic wave velocity, the longitudinal wave velocity can be calculated to be 3350 m/s. The blasting seismic wave is simplified into simple harmonics with a single amplitude and frequency. With reference to the measured blasting seismic wave data, the simple harmonic frequency is 50 Hz and the amplitude of vibration velocity is 1.0 cm/s. The simplified blasting seismic wave waveform is applied to the bottom of the rock rod model, and the expression of the waveform is as follows (Equation 18):
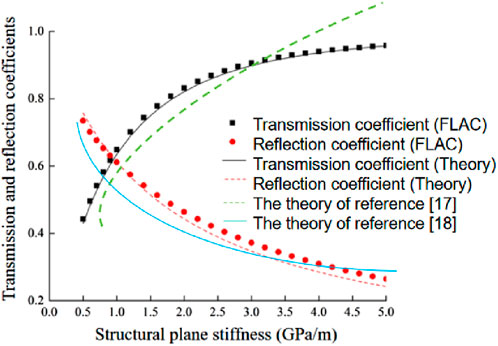
In order to prevent the superposition of incident wave and transparent reflected wave, a measuring point is selected at y = 50 m and y = 350 m respectively, and the speed in the y direction of these two points is selected to be monitored. The transmission coefficient is defined as the ratio of the peak vibration velocity at the side measurement point above the structural plane to the peak vibration velocity at the side measurement point below the structural plane. In this section, the case of vertical incidence is selected for comparative analysis, where RS = TS = 0. The same rock material and structural plane parameters are substituted into the analytical iterative equation and the numerical model respectively, and the calculation results under different structural plane stiffness are calculated. Figure 14 shows the transreflectance waveform when the normal stiffness and tangential stiffness of the structural plane are both 2 GPa/m, and Figure 15 shows the transreflectance coefficients calculated by theoretical calculation and numerical simulation under different structural plane stiffness.
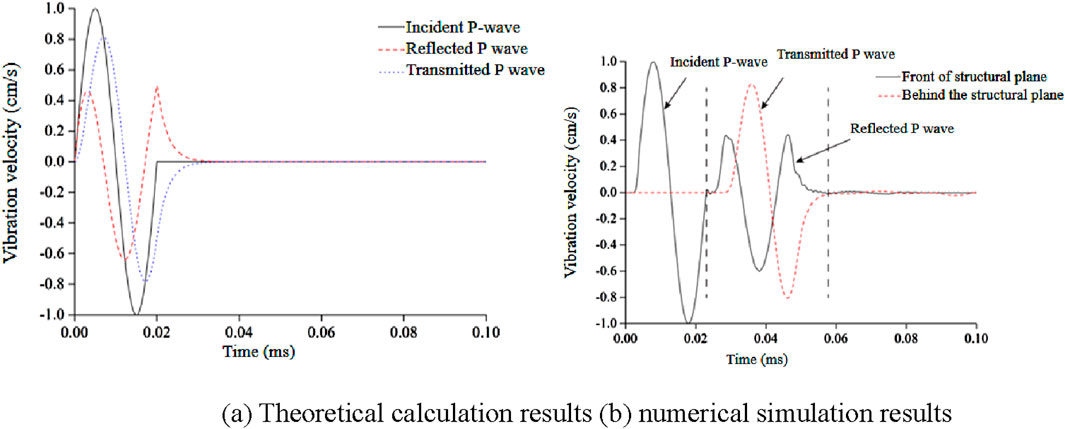
Figure 14. Transreflection wave when the structural plane stiffness is 2 GPa/m. (A) Theoretical calculation results (B) numerical simulation results.
As can be seen from Figure 14, the reflected P-wave and transmitted P-wave morphology obtained by numerical simulation are very close to the theoretical calculation results, with high precision. When the structural plane stiffness is in the range of 0.5–5.0 GPa/m, the error of stress wave transmission coefficient and stress wave reflection coefficient calculated by finite difference calculation and theoretical formula is less than 2.9% and less than 8.5%. As can be seen from Figure 15fig15, the error of permeability coefficient and reflection coefficient calculated by numerical simulation and theoretical derivation is not large, and the results are in good agreement, while the reference (Baziar and Dehghani, 2021) and reference (Wu et al., 2021) differ greatly from the numerical simulation, and cannot truly reflect the actual change law. In summary, it is feasible to use numerical simulation method to calculate stress wave propagation in single structural plane rock mass. At the same time, it can be seen that when the stress wave passes through a single structural plane, the transmission coefficient of the stress wave increases exponentially with the increase of the structural plane stiffness, while the reflection coefficient of the stress wave decreases exponentially. The transmission coefficient and reflection coefficient of stress wave vary from 0 to 1. In the work of disaster prevention and mitigation, the monitoring and early warning of dynamic response and stability of slope should be strengthened. By monitoring the dynamic response data of the slope in real time, the abnormal changes of the slope are found in time, and the corresponding disaster prevention and reduction measures are taken. At the same time, we should strengthen the research and analysis of seismic wave spectrum characteristics, and provide strong support for the formulation of scientific disaster prevention and reduction programs.
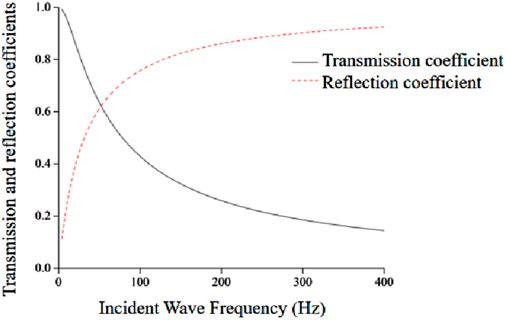
Under the condition that rock materials and structural plane parameters remain unchanged, the trans reflectance of stress waves of different frequencies passing through the structural plane is simulated and analyzed. The statistics of trans reflectance coefficients are shown in Figure 16.
The results in Figure 16 show that when the stress wave passes through a single structural plane, the reflection coefficient of the stress wave increases exponentially with the increase of the frequency of the incident wave, while the transmission coefficient of the stress wave decreases exponentially, indicating that the higher the frequency of the stress wave, the more energy the stress wave passes through the structural plane, and the effect of high-frequency filtering exists in the structural plane in the rock.
4.2 Frequency variation of stress waves passing through biparallel structural planes
By comparing the results of theoretical calculation and numerical simulation, the feasibility of the FLAC-3D finite difference program for simulating stress waves passing through a single structural plane is verified, and it is concluded that the stiffness of the structural plane and the frequency of the incident wave are two important factors affecting the reflection coefficient of stress waves in the rock mass with the structural plane, as shown in Figure 17. Due to the multiple transmission and reflection of stress waves between multiple structural planes, the wave field in rock mass with multiple structural planes is very complicated. Compared with single-structural plane rock mass, the frequency variation characteristics of stress waves passing through multi-structural plane rock mass are also different. Under the condition that the stiffness of the structural plane and the frequency of the incident wave remain unchanged, the simulation method is applied to analyze the propagation of stress waves in the rock mass with the double parallel structural plane.
The boundary conditions, dimensions, and other parameters of the longitudinal wave vertical incidence model of rock mass with double parallel structural planes are consistent with that of the single structural plane model. Based on the single structural plane model, a new parallel structural plane is added. The distance between the two structural planes is set as d, and the location of the measuring point remains unchanged. The parameters of the medium, structural plane, and incident wave are shown in Table 3.
4.3 Influence of structural plane spacing on transmission coefficient
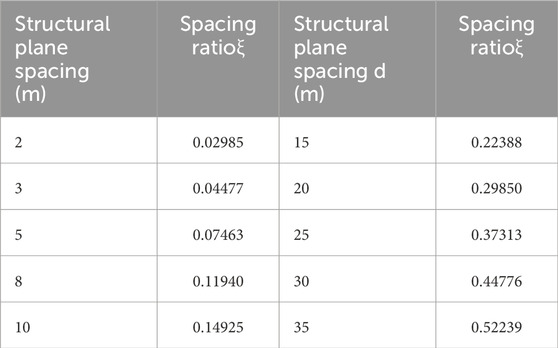
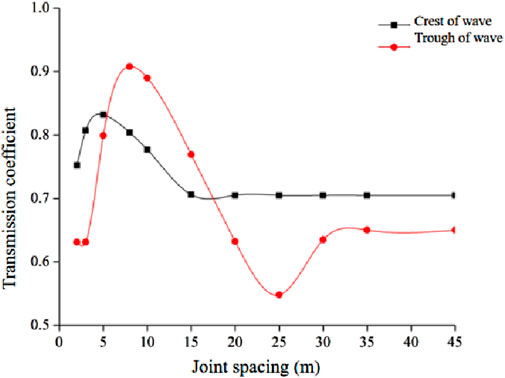
The distance between structural planes is an important factor affecting the propagation of stress waves in multiple structural planes. The transreflectance of stress waves through two parallel structural planes with different distances is analyzed by changing the distance between structural planes while keeping other parameters of the model unchanged. Since the incident wave is set as a periodic sine wave, there is a crest and a trough, and the changes of the crest and trough after passing through the structural plane are calculated respectively. A dimensionless parameter, spacing ratio ξ, is introduced, which is defined as the ratio of the spacing d between two structural planes to the incident wavelength λ. The change of stress wave transmission coefficient through a double structural plane is shown in Fig. 18fig18. The values of the spacing ratios corresponding to the spacing d of different structural planes are shown in Table 4.
As can be seen from Figure 18, when the stress wave passes through the double parallel structural planes, the transmission coefficient of the sine wave peak first increases and then decreases with the increase of the spacing (distance ratio) of the structural planes. When the spacing of the structural planes is greater than 15 m, i.e., the spacing ratio of the structural planes is greater than 0.22, the transmission coefficient of the wave peak is stable at 0.70. With the increase of the spacing ratio of the structural planes, the transmission coefficient of the sine wave trough shows a trend of first increasing, then decreasing, and then increasing again. When the spacing of the structural planes is greater than 30 m, i.e., the spacing ratio of the structural planes is greater than 0.45, the transmission coefficient of the trough is stable at 0.64. This phenomenon indicates that the transmission coefficient of stress wave is inevitably related to the ratio of the spacing of structural planes within a certain range.
4.4 Influence of structural plane spacing on the waveform
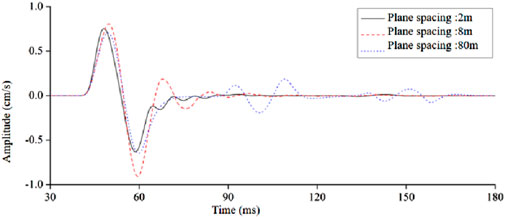
The waveform of a periodic sinusoidal stress wave passing through the double-parallel structural plane with different structural plane spacing (spacing ratio) is shown in Figure 19. It can be seen that when the structural plane spacing is 2 m (the spacing ratio is 0.03), the reflected wave dp is reflected twice on the double structural plane, and the incident wave ap is superimposed. When the distance between the structural planes is 80 m (the distance ratio is 1.19), the reflected wave dp is separated from the incident wave ap after two reflections on the double structural plane. Combined with Figures 18, 19, it can be seen that when stress waves pass through biparallel structural planes when the ratio of structural plane spacing is less than a certain critical value, the waveform and amplitude of transmitted stress waves passing through the biparallel structural planes will change due to the superposition effect of reflected wave and incident wave. When the structural plane spacing ratio is large enough, the reflected wave and the incident wave will separate without superposition. In two-plane rock mass, the transmitted waves with different time differences are generated by multiple reflections between the structural planes. The transmitted waves passing through parallel structural planes can be regarded as a superposition of transmitted waves generated at different times.
5 Conclusion
Blasting is a necessary means of mining production and engineering construction in China, such as ore mining and rock excavation. While bringing huge benefits, geological disasters such as landslide and collapse induced by blasting dynamic load are not uncommon. The problem of slope instability caused by blasting dynamics has become an important scientific and technical problem in the field of mine production and geotechnical engineering construction in China. The damage of blasting vibration not only depends on the intensity of blasting seismic waves, but also closely related to the frequency of seismic waves. While summarizing the attenuation law of peak particle vibration velocity, further study on the distribution characteristics and change law of blasting seismic wave frequency is of great significance to the research and engineering application of blasting vibration control.
In the case of a simple harmonic p-wave inclined incident viscoelastic joint, when the incident angle changes between 0° and 90°, the reflection coefficient of the reflected P-wave presents a trend of slow decrease at first and then sharp increase to 1.0 with the increase of the incident P-wave incident Angle. The greater the frequency of the incident P-wave, the greater the reflection coefficient of the stress wave and the smaller the transmission coefficient, indicating that the joint has the characteristics of high-frequency filtering. The higher the frequency of the stress wave passing through the joint, the less the component is retained.
When the incident P-wave frequency is less than 50 Hz, the reflection coefficient of the reflected P-wave decreases with the increase of the joint viscosity coefficient. With the increase of the joint viscosity coefficient, the greater the fluctuation range of the wave transreflectance coefficient with frequency, indicating that the greater the joint viscosity coefficient, the more sensitive the wave transreflectance coefficient at the joint is to the frequency of the incident wave.
When the stress wave passes through a single structural plane, the transmission coefficient of the stress wave increases exponentially with the increase of the structural plane stiffness, while the reflection coefficient of the stress wave decreases exponentially. In a certain range of the structural plane spacing ratio, the transmission coefficient of the stress wave is inevitably related to the structural plane spacing ratio.
In two-plane rock mass, the transmitted waves with different time differences are generated by multiple reflections between the structural planes. The transmitted waves passing through parallel structural planes can be regarded as a superposition of transmitted waves generated at different times.
This paper mainly studies the frequency characteristics and propagation laws of blasting seismic waves, but the impact of blasting seismic waves on structures in engineering practice is the result of the joint action of the peak vibration velocity and frequency. In the future, the research results should be combined with the peak vibration velocity and applied to the impact evaluation of blasting earthquake. When the propagation law of seismic wave frequency in slope rock mass is deduced based on stress wave theory, the rock mass medium and joint fracture are simplified, and the propagation law of longitudinal wave is mainly studied. The conclusions drawn have certain limitations in engineering application, and it is necessary to study and study this theoretical knowledge more systematically in the future.
To sum up, engineers should consider geological characteristics, seismic factors, slope shape and size, supporting structure and other relevant factors when designing slope in earthquake-prone areas to ensure the stability and safety of slope. Through scientific design and construction, it can effectively reduce the destructive effect of earthquake on slope and ensure the safety of people’s lives and property. When studying the change rule of seismic wave propagation frequency in rock mass with structural plane, some assumptions and simplification have been made on structural plane, seismic wave, incidence Angle and superposition effect, and the conclusions drawn based on these assumptions are not precise enough. In the future, complex and special situations in practical engineering should be taken into account to make the research work more systematic and comprehensive.
Data availability statement
The original contributions presented in the study are included in the article/supplementary material, further inquiries can be directed to the corresponding author.
Author contributions
ZW: Data curation, Methodology, Writing–original draft, Writing–review and editing. XL: Data curation, Formal analysis, Writing–review and editing. HC: Methodology, Writing–original draft. TW: Conceptualization, Writing–original draft.
Funding
The author(s) declare that financial support was received for the research, authorship, and/or publication of this article. This study was sponsored by the National Natural Science Foundation of China (Grant No. 52308393) and the State Key Laboratory of Precision Blasting and Hubei Key Laboratory of Blasting Engineering, Jianghan University (Grant No. PBSKL2023B2). University Level Undergraduate Education and Teaching Research Project of Fujian University of Technology, (No. 2023JG034); Social Science Project Research Foundation of Fujian University of Technology (GY-S22085); Fuzhou Social Sciences (Key Research Base) Mindu Architectural Heritage Conservation and Design Innovation Research Center Project (2024FZB14); Youth Foundation for Humanities and Social Science Research, Ministry of Education (24YJCZH009).
Conflict of interest
Authors HC and TW were employed by China State Construction Bridge COPR., LTD.
The remaining authors declare that the research was conducted in the absence of any commercial or financial relationships that could be construed as a potential conflict of interest.
Publisher’s note
All claims expressed in this article are solely those of the authors and do not necessarily represent those of their affiliated organizations, or those of the publisher, the editors and the reviewers. Any product that may be evaluated in this article, or claim that may be made by its manufacturer, is not guaranteed or endorsed by the publisher.
References
Azarafza, M., Hajialilue Bonab, M., and Derakhshani, R. (2022). A novel empirical classification method for weak rock slope stability analysis. Sci. Rep. 12, 14744. doi:10.1038/s41598-022-19246-w
Azarafza, M., Haluk, A., Ghazifard, A., Ebrahim, A. K., Jafar, R., and Reza, D. (2021). Discontinuous rock slope stability analysis by limit equilibrium approaches – a review. Int. J. Digital Earth 14 (12), 24. doi:10.1080/17538947.2021.1988163
Baziar, M. H., and Dehghani, R. (2021). Evaluation of seismic mechanical response of tunnel linings using shaking table tests and numerical analyses. Soil Dyn. Earthq. Eng. 147 (3), 106793. doi:10.1016/j.soildyn.2021.106793
Briffa, J., Sinagra, E., and Blundell, R. (2020). Heavy metal pollution in the environment and their toxicological effects on humans. Heliyon 6 (9), e04691. doi:10.1016/j.heliyon.2020.e04691
Chen, Z. Y., and Liu, Z. Q. (2019). Effects of pulse-like earthquake motions on a typical subway station structure obtained in shaking-table tests. Eng. Struct. 198 (Nov.1), 109557. doi:10.1016/j.engstruct.2019.109557
Edinliler, A., and Yildiz, zgür (2023). Correction to: shaking table tests on geotechnical seismic isolation for medium-rise buildings using EPS beads-sand mixtures. Bull. Earthq. Eng. 21 (8), 3879. doi:10.1007/s10518-023-01700-3
Han, Q., Jing, M., and Lu, Y. (2023). Shaking table tests on the seismic response of truss structure with air spring-FPS three-dimensional isolation bearing. Earthq. Eng. and Struct. Dyn. 52 (15), 4964–4986. doi:10.1002/eqe.3992
Huang, Q., Gao, H., Liu, N., and Ma, Y. (2022). Shaking table model test on seismic response of metro tunnel crossing ground fissure site. J. Geomechanics 24 (6), 785–794. doi:10.12090/j.issn.1006-6616.2018.24.06.081
Kaneshiro, Y., Hasegawa, T., and Hiroshima, S. (2020). Shaking table test on seismic response of steel 2-STORY frame structure considering fracture at beam-ends[j]. AIJ J. Technol. Des. 26 (62), 147–152. doi:10.3130/AIJT.26.147
Mao, Y., Li, Y., Teng, F., Yaser, A. N., Azarafza, M., Zhang, M., et al. (2024). Predicting the elasticity modulus of sedimentary rocks using Deep Random Forest Optimization (DRFO) algorithm. Environ. Earth Sci83 487, 487. doi:10.1007/s12665-024-11768-y
Matsumaru, T., Nakashima, T., Hamada, Y., and Atsumi, T. (2022). Shaking table tests of model embankment with seismic reinforcement using soil nails focused on effect of slope protection works. J. Jpn. Soc. Civ. Eng. Ser. A1 Struct. Eng. and Earthq. Eng. SE/EE 78, 592. doi:10.2208/jscejseee.78.4_i_592
Nanehkaran, Y. A., Licai, Z., Chengyong, J., Chen, J., Anwar, S., Azarafza, M., et al. (2023). Comparative analysis for slope stability by using machine learning methods. Appl. Sci. 13, 1555. doi:10.3390/app13031555
Sun, L., Lai, Z., and Bai, Y. (2023). Research on seismic wave delay and amplification methods in the shaking table test of large-span structures in mountain areas. Appl. Sci. 13, 6728. doi:10.3390/app13116728
Wu, H., Lei, H., and Lai, T. (2021). Shaking table tests for seismic response of orthogonal overlapped tunnel under horizontal seismic loading. Adv. Civ. Eng. 2021. doi:10.1155/2021/6633535
Xie, W., Zhang, Q., Gao, B., Ye, G., Zhu, W., and Yang, Y. (2024). Shaking table tests for seismic response of jack-up platform with pile leg-mat foundation on sandy seabed. Ocean. Eng. 309, 118564. doi:10.1016/j.oceaneng.2024.118564
Yue, M., Wu, D., Wen, H., Qu, L., Zhou, S., and Chen, Z. (2024). Dynamic response characteristics of shaking table model tests on the gabion reinforced retaining wall slope under seismic action. Geotext. geomembranes 52 (2), 167–183. doi:10.1016/j.geotexmem.2023.10.001
Zhang, C., Ma, S. J., and Guo, M. Y. B. (2023). Calculation and field measurement of earth pressure in shield tunnels under the action of composite foundation. Geomechanics Eng. 34 (1), 17–27. doi:10.12989/gae.2023.34.1.017
Keywords: slope, earthquake, frequency, dynamic response, seismic wave
Citation: Wei Z, Li X, Cao H and Wu T (2024) Frequency distribution of different joint slopes containing ceramic soil under seismic wave action. Front. Earth Sci. 12:1429551. doi: 10.3389/feart.2024.1429551
Received: 08 May 2024; Accepted: 27 September 2024;
Published: 23 October 2024.
Edited by:
Hans-Balder Havenith, University of Liège, BelgiumReviewed by:
Mohammad Azarafza, University of Tabriz, IranRasmiranjan Samal, Silicon Institute of Technology (SIT), India
Copyright © 2024 Wei, Li, Cao and Wu. This is an open-access article distributed under the terms of the Creative Commons Attribution License (CC BY). The use, distribution or reproduction in other forums is permitted, provided the original author(s) and the copyright owner(s) are credited and that the original publication in this journal is cited, in accordance with accepted academic practice. No use, distribution or reproduction is permitted which does not comply with these terms.
*Correspondence: Xuanzhe Li, bHh6NTkzMTkxMzE5QGdtYWlsLmNvbQ==; Tingyao Wu, d3V0aW5neWFvQGN1Zy5lZHUuY24=
†These authors share first authorship
 Zhengqi Wei1†
 Tingyao Wu

