 Qianqian Qi
 Wansuo Duan
 Xia Liu6
- 1CMA Earth System Modeling and Prediction Center (CEMC), Beijing, China
- 2State Key Laboratory of Severe Weather (LaSW), Beijing, China
- 3Key Laboratory of CMA Earth System Modeling and Prediction, Beijing, China
- 4State Key Laboratory of Numerical Modeling for Atmospheric Sciences and Geophysical Fluid Dynamics (LASG), Institute of Atmospheric Physics, Chinese Academy of Sciences, Beijing, China
- 5University of Chinese Academy of Sciences, Beijing, China
- 6School of Mathematics, Zhengzhou University of Aeronautics, Zhengzhou, China
Based on the initial errors in the whole Pacific that are most likely to affect the predictions of two types of El Niño events, the sensitive area of ocean temperature in the whole Pacific for El Niño prediction starting from January is identified by using the Geophysical Fluid Dynamic Laboratory CM2P1, a fully coupled global climate model. The error growth analysis and the numerical experiments illustrated that, the initial ocean temperature in the Victoria mode (VM) region in the North Pacific will affect the intensity predictions of the CP-El Niño while that in the subsurface layer of the west equatorial Pacific and the surface layer of southeast Pacific will modulate the spatial structure predictions of CP-El Niño. But for EP-El Niño, the former plus the surface layer of the equatorial central eastern pacific will modulate the spatial structure predictions of the event while the latter is shown to be more effective in predictions of the intensity of the event. Furthermore, if targeted observations are conducted in the sensitive area of the whole Pacific, the El Niño prediction skills, including intensity and spatial structure predictions, could be greatly improved for both EP- and CP-El Niño events. Neither the sensitive area of subtropical Pacific nor the tropical Pacific can be precluded as accurate indicators when forecasting particular flavors and the intensity of El Niño events.
1 Introduction
There are two types of interannual sea surface temperature (SST) variabilities in the tropical Pacific: EP-El Niño and CP-El Niño (Larkin and Harrison, 2005a; Ashok et al., 2007; Yu and Kao, 2007; Kao and Yu, 2009; Kug et al., 2010). EP-El Niño events are traditional events with the largest SST anomalies (SSTAs) in the equatorial eastern Pacific, while CP-El Niño events exhibit the largest SSTAs confined within the equatorial central Pacific. Many extreme weather events, such as high temperatures, rainstorms, cold currents and tropical cyclones (Weng et al., 2007; Kim et al., 2009, 2012; Yeh et al., 2009; Chen and Tam, 2010; Marathe et al., 2015), are sensitive to both the type and intensity of El Niño events. Moreover, the pacific sea surface temperature precursors are suggested as robust seasonal predictors of the central China July precipitation (CCJP) and the improvement of ENSO forecasting ability can improve CCJP forecasting skills (Li et al., 2023). Therefore, distinguishing the types of El Niño events and accurately forecasting the intensity of each type of El Niño are important.
Although significant progress related to EP- and CP-El Niño event predictions has been achieved, both intensity and spatial structure forecast uncertainties still remain in classical dynamical models. Due to the spatial differences in the largest SSTAs during peak times between EP- and CP-El Niño events, the types of El Niño events cannot be exactly predicted with most coupled climate numerical models (Jin et al., 2008; Barnston et al., 2012). For example, using the Predictive Ocean Atmosphere Model for Australia (POAMA), Hendon et al. (2009) noted that the model could hardly predict the differences between EP- and CP-El Niño events. Duan et al. (2014) reported that Zebiak–Cane model could not predict CP-El Niño events because of large model errors. Zheng and Yu (2017) revealed that systematic prediction errors mainly originate from the prediction errors of CP-El Niño events, and the IAP ENSO EPS often predicted the CP-El Niño events as EP-El Niño events. Regarding intensity predictions, large prediction errors still exist. For example, many models predicted 2014 years as a moderate El Niño year, while in fact, it was a normal year. Many models predicted strong 2023/24 EL Niño events as weak or at most slightly strong El Niño events (Ren et al., 2016). With BCC-CPS2 model, Cheng et al. (2022) noted that there is an obvious relationship between the predictability of El Niño events and their intensity, and in general, strong El Niño events can be predicted better. Therefore, forecasting the intensities and spatial structures of the two types of El Niño events is still a worldwide difficulty.
Initial errors, model errors and stochastic forcing errors can cause uncertainties in the above two types of El Niño predictions (Chen and Cane, 2008; Lopez and Kirtman, 2014; Larson and Kirtman, 2015). In addition, several studies have highlighted that initial ocean temperature errors with certain spatial structures could cause the highest prediction uncertainties in EP- and CP-El Niño events (Hou et al., 2019; Yang et al., 2020; Qi et al., 2021a). Research has shown that an accurate initial field is crucial for improving ENSO predictions with numerical models (Duan and Hu, 2016; Tao et al., 2017; 2018; Duan et al., 2018). Especially, ENSO predictability is largely limited arising from the growth of initial ocean temperature errors in model simulations rather than the effects of high-frequency atmospheric “noise” (Chen et al., 2004). Thus, to improve the ability to predict El Niño events, one effective way is to filter out initial ocean temperature errors with particular patterns. Therefore, based on the above idea, Mu et al. (2014, 2015) proposed that the ability to generate ENSO predictions could be improved efficiently when using optimal observations in certain key or sensitive regions, while these regions possess particular structures and notably influence El Niño predictions.
To improve the quality of the initial field and ENSO forecasting ability, the target observations is an economic and practical method. The pivotal problem of target observations is to determine the optimal observation locations (or the most sensitive regions). With Zebiak–Cane (ZC) model (Zebiak and Cane, 1987) corrected with the optimal forcing vector approach (Duan et al., 2014), Duan et al. (2018) identified sensitive areas related to two types of El Niño predictions by calculating the optimal growing errors (OGEs), and they indicated that SSTA target observation areas are located in the eastern equatorial Pacific. However, ZC model is a regional ocean–atmosphere coupled model and cannot be used to describe subsurface layers or extratropical Pacific processes. Previous analysis studies have shown that both subsurface ocean processes and extratropical Pacific temperatures can drive the onset of EP- and CP-El Niño events. Therefore, it is necessary to use a more complex Community Earth System Model to identify the sensitive areas for different types of El Niño predictions. In view of the above considerations, Hou et al. (2023) adopted multi-model global outputs from Coupled Model Intercomparison Project Phase 5 (CMIP5) experiments to explore the overall Pacific SST-sensitive areas of EP- and CP-El Niño events. Their results suggested that the optimal SST target observation areas are located not only in the tropical Pacific but also outside the tropics. Hou et al. (2023) adopted the particle filter (PF) assimilation method (Gordon et al., 1993; Van Leeuwen, 2009; Shen et al., 2017) to determine the optimal SSTA observational areas for the whole Pacific. However, the limitation on particle numbers in the PF method may restrict the use of too many observation members, so they only explore SST-sensitive regions but ignore subsurface ocean temperature-sensitive regions. Therefore, the results obtained by the PF method should be verified by another method, such as focusing on error growth and determining initial errors with particular patterns. Then, by conducting target observations in areas with the initial errors identified above, we could verify the prediction capacity for EP- and CP-El Niño events.
Qi et al. (2021a) have explored the most sensitive initial ocean temperature error mode for modulating the intensities of EP- and CP-El Niño events over the whole Pacific. They demonstrated that the ocean temperature in the North Pacific with a VM-like SSTA pattern (CP-Type-A, 20°N −60 °N, 150°E−120°W, 0–85 m; refer to Qi et al. (2021a); Figure 8) is more important than that in other Pacific regions for intensity predictions of CP-El Niño events. Additionally, their results revealed that the subsurface ocean temperatures in the western equatorial Pacific and upper layer of the southeastern Pacific in the meridional mode (EP-Type-B, including 10°S-10°N, 130°E−135°W, 95–165 m and 15°S-30°S, 140°W-85°W, 0–85 m; refer to Qi et al. (2021a); Figure 10) are more important for predicting the intensity of EP-El Niño events. However, the study of Qi et al. (2021a) mainly concerned about the intensity prediction. In fact, there exist not only the intensity prediction uncertainty but also the spatial pattern prediction uncertainty in the practical ENSO forecasting. In particular, many models often predict CP-El Niño events as EP-El Niño events, which may indicate that high prediction uncertainties also exist in the spatial structure related to EP- and CP-El Niño events. Therefore, it is natural to ask, when we conduct ensemble hindcast experiments using initial ocean temperature errors covering the whole Pacific, which types of initial errors induce spatial structure prediction uncertainties? What is the mechanism behind error evolution? When considering both intensity and spatial structure predictions, what is the most sensitive initial ocean temperature error mode in the whole Pacific? Furthermore, how can the targeted observation strategy be applied to the generation of intensity and spatial structure forecasts of EP- and CP-El Niño events? All of these questions are addressed in this paper.
The remainder of this paper is structured as follows: in Section 2, we briefly describe the GFDL CM2P1 model and select the EP- and CP-El Niño events. In Section 3, we mainly introduce the experimental strategy. In Section 4, we investigate another type of initial ocean temperature error that may modulate spatial pattern predictions and explore the physical mechanisms related to error growth. In Section 5, verification experiments are performed to determine the most sensitive initial error mode for modulating spatial structure predictions. In Section 6, we identify the sensitive target observation areas when considering both intensity and spatial structure predictions. The study results are summarized in Section 7.
2 Model and case selection
In this study, we used the Geophysical Fluid Dynamic Laboratory (GFDL) CM2p1 model to study the predictability of EP- and CP-El Niño events. The GFDL CM2p1 model is a fully coupled ocean–atmosphere‒land–ice Earth system model. The standard horizontal resolution of the ocean component is 1°×1°. However, close to the equator, the horizontal resolution is increased to 1/3°. There are 50 vertical layers, and the vertical resolution is 10 m over the upper 225 m. Regarding the atmospheric module, the horizontal resolution is 2.5° (longitude)×2° (latitude), and there are a total of 24 vertical levels. The land component is LM2.1 (Milly and Shmakin, 2002), and the sea ice component is the SIS model (Delworth et al., 2006). All the modules are coupled with each other through the Flexible Modeling System (FMS; http://www.gfdl.noaa.gov/fms), and fluxes are exchanged every 2 hours. In previous studies, the GFDL CM2p1 model was used to explore the predictability of EP- and CP-El Niño events (Yang et al., 2020; Qi et al., 2021a), and it was suggested that the model could capture the characteristics of the subtropical Pacific interannual variability and could reproduce EP- and CP-El Niño events well.
In this study, the GFDL CM2p1 model was integrated for 300 years, and the test run was used as a control run. We only analyzed the results of the last 250 years owning to that the data of the first 50 years are not stable. First, eight EP- and CP-El Niño events were selected from the control run. Figure 1 shows the Niño index series and the characteristics of the mature phases of all eight EP- and CP-El Niño events. All El Niño events occurred in the boreal spring, developed to maturation in winter, and then decayed in spring or summer of the following year. Therefore, all the selected events exhibited obvious phase-locking characteristics. In addition, the eight EP-El Niño events all exhibited large SSTAs in the Niño 3 region, while the CP-El Niño events exhibited large SSTAs in the Niño 4 region during the mature phase season. Therefore, we adopted the Niño 3 and Niño 4 indices to define two types of El Niño events in this study. Figure 1 also shows that the amplitude of EP-El Niño events is significantly larger than that of CP-El Niño events, and the intensity of the former was almost twice that of the latter, which agrees with the observed features.
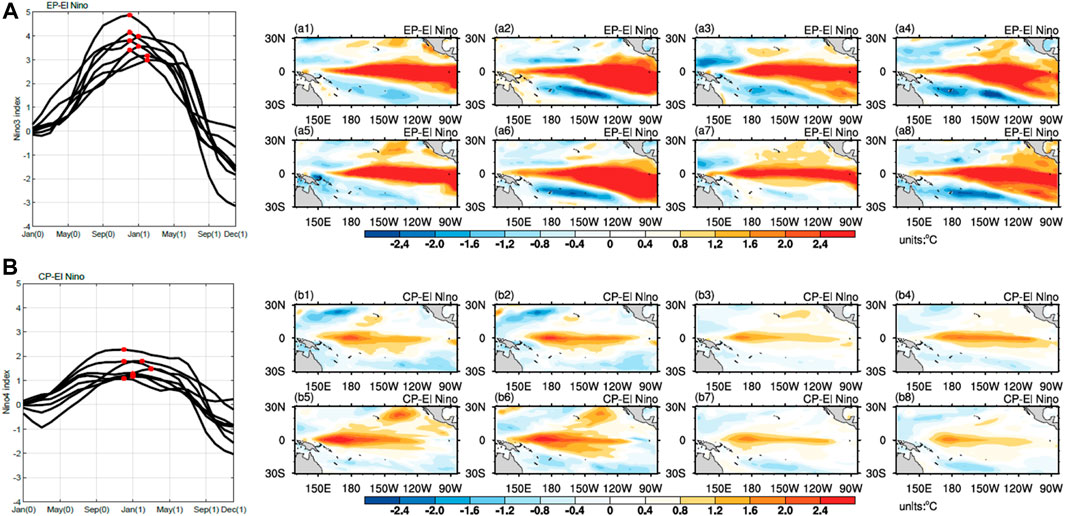
Figure 1. Evolution of the Niño index and the mature phase related to EP-El Niño events and CP-El Niño events derived from the GFDL CM2p1 model. The red stars in (A) and (B) indicate the months of the year when the Niño index reaches its peak. (a1–a8) show the eight selected EP-El Niño events, and (b1–b8) show the eight selected CP-El Niño events.
3 Experimental strategy
In this study, we assumed that the model was perfect and the prediction uncertainties were caused only by the initial errors. Moreover, we mainly investigate the sources of ocean temperature errors in two types of El Niño predictions. Thus, in our experimental strategy, we conducted ensemble prediction experiments by superimposing a group of ocean temperature errors without modulating the atmospheric temperature onto the initial field with the above eight selected EP- and CP-El Niño events. We assumed that the eight selected cases from the model control run are true-state El Niño events. The initial perturbation samples were obtained by determining the differences between the ocean temperature in the starting month of January and that in each month preceding January of the 4-year period (a total of 48 months) over the whole Pacific (66.5°S–66.5°N, 130°E−85°W, 0–165 m) from each true-state El Niño prediction. Therefore, for each El Niño event, there were a total of 49 predictions, including one true-state prediction and 48 perturbation predictions. Since the cycles of ENSO events occur over an approximately 4-year period (48 months in total), the initial perturbation samples constructed with the above method may exhibit considerable ergodic initial errors. In addition, we mainly considered the growth phases of El Niño events, especially concerning predictions across the spring season when El Niño events develop to maturation. Therefore, in our experimental strategy, we obtained the leading 12-month ensemble predictions on the starting month of January for each El Niño event with these initial errors. Obviously, the above leading 12-month ensemble predictions all occurred across the growth phases of the El Niño events. In total, 384 (i.e., 4 (year)*12 (months) *8 (cases)) perturbed predictions were obtained for each El Niño event to explore how the initial ocean temperature errors over the whole Pacific affect the prediction uncertainties of EP- and CP-El Niño events. In order to elaborate the experimental strategy clearly, we make the following schematic diagram (see Figure 2).
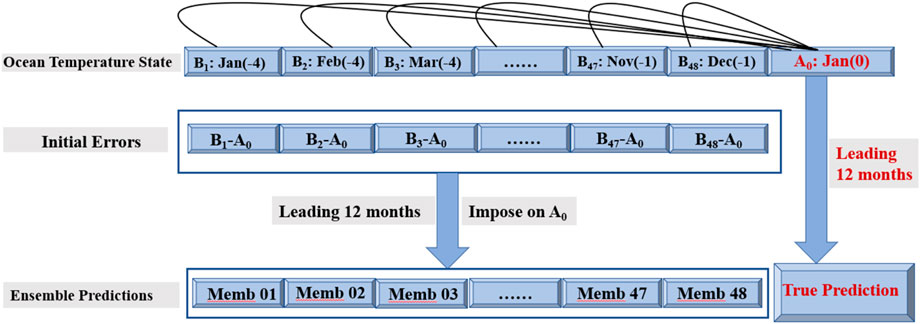
Figure 2. The schematic diagram of ensemble prediction experimental strategy.
For the starting month of January, there were a total of 384 predictions for EP- and CP-El Niño events. As described above, we first attempted to determine the most sensitive initial errors that could induce the largest prediction errors in the tropical Pacific at the final lead time. By examining the SSTA prediction errors in the tropical Pacific with different ensemble members at the end of the 12-month lead time, the results showed that some predictions exhibited large SSTA prediction errors, whereas other predictions exhibited small SSTA prediction errors. Specifically, we selected 128 predictions with corresponding prediction errors in the top one-third of all the predictions owing to that the top 1/3 predictions may represent the large prediction uncertainty category. The selected 128 predictions corresponded to 128 initial ocean temperature errors. Therefore, we considered whether the initial errors corresponding to the above mentioned 128 predictions belong to different categories sorted by the spatial structure.
To answer the above questions, the K-means clustering method was adopted for these initial ocean temperature errors. The K-means clustering approach is a traditional classification method proposed by MacQueen (MacQueen, 1967; Wu et al., 2000) that aims to classify a group of individuals into several categories according to their similarity. The approach has been used to investigate cold-wave weather processes and rainfall and is generally more capable of determining the most appropriate number of clusters and efficiently classifying ensemble samples (Qi et al., 2021b; Zhu et al., 2021).
4 Most sensitive initial error modes and related error growth
With GFDL CM2P1 model, Qi et al. (2021a) have identified the initial error mode affecting the intensity predictions of El Niño events by performing CEOF analysis of the selected initial ocean temperature errors, which cause large prediction errors in the Niño 3 (for EP-El Niño) or Niño 4 (for CP-El Niño) areas. However, not only intensity prediction uncertainties but also spatial structure prediction uncertainties occur. In particular, many models often predict CP-El Niño events as EP-El Niño events. These false forecasts are mainly due to the large spatial structure prediction uncertainties of EP- and CP-El Niño events. In this section, we adopt the K-means clustering approach to determine the category of the initial ocean temperature errors inducing the largest prediction uncertainties of El Niño events and then identify the most sensitive initial errors modulating the intensities and spatial patterns of EP- and CP-El Niño events. Furthermore, we mainly focus on the most sensitive initial error mode for modulating the spatial structure predictions of the two types of El Niño events and attempt to determine how these initial errors evolve and affect the patterns of EP- and CP-El Niño predictions.
4.1 Initial errors modulating the spatial structures of EP-El Niño events and related initial error growth
As mentioned in Section 3, for the starting month of January, there were 384 predictions in total for EP-El Niño events. Specifically, we selected 128 predictions (top third) significantly contributing to the large SSTA prediction errors in the tropical Pacific at a 12-month lead time. For the 128 initial ocean temperature errors corresponding to the above 128 predictions, we first determined the most appropriate cluster number. Then, with the above optimal number of clusters, we could finally determine two stable clustering centers and the initial ocean temperature error samples near the clustering center by using the K-means clustering algorithm. We denoted the two stable cluster centers as EP-Type-I and EP-Type-S, and both cluster centers caused large SSTA prediction errors in the tropical Pacific. The structures of the EP-Type-I initial errors were similar to those of the EP-Type initial errors (i.e., Figure 10 in the study of Qi et al. (2021a)). Their research revealed that EP-Type-I initial errors could induce the largest prediction uncertainties in Niño 3 areas and could modulate the intensities of EP-El Niño events. Therefore, we mainly focused on EP-Type-S initial errors and did not consider the EP-Type-1 initial errors in this study. EP-Type-S initial errors exhibited ocean temperature structures with negative anomalies in the upper layers of the central-eastern equatorial Pacific and a meridional dipolar structure in the upper layers of the subtropical North Pacific (see Figure 3).
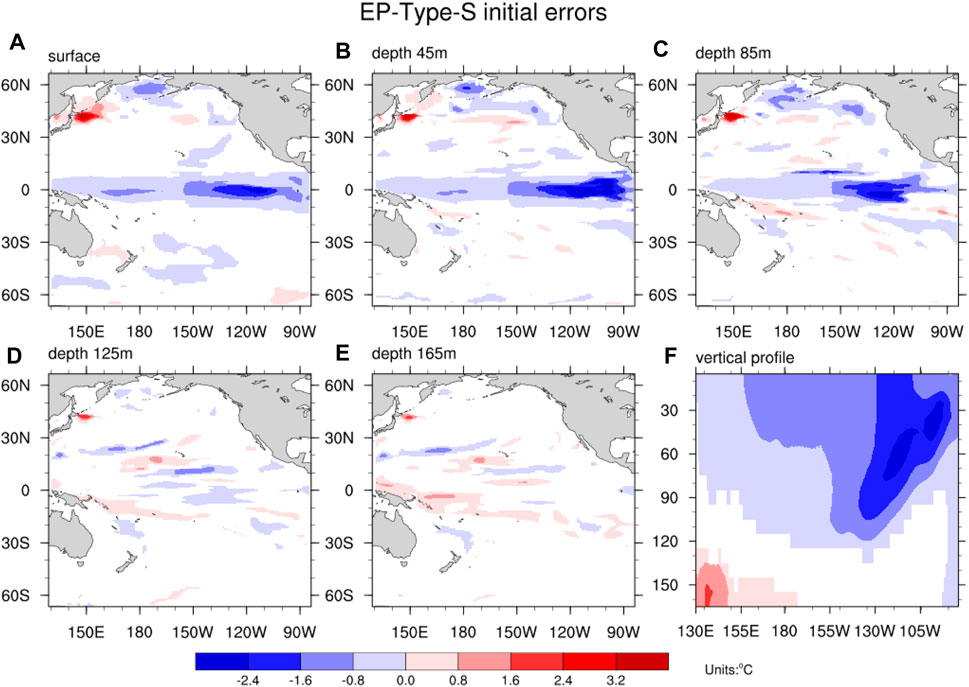
Figure 3. Clustering center (units: °C) of the EP-Type-S initial errors that cause the largest prediction errors in the tropical Pacific. The top 5 images (A–E) correspond to different ocean depths, from the sea surface to 45, 85, 125 and 165 m. The latter (F) shows the meridional mean of the sea temperature anomaly over 5°S-5°N. Composites of the initial errors not exceeding the 95% significance level are masked.
As described above, both EP-Type-I and EP-Type-S initial errors could cause the large prediction uncertainties in the tropical Pacific. In particular, EP-Type-I initial errors could lead to the largest SSTA prediction errors in Niño 3 region and could modulate the intensities of EP-El Niño events. Compared with EP-Type-I initial errors, although EP-Type-S initial could errors induce smaller prediction errors in Niño 3 areas, they actually induced the large prediction errors in the tropical Pacific and the large forecast uncertainties for EP-El Niño events. Thus, we could speculate that EP-Type-S initial ocean temperature errors may cause prediction uncertainty related to spatial structures and modulate the spatial structure predictions of EP-El Niño events. This speculation is further confirmed in Section 5. In this section, we determine how EP-Type-S initial errors evolve and modulate the spatial structures of EP-El Niño events and explain the physical mechanisms related to the growth of these initial errors.
After obtaining EP-Type-S initial ocean temperature errors, which induce the large SSTA prediction errors in the tropical Pacific, we also obtained corresponding initial error samples belonging to the category of the EP-Type-S cluster center. First, we integrated the model for 12 months with the new initial fields constructed by overlaying each initial error sample belonging to the category of cluster center EP-Type-S onto the initial ocean temperature in January of each true-state EP-El Niño event. Then, prediction errors were obtained by subtracting the true-state ocean temperature from the predicted ocean temperature. For each sample, we obtained a group of prediction error evolution. Based on these sample prediction errors, we calculated the ensemble mean and performed a significance test. The evolution of the mean prediction errors is shown in Figure 4, and the evolution mode is similar to the process in which La Nina events begin to develop and finally evolve into the mature phase. Because the prediction errors were caused by EP-Type-S initial errors, we could conclude that EP-type-S initial errors lead to a negative SSTA bias in the central-eastern equatorial Pacific at 12 months. Specifically, from the evolution of the ocean temperature and sea surface wind, we could determine that there exists the obvious Bjerknes positive feedback process between the negative ocean temperature and anomalous easterly winds along the equator. Moreover, Wind–Evaporation–SST (W-E-S) feedback process occurs in the North Pacific. Both contribute to the sustained growth of the prediction errors, and finally, the negative SSTA errors in the central-eastern equatorial Pacific evolved into a La Niña-like mode. Therefore, the negative anomalies in the upper layers of the central-eastern equatorial Pacific and the meridional dipolar structure in the upper layers of the subtropical North Pacific caused the large prediction uncertainties in EP-El Niño events, especially spatial structure prediction uncertainties based on the above hypothesis and mechanism analysis.
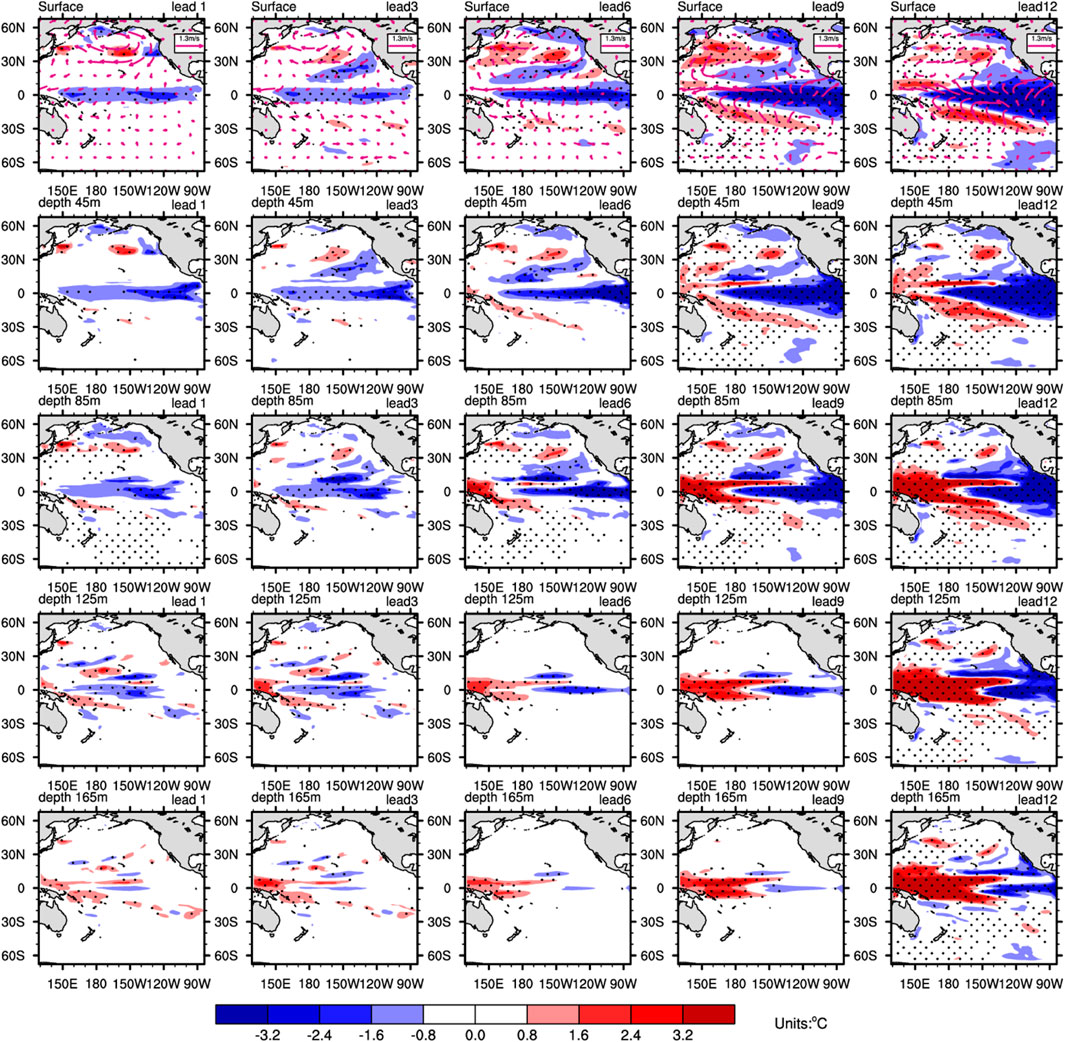
Figure 4. Composite of the evolution patterns of the anomalous sea temperature (units: °C) and horizontal wind (units: m/s) of EP-Type-S initial errors, as shown by the 3-, 6-, 9-, and 12-month predictions. The dotted areas denote those exceeding the 95% significance level. The rows correspond to sea depths from the sea surface to 5 m and then to 45, 85, 125 and 165 m.
4.2 Initial errors modulating the spatial structures of CP-El Niño events and related initial error growth
For CP-El Niño events, there were a total of 384 predictions. Specifically, 128 predictions (top third) with large SSTA prediction errors in the tropical Pacific were selected. For the 128 initial ocean temperature errors corresponding to the above 128 predictions, we adopted the same strategy as that for EP-El Niño events. First, we determined the most appropriate number of clusters and the optimal number of clusters K is 2. Then, two stable clustering centers and initial ocean temperature error samples near the clustering center were obtained by using the K-means clustering algorithm. The two stable cluster centers were denoted as CP-Type-I and CP-Type-S. Owning to that the pattern of the CP-Type-I initial errors were similar to the CP-Type initial errors (i.e., Figure 8 in the study of Qi et al. (2021a)), the figure of CP-Type-I are no longer showed in this paper. Based on their research, CP-Type-I initial errors could induce the largest SSTA prediction errors in Niño 4 areas and modulate the intensities of CP-El Niño events. The structures of the CP-Type-S initial errors were similar to those of the EP-Type-I initial errors (see Figure 5). Because these errors in the model have been described in detail in the previous study of Qi et al. (2021a), in this study, we mainly focused on CP-Type-S initial errors and did not consider CP-Type-1 initial errors.
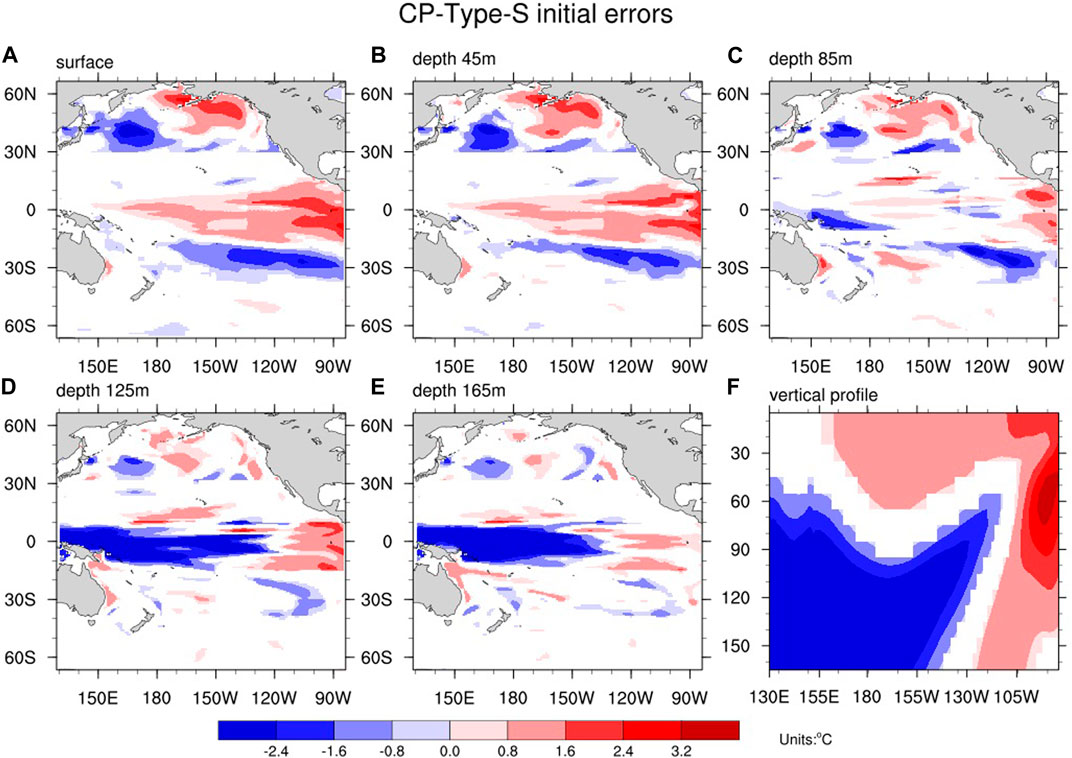
Figure 5. Same as Figure 3 (A–F) but for CP-El Niño events.
The evolution of the mean prediction errors and the corresponding significance test results are shown in Figure 6. The results indicated that the evolution mode of CP-Type-S is similar to the process in which EP-El Niño events begin to decay, then transform into the opposite cold phase, and finally develop into the mature La Niña mode. Because these prediction errors were caused by CP-Type-S initial errors, we considered that CP-Type-S initial errors could lead to a negative SSTA bias in the central-eastern equatorial Pacific. Figure 6 shows that the fluctuation process from the lower layer of the western equatorial Pacific and the W-E-S feedback mechanism from the subtropical southeast Pacific play dominant roles and lead to large negative SSTA prediction errors in the eastern equatorial Pacific.
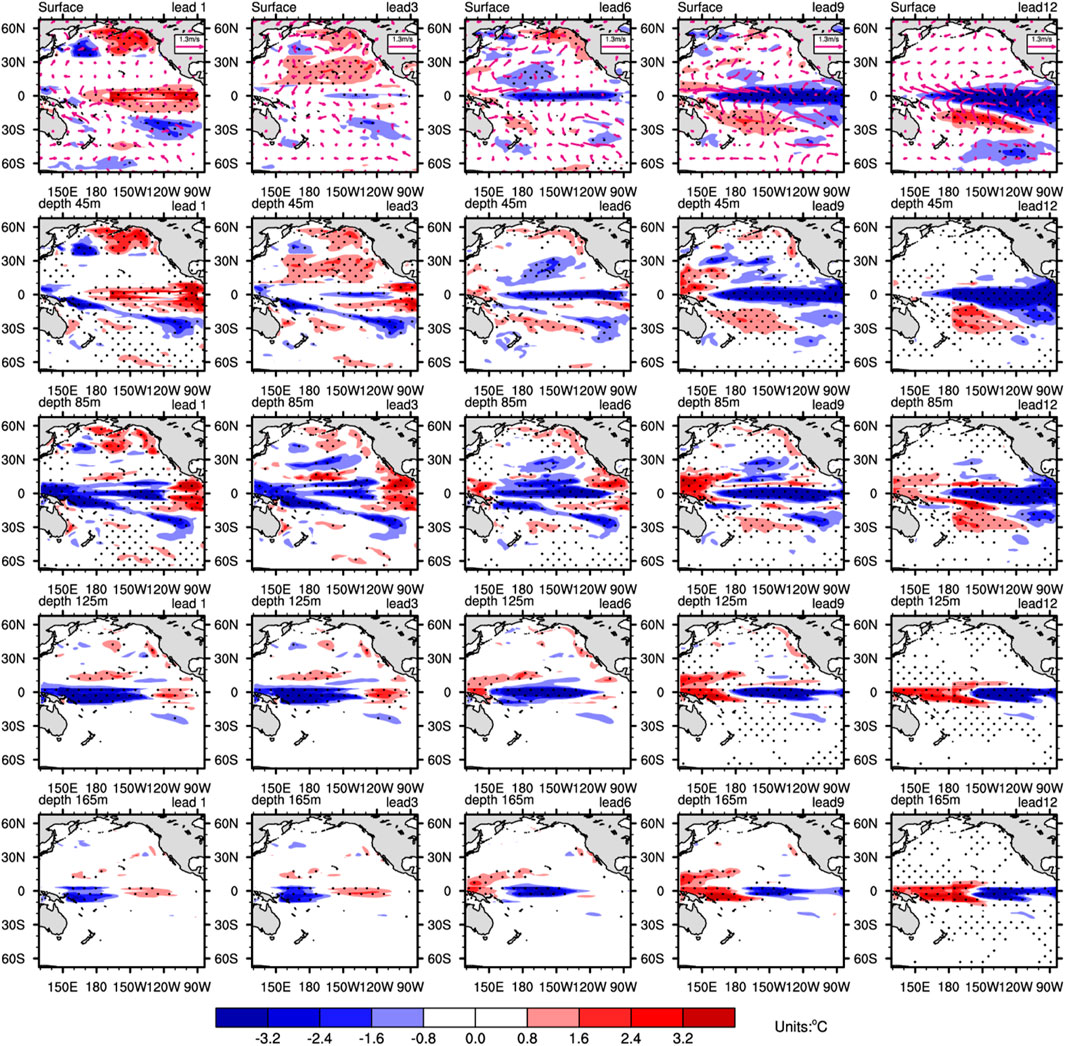
Figure 6. Same as Figure 4 but for CP-El Niño events.
As described above, both CP-Type-I and CP-Type-S initial ocean temperature errors could cause the large SSTA prediction errors in the tropical Pacific; in particular, CP-Type-I initial errors could induce the highest prediction uncertainties in Niño 4 areas and modulate the intensities of CP-El Niño events based on the research of Qi et al. (2021a). CP-Type-S initial errors often lead to predicting CP-El Niño events into traditional La Nina-like mode with a negative SSTA center in the eastern equatorial Pacific, which indicates that CP-Type-S initial errors could affect the patterns of the CP-El Niño-like mode. Therefore, we propose that CP-Type-S initial ocean temperature errors may influence the spatial structure predictions of CP-El Niño events. In addition, according to the evolutionary mechanism analysis, the results showed that the subsurface ocean temperature in the western equatorial Pacific and the top ocean temperature in the subtropical southeast Pacific from CP-Type-S initial errors could induce the large prediction uncertainties.
5 Determination of the most sensitive initial error modes modulating the spatial structures related to EP- and CP-El Niño events
Qi et al. (2021a) have emphasized that EP-Type-I initial errors could modulate the intensity of EP-El Niño events and minimize the prediction errors of EP-El Niño events when additional observations in key areas (10°S-10°N, 130°E−135°W, 95–165 m and 15°S-30°S, 140°W-85°W, 0–85 m) are implemented. CP-Type-I initial errors could modulate the intensity of CP-El Niño events and minimize the prediction errors of CP-El Niño events when target observations in sensitive areas (20°N-60°N, 150°E−120°W, 0–85 m) are acquired. In addition, in Section 4.1 and Section 4.2, we obtained other types of initial error patterns, namely, EP-Type-S and CP-Type-S, respectively, via the K-means clustering method. For EP-El Niño events, large EP-Type-S initial ocean temperature errors are mainly concentrated in the upper layers of the North Pacific with a triple-like SSTA pattern and in the upper layer of the equatorial eastern Pacific (we denote the regions as EP-Type-S-A, which include the regions 40°N-60°N, 150°E−120°W, 0–85 m and 15°S-15°N, 135°W-85°W, 0–85 m). The above key EP-Type-S-A areas may affect the spatial structures of EP-El Niño events and lead to the large prediction uncertainties. Regarding CP-El Niño events, large CP-Type-S initial ocean temperature errors are primarily located in the upper layer of the central-eastern equatorial Pacific and the subsurface of the western equatorial Pacific, as well as in the upper layers of the subtropical North Pacific and the subtropical Southeast Pacific. Furthermore, based on the physical mechanism analysis related to CP-Type-S initial error evolution, only the subsurface of the western equatorial Pacific and the upper layers of the southeastern Pacific (the regions denoted as CP-Type-S-B, including both 10°S-10°N, 130°E−135°W, 85–165 m and 15°S-30°S, 170°W-85°W, 0–85 m) facilitate the prediction of the CP-El Niño mode as a La Nina-like mode and lead to large SSTA errors in the tropical Pacific. The initial errors in the above key areas may affect the spatial patterns of CP-El Niño events by destroying the anomaly center in the equatorial central Pacific.
On the basis of the above analysis, in this section, we explore spatial structure predictions of El Niño events and confirm the sensitive areas that could modulate these spatial pattern predictions via numerical experiments. Specifically, we first overlay the EP-Type-S (or CP-Type-S) initial ocean temperature errors onto the initial ocean temperature in January of each true-state EP-El Niño (or CP-El Niño) event and integrate the model for 12 months to determine whether EP-Type-S (or CP-Type-S) initial errors may cause the large prediction uncertainties. Then, we implement additional observations in the above identified sensitive areas and determine whether the spatial structure prediction skills of EP- and CP-El Niño events can be greatly improved.
To illustrate the ability of the sensitive EP-Type-S-A and CP-Type-S-B areas to improve the prediction skills related to the spatial structure predictions of EP- and CP-El Niño events, respectively, we designed three groups of numerical tests in total with EP-Type-S and CP-Type-S initial errors, respectively. First, eight true-state EP-El Niño events and eight true-state CP-El Niño events were selected, and these events were predicted with a 12-month lead from the starting month of January, as described in Section 2. We then generated three groups of leading 12-month predictions with different new initial states by adding different initial perturbations. Concretely, the numerical experiments were designed as follows: firstly, the initial ocean temperature was set up by overlaying the EP-Type-S (or CP-Type-S) initial errors onto the original initial states of January (0) of each true-state EP-El Niño (or CP-El Niño) event, after which 12-month leading predictions were generated. A total of 8 predictions were obtained for each type of El Niño event, and the tests were denoted as Ctl tests. In the Ctl tests, there was no targeted observation strategy. Secondly, only EP-Type-S-A (CP-Type-S-B) and EP-Type-S (CP-Type-S) initial ocean temperature errors were superposed onto the original initial states of each true-state EP-El Niño (CP-El Niño) event, and we generated 12-month predictions with the new initial field. The experiments were marked as Sen-I tests. In the Sen-I tests, we implemented the targeted observation strategy outside the sensitive regions. Thirdly, the initial errors in the sensitive areas were set to zero, and new initial errors were set up by eliminating EP-Type-S-A (CP-Type-S-B) initial errors from EP-Type-S (CP-Type-S) initial errors. Similarly, with the new initial field by adding the above constructed initial ocean temperature errors to the original initial states of each true-state El Niño event, leading 12-month predictions were generated. The experiments were referred to as Sen-II tests. In the Sen-II tests, we implemented the targeted observation strategy in the sensitive areas.
The similarity efficiency was used to measure the similarities between the prediction results of each group of tests and the true-state SSTAs of El Niño events, and the similarity coefficient can be calculated as follows (Buizza, 1994; Kim et al., 2004):
where
To characterize the role of the sensitive areas in improving the prediction skills related to the spatial structure predictions, We presented the tropical Pacific SSTAs of the predicted results with a 12-month lead time for the start month of January for the true-state El Niño, Ctl test, Sen-I test and Sen-II test. For EP-El Niño events, all the predicted SSTAs of the Ctl test (b1-b8, as shown in Figure 7) exhibited spatial patterns similar to those of a strong La Nina mode, which suggests that EP-Type-S initial ocean temperature errors could cause the largest SSTA negative bias for EP-El Niño predictions and therefore induce the largest prediction errors in the tropical Pacific. The results of the Sen I test (c1-c8, as shown in Figure 7) exhibited a weaker cold mode similar to that of weaker La Nina events or simply a neutral year, which indicates that the prediction errors could also be reduced when implementing target observations in the non-sensitive areas relative to Ctl test. The predicted SSTAs of the Sen-II test (d1-d8, as shown in Figure 7) exhibited spatial structures similar to those of a strong EP-El Niño mode, which shows that when implementing target observations in the EP-Type-S-A area, the predicted SSTAs demonstrated strong warming signals in the central-eastern equatorial Pacific, and almost all spatial structure predictions were valid for EP-El Niño events. For CP-El Niño events, the prediction results of the three groups of tests were similar to those of EP-El Niño events, but the spatial patterns resembled those of the CP-El Niño mode for the Sen-II test (Figure 8).
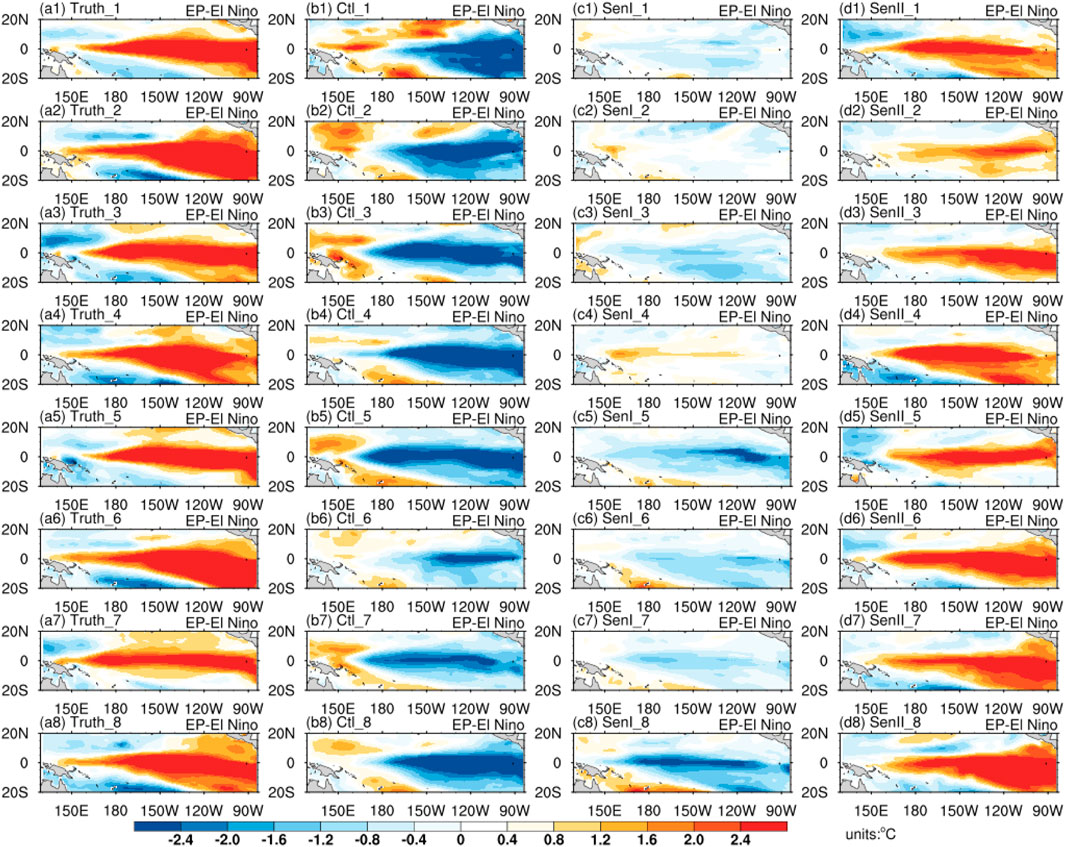
Figure 7. Tropical Pacific SSTAs of the prediction results at the end of the 12-month lead time, the starting month of which is January, for the eight EP-El Niño events. The prediction results are obtained by (a1–a8) the true-state SSTAs of El Niño events; (b1–b8) the Ctl test; (c1–c8) the Sen-I test; and (d1–d8) the Sen-II test.
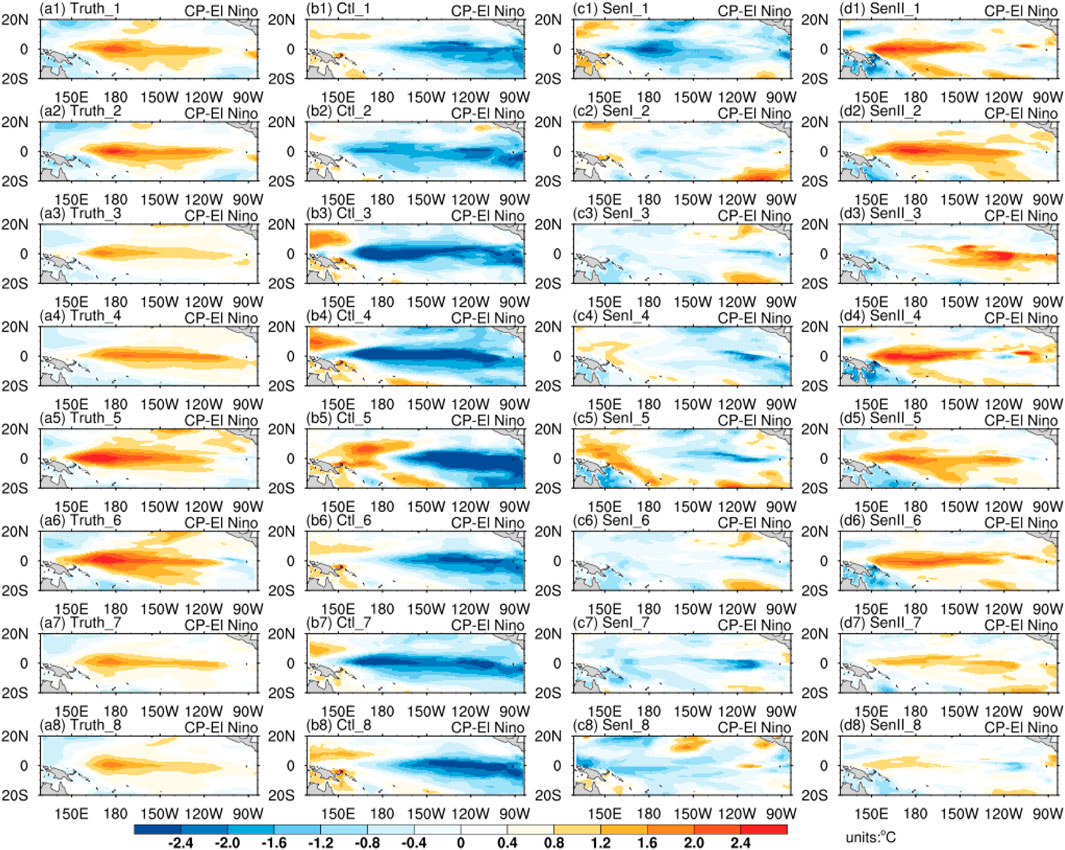
Figure 8. Same as Figure 7 (a1–a8) (b1–b8) (c1–c8) (d1–d8) but for CP-El Niño events.
Furthermore, we calculated the similarity coefficients between the prediction results of the three groups of tests and the true-state SSTAs of El Niño events with Eq. 1 (Figure 9). The scatter diagram reveals that, when implementing target observations in the sensitive EP-Type-S-A (or CP-Type-S-B) areas, the prediction results were highly similar to the true state of EP-El Niño (or CP-El Niño) events. In other words, EP-type S-A initial ocean temperature errors could modulate the spatial structure predictions of EP-El Niño events, while CP-type S-B initial ocean temperature errors could modulate the spatial structure predictions of CP-El Niño events. Therefore, the ocean temperature accuracy in the sensitive EP-Type-S-A and CP-Type-S-B regions should be monitored to improve the spatial structure prediction ability of EP- and CP-El Niño events.
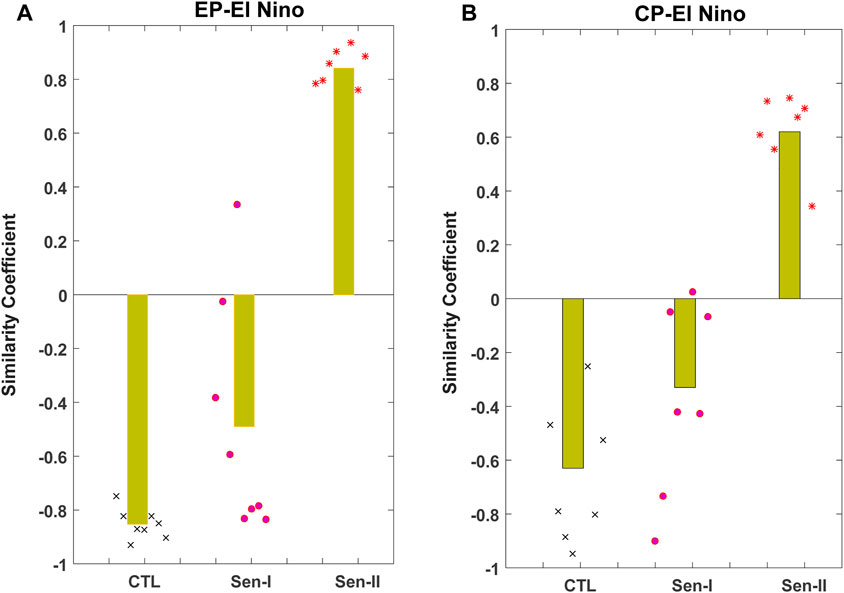
Figure 9. Scatter diagram superimposed onto a bar plot related to the similarity coefficient between the predicted SSTAs of the three groups of tests and the true-state SSTAs of El Niño events for (A) EP-El Niño events and (B) CP-El Niño events.
6 Implications for targeted observations of the two types of El Niño events
In Section 5, we revealed the most sensitive initial ocean temperature errors modulating the spatial structures of EP- and CP-El Niño events and indicated that the spatial structure prediction skills related to EP- and CP-El Niño events could be greatly improved when assimilation experiments were performed in the identified EP-Type-S-A and CP-Type-S-B sensitive areas, respectively. In addition, in the study of Qi et al. (2021a), we identified the most sensitive initial ocean temperature errors modulating the intensity of the two types of El Niño events. From the above results, we can see that the initial sea temperature accuracy in the Victoria Mode (VM) region in the North Pacific is more important for better predictions of the intensity of the CP-El Niño while that in the subsurface layer of the west equatorial Pacific and the surface layer of southeast Pacific is of more concerned for better predictions of the structure of CP-El Niño. But for EP-El Niño, the former is indicated to modulate the structure of the event while the latter is shown to be more effective in predictions of the intensity of the event. However, for practical ENSO predictions, any type of El Niño event may occur and we cannot determine it in advance. Therefore, the identified sensitive areas should cover the regions that could affect the predictions, including both intensity and spatial structure predictions. In this section, we comprehensively consider both intensity and spatial structure predictions and obtain the sensitive target observation regions for the two types of El Niño events. Furthermore, we design a group of verification tests to determine whether the identified optimal targeted observations could effectively improve ENSO prediction abilities.
Based on the previous analysis in Section 5, we determined the optimal target observation areas. The sensitive areas include region A (20°N-60°N, 150°E−120°W, 0–85 m), region B1 (15°S-15°N, 135°W-85°W, 0–85 m), region B2 (10°S-10°N, 130°E−135°W, 85–165 m) and region C (15°S-30°S, 130°W-85°W, 0–85 m). Regions A, B1, B2, and C covered all the identified sensitive areas, which could affect the intensity and spatial structure predictions of the two types of El Niño events. The total identified areas accounted for approximately 10% of the total volume of the Pacific. Particularly, we make a sketch to summarize the sensitivity areas for El Niño prediction in the Pacific as shown in Figure 10.
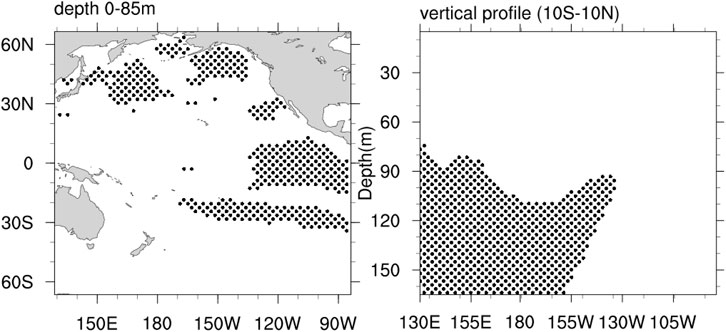
Figure 10. The sensitive areas of target observations for two types of El Niño predictions.
Next, we performed a group of ensemble prediction experiments to illustrate the validity of acquiring target observations in the above sensitive areas for improving ENSO prediction skills. The experimental strategy was designed as follows: firstly, as described in Section 3, there were 48 initial ocean temperature errors in total for each event. Then, leading 12-month predictions were generated with the starting month of January, where the 48 initial ocean temperature errors were superposed onto the initial fields of the true-state El Niño events. Therefore, we obtained 384 predictions in total for each type of El Niño event. The above tests were denoted as NO tests. Secondly, the initial ocean temperature errors in regions A, B1, B2 and C were removed, while the initial states in the other regions were retained. New initial ocean temperatures were obtained with these updated initial ocean temperature errors overlaid onto the initial fields of the true-state El Niño events. Leading 12-month predictions were generated with the new initial states, and we denoted this test as the SA test. Thirdly, to ensure consistency, we randomly selected areas also accounting for approximately 10% of the total volume of the Pacific, which indicates that the total area of the above random assimilated observations was the same as that in the SA test. Furthermore, to ensure more reasonable experimental results, random regions were generated 384 times, and we obtained a total of 384 random regions for each type of El Niño event. Similarly, we performed data assimilation in the above generated random regions and conducted ensemble predictions. This test was denoted as the RA test.
For the prediction results, we adopted the root mean square error (RMSE) of the predicted SSTAs in Niño 3 (or Nino 4) areas to measure the intensity prediction uncertainties of EP-El Niño (or CP-El Niño) events. Specifically, the prediction error can be calculated as follows:
where
The RMSE values and similarity coefficients related to EP- and CP-El Niño events are shown in Figure 11. The results showed that the predictions obtained by performing assimilation tests in the sensitive areas exhibited the smallest SSTA prediction errors in Niño 3 areas for EP-El Niño events and in Niño 4 areas for CP-El Niño events, which suggests that the intensity prediction ability could be greatly improved when assimilation is performed in the sensitive areas. Additionally, the similarity coefficient was the highest for the forecast results of the SA test, which indicates that the spatial mode predictions of EP- and CP-El Niño events are more accurate. In addition, Figure 11 shows that the dispersion degree related to both the RMSE and similarity coefficient of the different prediction samples in the SA test were the smallest among the three groups of tests. These results suggest that when we performed assimilation in the sensitive regions, the improvement of prediction skills was more robust. On the other hand, analyzed from the perspective of the “spring predictability barrier” (SPB), due to that RA test could reduce the prediction errors and improve the ENSO prediction skills, therefore, we infer that the SPB phenomenon of ENSO prediction could be weakened by assimilating target observation data in sensitive areas of the whole Pacific. Overall, the ENSO prediction skills, including intensity and spatial structure predictions, could be greatly improved by assimilating target observation data in sensitive areas of the whole Pacific for both EP- and CP-El Niño events.
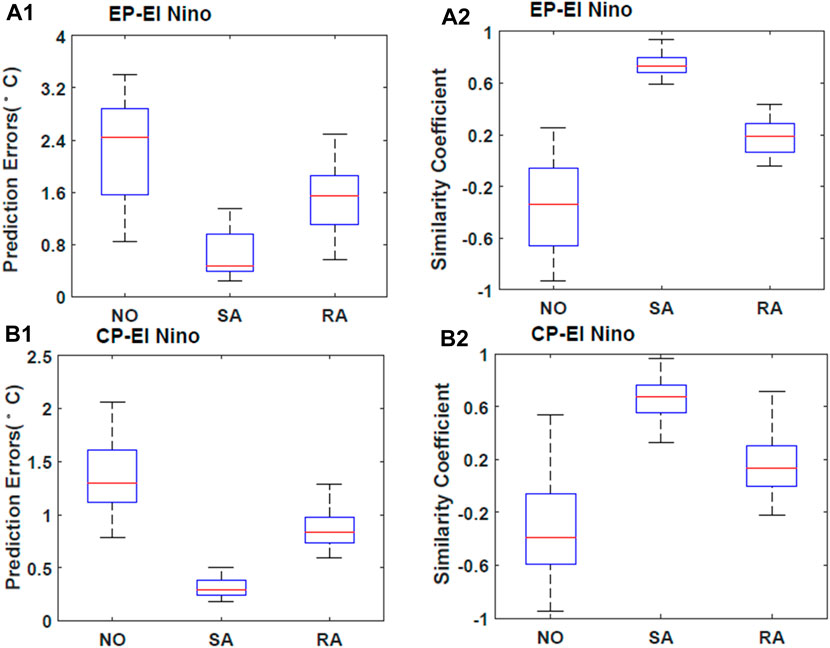
Figure 11. Box–whisker plot of the skills of the updated forecasts with the NO test, SA test and RA test for EP- and CP-El Niño events. (A1) Average prediction errors of Niño 3 SSTAs in December (units: °C) for EP-El Niño events; (A2) similarity coefficients for EP-El Niño events; (B1) average prediction errors of Niño 4 SSTAs in December (units: °C) for CP-El Niño events; (B2) similarity coefficients for CP-El Niño events. The red lines denote the medians of the prediction errors or the similarities for EP- and CP-El Niño events.
In addition, the present results have also important implications for the development mechanisms of two types of El Niño. Using the conclusion of targeted observations, we also find that, in the ocean region B1, there exists the strong Bjerknes positive feedback process between ocean temperature and anomalous easterly winds along the equator. Moreover, In the ocean region A, VM-like ocean temperature patterns in the subtropical North Pacific could induce the ocean temperature errors toward the central equatorial Pacific through the Seasonal Foot-printing Mechanism (SFM) process. Both contribute to the sustained growth of the prediction errors, and then caused the largest spatial structure prediction uncertainties for EP-El Nino events and induced the significant SPB especially the largest prediction errors in Niño 4 areas. In the ocean region B2, there is a subsurface temperature wave process in which the subsurface ocean temperature errors in the central-eastern equatorial Pacific migrate to the east by driving up the thermocline and generating upwelling Kelvin waves. In the region C, the ocean temperature errors in the subtropical southeast Pacific could trigger ocean temperature errors toward the surface of the central-eastern equatorial Pacific via a W-E-S feedback process. Both the physical process caused the largest spatial structure prediction uncertainties for CP-El Nino events and induced the significant SPB especially the largest prediction errors in Niño 3 areas.
7 Conclusions and discussion
In this study, we explored the predictability of two types of El Niño events with the GFDL CM2p1 model. By focusing on error growth, we first identified two types of sensitive initial ocean temperature errors associated with EP- and CP-El Niño events by adopting the K-means clustering method. For EP-El Niño events, we finally determined two stable clustering centers. The two cluster centers were EP-Type-I and EP-Type-S, and both types of initial ocean temperature errors could cause the large prediction uncertainties in the tropical Pacific. In particular, EP-Type-I initial ocean temperature errors could cause the largest SSTA prediction errors in Niño 3 areas and modulate the intensities of EP-El Niño events, as reported in the study of Qi et al. (2021a). EP-Type-S initial ocean temperature errors, which exhibit structures with negative anomalies in the upper layers of the central-eastern equatorial Pacific and a meridional dipolar structure in the upper layers of the subtropical North Pacific, could cause negative SSTA errors in the eastern equatorial Pacific and ultimately evolve into a La Nina-like mode. By comparing the EP-Type-S and EP-Type-I initial ocean temperature errors, we proposed that the EP-Type-S initial ocean temperature errors could modulate the spatial structure of EP-El Niño events. For CP-El Niño events, two stable initial ocean temperature error clustering centers were also obtained by using the K-means clustering algorithm. The two cluster centers were denoted as CP-Type-I and CP-Type-S, and both types of initial ocean temperature errors could cause the largest prediction uncertainties in the tropical Pacific. In particular, CP-Type-I initial errors could cause the largest SSTA prediction errors in Niño 4 areas and modulate the intensities of CP-El Niño events, as noted in the study of Qi et al. (2021a). CP-Type-S initial ocean temperature errors resulted in predicting CP-El Niño events as a traditional La Nina-like mode with a negative center in the eastern equatorial Pacific, which may affect the spatial pattern predictions of CP-El Niño events by destroying the anomaly center in the equatorial central Pacific. Therefore, we proposed that CP-Type-S initial errors could cause the large prediction uncertainties in CP-El Niño events, especially spatial structure prediction uncertainties, and they could modulate the spatial structure of CP-El Niño events.
Then, we validated the effectiveness of EP-Type-S-A and CP-Type-S-B sensitive areas in improving the prediction skills related to spatial structure predictions of EP- and CP-El Niño events, respectively, by performing a series of numerical experiments. The results indicated that the predicted SSTAs exhibited strong warming signals in the central-eastern equatorial Pacific (or the central equatorial Pacific) when we implemented target observations in the EP-Type-S-A (or CP-Type-S-B) sensitive areas, and all the predictions related to the spatial structures were valid for EP-El Niño events (or CP-El Niño events). Therefore, EP-Type-S-A initial ocean temperature errors could modulate the spatial structure predictions of EP-El Niño events, while CP-Type-S-B initial ocean temperature errors could modulate the spatial structure predictions of CP-El Niño events.
Furthermore, the sensitive target observation areas were obtained by comprehensively considering both intensity and spatial structure predictions. The sensitive areas in the whole Pacific are region A (20°N-60°N, 150°E−120°W, 0–85 m), region B1 (15°S-15°N, 135°W-85°W, 0–85 m), region B2 (10°S-10°N, 130°E−135°W, 85–165 m) and region C (15°S-30°S, 130°W-85°W, 0–85 m). By performing a group of ensemble prediction experiments, we illustrated that the ENSO prediction skills, including intensity and spatial structure predictions, could be greatly improved by assimilating target observation data in the above sensitive areas for both EP-El Niño and CP-El Niño events. Moreover, the experimental results indicated that the optimal observations in the above sensitive areas are effective and the ocean temperature in both the tropical Pacific and subtropical Pacific plays an important role in predicting the two types of El Niño events.
In this study, we determined the sensitive areas that could modulate the intensity and spatial structure of EP- and CP-El Niño events, and the prediction skills could be greatly improved by assimilating target observation data in the sensitive areas. However, the identified sensitive areas jointly account for approximately 10% of the total volume of the Pacific, which still are large areas for constructing real observational arrays when considering the economic efficiency. Therefore, in future studies, we should explore the relative importance of the identified sensitive areas A, B1, B2 and C and determine the optimal practical observation array to achieve economic efficiency. In our research, we only use GFDL CM2P1 model to study the problem. If we use an operational global forecast model, which also shows good performance for ENSO prediction, what is the targeted observation strategy for obtaining exact forecasts of the two types of El Niño events by focusing on error growth? Will the sensitive areas change when using the operational global forecast model? These issues should be considered and studied in the future.
In addition, the atmospheric disturbance will also cause the ocean temperature change through the air-sea interaction. For example, based on Lian et al. (2014), westerly wind bursts could be responsible for the existence of El Niño types and for the extremes of the cold tongue El Niño. That’s, although the atmospheric perturbations are not the main triggers, the atmospheric perturbations do also modulate the types and the strength of El Niño events. Therefore, in the future study, we will also try to explore the respective role of ocean and atmospheric perturbations related to the El Niño predictions. Moreover, we only focused on the Pacific Ocean to obtained the targeted observation sensitive area in this study. However, in addition to the Pacific Ocean, the interannual-scale variability of other oceans has a significant impact on the two types of El Niño events (Zhang et al., 2023; Zhou et al., 2020). If we can comprehensively consider the interaction between other oceans and the Pacific Ocean, and identify the sensitive areas of the global sea areas, the forecasting skills of the two types of El Niño may be further improved.
Data availability statement
GFDL CM2p1 model code is available at https://www.gfdl.noaa.gov. All input data set and configuration of GFDL CM2p1 simulations can be found in section 2 and in the references of Delworth et al. (2006), Wittenberg et al. (2006), Stouffer et al. (2006) and Gnanadesikan et al. (2006). The GFDL CM2P1 model is running through the HPC resources of national supercomputer center in Tianjin, China. In addition, the analysis and the calculation with the model data in this paper was performed on Shuguang high-performance computer in China Meteorological Administration (CMA). Further inquiries can be directed to the corresponding author.
Author contributions
QQ: Formal Analysis, Funding acquisition, Resources, Software, Supervision, Writing–original draft, Writing–review and editing. WD: Conceptualization, Methodology, Resources, Supervision, Writing–review and editing. XL: Software, Writing–review and editing. HX: Formal Analysis, Methodology, Writing–review and editing.
Funding
The author(s) declare that financial support was received for the research, authorship, and/or publication of this article. This work was jointly sponsored by the National Natural Science Foundation of China (Grant Nos. 42375152, 41906022, 42176031, 42105057, 42205068), the Key Scientific Research Projects Plan in Henan Higher Education Institutions (24A170031), Henan Province General Project (242300421373).
Conflict of interest
The authors declare that the research was conducted in the absence of any commercial or financial relationships that could be construed as a potential conflict of interest.
Publisher’s note
All claims expressed in this article are solely those of the authors and do not necessarily represent those of their affiliated organizations, or those of the publisher, the editors and the reviewers. Any product that may be evaluated in this article, or claim that may be made by its manufacturer, is not guaranteed or endorsed by the publisher.
References
Ashok, K., Behera, S. K., Rao, S. A., Weng, H., and Yamagata, T. (2007). El Niño modoki and its possible teleconnection. J. Geophys. Res. 112, C11007. doi:10.1029/2006jc003798
Barnston, A. G., Tippett, M. K., L’Heureux, M. L., Li, S., and DeWitt, D. G. (2012). Skill of real-time seasonal ENSO model predictions during 2002-11: is our capability increasing? Bull. Am. Meteorol. Soc. 93, ES48–ES50. doi:10.1175/bams-d-11-00111.2
Buizza, R. (1994). Sensitivity of optimal unstable structures. Q. J. R. Meteorol. Soc. 120, 429–451. doi:10.1002/qj.49712051609
Chen, D. K., and Cane, M. A. (2008). El Niño prediction and predictability. J. Comput. Phys. 227, 3625–3640. doi:10.1016/j.jcp.2007.05.014
Chen, D. K., Cane, M. A., Kaplan, A., Zebiak, S. E., and Huang, D. (2004). Predictability of El Niño over the past 148 years. Nature 428, 733–736. doi:10.1038/nature02439
Chen, G., and Tam, C. Y. (2010). Different impacts of two kinds of Pacific Ocean warming on tropical cyclone frequency over the western North Pacific. Geophys. Res. Lett. 37, L01803. doi:10.1029/2009gl041708
Cheng, Y. J., Tang, Y. M., Wu, T. W., Xin, X., Liu, X., Li, J., et al. (2022). Investigating the ENSO prediction skills of the Beijing Climate Center climate prediction system version 2. Acta. Oceanol. Sin. 41, 99–109. doi:10.1007/s13131-021-1951-7
Delworth, T. L., Broccoli, A. J., Rosati, A., Stouffer, R. J., Balaji, V., Beesley, J. A., et al. (2006). GFDL's CM2 global coupled climate models. Part I: formulation and simulation characteristics. J. Clim. 19, 643–674. doi:10.1175/jcli3629.1
Duan, W. S., and Hu, J. Y. (2016). The initial errors that induce a significant “spring predictability barrier” for El Niño events and their implications for target observation: results from an earth system model. Clim. Dyn. 46, 3599–3615. doi:10.1007/s00382-015-2789-5
Duan, W. S., Li, X. Q., and Tian, B. (2018). Towards optimal observational array for dealing with challenges of El Niño-Southern Oscillation predictions due to diversities of El Niño. Clim. Dyn. 51, 3351–3368. doi:10.1007/s00382-018-4082-x
Duan, W. S., Tian, B., and Xu, H. (2014). Simulations of two types of El Niño events by an optimal forcing vector approach. Clim. Dyn. 43, 1677–1692. doi:10.1007/s00382-013-1993-4
Gnanadesikan, A., Dixon, K. W., Griffies, S. M., Balaji, V., Barreiro, M., and Beesley, J. A. (2006). GFDL’s CM2 global coupled climate models. Part II: The Baseline Ocean Simulation. J. Clim. 19 (5), 675–697. doi:10.1175/JCLI3630.1
Gordon, N. J., Salmond, D. J., and Smith, A. F. M. (1993). Novel Approach to nonlinear/non-Gaussian Bayesian state estimation. IEE. Proc. F. Radar. Signal. Process 140, 107–113. doi:10.1049/ip-f-2.1993.0015
Hendon, H. H., Lim, E., Wang, G. M., Alves, O., and Hudson, D. (2009). Prospects for predicting two flavors of El Niño. Geophys. Res. Lett. 36. doi:10.1029/2009GL040100
Hou, M. Y., Duan, W. S., and Zhi, X. F. (2019). Season-dependent predictability barrier for two types of El Niño revealed by an approach to data analysis for predictability. Clim. Dyn. 53, 5561–5581. doi:10.1007/s00382-019-04888-w
Hou, M. Y., Tang, Y. M., Duan, W. S., and Shen, Z. (2023). Toward an optimal observational array for improving two flavors of El Niño predictions in the whole Pacific. Clim. Dyn. 60, 831–850. doi:10.1007/s00382-022-06342-w
Jin, E. K., Kinter, J. L., Wang, B., Park, C. K., Kang, I. S., Kirtman, B. P., et al. (2008). Current status of ENSO prediction skill in coupled ocean-atmosphere models. Clim. Dyn. 31, 647–664. doi:10.1007/s00382-008-0397-3
Kao, H. Y., and Yu, J. Y. (2009). Contrasting eastern-Pacific and central-Pacific types of ENSO. J. Clim. 22, 615–632. doi:10.1175/2008jcli2309.1
Kim, H. M., Morgan, M. C., and Morss, R. E. (2004). Evolution of analysis error and adjoint-based sensitivities: implications for adaptive observations. J. Atmos. Sci. 61, 795–812. doi:10.1175/1520-0469(2004)061<0795:eoaeaa>2.0.co;2
Kim, H. M., Webster, P. J., and Curry, J. A. (2009). Impact of shifting patterns of Pacific Ocean warming on north Atlantic tropical cyclones. Science 325, 77–80. doi:10.1126/science.1174062
Kim, S. T., Yu, J. Y., Kumar, A., and Wang, H. (2012). Examination of the two types of ENSO in the NCEP CFS model and its extratropical associations. Mon. Wea. Rev. 140, 1908–1923. doi:10.1175/mwr-d-11-00300.1
Kug, J. S., Choi, J., An, S. I., and Jin, F. F. (2010). Warm pool and cold tongue El Niño events as simulated by the GFDL 2.1 coupled GCM. J. Clim. 23, 1226–1239. doi:10.1175/2009jcli3293.1
Larkin, N. K., and Harrison, D. E. (2005a). On the definition of El Niño and associated seasonal average U. S. weather anomalies. Geophys. Res. Let. 32. doi:10.1029/2005GL022738
Larson, S. M., and Kirtman, B. P. (2015). Revisiting ENSO coupled instability theory and SST error growth in a fully coupled model. J. Clim. 28, 4724–4742. doi:10.1175/jcli-d-14-00731.1
Li, G., Chen, L., and Lu, B. (2023). A physics-based empirical model for the seasonal prediction of the central China July precipitation. Geophys. Res. Lett. 50, e2022GL101463. doi:10.1029/2022GL101463
Lian, T., Chen, D., Tang, Y., and Wu, Q. (2014). Effects of westerly wind bursts on El Niño: a new perspective. Geophys. Res. Lett. 41, 3522–3527. doi:10.1002/2014GL059989
Lopez, H., and Kirtman, K. P. (2014). WWBs, ENSO predictability, the spring barrier and extreme events. J. Geophys. Res. Atmos. 119, 10114–10138. doi:10.1002/2014jd021908
MacQueen, J. B. (1967). “Some methods for classification and analysis of multivariate observations,” in Proceedings of the 5th berkeley symposium on mathematical statistics and probability (Berkeley: University of California Press), 281–297.
Marathe, S., Ashok, K., Swapna, P., and Sabin, T. P. (2015). Revisiting El Niño modokis. Clim. Dyn. 45, 3527–3545. doi:10.1007/s00382-015-2555-8
Milly, P. C. D., and Shmakin, A. B. (2002). Global modeling of land water and energy balances. Part I: the land dynamics (LaD) model. J. Hydrometeorol. 3, 283–299. doi:10.1175/1525-7541(2002)003<0283:gmolwa>2.0.co;2
Mu, M., Duan, W. S., Chen, D. K., and Yu, W. (2015). Target observations for improving initialization of high-impact ocean-atmospheric environmental events forecasting. Natl. Sci. Rev. 2, 226–236. doi:10.1093/nsr/nwv021
Mu, M., Yu, Y. S., Xu, H., and Gong, T. (2014). Similarities between optimal precursors for ENSO events and optimally growing initial errors in El Niño predictions. Theor. Appl. Climatol. 115, 461–469. doi:10.1007/s00704-013-0909-x
Qi, Q. Q., Duan, W. S., and Xu, H. (2021a). The most sensitive initial error modes modulating intensities of CP- and EP- El Niño events. Dyn. Atmos. Oceans 96, 101257. doi:10.1016/j.dynatmoce.2021.101257
Qi, Q. Q., Tong, H., and Chen, J. (2021b). The development and application of K-means ensemble prediction product based on GRAPES-global ensemble prediction system. Meteorological Sci. Technol. 49, 542–551.
Ren, H. L., Jin, F. F., Tian, B., and Scaife, A. A. (2016). Distinct persistence barriers in two types of ENSO. Geophys. Res. Lett. 43, 10973–10979. doi:10.1002/2016gl071015
Shen, Z. Q., Tang, Y. M., and Li, X. J. (2017). A new formulation of vector weights in localized particle filters. Q. J. R. Meteorol. Soc. 143, 3269–3278. doi:10.1002/qj.3180
Stouffer, R. J., Broccoli, A. J., Delworth, T. L., Dixon, K. W., Gudgel, R., and Held, I. (2006). GFDL’s CM2 global coupled climate models. Part IV: Idealized climate response. J. Clim. 19 (5), 723–740. doi:10.1175/JCLI3632.1
Tao, L. J., Gao, C., and Zhang, R. H. (2018). ENSO predictions in an intermediate coupled model influenced by removing initial condition errors in sensitive areas: a target observation perspective. Adv. Atmos. Sci. 35, 853–867. doi:10.1007/s00376-017-7138-7
Tao, L. J., Zhang, R. H., and Gao, C. (2017). Initial error-induced optimal perturbations in ENSO predictions, as derived from an intermediate coupled model. Adv. Atmos. Sci. 34, 791–803. doi:10.1007/s00376-017-6266-4
Van Leeuwen, P. J. (2009). Particle filtering in geophysical systems. Mon. Wea. Rev. 137, 4089–4114. doi:10.1175/2009mwr2835.1
Weng, H. Y., Ashok, K., Behera, S. K., Rao, S. A., and Yamagata, T. (2007). Impacts of recent El Niño Modoki on dry/wet conditions in the Pacific rim during boreal summer. Clim. Dyn. 29, 113–129. doi:10.1007/s00382-007-0234-0
Wittenberg, A. T., Rosati, A., Lau, N. C., and Ploshay, J. J. (2006). GFDL’s CM2 global coupled climate models. Part III: Tropical Pacific climate and ENSO. J. Clim. 19 (5), 698–722. doi:10.1175/JCLI3631.1
Wu, D., Hou, Y. T., and Zhang, Y. Q. (2000). Transporting real-time video over the internet challenges and approaches. Proceeding IEEE 88, 1855–1877. doi:10.1109/5.899055
Yang, Z. Y., Fang, X. H., and Mu, M. (2020). The optimal precursor of El Niño in the GFDL CM2p1 model. J. Geophys. Res. Oceans 125. doi:10.1029/2019JC015797
Yeh, S. W., Kug, J. S., and Dewitte, B. (2009). Recent changes in El Niño and its projection under global warming. Nature 461, 511–515. doi:10.1038/nature08316
Yu, J. Y., and Kao, H. Y. (2007). Decadal changes of ENSO persistence barrier in SST and ocean heat content indices: 1958-2001. J. Geophys. Res-Atmo. 112. doi:10.1029/2006jd007654
Zebiak, S. E., and Cane, M. A. (1987). A model El Ni&ntilde–Southern oscillation. Mon. Wea. Rev. 115, 2262–2278. doi:10.1175/1520-0493(1987)115<2262:ameno>2.0.co;2
Zhang, L., Wang, C., Han, W., Mcphaden, M. J., Hu, A., and Xing, W. (2023). Emergence of the Central Atlantic Nino. Science Advances 9, eadi5507. doi:10.1126/sciadv.adi5507
Zheng, F., and Yu, J. Y. (2017). Contrasting the skills and biases of deterministic predictions for the two types of El Niño. Adv. Atmos. Sci. 34, 1395–1403. doi:10.1007/s00376-017-6324-y
Zhu, L. M., Zhang, Z. X., and Wei, Q. W. (2021). Spatial distribution of diurnal rainfall variation in summer over China. Journal of Hydrometeorology 19, 667–678. doi:10.1175/JHM-D-17-0176.1
Keywords: sensitive area, El Niño, intensity predictions, spatial structure predictions, targeted observations
Citation: Qi Q, Duan W, Liu X and Xu H (2024) Exploring sensitive area in the whole pacific for two types of El Niño predictions and their implication for targeted observations. Front. Earth Sci. 12:1429003. doi: 10.3389/feart.2024.1429003
Received: 07 May 2024; Accepted: 13 June 2024;
Published: 16 July 2024.
Edited by:
Kevin Cheung, Nanjing University of Information Science and Technology, ChinaCopyright © 2024 Qi, Duan, Liu and Xu. This is an open-access article distributed under the terms of the Creative Commons Attribution License (CC BY). The use, distribution or reproduction in other forums is permitted, provided the original author(s) and the copyright owner(s) are credited and that the original publication in this journal is cited, in accordance with accepted academic practice. No use, distribution or reproduction is permitted which does not comply with these terms.
*Correspondence: Wansuo Duan, ZHVhbndzQGxhc2cuaWFwLmFjLmNu