 Xiyang Tang
 Chen Chen
 Dan Shan
- State Key Laboratory of Hydraulics and Mountain River Engineering, College of Water Resource and Hydropower, Sichuan University, Chengdu, China
Slope instability, driven by factors such as rainfall, seismic activity, and human influence, presents a pervasive hazard worldwide. Timely assessment of slope stability and accurate identification of its most critical slip surface are important for slope safety early warning and management. Currently, for the slope reliability analysis by the strength reduction method (SRM), the critical failure path is approximately determined through visualization techniques, which is not sufficiently precise. Therefore, this study proposes a critical failure search method based on SRM for slope reliability analysis, aiming to accurately identify the critical slip surface. The critical failure path is considered as the path with the maximum plastic dissipative energy density (PDED) and is searched in the constructed weighted graph based on the dissipated energy of the slope. This proposed method is further applied with an engineering slope to find the critical failure path and assess its reliability during and after construction. The searched critical failure path lies within the approximate range obtained through conventional visualization methods. Finally, a reliability prediction model consisting of time, rainfall, and deformation component is further constructed, which allows rapid estimation of the slope reliability through available monitor data. The results of reliability analysis indicate that construction disturbances have a significant impact on slope stability, along with other factors such as rainfall and creep.
1 Introduction
Slope instability occurs frequently and is a major threat to human lives and properties (Zhang et al., 2019; Li et al., 2020; Ogila, 2021; Jia et al., 2024). There are numerous factors that influence slope stability, such as material properties, fracture zones, seepage, slope shape, and rainfall, etc (Merghadi et al., 2018; Ma et al., 2022b; 2022a; Li et al., 2022). The stability of slopes has gained considerable attention and approaches to the slope stability analysis have been widely developed over the past few decades. Previously, deterministic methods are widely used due to the simplicity and convenience, which evaluate the overall slope stability by a single safety factor, such as the limit equilibrium method (LEM) and the finite element method (FEM). However, geological materials are natural heterogeneous and variable, and factors affecting the slope stability often display significant randomness and discreteness. Employing constant parameters for assessing slope stability is likely to yield inaccurate results. Thus, slope reliability analysis based on probabilistic theory has emerged, which integrate uncertainty factors of geological materials and environment conditions into slope stability evaluation, such as the soil/rock property, the slope geometry, the loading condition, etc (Zhu et al., 2023).
Slope reliability analysis involves incorporating probabilistic theory into the conventional framework of slope stability analysis methods (Li et al., 2017; Mouyeaux et al., 2018; Liu et al., 2020). The most challenging issue is the determination of the critical slip surface, particularly for the reliability analysis based on the limit equilibrium method (LEM). Extensive researches based on the LEM have been devoted to identifying the critical slip surface from a large number of potential slide surfaces, which is computationally heavy (Bhattacharya et al., 2003; Cheng, 2003; Zeng et al., 2015; Jiang et al., 2017; Wang et al., 2020b). Hence, the strength reduction method (SRM) has been developed, which offers a dynamic approach to slope stability assessment without the need for predefining the failure surfaces. By iteratively reducing material strength parameters, it can effectively consider the stress-strain behaviors of geotechnical materials and provide distinct benefits for capturing the progressive slope failure mechanism (Ma et al., 2017; Mouyeaux et al., 2018; Sun et al., 2021). The strength reduction method only yields the safety factor of the slope (i.e., the reduction factor for non-converge), without being able to determine the most critical slip surface. Traditionally, the critical slip surface is approximately selected through visualization techniques, such as mesh deformation plots, plastic zone plots and failed elements plots (e.g., Griffiths and Lane, 1999; Luan et al., 2003; Shukha and Baker, 2003). Currently, methods for automatically determining the most critical slip surface by utilizing the stress and displacement after SRM have emerged. Zheng et al. (2009) defined the critical failure path as a wavy line connecting the points of maximum equivalent plastic strain, which was then fitted and smoothed. Cheng et al. (2013) set up a series of vertical lines along the horizontal direction and connected the point with the largest shear strain increment on each vertical line as the critical failure path. By laying vertical lines and connecting the extreme points on the lines, critical paths can be selected automatically, but the obtained critical paths are affected by the arrangement of the lines. Guo et al. (2022) applied a real-code genetic algorithm to determine the critical failure path of slopes at the limit equilibrium state. Wang Y. et al. (2020) combined the k-mean clustering and spline technique to automatically obtain critical failure paths based on node displacements difference between the sliding block and the stable block. However, the mentioned methods identify critical failure paths based on the limit equilibrium state without considering the evolution of failure paths during the strength reduction process. In addition, when the slope has not reached the limit equilibrium state, the difference in displacement between the potentially sliding block and the stable rock block is not obvious, and it is difficult to obtain the failure path based on the displacement clustering analysis. Energy dissipation is considered to the source of deformation process of rocks, which causes internal damage and irreversible plastic deformation, leading to a loss of strength and ultimately to complete failure (Xie et al., 2009). Critical failure path search based on the dissipated energy can effectively reflect the inherent connection between rock deformation and energy, and inherently reveals the changes in rock strength and the overall damage behavior.
Therefore, in this study, a failure path search method based on SRM for slope reliability analysis is proposed. Based on the recognition that damage or degradation of geotechnical materials is accompanied by irreversible energy dissipation, the critical failure path is defined as the path with the maximum plastic dissipation energy. This study firstly introduces the concept of maximum plastic dissipative energy density (PDED), which enables precise identification of the critical failure path through a constructed weighted graph based on slope dissipated energy, effectively converting the critical path search into locating the path with the minimal weight. The method is illustrated by an excavated slope case, and the validity of the searched critical failure path is verified by comparing it with the failure path obtained by conventional method. In addition, a reliability prediction model is further constructed to establish the connection between the monitoring data (e.g., time, rainfall, and deformation) and the reliability indexes. Therefore, the trend of slope reliability can be quickly obtained based on the available monitoring data, providing theoretical support for the slope safety early warning.
2 Research method
2.1 The slope failure path searching method based on the energy dissipation
2.1.1 Energy dissipation in rocks
Rock damage or degradation under the influence of external mechanical energy or energy from the environment such as heat or radiation is accompanied by irreversible energy dissipation (Wang et al., 2021). From the law of conservation of energy, assuming that there is no heat exchange between the rock mass and the outside world, part of the total input energy is stored in the rock mass in the form of elastic energy, and the other part is gradually dissipated along with the plastic deformation and damage of the rock mass. Figure 1 shows the stress-strain relationship curve of the rock unit, the shaded area Wie is the elastic energy that can be released by the rock unit, and the area Wid is the energy dissipated by the rock unit. Energy dissipation is a unidirectional irreversible process, whereas energy release is a bidirectional reversible process. The energy relationship can be presented as Equations 1–4 (Xie et al., 2009):
Where We is the elastic strain energy of the rock unit; Wd is the plastic dissipation energy of the rock unit; σi (i = 1, 2, 3) is the principal stress; εi (i = 1, 2, 3) is the principal strain in the three principal stress directions;
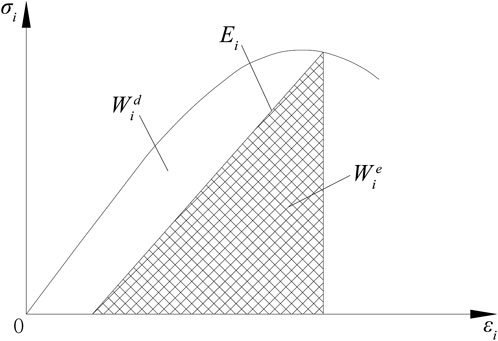
Figure 1. Energy relations within the rock mass.
2.1.2 The method of failure path searching
Energy dissipation causes internal damage and irreversible plastic deformation of rocks, leading to degradation of rock strength and ultimately to complete failure. The more plastic energy a rock dissipates, the more severe irreversible damage it experiences. Therefore, it is reasonable to assume that the critical failure path occurs in the slip surface with the highest plastic dissipation energy of the slope. In this study, the plastic dissipative energy density (PDED) is used as the index to determine the potential damage of a rock unit, which denotes the plastic dissipative energy per unit volume during the irreversible deformation and can be calculated as:
Where Pm is the plastic dissipative energy of the unit m; ρm is the plastic dissipative energy density of the unit m; Vm is the volume of the unit m; σij is the stress tensor of the unit m; εij is the plastic strain tensor of the unit m.
In the process of searching for the slope failure path, the initial step involves constructing a finite element model for the rock slope and determining its material properties, including the friction angle, cohesion, elastic modulus, and Poisson’s ratio. Model information such as the unit number, node number, and unit volume are recorded, which are the input information for the critical failure path searching. Then, the strength reduction method (SRM) is used to obtain the approximate range of failure paths of the slope. The shear strength parameters of the rock mass are gradually reduced until the plastic zone penetrates the slope. The reduced slope shear strength parameters can be calculated according to Equations 7, 8:
Where c and φ are the actual cohesion and internal friction angle of the rock, respectively; Fr is the reduction factor.
By calculating the PDED of each rock unit using Equations 5, 6, all the failure units can be obtained. The reduction factor is increased step by step from a small value until the plastic zone penetrates the slope. During this process, the distribution of failure units changes accordingly. Thus, these failure units can be divided into the start set, the middle set, and the end set according to the damage characteristics of the slope and the change of failure units during the strength reduction process. For instance, when the plastic zone penetrates the slope, failure units located at the two ends of the fully penetrated plastic zone are categorized into the start and end sets, while the other units with dissipative energy are classified within the middle set. Any two failure units sharing the same node can be considered as the adjacent units, and a failure unit in the start set can form multiple failure paths through the adjacent failure units. Then, the path weight can be obtained by Equation 9, which is defined as the ratio of the maximum PDED of all the failed units to the PDED of any two adjacent failure units. Thus, the failure path with the highest PDED corresponds to the path with the lowest weight, converting the critical path search problem into locating the path with the minimum weight.
Where
In this study, the Dijkstra algorithm is further applied to search for the critical failure path of the slope. It is widely used to find the shortest path from a starting node to all other nodes by continually updating distances and exploring the nearest unvisited nodes (Wang, 2012). The process terminates when all nodes have been visited or a destination is reached, providing optimal routes efficiently. Thus, the failure paths can be identified by applying different reduction factors Fr, and the critical failure path becomes evident when the slope fails.
2.2 The slope reliability analysis
Following the determination of the critical failure path, the performance function of the slope reliability analysis can be expressed as:
Where R and S represents the slip resistance force and the sliding force acting on the critical failure path, respectively.
The slope reliability can then be obtained using sampling methods, in which the failure probability is determined by the ratio of failure samples (Z(x)<0) to the total number of samples. In general, this sampling process requires a large number of time-consuming numerical calculations to determine the stresses on the critical failure path. To improve the computational efficiency, the response surface method (RSM) can be used to approximate the performance function. If a quadratic polynomial function without cross terms is used, the performance function Equation 10 can then be expressed as Equation 11 (Zhang et al., 2011; Tan et al., 2013):
Where xi is input random variable (e.g., material parameters), n is the number of input random variables, a, bi, and ci are the unknown coefficients, which can be can be fitted based on the numerical calculation results.
2.3 Slope reliability prediction model
The reliability of a slope is affected by various factors (including creep, construction activities, rainfall, etc.) and changes in these factors can be reflected in monitoring data. Therefore, a slope reliability prediction model is constructed, allowing for the rapid extraction of the trend of slope reliability based on available monitoring data. Considering the influencing factors of slope reliability and the accessibility of monitoring data, the constructed model includes a time component, a rainfall component, a deformation component, and a constant term. Based on the previous reliability calculation results, the coefficients in each component can be fitted. Subsequently, the trend of slope reliability can be estimated in time using the real-time monitoring data.
Where Fs(t) is the statistical estimate of slope reliability at moment t; F1[θ(t)] is the time component, F2[W(t)] is the rainfall component; F3[Y(t)] is the deformation component; and C is a constant term to be determined.
2.3.1 Time component
The creep characteristics of the rock and soil materials are primarily reflected by the time component. Since the creep will gradually stabilizes in the final stage, the time component can be expressed in the form of logarithmic function.
Where a is the regression coefficient to be determined.
2.3.2 Rainfall component
Considering the hysteresis effect of rainfall on slope deformation, the total rainfall in the week before the observation date is selected to construct the rainfall component.
Where qi (i = 1, 2, … , 7) is the daily rainfall on i day before the observation date; Q is the total rainfall in the week before the observation date; and b is a coefficient to be determined.
2.3.3 Deformation component
The deformation component is constructed using the displacements of existing monitoring points in both horizontal and vertical directions on the observation day.
Where ci and di are coefficients to be determined; xi and yi are the horizontal and vertical displacements of each monitoring point on the observation day, respectively.
3 Engineering application
3.1 Project overview
The Nam Ngum3 Hydropower Station is located in Xaysomboune Province, Laos. The plant of the hydropower station is situated on the right bank of the Nam Ngum River. The stability of the slope behind the Nam Ngum plant directly affects the safety of the hydropower station, which is further excavated and supported. The slope generally trends in an east-west (EW) direction with an overall slope angle of 30°, exhibiting stepped features with alternating steep and gentle sections. The slope is composed of Quaternary loose deposits and basement rock. The overlying layer is composed of gravelly silty clay, with an average thickness ranging from 4 to 8 m. The underlying basement rock consists mainly of schist interbedded with phyllite, with schist accounting for about 80% and phyllite for about 20%. The schist is relatively fresh and intact, while the phyllite forms bands, with thickness varying between 2 and 15 m, and the rock is generally softer. The orientation of the slope joints is NW300°∼350° inclined to NE, with an inclination angle of 60°∼80°. The fully weathered layer is relatively thick, typically ranging from 30 to 40 m. The slope excavation started in January 2016 and was completed in April 2018. A series of permanent surface deformation monitoring points for the slope were arranged along the elevation (i.e., TP1-1, TP1-2, and TP1-3). In this study, the reliability of the slope during and after excavation are assessed, respectively. The slope profile and the location of the surface deformation monitoring points are shown in Figure 2.
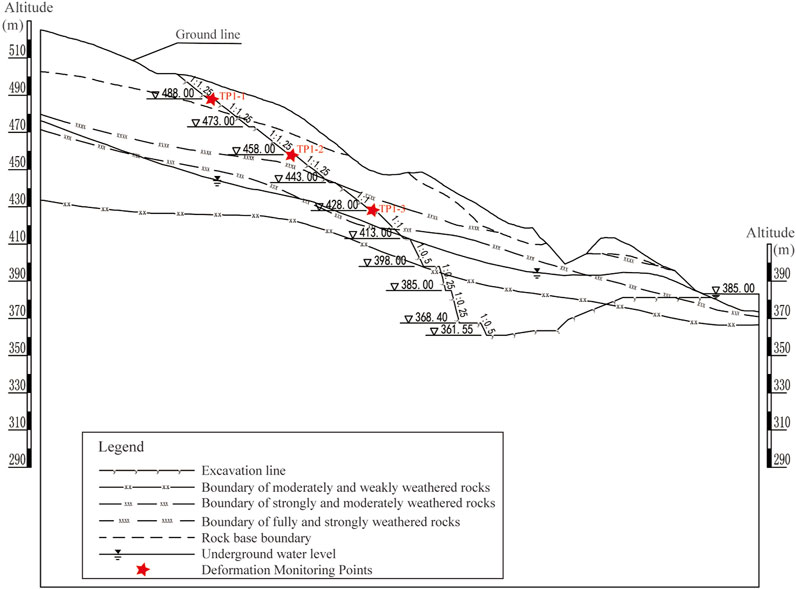
Figure 2. The slope excavation profile.
3.2 The finite element model and material parameters
The finite element model of the slope is established considering topographic and geological conditions, excavation and support processes, and the arrangement of the monitoring system. The vertical range of the model is from elevation 220–525 m, approximately twice the height of the excavation depth. The horizontal range of the model is approximately 390 m. The finite element model is illustrated in Figure 3, with a total of 7,036 units.
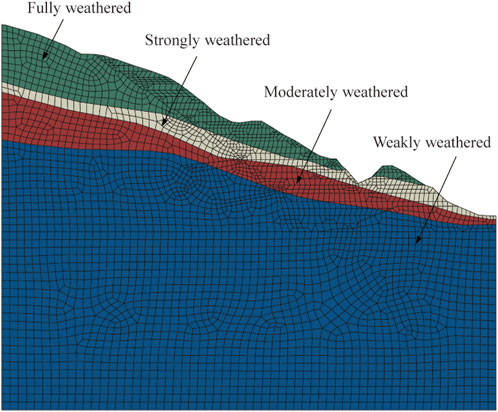
Figure 3. The finite element model of the slope with different materials.
The mechanical properties of the rock mass may change due to creep, rainfall infiltration, construction disturbances, etc. (Xu et al., 2011; Vallet et al., 2016; Zhou et al., 2022). Therefore, a segmented inverse analysis is adopted to get the mechanical parameters of the slope materials, which can effectively improve the accuracy. The inverse analysis simulation period is divided into two stages according to the seepage control engineering measures, which are 2017. 5–2017. 11 (without seepage control measures) and 2017. 11–2019. 10 (with seepage control measures).
The surface layer of the slope is quaternary loose accumulations, and the lower bedrock consists of a thick layer of fully weathered schist and phyllite. The slope is composed of fully weathered, strongly weathered, moderately weathered, and weakly weathered rock layers. In this study, the Cvisc model is used to simulate the creep behavior of geotechnical materials, which combines the Burger model and the Mohr-Coulomb model. For the inversion period without seepage control, the elastic modulus E, the cohesion c, and the internal friction angle φ of the slope are selected as the inversion parameters. For the inversion period with seepage control measures, another three creep parameters are added, including the Kelvin modulus of elasticity Ek, the Maxwell viscosity ηm, and the Kelvin viscosity ηk in the Cvisc model.
To save the effort of numerical calculation, the displacement response surface equation is constructed (Xu and Low, 2006).
Where δ is the fitted value of slope displacement obtained from the response surface equation; a, bi and ci are the coefficients of the response surface equation to be determined; n is the number of slope material parameters; xi (i = 1, 2, … , n) are the slope material parameters (such as elastic modulus E, the cohesion c, and the internal friction angle φ).
By fitting the equation with the results from multiple numerical simulations, the unknown parameters in Equation 16 can be determined, thus enabling it to serve as a substitute for numerical calculations. Then, inversion parameters can be obtained by minimizing the sum of squares of the relative errors between the measured displacement increments and the displacement increments obtained from the response surface equation. Figures 4, 5 show the evolution of the inversed values and the measured values of the displacements at the measurement point, and the results of the inversed parameters are shown in Table 1. The average error of each measurement point is within 12%, which indicates that the inversion results can better reflect the displacement characteristics of the actual project.
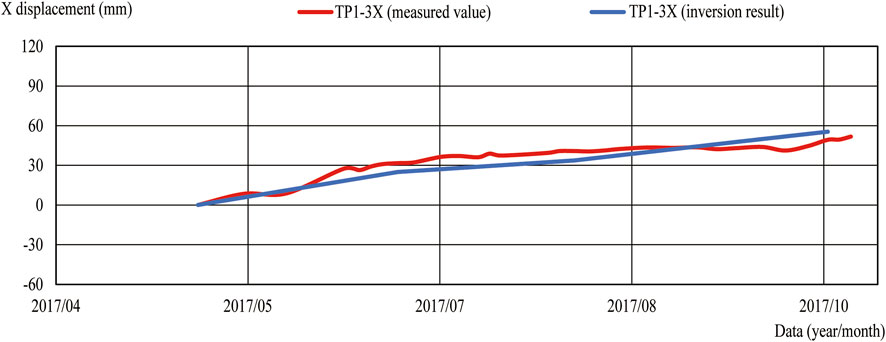
Figure 4. The measured and inverted lateral displacements of TP1 (without seepage control measurements).
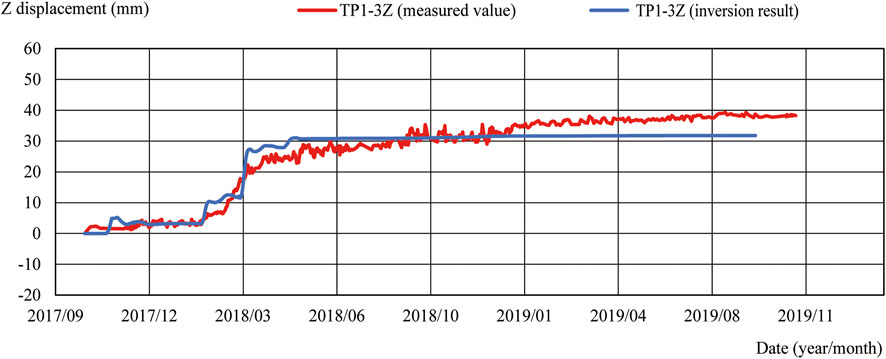
Figure 5. The measured and inverted lateral displacements of TP1 (with seepage control measurements).
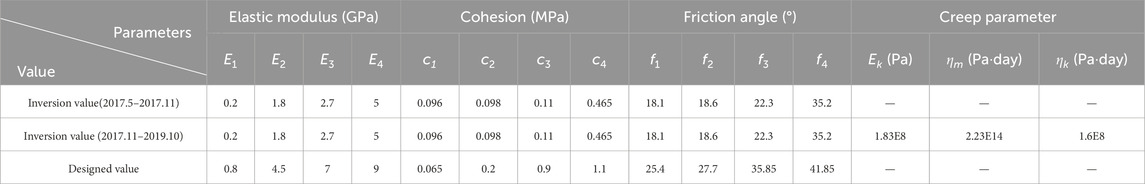
Table 1. Summary of inversion results for material parameters.
3.3 Critical failure path searching
With model parameters determined, the slope excavation process is simulated and the stress state of the slope after excavation is retained. Afterwards, the SRM is adopted to obtain the slope stress-strain behaviors with different reduction factors. The reduction factor is increased step by step from a small value until the plastic zone penetrates the slope and there is a sudden change in displacement at the critical point on the potential sliding body. At this time, there is a sudden change in the displacement of the critical point on the potential sliding body. During this process, the critical failure path of the slope can be searched based on the Dijkstra algorithm.
When the strength reduction factor is 0.85, a small portion of plastic deformation can be observed at the bottom of the step in the seventh excavation, as shown in Figure 7B. The set of failure units in this case is T={13, 29, 35, 45, 47}, which is divided into a starting set B={45, 47}, a middle set M={29, 35} and an end set F={13}. Two failure units are adjacent if they share any node. Thus, a weighted graph containing multiple failure paths from the start set to the end set can be generated. Then, calculate the path weights between two adjacent failure units according to Equation 9, and search the path with the minimum path weights using the Dijkstra algorithm. Finally, the critical failure path of the slope is obtained when the strength reduction factor is 0.85 (Path= {47, 35, 29, 13} in Figure 6). As the strength reduction factor increases, the plastic zone of the slope expands. When the strength reduction factor increases to 1.3, the plastic zone penetrates the slope, and the critical failure paths and plastic zones of the slope under different strength reduction factors are shown in Figure 7.
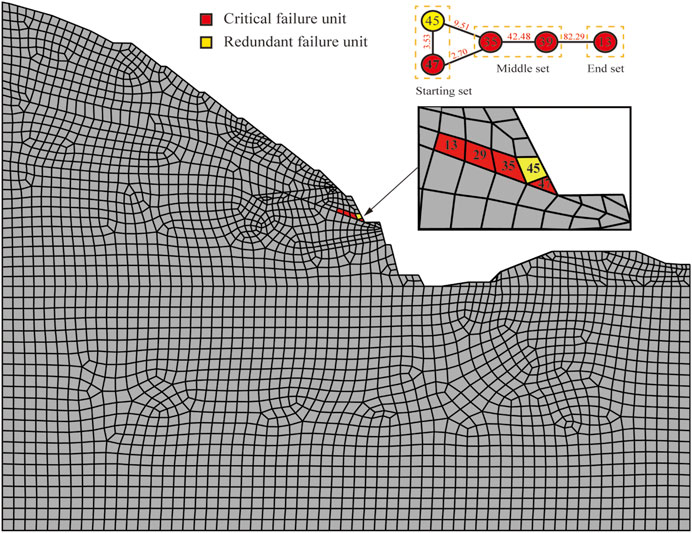
Figure 6. Critical failure path search of the slope (Fr = 0.85)
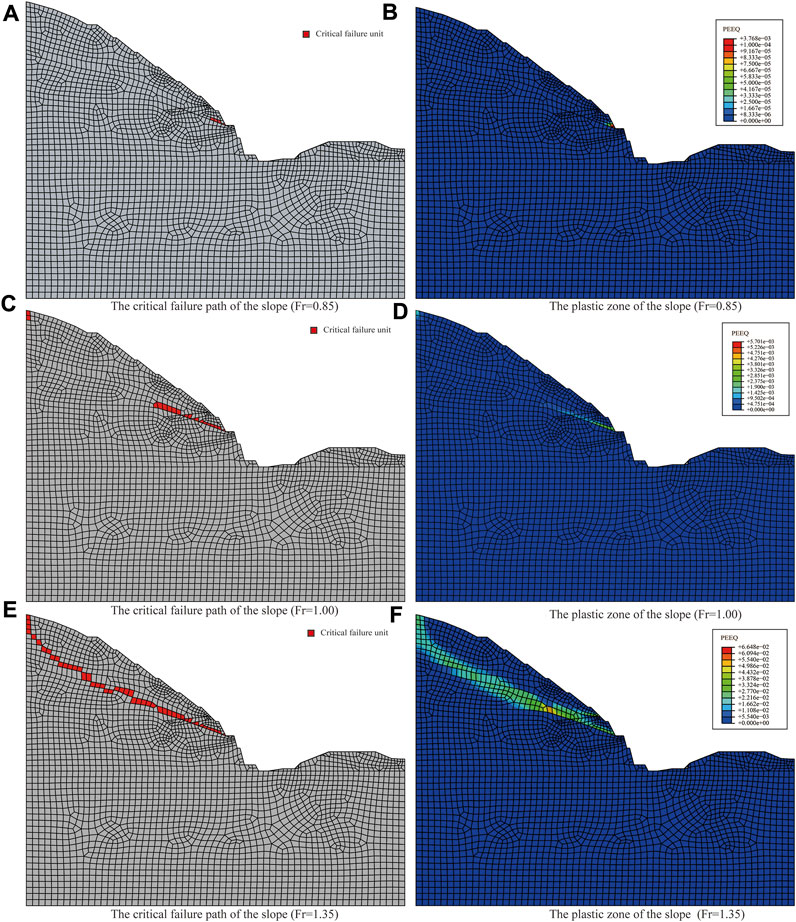
Figure 7. Critical failure paths and plastic zones of the slope under different strength reduction factors. (A) the critical failure path of the slope (Fr = 0.85); (B) the plastic zone of the slope (Fr = 0.85); (C) the critical failure path of the slope (Fr = 1.00); (D) the plastic zone of the slope (Fr = 1.00); (E) the critical failure path of the slope (Fr = 1.35); (F) the plastic zone of the slope (Fr = 1.35).
Rock joint is an important factor affecting the stability of slopes (Barton et al., 2023; Wang et al., 2023; Yong et al., 2024). In general, the mechanical parameters of joints will be lower than those of intact rock. When the orientation of joints is similar to the slope orientation, the failure path of the slope may develop along the joints. In this paper, the orientation of the slope joints intersects with the slope orientation at a large angle, and the joints have little influence on the damage form of the slope, thus the influence of the joints is not considered in the calculation of slope stability. However, if slope joints need to be considered, the proposed method is still able to capture the energy dissipation at the joints and obtain the development of the failure path. As shown in Figure 7, this method can reflect the typical damage characteristics and evolution of a rock slope under strength reduction. In addition, the proposed method is appropriate to a wide range of yield criteria and can be further applied in 3D slope stability analysis.
3.4 Reliability analysis and predictive modeling
3.4.1 Reliability analysis
Randomness and uncertainty in material properties are the most important factors that may affect the slope reliability. According to the inversion results, the modulus of elasticity E, the cohesion c, and the internal friction angle φ of the slope are selected as the basic random variables. The information of each parameter is shown in Table 2. In this paper, the Monte Carlo method is used to calculate the failure probability and the reliability index of the slope, during which the critical failure path is fixed as the one derived from mean parameters. Although this approach slightly overestimating the slope reliability, it still yields relatively good estimates of the slope reliability and is substantially more computationally efficient compared to identifying different critical failure paths through various parameters combinations (De Koker et al., 2019). The critical failure path of the slope after excavation is taken as the critical failure path. To save time, a quadratic polynomial without cross terms (Equation 11) is used to construct the response surface equation for the subsequent reliability calculation (Zhang et al., 2011; Tan et al., 2013).
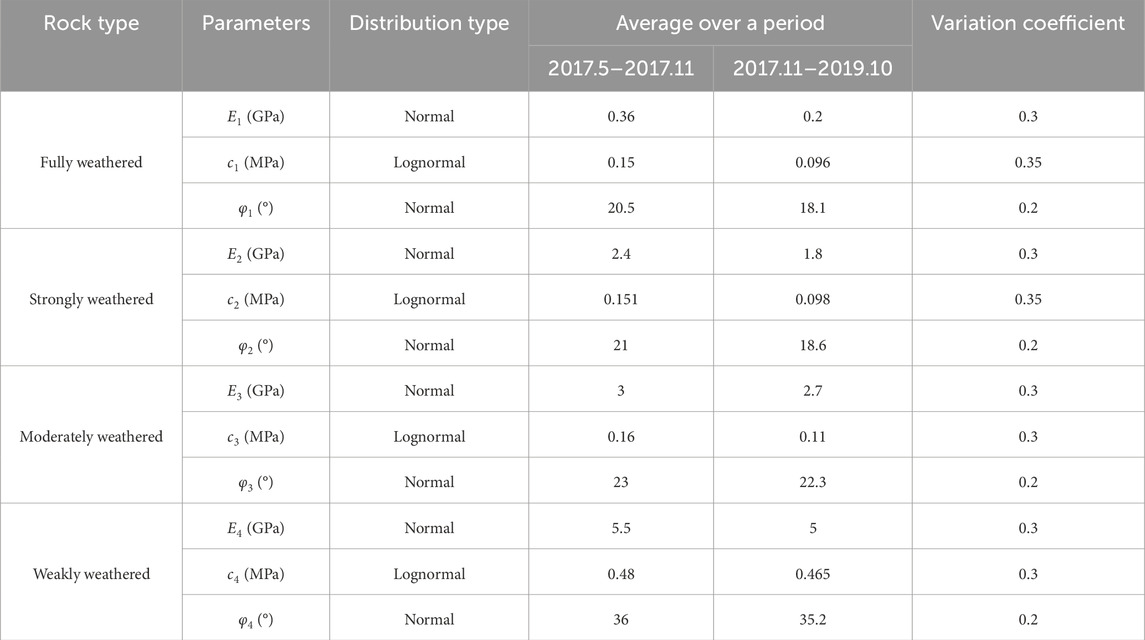
Table 2. Parameter list of basic random variables.
The variation of reliability indexes during excavation is shown in Figure 8. The reliability index initially undergoes a smooth transition, followed by a slight increase, then gradually decreases before stabilizing at around 3.25. Combined with the excavation and support diagram of the slope (Figure 9), it can be seen that the change in reliability during the simulation period is closely related to the slope construction process. The downtime I represents the period without excavation, and the reliability index for this section is essentially stable. During the seventh excavation phase (i.e., Excavation I), the reliability index experiences a slight increase. This is attributed to the installation of two rows of 100-ton anchor cables at elevations ranging from 413 to 420 m. These anchor cables traverse the potential sliding surface of the slope, enhancing the stress conditions of the surrounding rock mass and resulting in an increase in the reliability index. During the period of Downtime II, when seepage control measures were implemented, rainfall would not cause rock deformation and the reliability index maintained relatively stable. Excavation II corresponds to the eighth, ninth, and tenth phases of the slope excavation. Figure 9 illustrates that the exit of the potential sliding surface is located at the seventh excavation platform. The subsequent excavations effectively removed the counter-slide bodies along the direction of sliding, resulting in a decrease in the reliability index. After the slope excavation was completed in May 2018, two rows of 150-ton anchor cables were installed between elevations of 385 and 392 m. However, as the second support did not intersect the potential sliding surface, its effect on the reliability index was minor, and the reliability index eventually stabilized at around 3.25.
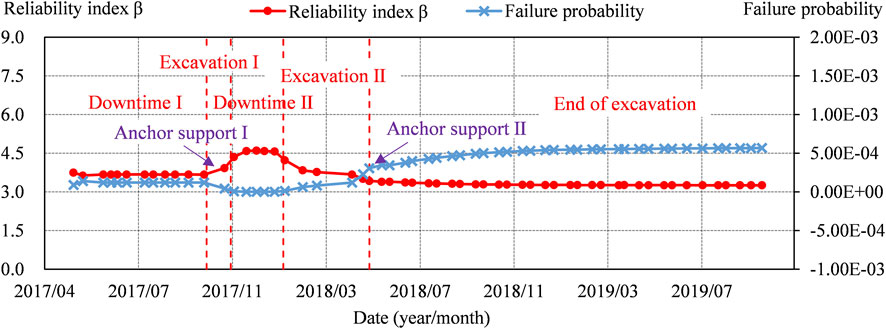
Figure 8. Variations of the slope reliability and failure probability.
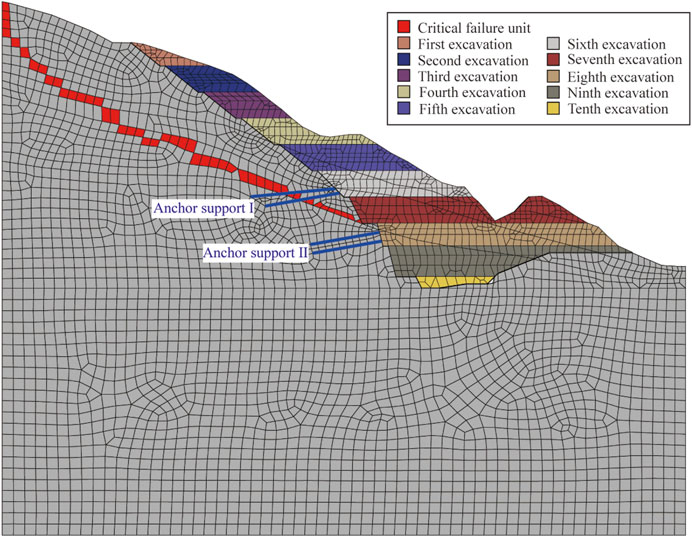
Figure 9. The schematic diagram of the slope excavation and support process.
3.4.2 Reliability prediction model
The monitoring points for deformation components are TP-1, TP-2 and TP-3. Taking the reliability index sequence from May 2017 to June 2019 as the modeling period, the slope reliability prediction model can be developed by Equations 12–15, as shown in Equation 17. The coefficients of reliability prediction model are determined using the same time sequence. It can be found from Figure 10 that the overall fitted values are in good agreement with the measured values, with an overall average relative error of 0.15%. The offset of the fitted values in the excavated section is slightly larger, which is due to the sudden change in the reliability index caused by the excavation.
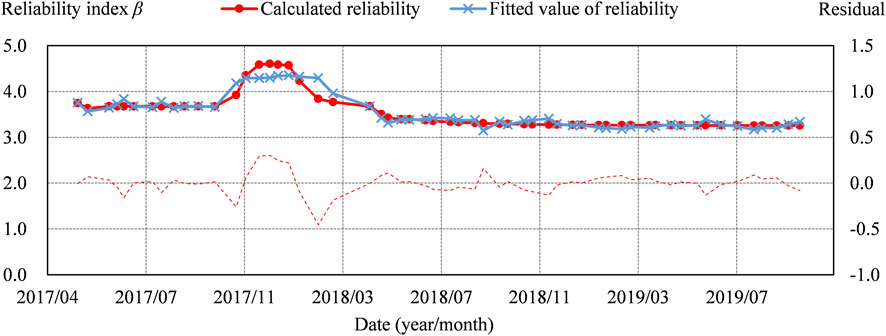
Figure 10. Calculated and fitted values of the slope reliability indicators.
Then, the trend of the reliability index in the next 90 days is predicted and the result is shown in Table 3. The compound correlation coefficient R of the reliability prediction model for the slope stability is 0.949, with a standard deviation σ of 0.130. The overall prediction performance is satisfactory, with an average relative error of 0.36% between the predicted and calculated values. The maximum relative error is 2.75%, indicating high accuracy in the prediction section.
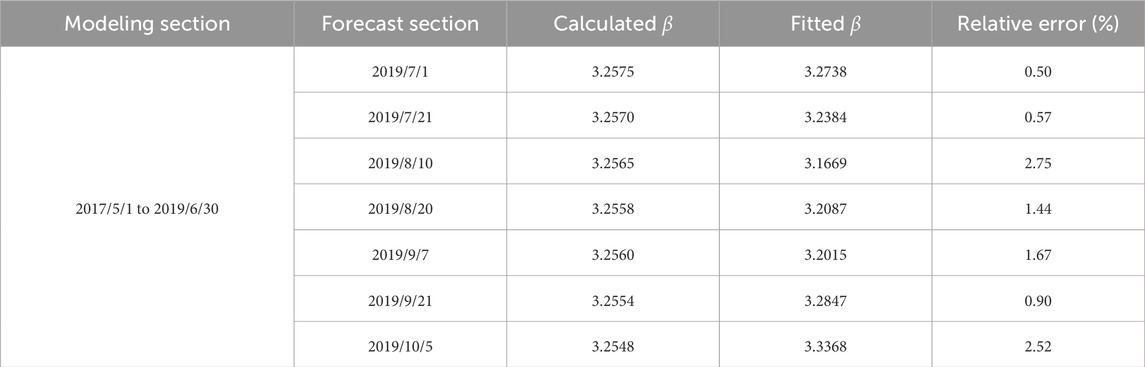
Table 3. Predicted results of slope reliability indexes.
4 Conclusion
This paper proposed a critical failure path search method based on SRM for slope reliability analysis and the critical failure path. The path with the maximum plastic dissipative energy density (PDED) is considered as the critical failure path, and the search problem for the critical failure path of the slope is transformed into the optimization problem of minimizing the path weights based on the Dijkstra algorithm. The proposed method avoids the subjectivity of artificially selecting critical failure paths and can be further applied in 3D slope reliability analysis. Additionally, the reliability of an engineering slope during and after the excavation is assessed using this method. The results show that the evolution of the reliability index is closely related to the construction process, and a reliability prediction model considering time, rainfall, and deformation components is constructed, which allows rapid estimate of the slope reliability through available monitor data.
Data availability statement
The original contributions presented in the study are included in the article/supplementary material, further inquiries can be directed to the corresponding author.
Author contributions
XT: Conceptualization, Methodology, Writing–original draft, Software. CC: Writing–review and editing, Supervision. DS: Data curation, Software, Writing–original draft. PZ: Writing–review and editing. JX: Writing–review and editing.
Funding
The author(s) declare that financial support was received for the research, authorship, and/or publication of this article. This research was substantially supported by the General Program of the National Natural Science Foundation of China (Grant No. 42277181) and the State Key Program of National Natural Science Foundation of China (Grant No. 52130904).
Conflict of interest
The authors declare that the research was conducted in the absence of any commercial or financial relationships that could be construed as a potential conflict of interest.
Publisher’s note
All claims expressed in this article are solely those of the authors and do not necessarily represent those of their affiliated organizations, or those of the publisher, the editors and the reviewers. Any product that may be evaluated in this article, or claim that may be made by its manufacturer, is not guaranteed or endorsed by the publisher.
References
Barton, N., Wang, C., and Yong, R. (2023). Advances in joint roughness coefficient (JRC) and its engineering applications. J. Rock Mech. Geotech. Eng. 15, 3352–3379. doi:10.1016/j.jrmge.2023.02.002
Bhattacharya, G., Jana, D., Ojha, S., and Chakraborty, S. (2003). Direct search for minimum reliability index of earth slopes. Comput. Geotech. 30 (6), 455–462. doi:10.1016/S0266-352X(03)00059-4
Cheng, L. Y., Li, J., Chen, S. X., and Chu, X. J. (2013). An application of the maximum shear strain increment in searching sliding surfaces. Appl. Mech. Mater 423, 1618–1622. doi:10.4028/www.scientific.net/AMM.423-426.1618
Cheng, Y. M. (2003). Location of critical failure surface and some further studies on slope stability analysis. Comput. Geotech. 30 (3), 255–267. doi:10.1016/S0266-352X(03)00012-0
De Koker, N., Day, P., and Zwiers, A. (2019). Assessment of reliability-based design of stable slopes. Can. Geotech. J. 56 (4), 495–504. doi:10.1139/cgj-2018-0149
Griffiths, D. V., and Lane, P. A. (1999). Slope stability analysis by finite elements. Géotechnique 49 (3), 387–403. doi:10.1680/geot.1999.49.3.387
Guo, M., Li, J., and Dong, X. (2022). Determining the critical slip surface of slope by vector sum method based on strength reduction definition. Front. Earth Sci. 10. doi:10.3389/feart.2022.865017
Jia, Y., Luan, S., Asheghabadi, M. S., Xing, D., Yuan, H., and Liu, J. (2024). Slope stability analysis of coastal geotechnical structures under combined effects of earthquake and rainfall. Front. Earth Sci. 11, 1335756. doi:10.3389/feart.2023.1335756
Jiang, S.-H., Huang, J., Yao, C., and Yang, J. (2017). Quantitative risk assessment of slope failure in 2-D spatially variable soils by limit equilibrium method. Appl. Math. Modell. 47, 710–725. doi:10.1016/j.apm.2017.03.048
Li, Q., Ma, D., Zhang, Y., Liu, Y., and Ma, Y. (2022). Insights into controlling factors of pore structure and hydraulic properties of broken rock mass in a geothermal reservoir. Lithosphere 2021, 3887832. doi:10.2113/2022/3887832
Li, Q., Wang, Y. M., Zhang, K. B., Yu, H., and Tao, Z. Y. (2020). Field investigation and numerical study of a siltstone slope instability induced by excavation and rainfall. Landslides 17 (6), 1485–1499. doi:10.1007/s10346-020-01396-5
Li, X.-Y., Zhang, L.-M., Gao, L., and Zhu, H. (2017). Simplified slope reliability analysis considering spatial soil variability. Eng. Geol. 216, 90–97. doi:10.1016/j.enggeo.2016.11.013
Liu, X., Li, D.-Q., Cao, Z.-J., and Wang, Y. (2020). Adaptive Monte Carlo simulation method for system reliability analysis of slope stability based on limit equilibrium methods. Eng. Geol. 264, 105384. doi:10.1016/j.enggeo.2019.105384
Luan, M.-t., Wu, Y.-j., and Nian, T.-k. (2003). A criterion for evaluating slope stability based on development of plastic zone by shear strength reduction FEM. J. Disaster Prev. Mitig. Eng. 23 (3), 1–8.
Ma, D., Duan, H., and Zhang, J. (2022a). Solid grain migration on hydraulic properties of fault rocks in underground mining tunnel: radial seepage experiments and verification of permeability prediction. Tunn. Undergr. Space Technol. 126, 104525. doi:10.1016/j.tust.2022.104525
Ma, D., Duan, H., Zhang, J., Liu, X., and Li, Z. (2022b). Numerical simulation of water–silt inrush hazard of fault rock: a three-phase flow model. Rock Mech. Rock Eng. 55, 5163–5182. doi:10.1007/s00603-022-02878-9
Ma, J. Z., Zhang, J., Huang, H. W., Zhang, L. L., and andHuang, J. S. (2017). Identification of representative slip surfaces for reliability analysis of soil slopes based on shear strength reduction. Comput. Geotech. 85, 199–206. doi:10.1016/j.compgeo.2016.12.033
Merghadi, A., Abderrahmane, B., and Tien Bui, D. (2018). Landslide susceptibility assessment at mila basin (Algeria): a comparative assessment of prediction capability of advanced machine learning methods. ISPRS Int. J. Geo-Inf. 7, 268. doi:10.3390/ijgi7070268
Mouyeaux, A., Carvajal, C., Bressolette, P., Peyras, L., Breul, P., and Bacconnet, C. (2018). Probabilistic stability analysis of an earth dam by Stochastic Finite Element Method based on field data. Comput. Geotech. 101, 34–47. doi:10.1016/j.compgeo.2018.04.017
Ogila, W. A. M. (2021). Analysis and assessment of slope instability along international mountainous road in North Africa. Nat. Hazard. 106 (3), 2479–2517. doi:10.1007/s11069-021-04552-9
Shukha, R., and Baker, R. (2003). Mesh geometry effects on slope stability calculation by FLAC strength reduction method–linear and non-linear failure criteria.
Sun, W., Wang, G., and Zhang, L. (2021). Slope stability analysis by strength reduction method based on average residual displacement increment criterion. Bull. Eng. Geol. Environ. 80, 4367–4378. doi:10.1007/s10064-021-02237-y
Tan, X.-h., Shen, M.-f., Hou, X.-l., Li, D., and Hu, N. (2013). Response surface method of reliability analysis and its application in slope stability analysis. Geotech. Geol. Eng. 31 (4), 1011–1025. doi:10.1007/s10706-013-9628-4
Vallet, A., Charlier, J. B., Fabbri, O., Bertrand, C., Carry, N., and Mudry, J. (2016). Functioning and precipitation-displacement modelling of rainfall-induced deep-seated landslides subject to creep deformation. Landslides 13 (4), 653–670. doi:10.1007/s10346-015-0592-3
Wang, B., Liu, L., Li, Y., and Jiang, Q. (2020a). Reliability analysis of slopes considering spatial variability of soil properties based on efficiently identified representative slip surfaces. J. Rock Mech. Geotech. Eng. 12 (3), 642–655. doi:10.1016/j.jrmge.2019.12.003
Wang, C., Yong, R., Luo, Z., Du, S., Karakus, M., and Huang, C. (2023). A novel method for determining the three-dimensional roughness of rock joints based on profile slices. Rock Mech. Rock Eng. 56, 4303–4327. doi:10.1007/s00603-023-03274-7
Wang, H., He, M., Pang, F., Chen, Y., and Zhang, Z. (2021). Energy dissipation-based method for brittleness evolution and yield strength determination of rock. J. Petroleum Sci. Eng. 200, 108376. doi:10.1016/j.petrol.2021.108376
Wang, S.-X. (2012). The improved dijkstra's shortest path algorithm and its application. Procedia Eng. 29, 1186–1190. doi:10.1016/j.proeng.2012.01.110
Wang, Y., Huang, J., and Tang, H. (2020b). Automatic identification of the critical slip surface of slopes. Eng. Geol. 273, 105672. doi:10.1016/j.enggeo.2020.105672
Xie, H., Li, L., Peng, R., and Ju, Y. (2009). Energy analysis and criteria for structural failure of rocks. J. Rock Mech. Geotech. Eng. 1 (1), 11–20. doi:10.3724/SP.J.1235.2009.00011
Xu, B., and Low, B. K. (2006). Probabilistic stability analyses of embankments based on finite-element method. J. Geotech. Geoenviron. Eng. 132 (11), 1444–1454. doi:10.1061/(ASCE)1090-0241(2006)132:11(1444)
Xu, Q., Yuan, Y., Zeng, Y., and Hack, R. (2011). Some new pre-warning criteria for creep slope failure. Sci. China Technol. Sci. 54, 210–220. doi:10.1007/s11431-011-4640-5
Yong, R., Wang, C., Barton, N., and Du, S. (2024). A photogrammetric approach for quantifying the evolution of rock joint void geometry under varying contact states. Int. J. Min. Sci. Technol. 34, 461–477. doi:10.1016/j.ijmst.2024.04.001
Zeng, P., Jimenez, R., and Jurado-Piña, R. (2015). System reliability analysis of layered soil slopes using fully specified slip surfaces and genetic algorithms. Eng. Geol. 193, 106–117. doi:10.1016/j.enggeo.2015.04.026
Zhang, J., Zhang, L. M., and Tang, W. H. (2011). New methods for system reliability analysis of soil slopes. Can. Geotech. J. 48 (7), 1138–1148. doi:10.1139/t11-009
Zhang, Z., He, S., Liu, W., Liang, H., Yan, S., Deng, Y., et al. (2019). Source characteristics and dynamics of the October 2018 Baige landslide revealed by broadband seismograms. Landslides 16 (4), 777–785. doi:10.1007/s10346-019-01145-3
Zheng, H., Sun, G., and Liu, D. (2009). A practical procedure for searching critical slip surfaces of slopes based on the strength reduction technique. Comput. Geotech. 36 (1-2), 1–5. doi:10.1016/j.compgeo.2008.06.002
Zhou, X., Pan, X., and Berto, F. (2022). A state-of-the-art review on creep damage mechanics of rocks. Fatigue & Fract. Eng. Mater. Struct. 45 (3), 627–652. doi:10.1111/ffe.13625
Keywords: reliability analysis, critical slip surface, path optimization, strength reduction method (SRM), energy dissipation
Citation: Tang X, Chen C, Shan D, Zhang P and Xue J (2024) Slope reliability assessment using an innovative critical failure path approach. Front. Earth Sci. 12:1428309. doi: 10.3389/feart.2024.1428309
Received: 06 May 2024; Accepted: 22 July 2024;
Published: 09 August 2024.
Edited by:
Huaming An, Kunming University of Science and Technology, ChinaReviewed by:
Dan Ma, China University of Mining and Technology, ChinaChangshuo Wang, Ningbo University, China
Copyright © 2024 Tang, Chen, Shan, Zhang and Xue. This is an open-access article distributed under the terms of the Creative Commons Attribution License (CC BY). The use, distribution or reproduction in other forums is permitted, provided the original author(s) and the copyright owner(s) are credited and that the original publication in this journal is cited, in accordance with accepted academic practice. No use, distribution or reproduction is permitted which does not comply with these terms.
*Correspondence: Chen Chen, bGF1cmFjaGVuQHNjdS5lZHUuY24=