- 1Graduate School of Science, Kyoto University, Kyoto, Japan
- 2Sustainable System Research Laboratory, Central Research Institute of Electric Power Industry, Abiko, Japan
Sinking particles in the ocean play a crucial role in the climate system by transporting materials, such as carbon, deep into the ocean. The amount of this transport is influenced by the net sinking speed of the particles and the amount of material attached to them, both of which are determined by the size spectrum of the particles. The spectrum is shaped by aggregation and disaggregation processes, which are typically most active in the ocean surface boundary layer (OSBL), where intense turbulent flows can enhance both particle collision (aggregation) and particle fragmentation (disaggregation). This study aims to reveal the mechanism by which turbulence transforms the size spectrum through these competing processes and to determine whether turbulence alters the downward material transport from the OSBL. To achieve this, we performed large-eddy simulations to reproduce wind- and wave-induced turbulent flows, employing a Lagrangian particle model to track passive particles in the flow and simulate their aggregation and disaggregation. The model tracked groups of particles rather than individual ones. The results revealed that the shape of the simulated size spectrum was characterized by two length scales, the compensation radius (characterizing the particle floatability) and the Kolmogorov scale, which define the shear range where the turbulent shear shapes the spectrum, the sinking range where the gravitational sinking of particles shapes the spectrum, and the transition range between them. The findings revealed that turbulence tends to increase the terminal velocity and decrease the specific surface area of sinking particles when turbulent aggregation dominates over disaggregation, and vice versa. Although these results may be influenced by uncertain parameterizations (e.g., disaggregation parameterization), the study demonstrates the effectiveness of the numerical approach in investigating the fundamental processes governing particle sinking in turbulent flows.
1 Introduction
Biogenic particles in the ocean, such as phytoplankton, transport and sink with various materials contained in their bodies and/or attached to their body surfaces into the ocean. For example, phytoplankton utilizes the carbon dioxide from the surrounding water in the euphotic zone, and upon dying, transports the carbon deep into the ocean as it sinks. This process, called the biological pump, plays a vital role in the global carbon cycle, contributing to approximately one-fourth of annual anthropogenic carbon emissions from the atmosphere to the deep ocean (Gruber et al., 2019). In addition, these particles transport various metal ions on their surfaces, particularly
The characteristics of sinking biogenic particles and their material transport are governed by several biological, chemical, and physical factors. The processes controlling these biological, chemical and physical factors are complicated and are not fully understood. To clarify these complicated processes, this study focuses on the kinematics of particle sinking and investigates the physical processes involved. By assuming that sinking particles are small (i.e., non-inertial) spheres with constant density, their vertical velocity
As
where
In general, the size spectrum is often approximated using an exponential function (Sheldon et al., 1972; Kostadinov et al., 2009),
This approximation facilitates analytical investigations into the spectral shape (spectral slope
Numerical simulations are valuable tools for investigating aggregation and disaggregation processes in the OSBL. One such approach uses a spectral model (Gelbard et al., 1980) that numerically solves the Smoluchowski equation, a temporal evolution equation for the size spectrum (Smoluchowski, 1918; Spielman, 1985). Previous studies (Li et al., 2004; Burd and Jackson, 2002) have applied this approach, incorporating disaggregation into the original Smoluchowski equation, and examined variations in spectral shape under realistic conditions. However, this model is essentially zero-dimensional, limiting its ability to capture turbulent-induced variations with homogeneous statistics. To extend the discussion to the actual OSBL, where turbulence statistics vary mostly in the vertical direction, Jackson (1990) and Jouandet et al. (2014) applied a stacked-layer approach, dividing the OSBL into several thin homogeneous layers and applied the spectral model to each layer. Nevertheless, this approach requires turbulence statistics to be defined a priori.
Another approach simulates both the turbulent flows and the Lagrangian motions of sinking particles within the flow. By simulating a sufficiently large number of particles and appropriately modeling particle aggregation and disaggregation processes, the evolution of the size spectrum can be estimated without the need to specify the turbulent statistics beforehand. Recently, this method has been adopted to simulate cloud droplet evolution in the atmosphere: Riechelmann et al. (2012) used the Lagrangian-cloud model (LCM) to trace groups of particles in a Lagrangian framework, where their radii were altered by parameterized aggregation processes. This approach is advantageous because it allows spatial and temporal variability in turbulence to be more accurately considered.
To better quantify the effects of turbulence in the OSBL on vertical material transport, this study numerically simulated the transformation of size spectra for sinking particles in the OSBL. In particular, we employed large-eddy simulations (LES) to compute the flow and adopted an LCM to model particulate processes. We simulated the sinking of particles in wind- or wave-induced turbulent flows in an unstratified turbulent mixing layer above a calm layer, with or without stratification, to investigate the influence of mixing-layer turbulence on the particle size spectrum. The procedures and configurations of these numerical experiments are described in Section 2. The simulation results are presented in Section 3. The effects of the turbulence intensity, initial particle radius, and the vertical structure of the turbulent flow on particle spectrum were investigated, with a specific focus on the shapes of the simulated particle size spectra (Section 3.1) and the amount of material transport (Section 3.2). Finally, concluding remarks and the implications for material transport in the actual OSBL are summarized in Section 4.
2 Methods
We considered a laterally periodic cubic ocean with dimension
2.1 Flow model: LES
This study used the same LES settings as that used in Ushijima and Yoshikawa (2019), except for the wave forcing and boundary/initial conditions described later. The governing equations included the momentum equation, the continuity equation, and the advection-diffusion equation of temperature under incompressible, Boussinesq, and
The Cartesian coordinates
In certain experiments, the vortex force (Craik and Leibovich, 1976) representing the rectified effects of vortex tilting, stretching, and shrinking by surface waves (Fujiwara et al., 2018) was added to the momentum equations to evaluate the effects of turbulence caused by the Langmuir circulations (Langmuir turbulence). The force
where
where
where
At the top surface of the model domain, we imposed momentum flux and subgrid-scale kinetic energy flux induced by wave breaking through the friction velocity
where
where
The model domain was segmented equally into
2.2 Particle model: LCM
The LCM, employed as the particle model in this study, was initially developed to investigate microscale cloud physics (Shima et al., 2009; Andrejczuk et al., 2010; Riechelmann et al., 2012; Oh and Noh, 2022) and was recently applied in oceanic contexts (Matsumura and Ohshima, 2015; Noh et al., 2021).
Conventional Lagrange-type particle model tracks the movement of each particle in a three-dimensional flow field while considering characteristics such as particle radius, density, and/or stickiness. Nonetheless, tracking all particles in the OSBL is computationally prohibitive, as a unit volume of water may contain up to
Assuming a sphere shape for the particles, the particle radius
Hereinafter, “small/large parcel” refers to parcels containing small-/large-sized particles.
2.2.1 Advection and sinking
Assuming that the particles in the parcels have sufficiently small radii and excess densities, their inertia can be neglected, and their motion can be approximated as a linear combination of advection and sinking (Monroy et al., 2017). This assumption holds for the particles in the current experiments, as their inertial response time (
where the terminal velocity
In this calculation, the kinematic viscosity of water was set to
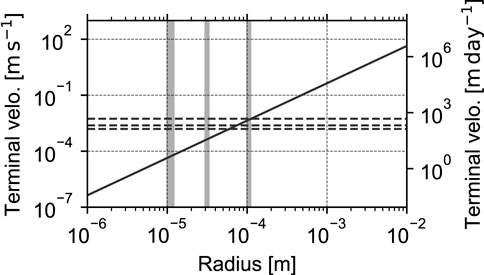
Figure 1. The terminal velocity of the particle used in the current simulations as a function of the particle radius (Equation 7). The gray-shaded areas correspond to the radius ranges of the initial particles in the S, M, and L experiments from left to the right, respectively. Horizontal-dashed lines indicate the root mean square of the vertical velocities of the simulated turbulence calculated over the entire domain in the experiment with
2.2.2 Aggregation
The aggregation procedure used in this study primarily followed the approach outlined in Riechelmann et al. (2012). In this method, aggregation was represented by changes in parcel characteristics (
where the superscripts “old/new” represent the states before and after aggregation, respectively, and
The exchanged volume
where
We found that Equation 8 becomes numerically unstable under conditions of intensive aggregation involving a substantial number of particles. To prevent this instability, we slightly modified the evaluation method. Note that
Assuming
Based on this solution, the exchanged volume
We used Equation 9 in place of Equation 8, as this finite difference form is numerically more stable. Since the particle number
The coagulation kernel
where
where the absolute bracket
To effectively identify pairs of parcels for aggregation, we followed the approach developed by Matsumura and Ohshima (2015), where two parcels were assumed to aggregate if they were located within the same parcel grid box. Aggregation of more than two parcels is implicitly represented through sequential aggregation between all possible pairs of parcels within a single time step. Herein, we considered a cubic parcel grid box with a dimension of
2.2.3 Disaggregation
The disaggregation process was modeled based on an empirical relationship between the radius of sinking particles and the Kolmogorov scale. Previous studies conducted in a laboratory tank and in the actual OSBL (e.g., Akers et al., 1987; Fugate and Friedrichs, 2003; Braithwaite et al., 2012; Takeuchi et al., 2019) reported that the average or maximum radius of sinking particles is linearly related to the Kolmogorov scale. Accordingly, we assumed that particle would disintegrate into smaller particles if the radius
This modeling assumption might be strong but we believe it is one of reasonable assumptions. Note that Equation 14 represents the conservation of the total volume of particles in a parcel
where the kinetic energy dissipation rate,
2.2.4 Numerical configurations
Parcels were continuously released at the top surface of the model domain with randomly assigned horizontal positions. By controlling the particle number in each released parcel
The second-order Runge–Kutta scheme was used to integrate the parcel’s motion equation (Equation 10). For numerical convenience, the integration time interval was set to the same value as that of the flow field integration. To ensure the accuracy of particle position calculations, a Courant-Friedrichs-Lewy (CFL) condition was applied: parcels moving distances exceeding half the flow grid spacing over
2.3 Experimental cases
The first set of experiments was conducted using various paired values of wind speed (U10 = 9, 18, 37 m s−1) and initial particle radius
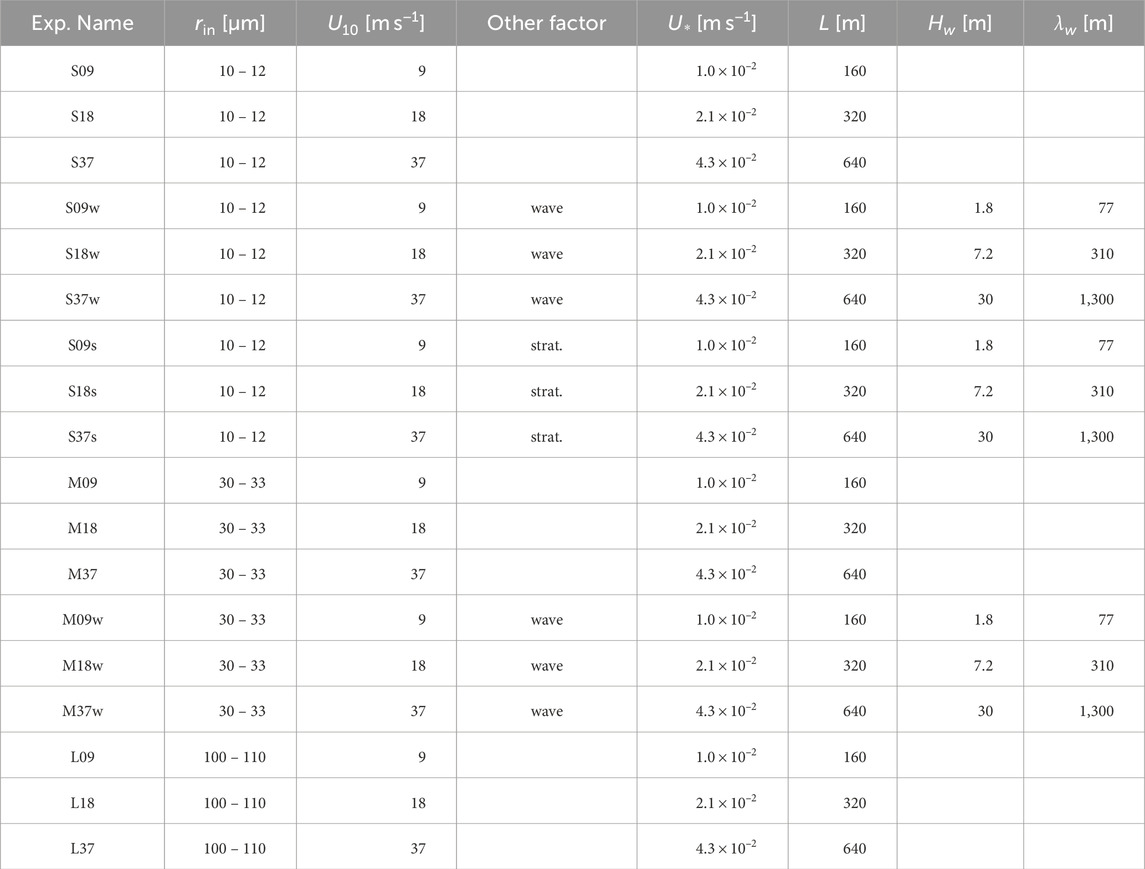
Table 1. Parameters set in experiments. “strat.” is short for “stratification.” Parameters on the right is determined from
Initially, the water was at rest and contained no parcel. Water temperature was uniform (20°C) except in the stratification experiments, where the initial temperature profiles are described in Section 3.1.3. To generate turbulence, small random perturbations were introduced into vertical component of the momentum equation. Time integrations were performed over 13 inertial periods
3 Results
3.1 Particulate processes and spectral shapes in turbulent flows
3.1.1 Wind-induced turbulence case
The simulated vertical velocity field of the turbulent flow at
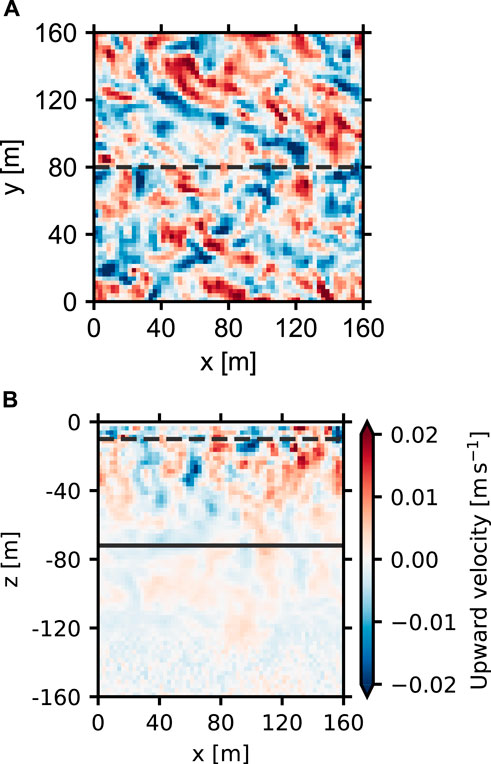
Figure 2. Snapshots of the simulated vertical velocity field of the turbulent flow in the S09 experiment: (A) Horizontal (z = −10 m) and (B) vertical (
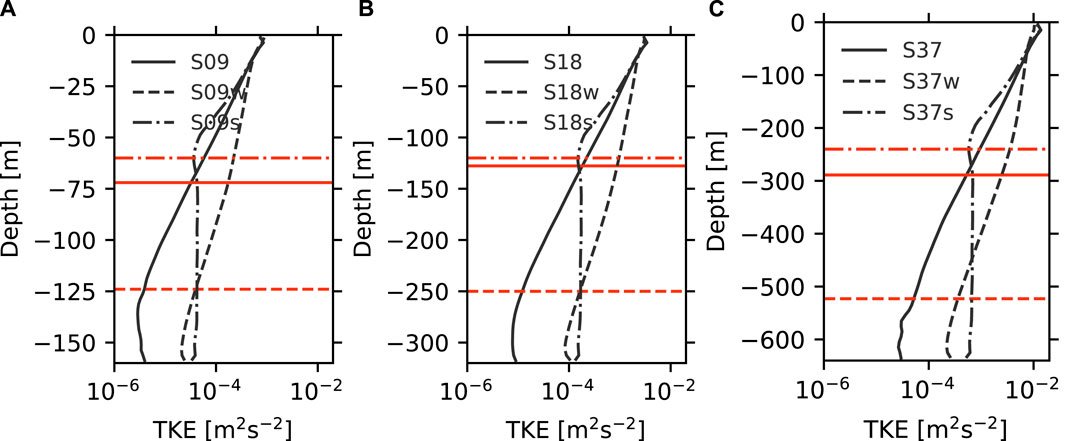
Figure 3. Vertical profiles of horizontally averaged TKE in steady-states in the S experiments (solid), the Sw experiments (dashed), and the Ss experiments (dash dotted) with the wind speeds of (A) 9 m s−1, (B) 18 m s−1, and (C) 37 m s−1. Red horizontal lines denote the MLD in each experiment.
The simulated parcel distribution in the S09 experiment is presented in Figure 4. Upon entering the model domain from the top surface, the small parcels sank under the influence of gravity and were advected by the surrounding turbulence, interacting (aggregating) with each other. In this experiment, the parcels rarely disaggregated. As the depth increased, the radius of the parcels increased, while the number of sinking parcels decreased. The time series of the particle number density (number of particles per unit water volume) and the particle volume density (volume of particles per unit water volume) in this experiment are illustrated in Figure 5. Both densities increased linearly at first due to the continuous input of particles at the top surface but later began to decrease
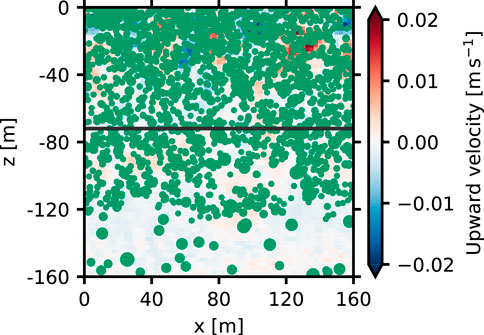
Figure 4. A snapshot of the sinking parcels (green circles) in the S09 experiment. The size of the circle is proportional to the particle radius. Background colors are the same as those in Figure 2B, and the black-solid horizontal line denotes the MLD in this experiment.
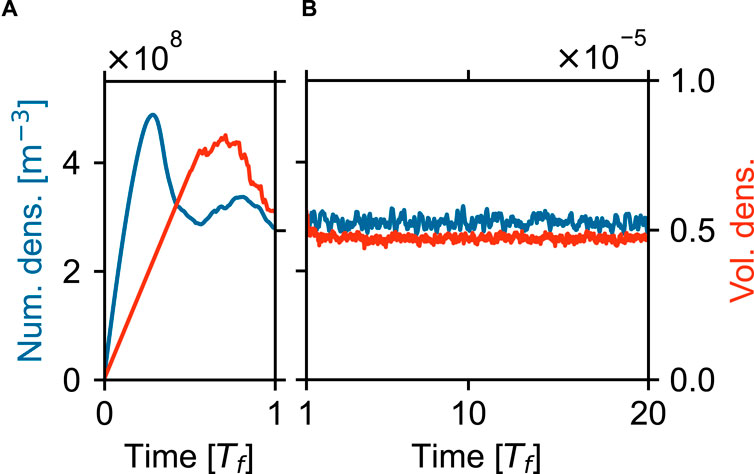
Figure 5. The time series of particle number density (blue line, vertical axis on the left) and particle volume density (red line, vertical axis on the right) in the S09 experiment during (A)
The steady-state size spectra are illustrated in Figure 6, including the S (Figure 6A) and L (Figure 6B) experiments for
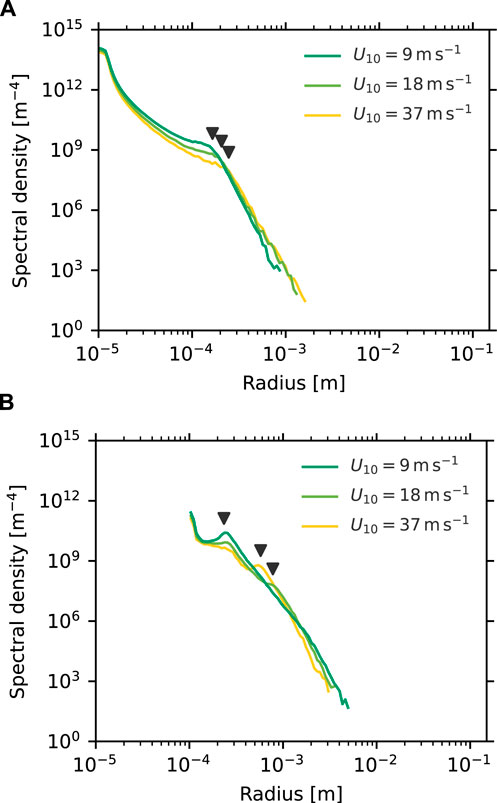
Figure 6. The steady-state size spectra averaged over the whole domains in (A) S and (B) L experiments. Black triangles indicate
To better understand the variations in spectral shape caused by turbulence, the model domain was divided into seven horizontal layers, and the size spectra in each layer were examined. The spectra from the S09 experiment are presented in Figure 7. The spectral shape in the uppermost layer (Figure 7B) was similar to the one averaged across the entire domain (Figure 6A), but, as shown in Figure 7A, it differed evidently in the deeper layers. At
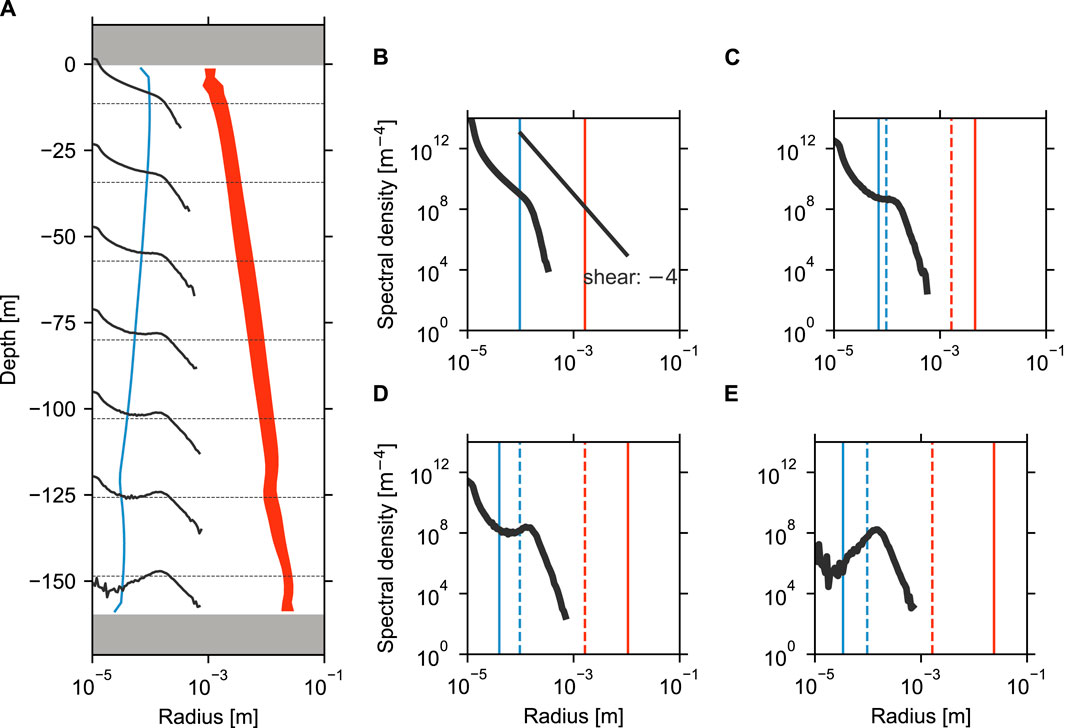
Figure 7. (A) Steady-state size spectra in seven horizontal layers (black lines) and vertical profiles of the compensation radius (blue line) and the Kolmogorov scale (red shading represents the horizontal mean
To explain these vertical changes in the spectrum and clarify the dominant particulate processes responsible for the variations, we introduced a length scale,
where
The compensation radius at each layer is also plotted in Figure 7. The two nearly straight lines forming the spectrum in the shallowest layer intersected around the compensation radius in this layer
In the deeper layers, weaker turbulence reduced the compensation radius although the spectral slopes in the shear range
The Kolmogorov scale, another important length scale, is also displayed in Figure 7. This scale is important for particle disaggregation, as particles are assumed to disintegrate at this scale in our model. The Kolmogorov scale was smaller in the shallower layers due to more energetic turbulence in those regions, and it increased monotonically with depth. In the S09 experiment, the smallest Kolmogorov scale was about 1
The results of the S37 experiment are presented in Figure 8. Although the overall spectral shapes—shear, sinking, transition ranges, and their slopes—were nearly identical to those in the S09 experiment, the stronger turbulence in the S37 experiment, due to higher wind speeds, increased the compensation radius
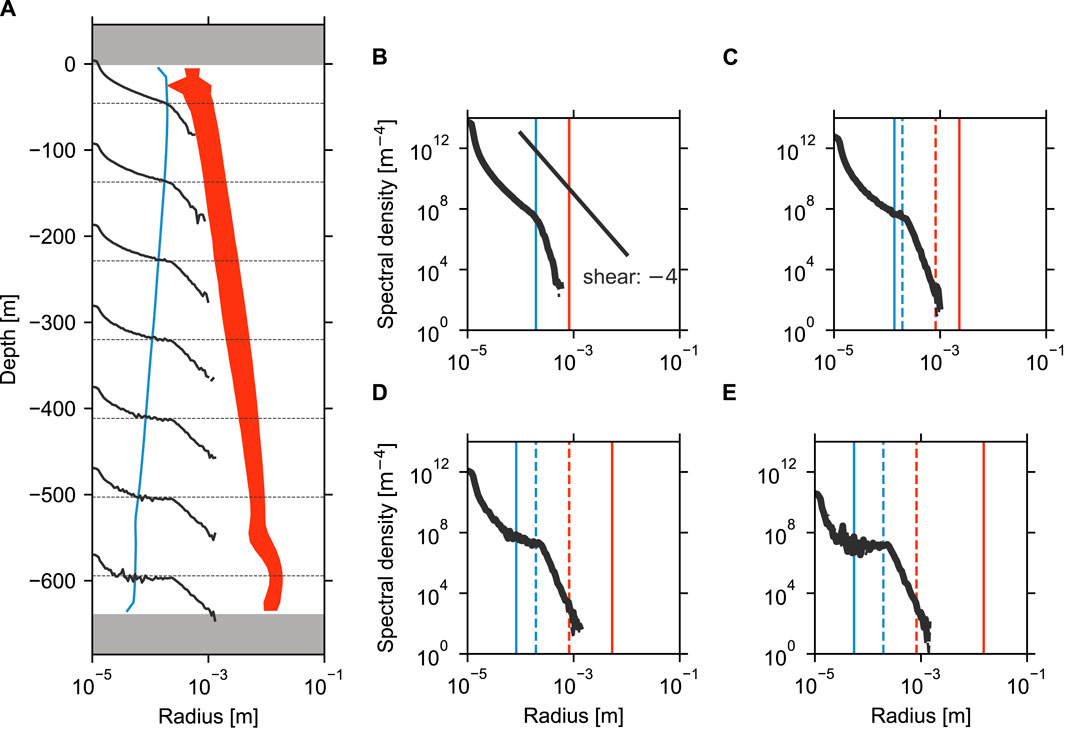
Figure 8. Similar to Figure 7 but for the S37 experiment.
In contrast, the particulate processes and resulting spectral shapes varied significantly in experiments with large initial particles. The spectra from the L37 experiment are visualized in Figure 9. In this experiment, the initial particle radius was close to the compensation radius in the shallowest layer
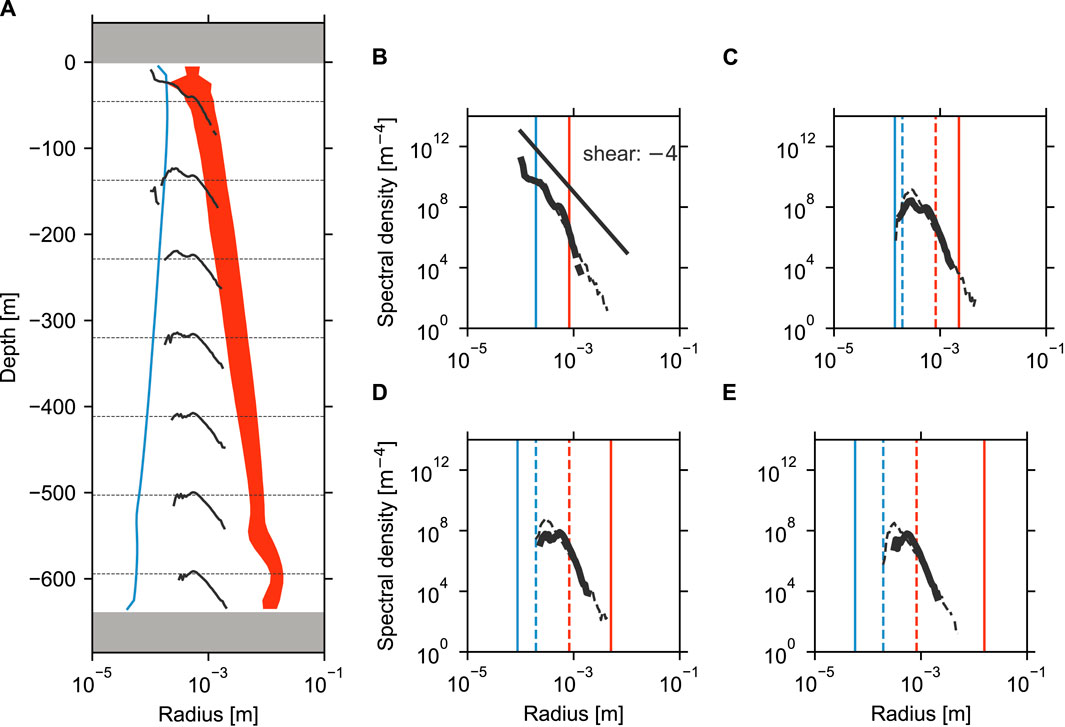
Figure 9. Similar to Figure 7 but for the L37 experiment.
3.1.2 Wave-induced turbulence case
The wind-induced turbulence discussed above is local and decays relatively quickly with depth. In contrast, convective and wave-induced turbulence, such as Langmuir turbulence, is non-local and penetrates to greater depths than wind-induced turbulence. Thus, the Kolmogorov scales associated with these types of turbulence are expected to be smaller in deeper layers and thus more likely to influence the spectral shapes. To examine the effects of such non-local turbulence, this subsection discusses the results of the experiments with wave forces (vortex forcing) that induce turbulence owing to Langmuir circulation—a secondary circulation generated by the interaction between wave- and wind-driven turbulence.
The vertical profiles of horizontally averaged TKE in the wave experiments are shown in Figure 3. As observed, the TKE near the top surface in the wave experiments was almost identical to that in the corresponding wind experiments, but the wave forces in the wave experiments caused the turbulence to penetrate to greater depths. As a consequence, the MLDs in the wave experiments were greater than in the wind experiments.
By normalizing the vertical coordinates by the ML thickness
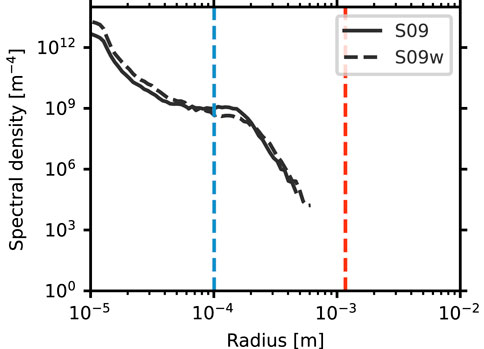
Figure 10. Steady-state size spectra at
3.1.3 Effects of pre-existing stratification
The ocean is typically stratified at low- and mid-latitudes beneath the surface ML. Pre-existing stratification makes the MLD shallower compared to that in the unstratified regions. The shorter residence time of sinking particles in the thinner ML may alter the turbulent effects on particulate processes discussed earlier. Stratification also induces the formation of a transition layer beneath the ML, where large vertical shear in the horizontal flow generates shear-driven turbulence (Johnston and Rudnick, 2009). This turbulence at the ML base may further modify the effects of turbulence on particle processes. To explore these effects and the resulting spectral shapes of sinking particles, we conducted additional stratification experiments, where the model ocean was stratified below the ML. The stratification intensity below the ML was set to
The vertical profiles of horizontally averaged TKE in the stratification experiments are displayed in Figure 3. Wind forcing at the top surface generated turbulence as intense as the wind experiments, but the pre-existing stratification limited its penetration to greater depths. The MLDs (defined as corresponding to the depths of maximum stratification) in the stratification experiments were shallower than those in the wind experiments. Below this depth, the decaying turbulence appeared more vertically homogeneous compared to the other two groups of experiments. This vertical distribution clearly indicates a two-layer flow field: a top turbulent ML and a subsequent calm layer.
The vertical transformation of the steady-state size spectrum in the S09s experiment is illustrated in Figure 11A. Similar to the S09 experiment (Figure 7A), intense turbulence scattered small particles throughout the ML. The shear, transition, and sinking ranges were also present in the ML (about
Figure 11B displays the size spectra at the MLD
3.2 Material transports by particles sinking in turbulent flows
In this subsection, we examined the effects of turbulence on material transport by particles sinking from the surface ML. As shown in Equation 1, the downward flux
where
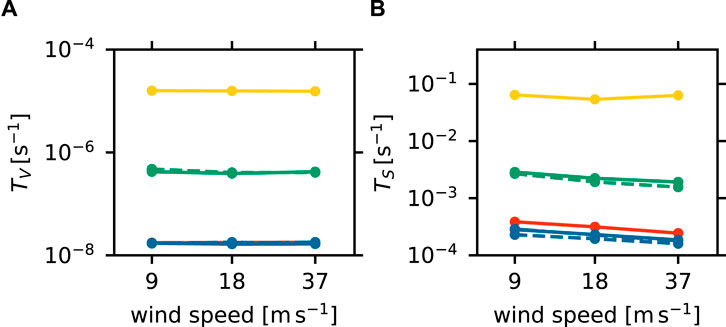
Figure 12. Wind speed dependencies of (A)
Here, we investigated the surface flux
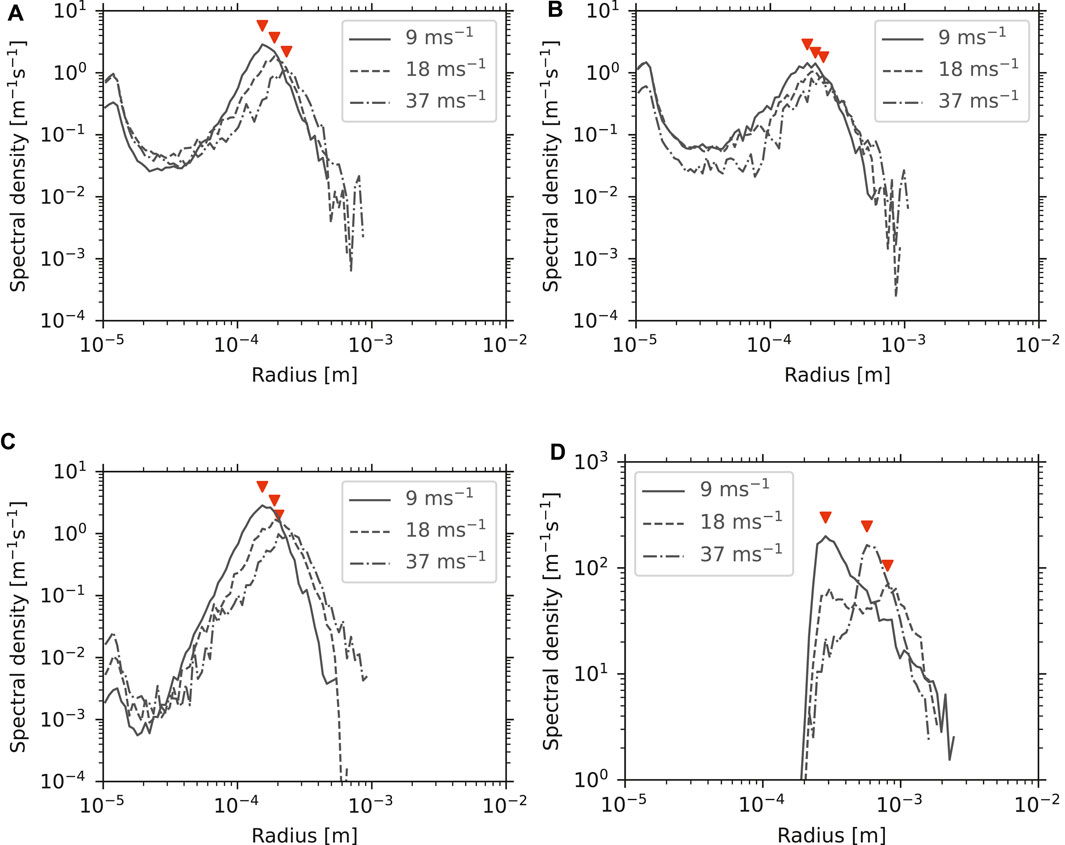
Figure 13. The size spectra weighted by the surface area and the terminal velocity (the integrand of Equation 16) in (A) the S experiments, (B) the Sw experiments, (C) the Ss experiments and (D) the L experiments. Red triangles denote spectral peaks at larger radius than 10–4 m.
The surface area flux in the Sw experiments (dashed blue line) and Ss experiments (dash-dotted blue line) were approximately the same as in the S experiments. The slight decreases in the Sw experiments were due to larger spectral densities in the shear region (Section 3.1.2). The weighted spectra’s shapes—bimodal and the peak shifts—were also similar to those in the S experiments, except for the more unimodal shapes in the Ss experiments, caused by the suppressed advection of smaller particles from the top boundary due to stratification.
In the L experiments (yellow line), turbulence enhanced aggregation at lower wind speeds but caused disaggregation at higher wind speeds. In the weighted spectra (Figure 13D), the peak radius decreased from 1
4 Conclusions and discussion
This study examined the transformations of the size spectrum of sinking particles under turbulent flows in the OSBL and investigated their impact on material transport through numerical simulations. Turbulence generated by winds and waves (Langmuir circulations) was simulated through LES, while particle motions and aggregation/disaggregation processes in the temporally and spatially varying turbulent flow fields were modeled with the LCM. Initially developed for atmospheric cloud particles (Riechelmann et al., 2012), the LCM was adapted in this study to simulate oceanic biogenic particles. Aggregation was parameterized with coagulation kernels (Burd and Jackson, 2009), while disaggregation was modeled based on the Kolmogorov scale according to recent observations (e.g., Takeuchi et al., 2019).
The results revealed that the simulated size spectrum in the OSBL was characterized by two key length scales: the compensation radius
The influence of turbulence on material transport was assessed through the surface area flux of particles. Turbulence generally caused particles to grow in size and sink more rapidly but reduced the specific surface area when aggregation was more prominent than disaggregation, and vice versa. Overall, when aggregation dominated, turbulence reduced the downward surface area flux of particles.
Key factors shaping the particle size spectrum included the initial radius, the intensity of turbulent flow (i.e., the compensation radius), and the turbulent kinetic energy dissipation rate (i.e., the Kolmogorov scale). The particle number density, which determines the aggregation frequency, was another important factor, although it was not controlled in these experiments. Figure 14 provides an illustration of the parameters in our numerical experiments and the parameters in the actual OSBL in typical open-ocean environments. Phytoplankton sizes in the OSBL range widely with respect to seas and species from pico-phytoplankton (
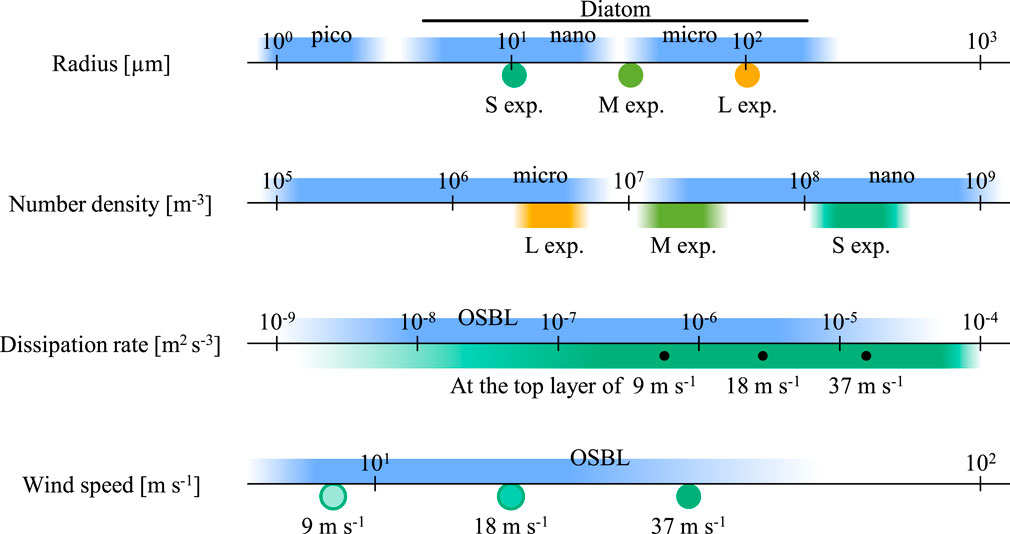
Figure 14. Parameters affecting particle sinking in current numerical simulations and in the actual OSBL.
Nonetheless, the current model stands on several assumptions, simplifications, and parameterizations that may limit its ability to quantitatively compare its results with those observed in the real ocean. For example, the fractal dimension (related to the structure or porosity of particle aggregates) and the particle density influence sinking behavior, particularly the sinking speed. A more realistic (smaller) stickiness would likely result in a slower particle growth rate, leading to a higher concentration of smaller particles in and below the ML. This would likely decrease the average radius of sinking particles exiting the ML, but the presence of numerous smaller particles could ultimately produce larger particles by extending their residence time in the ML. Therefore, the net effect of these physical parameters remains uncertain, and future studies will need to compare results from various perspectives to fully understand these dynamics. Moreover, phytoplankton in the real ocean have ability to move actively by changing their buoyancy (Qiu et al., 2022; Mashayekhpour et al., 2019; Marchioli et al., 2019). This factor might cause the spatial distribution of sinking phytoplankton in the real ocean differ from that in our numerical experiments. Among the uncertainties, we consider the disaggregation parameterization to be the least reliable. While we modeled disaggregation based on observations that the largest particle size corresponds to the local Kolmogorov scale (Equation 13), other numerical studies have used alternative models grounded in mechanical principles. Babler et al. (2015) and Marchioli and Soldati (2015) tracked individual particles in turbulence fields reproduced by direct numerical simulations, and in their models, particles disaggregated when the turbulent shear stress at their locations exceeded a critical threshold. In such models, the breakup rate is linked to the kinetic energy dissipation rate. Additionally, there are different approaches in modeling the size distribution of the daughter particles other than our approach (setting the daughter particle size to the Kolmogorov scale η). Burd and Jackson (2002) modeled the disaggregation by redistributing the parent particle mass uniformly across smaller particle bins, which resulted in selective mass accumulation in a specific size bin and a bimodal spectrum in the steady state. Li et al. (2004), on the other hand, modeled disaggregation as the disintegration of a parent particle into two daughter particles of equal size, which led to a steep spectral slope beyond a certain radius. The spectral shape, and potentially the vertical fluxes in the current experiments, will vary with the adoption of these disaggregation models. Further research into disaggregation processes is necessary to better quantify the impact of turbulence on material transport. Nevertheless, we believe that the current approach (LES + LCM) provides a powerful tool for understanding the fundamental processes governing particle sinking in turbulent flows. This study represents an initial step toward quantifying the particle-sinking processes and the related material transport in the OSBL, which should be further improved in future research.
Data availability statement
The raw data supporting the conclusions of this article will be made available by the authors, without undue reservation.
Author contributions
KN: Conceptualization, Funding acquisition, Investigation, Methodology, Resources, Validation, Visualization, Writing–original draft, Writing–review and editing. YY: Conceptualization, Funding acquisition, Methodology, Project administration, Supervision, Validation, Writing–original draft, Writing–review and editing.
Funding
The authors declare that financial supports were received for the research, authorship, and/or publication of this article. This work was partially supported by the Environmental Radioactivity Network Center, Japan (Grant no. Y-23-27, Y-24-18 to KN), and by the Japan Society for the Promotion of Science, KAKENHI (Grant no. 21H05305 to YY).
Acknowledgments
We are sincere grateful to Yoshimasa Matsumura for his technical comments on the developed particle tracking method and Hidekatsu Yamazaki for his advice on the current disaggregation modeling. We appreciate the insightful discussions with Kazunori Akitomo and Masanori Konda on the direction of this study.
Conflict of interest
The authors declare that the research was conducted in the absence of any commercial or financial relationships that could be construed as a potential conflict of interest.
Publisher’s note
All claims expressed in this article are solely those of the authors and do not necessarily represent those of their affiliated organizations, or those of the publisher, the editors and the reviewers. Any product that may be evaluated in this article, or claim that may be made by its manufacturer, is not guaranteed or endorsed by the publisher.
References
Akers, R. J., Rushton, A. G., and Stenhouse, J. I. T. (1987). Floc breakage: the dynamic response of the particle size distribution in a flocculated suspension to a step change in turbulent energy dissipation. Chem. Eng. Sci. 42, 787–798. doi:10.1016/0009-2509(87)80038-6
Alldredge, A. L., and Gotschalk, C. (1988). In situ settling behavior of marine snow. Limnol. Oceanogr. 33, 339–351. doi:10.4319/lo.1988.33.3.0339
Andrejczuk, M., Grabowski, W. W., Reisner, J., and Gadian, A. (2010). Cloud-aerosol interactions for boundary layer stratocumulus in the Lagrangian Cloud Model. J. Geophys. Res. Atmos. 115. doi:10.1029/2010JD014248
Ayala, O., Rosa, B., and Wang, L.-P. (2008). Effects of turbulence on the geometric collision rate of sedimenting droplets. Part 2. Theory and parameterization. New J. Phys. 10, 075016. doi:10.1088/1367-2630/10/7/075016
Babler, M. U., Biferale, L., Brandt, L., Feudel, U., Guseva, K., Lanotte, A. S., et al. (2015). Numerical simulations of aggregate breakup in bounded and unbounded turbulent flows. J. Fluid Mech. 766, 104–128. doi:10.1017/jfm.2015.13
Braithwaite, K. M., Bowers, D. G., Nimmo Smith, W. a. M., and Graham, G. W. (2012). Controls on floc growth in an energetic tidal channel. J. Geophys. Res. Oceans 117. doi:10.1029/2011JC007094
Buesseler, K. O., Antia, A. N., Chen, M., Fowler, S. W., Gardner, W. D., Gustafsson, O., et al. (2007). An assessment of the use of sediment traps for estimating upper ocean particle fluxes. J. Mar. Res. 65, 345–416. doi:10.1357/002224007781567621
Burd, A. B., and Jackson, G. A. (2002). Modeling steady-state particle size spectra. Environ. Sci. and Technol. 36, 323–327. doi:10.1021/es010982n
Burd, A. B., and Jackson, G. A. (2009). Particle aggregation. Annu. Rev. Mar. Sci. 1, 65–90. doi:10.1146/annurev.marine.010908.163904
Cael, B. B., and White, A. E. (2020). Sinking versus suspended particle size distributions in the north pacific subtropical gyre. Geophys. Res. Lett. 47, e2020GL087825. doi:10.1029/2020GL087825
Craig, P. D., and Banner, M. L. (1994). Modeling wave-enhanced turbulence in the ocean surface layer. J. Phys. Oceanogr. 24, 2546–2559. doi:10.1175/1520-0485(1994)024⟨2546:MWETIT⟩2.0.CO;2
Craik, A. D. D., and Leibovich, S. (1976). A rational model for Langmuir circulations. J. Fluid Mech. 73, 401–426. doi:10.1017/S0022112076001420
Deardorff, J. W. (1980). Stratocumulus-capped mixed layers derived from a three-dimensional model. Boundary-Layer Meteorol. 18, 495–527. doi:10.1007/BF00119502
Dyer, K. R. (1989). Sediment processes in estuaries: future research requirements. J. Geophys. Res. Oceans 94, 14327–14339. doi:10.1029/JC094iC10p14327
Finkel, Z. V., Beardall, J., Flynn, K. J., Quigg, A., Rees, T. A. V., and Raven, J. A. (2010). Phytoplankton in a changing world: cell size and elemental stoichiometry. J. Plankton Res. 32, 119–137. doi:10.1093/plankt/fbp098
Fugate, D. C., and Friedrichs, C. T. (2003). Controls on suspended aggregate size in partially mixed estuaries. Estuar. Coast. Shelf Sci. 58, 389–404. doi:10.1016/S0272-7714(03)00107-0
Fujiwara, Y., Yoshikawa, Y., and Matsumura, Y. (2018). A wave-resolving simulation of Langmuir circulations with a nonhydrostatic free-surface model: comparison with craik–leibovich theory and an alternative eulerian view of the driving mechanism. J. Phys. Oceanogr. 48, 1691–1708. doi:10.1175/JPO-D-17-0199.1
Gelbard, F., Tambour, Y., and Seinfeld, J. H. (1980). Sectional representations for simulating aerosol dynamics. J. Colloid Interface Sci. 76, 541–556. doi:10.1016/0021-9797(80)90394-X
Gruber, N., Landschützer, P., and Lovenduski, N. S. (2019). The variable southern ocean carbon sink. Annu. Rev. Mar. Sci. 11, 159–186. doi:10.1146/annurev-marine-121916-063407
Haller, G., and Sapsis, T. (2008). Where do inertial particles go in fluid flows? Phys. D. Nonlinear Phenom. 237, 573–583. doi:10.1016/j.physd.2007.09.027
Jackson, G. A. (1990). A model of the formation of marine algal flocs by physical coagulation processes. Deep Sea Res. Part A. Oceanogr. Res. Pap. 37, 1197–1211. doi:10.1016/0198-0149(90)90038-W
Jackson, G. A., Logan, B. E., Alldredge, A. L., and Dam, H. G. (1995). Combining particle size spectra from a mesocosm experiment measured using photographic and aperture impedance (Coulter and Elzone) techniques. Deep Sea Res. Part II Top. Stud. Oceanogr. 42, 139–157. doi:10.1016/0967-0645(95)00009-F
Johnston, T. M. S., and Rudnick, D. L. (2009). Observations of the transition layer. J. Phys. Oceanogr. 39, 780–797. doi:10.1175/2008JPO3824.1
Jouandet, M.-P., Jackson, G. A., Carlotti, F., Picheral, M., Stemmann, L., and Blain, S. (2014). Rapid formation of large aggregates during the spring bloom of Kerguelen Island: observations and model comparisons. Biogeosciences 11, 4393–4406. doi:10.5194/bg-11-4393-2014
Kostadinov, T. S., Siegel, D. A., and Maritorena, S. (2009). Retrieval of the particle size distribution from satellite ocean color observations. J. Geophys. Res. Oceans 114. doi:10.1029/2009JC005303
Lam, P. J., Bishop, J. K. B., Henning, C. C., Marcus, M. A., Waychunas, G. A., and Fung, I. Y. (2006). Wintertime phytoplankton bloom in the subarctic Pacific supported by continental margin iron. Glob. Biogeochem. Cycles 20. doi:10.1029/2005GB002557
Li, X.-y., Zhang, J.-j., and Lee, J. H. W. (2004). Modelling particle size distribution dynamics in marine waters. Water Res. 38, 1305–1317. doi:10.1016/j.watres.2003.11.010
Marchioli, C., and Soldati, A. (2015). Turbulent breakage of ductile aggregates. Phys. Rev. E 91, 053003. doi:10.1103/PhysRevE.91.053003
Marchioli, C., Bhatia, H., Sardina, G., Brandt, L., and Soldati, A. (2019). Role of large-scale advection and small-scale turbulence on vertical migration of gyrotactic swimmers. Phys. Rev. Fluids. 4, 124304. doi:10.1103/PhysRevFluids.4.124304
Mashayekhpour, M., Marchioli, C., Lovecchio, S., Lay, E. N., and Soldati, A. (2019). Wind effect on gyrotactic micro-organism surfacing in free-surface turbulence. Advan. Water. Resou. 129(0309-1708), 328–337. doi:10.1016/j.advwatres.2017.09.001
Matsumura, Y., and Ohshima, K. I. (2015). Lagrangian modelling of frazil ice in the ocean. Ann. Glaciol. 56, 373–382. doi:10.3189/2015AoG69A657
McCave, I. N. (1984). Size spectra and aggregation of suspended particles in the deep ocean. Deep Sea Res. Part A. Oceanogr. Res. Pap. 31, 329–352. doi:10.1016/0198-0149(84)90088-8
Misumi, K., Nishioka, J., Obata, H., Tsumune, D., Tsubono, T., Long, M. C., et al. (2021). Slowly sinking particles underlie dissolved iron transport across the pacific ocean. Glob. Biogeochem. Cycles 35, e2020GB006823. doi:10.1029/2020GB006823
Monroy, P., Hernández-García, E., Rossi, V., and López, C. (2017). Modeling the dynamical sinking of biogenic particles in oceanic flow. Nonlinear Process. Geophys. 24, 293–305. doi:10.5194/npg-24-293-2017
Noh, K. M., Noh, Y., Brereton, A., and Kug, J.-S. (2021). The route to spring phytoplankton blooms simulated by a Lagrangian plankton model. J. Geophys. Res. Oceans 126, e2020JC016753. doi:10.1029/2020JC016753
Oh, D., and Noh, Y. (2022). Roles of drop size distribution and turbulence in autoconversion based on Lagrangian cloud model simulations. J. Geophys. Res. Atmos. 127, e2022JD036495. doi:10.1029/2022JD036495
Pierson, W. J., and Moskowitz, L. (1964). A proposed spectral form for fully developed wind seas based on the similarity theory of S. A. Kitaigorodskii. J. Geophys. Res. (1896-1977) 69, 5181–5190. doi:10.1029/JZ069i024p05181
Pollard, R. T., Rhines, P. B., and Thompson, R. O. R. Y. (1973). The deepening of the wind-Mixed layer. Geophys. Fluid Dyn. 4, 381–404. doi:10.1080/03091927208236105
Qiu, J., Marchioli, C., and Zhao, L. (2022). A review on gyrotactic swimmers in turbulent flows. Acta Mech. Sin. 38, 722323. doi:10.1007/s10409-022-22323-x
Riechelmann, T., Noh, Y., and Raasch, S. (2012). A new method for large-eddy simulations of clouds with Lagrangian droplets including the effects of turbulent collision. New J. Phys. 14, 065008. doi:10.1088/1367-2630/14/6/065008
Saffman, P. G., and Turner, J. S. (1956). On the collision of drops in turbulent clouds. J. Fluid Mech. 1, 16–30. doi:10.1017/S0022112056000020
Sheldon, R. W., Prakash, A., and Sutcliffe, W. H. (1972). The size distribution of particles in the ocean1. Limnol. Oceanogr. 17, 327–340. doi:10.4319/lo.1972.17.3.0327
Shima, S., Kusano, K., Kawano, A., Sugiyama, T., and Kawahara, S. (2009). The super-droplet method for the numerical simulation of clouds and precipitation: a particle-based and probabilistic microphysics model coupled with a non-hydrostatic model. Q. J. R. Meteorological Soc. 135, 1307–1320. doi:10.1002/qj.441
Sieburth, J. M., Smetacek, V., and Lenz, J. (1978). Pelagic ecosystem structure: heterotrophic compartments of the plankton and their relationship to plankton size fractions 1. Limnol. Oceanogr. 23, 1256–1263. doi:10.4319/lo.1978.23.6.1256
Smoluchowski, M. (1918). Versuch einer mathematischen Theorie der Koagulationskinetik kolloider Lösungen. Z. für Phys. Chem. 92U, 129–168. doi:10.1515/zpch-1918-9209
Spielman, L. A. (1985). “Hydrodynamic aspects of flocculation,” in Mathematical models and design methods in solid-liquid separation. Editor A. Rushton (Dordrecht: Springer Netherlands), 207–232. doi:10.1007/978-94-009-5091-7_9
Tagliabue, A., Buck, K. N., Sofen, L. E., Twining, B. S., Aumont, O., Boyd, P. W., et al. (2023). Authigenic mineral phases as a driver of the upper-ocean iron cycle. Nature 620, 104–109. doi:10.1038/s41586-023-06210-5
Takeuchi, M., Doubell, M. J., Jackson, G. A., Yukawa, M., Sagara, Y., and Yamazaki, H. (2019). Turbulence mediates marine aggregate formation and destruction in the upper ocean. Sci. Rep. 9, 16280. doi:10.1038/s41598-019-52470-5
Tsuda, A., Takeda, S., Saito, H., Nishioka, J., Nojiri, Y., Kudo, I., et al. (2003). A mesoscale iron enrichment in the western subarctic pacific induces a large centric diatom bloom. Science 300, 958–961. doi:10.1126/science.1082000
Ushijima, Y., and Yoshikawa, Y. (2019). Mixed layer depth and sea surface warming under diurnally cycling surface heat flux in the heating season. J. Phys. Oceanogr. 49, 1769–1787. doi:10.1175/JPO-D-18-0230.1
Ushijima, Y., and Yoshikawa, Y. (2022). Nonlinearly interacting entrainment due to shear and convection in the surface ocean. Sci. Rep. 12, 9899. doi:10.1038/s41598-022-14098-w
Vidussi, F., Claustre, H., Manca, B. B., Luchetta, A., and Marty, J.-C. (2001). Phytoplankton pigment distribution in relation to upper thermocline circulation in the eastern Mediterranean Sea during winter. J. Geophys. Res. Oceans 106, 19939–19956. doi:10.1029/1999JC000308
Yoshikawa, Y. (2019). “Wind-driven mixing under the earth rotation,” in Encyclopedia of ocean sciences (Elsevier), 586–590. doi:10.1016/B978-0-12-409548-9.10954-6
Yoshikawa, Y., Baba, Y., Mizutani, H., Kubo, T., and Shimoda, C. (2018). Observed features of Langmuir turbulence forced by misaligned wind and waves under destabilizing buoyancy flux. J. Phys. Oceanogr. 48, 2737–2759. doi:10.1175/JPO-D-18-0038.1
Keywords: sinking particle, size spectrum, ocean surface boundary layer (OSBL), turbulence, aggregation, disaggregation, downward material transport
Citation: Nishino K and Yoshikawa Y (2024) Numerical simulations on effects of turbulence on the size spectrum of sinking particles in ocean surface boundary layer. Front. Earth Sci. 12:1427564. doi: 10.3389/feart.2024.1427564
Received: 04 May 2024; Accepted: 12 November 2024;
Published: 23 December 2024.
Edited by:
Markus Holzner, Boku University vienne, AustriaReviewed by:
Cristian Marchioli, University of Udine, ItalyMatthäus Bäbler, Royal Institute of Technology, Sweden
Copyright © 2024 Nishino and Yoshikawa. This is an open-access article distributed under the terms of the Creative Commons Attribution License (CC BY). The use, distribution or reproduction in other forums is permitted, provided the original author(s) and the copyright owner(s) are credited and that the original publication in this journal is cited, in accordance with accepted academic practice. No use, distribution or reproduction is permitted which does not comply with these terms.
*Correspondence: Keisuke Nishino, bmlzaGlubzM4OThAY3JpZXBpLmRlbmtlbi5vci5qcA==
 Keisuke Nishino
 Yutaka Yoshikawa