 Francisco J. Vasconez
 Jeremy Phillips
 Mark J. Woodhouse
 S. Daniel Andrade
- 1School of Earth Sciences, University of Bristol, Bristol, United Kingdom
- 2Instituto Geofísico, Escuela Politécnica Nacional, Quito, Ecuador
Volcanic debris flows (lahars) are highly destructive volcanic phenomena and present significant challenges in numerical simulation. This manuscript tackles the three fundamental requirements for modelling gravitational flows: determining plausible source configurations; selecting suitable topographic data; and employing appropriate mathematical models to assess the current hazard posed by long-distance lahars at Cotopaxi volcano. After incorporating these elements, we successfully simulated the characteristics of a future 1877-type lahar under current conditions, accounting for glacier size and topography. For the source conditions, or “scenario”, we identified 27 equidistant source locations along the lower edge of the current glacier’s extent. Each source was assigned a hydrograph based on the weighted volume of water available on Cotopaxi’s current glacier. Additionally, we introduced a methodology for quantifying channel width when high-resolution digital elevation models (DEMs) are available. This method enabled us to determine the minimum pixel size required for accurate representation of ravine shapes. While higher resolution DEMs demand robust computational resources and extended computational timeframes, we upscaled Cotopaxi’s DEM from 3 m to 15 m to balance accuracy and efficiency, as a 15-m DEM capture over 90% of the topography and reduces computing time significantly. Optimizing DEM selection is crucial, especially when contemplating future ensemble approaches. After employing the dynamic-based model Kestrel, parameterised for large lahars, we obtained predictions closely aligned with field observations, historical flow conditions inferred for the 1877 lahar-event, and results from previous simulation studies. Notably, we observed higher depths and speeds in canyons compared to plains, consistent with historical reports and previous studies. Minor discrepancies in the inundation area, when compared with existing hazard maps, emphasize the importance of understanding flow dynamics and lahar trajectories for effective hazard assessment and mitigation strategies. Furthermore, our results contribute valuable information to current hazard maps and can aid in damage quantification and cost/benefit analyses, particularly when planning the construction of mitigation infrastructure.
1 Introduction
Debris flows are fast-moving gravity-driven flows, consisting of a mixture of loose sediments, debris and water that propagate downhill following natural and artificial channels, which can travel from a few to tens of kilometres (Vallance, 2005; Laigle and Bardou, 2021). Debris flows can be triggered by heavy rainfall (Pierson et al., 1996; Basile et al., 2003; Jones et al., 2015; Yu et al., 2015; Mead and Magill, 2017; Phillips et al., 2024), melting of snowpack or permafrost (Kääb et al., 2005), glacier outburst (Rana et al., 2021; Shugar et al., 2021; Vasconez et al., 2021), earthquakes (Schuster et al., 1996; Coviello et al., 2021; Vasconez et al., 2022a; Vasconez et al., 2022b) or volcanic eruptions (Pierson, 1985; Pierson et al., 1990; Thouret, 1990; Manville et al., 1998; Mothes et al., 2004; Worni et al., 2012). They are extremely destructive since they can carry meter-size-boulders, debris and sediments that can cause significant damage to infrastructure and communities along their path (Blong, 2000; Auker et al., 2013; Thouret et al., 2020). Damage is induced by the combination of the collisional forces of boulders, burial, and the hydrostatic and hydrodynamic pressures acting simultaneously on the exposed infrastructure (He et al., 2016; Thouret et al., 2020; Chehade et al., 2021).
Here, we focus on debris flows that are triggered when explosive volcanic eruptions promote the sudden interaction between hot pyroclastic density currents (PDCs) and the snow/ice on glacier-clad volcanoes. Hereinafter called primary “lahars” which is a term derived from the Javanese language that refers to volcanic debris flows (Smith and Lowe, 1991). On ice-clad volcanoes, some of the most recent and catastrophic examples include Nevado del Ruiz (Colombia) in 1985 which claimed the life of ∼23,000 people (Pierson et al., 1990) and Cotopaxi (Ecuador) in 1877 which caused more than 400 causalities (Sodiro, 1877; Wolf, 1878), and is the focus of this study.
Currently, Cotopaxi’s hazard maps solely delineate areas prone to lahar inundation in the event of a 1877-type eruption (Vasconez et al., 2015; Mothes et al., 2016a; Mothes et al., 2016b). However, to enhance early warning systems, evacuation plans and potentially construct mitigation infrastructure, additional physical parameters such as maximum speed, depth, and arrival times are required. Lahar simulation at Cotopaxi is not novel, with the first study dating back 20 years ago by Aguilera et al. (2004). Given the detailed documentation and accessibility of outcrops from the 1877-lahar event, previous simulations and hazard maps heavily rely on insights from this specific event (Andrade et al., 2022).
Numerical simulation of gravity flows, like lahars, necessitates three fundamental components: (i) defining source conditions, (ii) selecting a digital elevation model (DEM) and, (iii) employing a mathematical/physical model to describe the phenomenon. The objective of this study is to conduct new and sophisticated dynamic-based numerical simulations of lahars, specifically considering the example of Cotopaxi 1877-lahar event under the current conditions, accounting for glacier size and topography. This effort aims to augment the existing information in the current hazard maps by incorporating critical physical parameter such as maximum depth, speed, hydrostatic and hydrodynamic pressure. To achieve this, we first identify pragmatic configurations to model the melting of the glacier by PDCs as source parametrizations for dynamic modelling. Next, we determine an appropriate resolution of topographic maps to facilitate reliable simulations on long-distance lahars. Finally, we validate our predictions by comparing them with observation of large lahars at Cotopaxi.
2 Case study
Cotopaxi (0.677°S, 78.436°W, 5,897 masl) is a glacier-clad active volcano located in the Eastern Cordillera of the Ecuadorian Andes (Hall et al., 2008). It lies 60 km southeast of Quito (Ecuador’s capital city with a population of ∼2.7 million) and 35 km northeast of Latacunga (population ∼170,000) (Figure 1). Cotopaxi has a massive glacier-cap that covers ∼10.5 km2 (Cáceres, 2016) with an average thicknesses of 47 ± 7 m and an estimated volume of 450 ± 100 million m3 (Van Wyk de Vries et al., 2022). The volcano has a perfect conical shape from which tens of gullies spring and join downstream forming three main river systems: Pita River to the North, Cutuchi River to the South and Tambo-Tamboyaku Rivers that flow to the East (Figure 1). Many cities are located along these three main drainages, such as Los Chillos valley, Latacunga and Salcedo (Figure 1). As a consequence, more than 300,000 people are highly exposed to future lahars from Cotopaxi (Frimberger et al., 2021), and this number is anticipated to increase with further urbanization. Moreover, critical infrastructure, such as high-voltage electric transmission lines, hospitals, schools, airports, road networks, water supply and others, can be severely affected or destroyed since they are located in the path of the lahars (Rodriguez et al., 2017; Guimarães et al., 2021) and/or in the areas more prone to be affected by heavy ash fallout (Ramírez et al., 2022; Tadini et al., 2022).
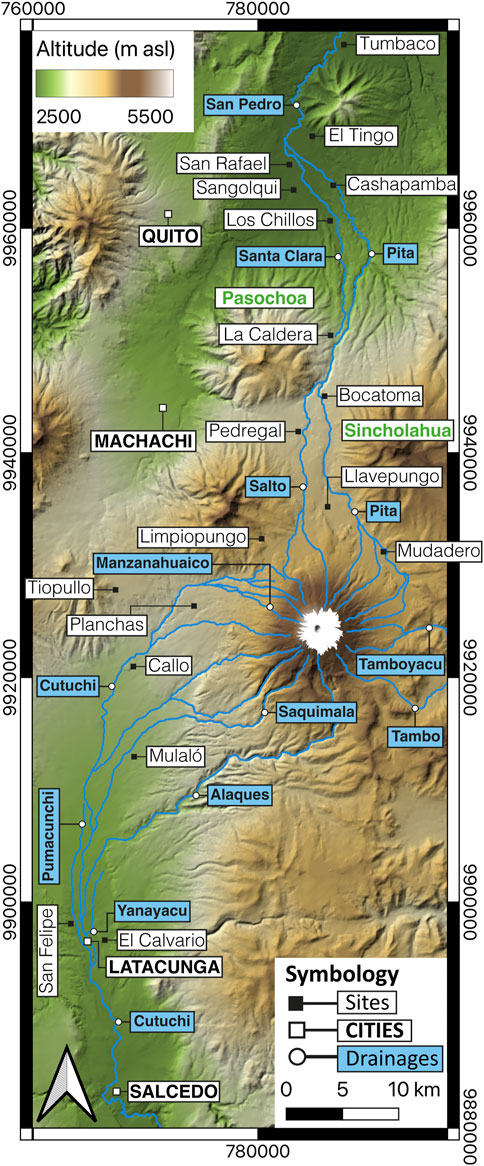
Figure 1. Cotopaxi’s locations and the main drainage network.
The last major lahars at Cotopaxi occurred on 26 June 1877 after several months of activity that significantly intensified in June (Sodiro, 1877; Wolf, 1878). That day, the volcano expelled an 8 km high, above the crater level (acl), ash column and pyroclastic density currents that flowed over snow and ice, and generated debris flows from the mixture of pyroclastic material with melt-water that swept down the three main drainages of the volcano (Sodiro, 1877; Wolf, 1878). According to historical reports, more than 400 people lost their lives, >5,000 heads of cattle were swept away, and several farms and textile factories were buried by the flows (Sodiro, 1877; Wolf, 1878). In 1877, Latacunga was the most populated city in the path of lahars and consequently was severely impacted by them, even though many people survived by fleeing to the closest hills (Sodiro, 1877; Wolf, 1878).
According to Barberi et al. (1995), Cotopaxi’s Plinian-type eruptions, capable of forming PDCs, have a recurrence period of 120 years, with the last one occurring in 1877, i.e., 147 years ago. Furthermore, in 2019, Tadini et al. (2021) conducted an expert elicitation process to determine the likely nature of future explosive activity at Cotopaxi. They found that the most probable next Cotopaxi eruption is thought to be a VEI one to two eruption, like the one that occurred in 2015 (Bernard et al., 2016; Hidalgo et al., 2018; Hidalgo et al., 2024), assigning a probability of ∼26–44% (Tadini et al., 2021). Indeed, an eruption of this kind started in October 2022 and ended in July 2023 (Hidalgo et al., 2024; Vásconez Müller et al., 2024). Additionally, Tadini et al. (2021) suggest that, for the next 100 years, the average joint probabilities for a sub-Plinian or Plinian type-eruption (like-1877) is 30%–40%, which is a substantial probability of having a major explosive eruption at Cotopaxi occurring in the near-future. A future large lahar-forming eruption is likely to produce catastrophic damage, potentially destroying infrastructure and devasting the lives and livelihoods of communities settled along their drainages. The flows are likely to propagate for long distances, with impacts felt far from the volcano. Therefore, there is a need to base planning decisions for regions around Cotopaxi on consideration of future large lahars such as occurring in 1877.
3 Data
Most of the data we used in this study have been sourced from historical reports, fieldwork campaigns, hazard maps published by the Instituto Geofísico - Escuela Politécnica Nacional (IG-EPN), and published research conducted over the last 4 decades. In the following sections, we briefly summarize the most relevant information extracted from this collection which we then utilize in our simulations as either input parameters or for validation of our results. For locations mentioned in the text refer to Figure 1.
3.1 Historical reports about the 1877 Cotopaxi eruption
Historical reports provide a detailed description of the evolution of Cotopaxi’s eruptions and their negative impacts. In many cases they also include quantitative information, albeit with the methods and technology available at the time. The 1877 eruption was observed by several authors with scientific backgrounds who have provided a detailed description of eruption phenomena and their associated impacts. Specifically, they focused on the lahars produced during the eruption, describing geological characteristics such as inundation areas, and in some cases, quantified depth, speed, peak discharge, volume, and arrival times. Below, we summarize the most relevant information retrieved from these chronicles (Table 1; Figure 1).
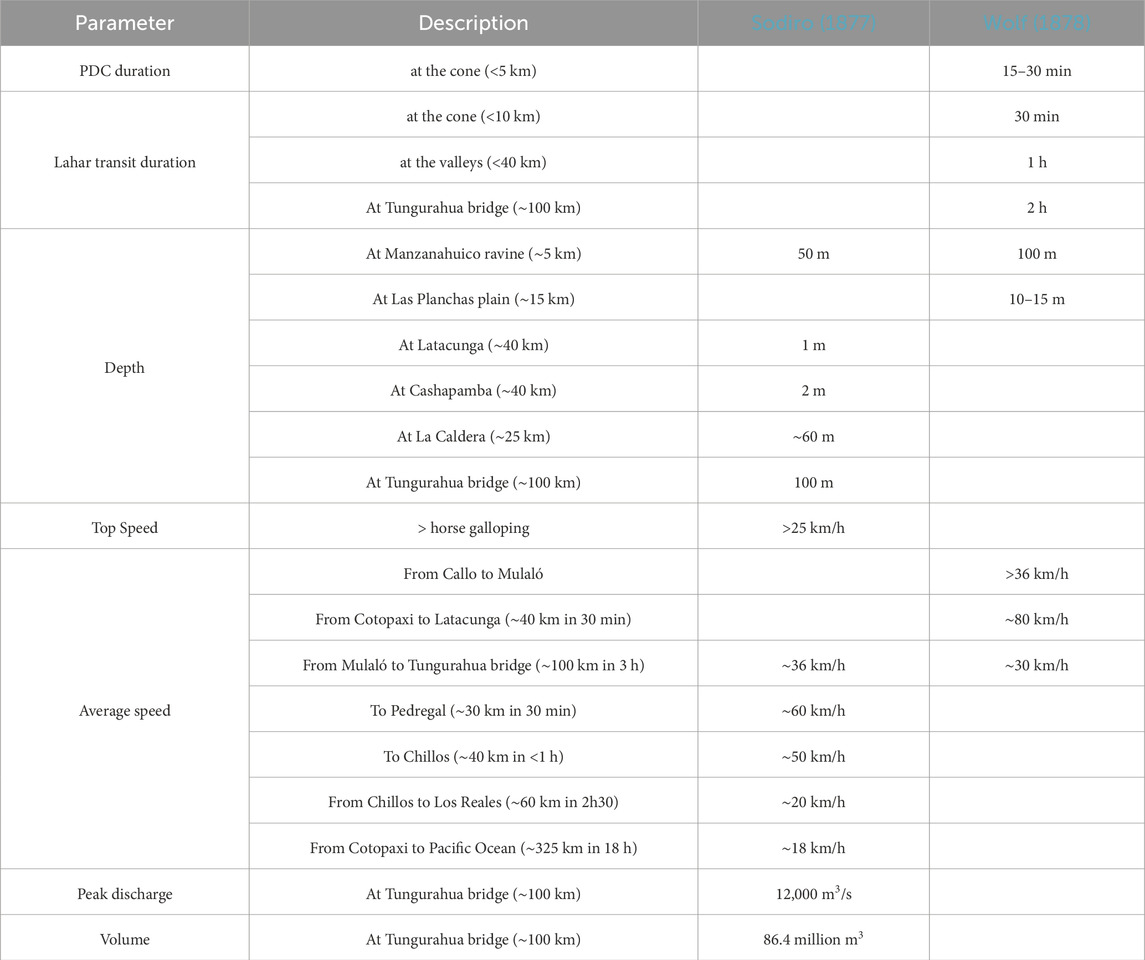
Table 1. Quantitative parameters for Cotopaxi’s lahars in 1877 extracted from the historical chronicles by the eyewitnesses Luis Sodiro and Theodor Wolf. For locations refer to Figure 1.
Since the beginning of 1877, gas and ash columns were expelled from the crater and sometimes the glow illuminated the nights, as well as “underground roars” which rumbled at the vicinity of the volcano (Wolf, 1878). On 21st April, the eruption intensified, ballistic blocks reached 200–300 m above the crater and, at the eastern flank, a “river of fire” spilled over (Wolf, 1878). By the end of May, the entire volcano was covered by a black layer of ash and the eastern crater lip had an accumulation of fresh lava (Wolf, 1878). On 25th June, an eruption occurred which was even more intense than that in April. “Underground roars” accompanied a 6–8 km acl high ash plume which caused ash fallout in Machachi, with lesser amounts falling in Quito and Latacunga; lightnings and a “river of fire” towards the west lightened up the night to complete the scene (Wolf, 1878). At the sunrise on 26th June 1877, the volcano was completely clear and calm; no subaerial activity was observed (Wolf, 1878). At 6h30 (all times here are local time) a huge “smoke column” filled the blue sky, and at 8h00 it darkened Quito (Wolf, 1878). At 10h00, “underground thunders surrounded the atmosphere” and “cannon fires” were heard in Esmeraldas, Cuenca and Tumbes (Wolf, 1878), more than 200 km away from the volcano.
“At that time the volcano was boiling like the foam of a pot of rice on fire, which suddenly starts to boil over and spill out. In few minutes the volcano was completely covered by the ash and gases expelled from the flows and was invisible for the rest of the day, especially when the ash and lapilli fallout began darkening the sky. From then on, only the deaf rumbling of the water flows which immediately formed, was heard” (Wolf, 1878).
The pyroclastic flows lasted only 15–30 min while the transit of the “avenidas” (lahars) lasted for 30 min near the volcano and an hour in the nearest valleys (Wolf, 1878).
Two months after the eruption, Theodor Wolf led an expedition to the summit and confirmed that the destruction occurred in most of the ravines, i.e., lahars occurred in all directions from the crater, especially in the western, southern, and eastern drainages. The area affected by the lahars was huge and most of the gullies were overtopped and inundated the adjacent drainages (Sodiro, 1877). The debris, ice and sediments were mainly deposited on the plains of Limpiopungo, Llavepungo and Mudadero (<12 km), meanwhile channelized in the canyons (Wolf, 1878). According to Wolf (1878), Manzanahuaico ravine, 50-m wide and 90-m deep, was completely filled, and part of the flow overtopped and inundated the continuous ravines until reaching Las Planchas plain with a 10–15 m deep flow, over an area of 5 km2 at the southern flank (Wolf, 1878). In addition, an inundated area of 28 km2 between Tiopullo and Latacunga with an average depth of 1 m was estimated by Sodiro (1877). At the confluence of the Pumancuchi and Cutuchi rivers, the drainage channelized, and the flow was confined, so that damage was limited. To the North, after inundating Llavepungo plain, the flow was channelized in the Pita River, between Pasochoa and Sincholahua volcanoes, but it overtopped towards Santa Clara River at La Caldera site, inundating Sangolqui town (Sodiro, 1877). At Pita, the flow inundated Cashapamba to a depth of 2 m, and San Rafael town over 3 km2. There was minor damage further downstream at Tumbaco where the river channelized the flow again (Sodiro, 1877). Along its path, more than a dozen of bridges were destroyed in the northern, southern and eastern drainages (Sodiro, 1877; Wolf, 1878). Remarkably, the topography played a very important role in saving Latacunga and other towns from catastrophic impacts. For instance, the plain between Rumipamba and Pumacunchi River was completely inundated and the flows destroyed San Felipe town, while Yanayacu River took a large portion of the flows and channelized them, both preventing damage to Latacunga (Wolf, 1878).
The advance of the flows “shook the ground” and between Callo and Mulaló it had an average propagation speed of >10 m/s (>36 km/h), while from Cotopaxi to Latacunga (∼40 km) the flow lasted only 30 min (Wolf, 1878), which implies an average propagation speed of at least 80 km/h. Additionally, Sodiro (1877) wrote that travellers were unable to escape the flow even though they were on horseback at top speed (>7 m/s or >25 km/h). To the South, after more than 3 hours, the flows destroyed the bridge at the foot of Tungurahua volcano at the Pastaza River (∼100 km away) (Sodiro, 1877; Wolf, 1878). At this location, Sodiro (1877) estimated an average speed of 10 m/s (36 km/h), peak discharge of 12,000 m3/s and an approximated volume of 86.4 million m3 for the southern flow, with ∼50% solids content. To the North, the flows reached Pedregal sector after 30 min and Los Chillos in less than 1 hour (Sodiro, 1877), which are ∼30 and ∼40 km away, respectively, implying ∼50 km/h average propagation speed, while from Los Chillos to Los Reales, (40–100 km away, respectively) the flows lasted 2h30 with an average propagation speed of 20 km/h (Sodiro, 1877). Finally, the flows arrived at the Pacific Ocean (∼325 km) through the Esmeraldas river after traveling more than 18 h (Sodiro, 1877; Wolf, 1878). The Esmeraldas river increased its flow a few centimetres and carried corpses and debris from houses (Wolf, 1878).
The contemporary authors also described entrainment and deposition processes of the flows.
“Given the speed with which the flows run at the volcanic cone, they could not deposit anything, in fact the beds and banks of those gullies were clean, as if they had been washed out to the point of looking like artificial channels. Deposits can only be observed at the beginning of the plains… from there downwards it began to diminish, abandoning first the larger blocks and little by little even the smaller ones” (Sodiro, 1877).
“…the flows incorporated organic material and soils at the beginning in small portions and then more and more, especially, from the wetlands between Callo and Latacunga” (Wolf, 1878).
3.2 Geological studies regarding the historical Cotopaxi lahars
Cotopaxi has been widely studied since it poses a significant risk to densely populated areas. For instance, the studies conducted by Barberi et al. (1995), Hall and Mothes (2008), Biass and Bonadonna (2011), Pistolesi et al. (2011), Pistolesi et al. (2013) and Vezzoli et al. (2017) focused on the geological description of Cotopaxi’s deposits and eruptive style, while Martel et al. (2018), Saalfeld et al. (2019) and Pistolesi et al. (2021) studied the petrology, explosive behaviour and storage conditions of its magmas. Regarding geological characterization and mapping of the Cotopaxi lahars, the most meaningful investigations came from Mothes et al. (1998), Mothes et al. (2004), Ettinger et al. (2007), Pistolesi et al. (2013), Mothes and Vallance (2015), Sierra et al. (2019) and Andrade et al. (2022). Below, we summarize the most relevant conclusions of these investigations to be used as input parameters and/or for validation of our predictions in the northern and southern drainages.
Pistolesi et al. (2013) matched lahar deposits with eruptive processes over the last millennia. They found that the way in which PDCs interact with the glacier can exert a major control on the size (amount of water released) and destructive capacity of the resulting lahars. Based on detailed geological characterization of Cotopaxi’s lahar deposits, Pistolesi et al. (2013) concluded that the 1877 boiling-over eruption produced smaller lahars in terms of volume when compared with the 1768 column-collapse eruption (see discussion section 6.3). In addition, Andrade et al. (2022) found that the inundated extent of the 1877 lahar is significant smaller when compared to previous historical lahars (i.e., 1744 and 1768 events). Their conclusions are based on drone surveys and detailed geological mapping in the higher areas, which considered mechanical behaviour of the 1877-cauliflower-bombs and vegetation type on top of the lahar terraces. The importance of glacier/PDCs interaction for the lahar size has also been pointed out by Pierson et al. (1990) and Thouret (1990) after the 1985 Nevado del Ruiz catastrophe.
Since the 1877 lahar deposits are the most exposed and accessible, most of the quantitative parameters used in previous studies have been extracted from them. For instance, Mothes et al. (2004) estimated peak discharge and speed at several locations based on the inundation area and run-up measurements. For the northern drainage, they estimated 35,000 m3/s at the upper Salto River, which then decreased to 10,000 m3/s after the confluence with the Pita River. In addition, they estimated discharges greater than 40,000 m3/s at Bocatoma and La Caldera sites (Figure 1), which is the minimum required by the lahar to overtop Santa Clara River (60 m depth) as reported by Sodiro (1877). At the headwater of Santa Clara River, peak discharge was 14,000 m3/s and decreased downstream to 2000 m3/s. At Cashapamba peak discharge reached 15,000 m3/s, while at Sangolqui it was 2000–4,000 m3/s. Finally, in San Pedro River peak discharges fluctuated between 10,000 and 15,000 m3/s. In the same way, for the southern drainage, peak discharges ranged from 12,000 to 55,000 m3/s at the cone, 30,000 m3/s at a distance 50 km away from the volcano, and 10,000 m3/s at a distance 130 km away at the Cutuchi River (Mothes et al., 2004).
Summarizing, peak discharges reached a maximum of 50,000 m3/s in the proximal zones (<20 km) and <10,000 m3/s in the distal ones (>100 km) (Mothes et al., 2004). Average propagation speeds ranged from 5 to 23 m/s (18–83 km/h), with the highest speeds obtained in the canyons and lowest on the plains. Depths reached maxima in the canyons (>10 m) and decreased on the plains (<5 m). Similar order of magnitude properties have also been reported at the lahars from Mount Saint Helens 1980 and Nevado del Ruiz 1985 (Pierson, 1985; Pierson et al., 1990).
The characteristics of the substrate are known to play a very important role for sediment entrainment and therefore the composition of the flow (sediment/water ratio). While lavas are resistant to erosion (at the northern drainages), loose and poorly consolidated materials (at the southern drainage) are easily entrained, increasing the size and destructive capacity of the lahars. Moreover, based on granulometry, the 1877 Cotopaxi lahar deposits are sand-rich and depleted in clay material, which has been related to the lack of hydrothermally altered zones and the young age of the current Cotopaxi cone (Mothes et al., 2004; Pistolesi et al., 2013). In terms of the total volume of the lahar deposit, Mothes et al. (2004) estimated 60–75 million m3 for the northern drainage and 80–100 million m3 for the South, while Barberi et al. (1995) calculated a total of 150 million m3 for the northern, southern and eastern drainages. Finally, hundreds of control points (outcrops) have been recognized during the last 4 decades along the three main drainage systems. Those have been utilized to elaborate hazard maps and to validate previous numerical simulations. As a result, the lahar inundation zone of the current hazard maps (Mothes et al., 2016a; Mothes et al., 2016b) provide a test for the results of new simulations.
3.3 Previous studies of Cotopaxi’s glacier
Cotopaxi glacier has also been studied over the years. The first estimations were made by Sodiro (1877) who calculated an area of 7.7 km2 with an average thickness of 50 m providing an estimated total volume of ∼387 million m3. A hundred years later, satellite and aerial observation allowed more accurate estimates of the area and volume of Cotopaxi’s glacier. Jordan et al. (2005) reported an area of 19.19 km2 and 13.45 km2 in 1976 and 1997, respectively. Subsequently, Cáceres (2010), Cáceres (2016), Cáceres (2017) reported 11.84 km2 (in 2006), 11.63 km2 (in 2011) and 10.5 km2 (after the 2015 eruption), showing that the glacier is continuously retreating because of climate warming and eruptive activity. Most recently, based on mean glacier-velocity maps retrieved from Sentinel-2 satellite imagery, Van Wyk de Vries et al. (2022) estimated a total volume of 450 ± 100 million m3 and thickness ranging from 27 to 122 m with an average of 47 ± 7 m, during the period 2015-2021 (Figure 2A). Interestingly, Van Wyk de Vries et al. (2022) also quantified water-equivalent volume (WEV) that could potentially be discharged by the entire current glacier within each basin surrounding the volcano. This analysis revealed a wide range of water-equivalent volumes across the basins, varying from one million to 78 million m3 of water (Figure 2A).
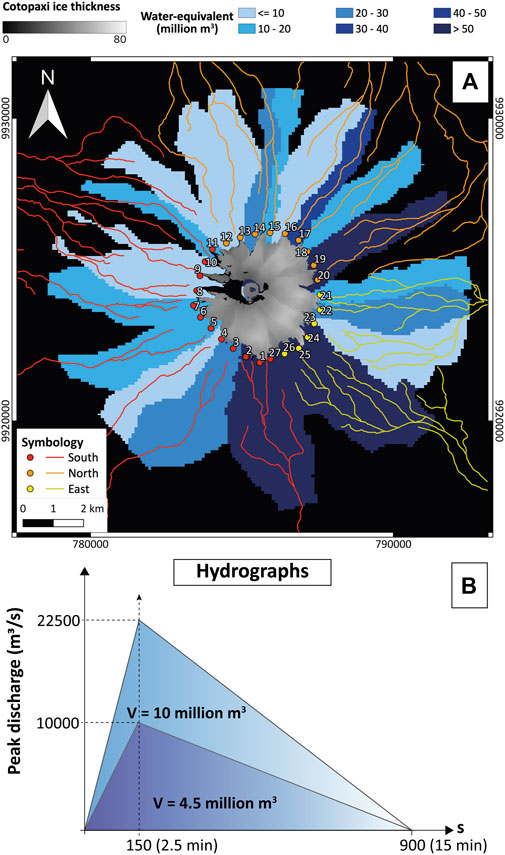
Figure 2. (A) Total water-equivalent volume (WEV) at each basin according to Van Wyk de Vries et al. (2022), and source locations every 500 m to each drainage system: South (red), North (orange) and East (yellow). (B) Examples of triangular hydrographs and water volume released at two different source locations based on the weighted peak discharge that can be released at each basin. Note that time was fixed.
3.4 Digital elevation models for Cotopaxi
A Digital Elevation Model (hereinafter DEM) is a gridded, numerical representation of surface elevation timestamped to the date of acquisition (Hugonnet et al., 2022). DEMs are often built based on the interpolation of dense point cloud measurements obtained from radar interferometry (Bürgmann et al., 2000; Rosen et al., 2000), optical stereophotogrammetry (Walker, 1995; Mikhail et al., 2001), or laser scanning (Baltsavias, 1999; Dubayah and Drake, 2000). For Cotopaxi, three local DEMs have been produced in the last 20 years (Marrero et al., 2018): (i) a 30-m (float) DEM built from topographic maps scale 1:50,000 and 1:100,000 of continental Ecuador produced by the Instituto Geográfico Militar (IGM), in 2006 (Souris, 2006); (ii) a 4-m (integer) DEM of continental Ecuador constructed by SIGTIERRAS in 2010, as a request from the Ministerio de Agricultura y Ambiente, and (iii) in 2015, a 3-m (float) DEM delivered by the IGM as a rapid response to the 2015 Cotopaxi eruptive crisis, which covered the volcanic cone and the North and South drainages, obtained by optical stereophotogrammetry. Additionally, there are freely available global DEMs of 30- and 90-m resolution which can be downloaded online (e.g., https://opentopography.org/).
4 Methodology
The numerical simulation of gravity flows has three essential requirements: (i) a scenario or set of source conditions, (ii) a DEM and, (iii) a mathematical/physical model which describes the phenomenon. In this section, we describe the most important parameters and methods used to set up our simulations based on these three fundamental requirements and the data compilation.
4.1 Source conditions (scenario)
To develop source conditions for our simulations, we require data on the current condition of the glacier, from which we can specify locations as source for lahars. We used four PlanetScope images (Planet Team, 2017), at 3-m resolution, acquired during the period 2020-2022, to draw the extent of Cotopaxi’s glacier in a Geographic Information System (GIS). The images from 21 March and 16 August 2020, 25 April 2021, and 4 February 2022 (prior to the last eruptive period) enabled us to delimit the lower edge of the glacier based on a false colour infrared composite (B4-B3-B2). Then, a convex hull was built to create a new polygon which enclosed the entire glacier cap and finally, we uniformly distributed points every 500 m along the hull, which then were utilized as source locations, with a diameter of 200 m each, for our simulations (Figure 2A).
Each source location was paired with a volumetric flux of material, represented by a triangular hydrograph, as a standard simplification for the source discharge. The duration of material release was set at 15 min (900 s), aligning with the minimum transit time reported in the historical chronicles for the PDCs (Wolf, 1878; Table 1), and we assumed that the maximum peak discharge occurs after 2.5 min (Figure 2B). Additionally, a maximum expected peak discharge of 22,500 m3/s was established based on field data (Mothes et al., 2004) and values from previous simulations for Cotopaxi lahars (Aguilera et al., 2004; Toapaxi et al., 2019; Vera et al., 2019; Frimberger et al., 2021). Moreover, building on the WEV concept (Van Wyk de Vries et al., 2022), we assigned a maximum peak discharge to each source location based on the weighted volume of water present in Cotopaxi’s current glacier. This methodology enabled us to calculate a maximum weighted peak discharge for each source location (Figure 2B), consistent with geological studies (Section 3.2) and previous lahar simulations at Cotopaxi volcano (as discussed in Section 6.1).
4.2 Digital elevation model
We used the 3-m (float) DEM which covers the entire volcanic edifice and its main drainages (>8,500 km2). It was delivered by the IGM in 2015 and is 7.8 GB in size. First, we used the “r.fill.dir” GRASS-GIS tool to fill the sinks to prevent future unrealistic conditions during the numerical simulations; where sinks are areas where the elevation data create artificial depressions, causing water to be trapped without any outlet. Second, we employed a series of GRASS tools to extract the main drainage systems from the DEM, both to the north and south, and to quantify the minimum width of the gullies. This entailed a novel and meticulous topographic analysis, allowing us to quantify the minimum pixel-size (spatial resolution) required to accurately represent the channels’ actual shape. We assumed that a minimum of three pixels is required to delineate the “V” shape of the narrowest gullies; thus, for instance, a 10 m pixel size translates to a minimum gully width of 30 m. Importantly, we considered that the 3 m resolution DEM adequately captures the true topography of the study area, with ravines wider than 9 m. The appropriate selection of the pixel size (upscaling) is critical, as it directly impacts computational resources and timeframes required for obtaining results. Higher resolution DEMs necessitate longer processing times when using flow-dynamics-based models, particularly for simulating long-distance lahars like those at Cotopaxi.
To compute the minimum width of a ravine, the main drainages were identified by using “r.watershed” tool to calculate flow direction and flow accumulation, which reveal the drainage network. Main streams were selected based on a threshold for upstream pixels to delineate the flows. Streams were then extracted using the “r.stream.extract” tool based on the defined threshold. Finally, the “intersection” tool was used to obtain the channels in the area transited by Cotopaxi lahars according to current hazard maps (Mothes et al., 2016a; Mothes et al., 2016b), resulting in a vector file with the main drainages through which Cotopaxi lahars pass to the north and south (Figure 3A).
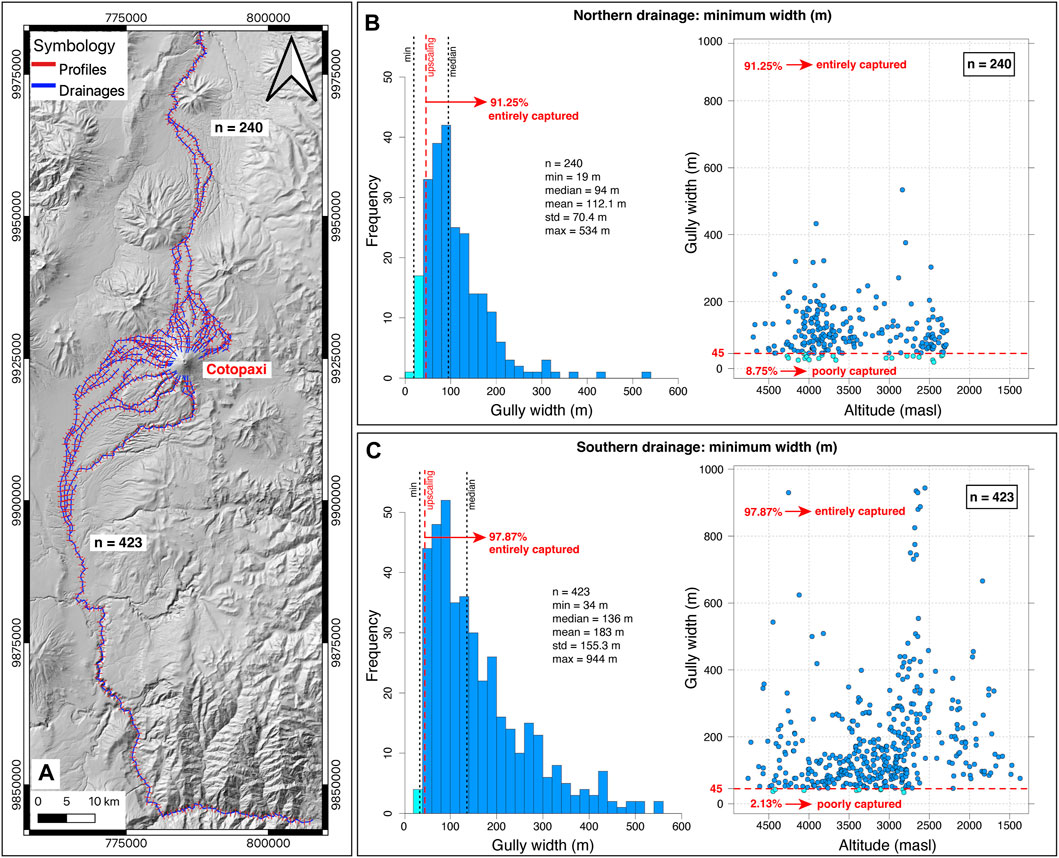
Figure 3. (A) Topographical analysis based on the 3-m DEM and 663 cross sections to calculate the minimum width of the gullies to the northern and southern drainages. (B,C): histogram of the gully width, and scatter plot of gully width versus altitude for the northern and southern drainages, respectively. The red dashed line delimits the number of profiles entirely/poorly captured after a potential DEM upscaling to 15 m, i.e., at least 3 pixels to represent the “V” shape of the narrowest ravines.
With the main drainages identified, the “cross profiles” tool is used on the extracted drainages. This SAGA Next Gen tool allows us to draw perpendicular topographic profiles along the entire drainage network (Figure 3A). Profiles are equidistant every 1,000 m and have a length of 1,000 m, assuming that the maximum width of the gullies in the study area is lower than this value. The “profile tool” is used to calculate the minimum width of the gullies by selecting one profile at a time and determining the two extreme points that define the lowest terrace. The analysis of these cross-sections enabled us to define the minimum gully width for the northern and southern drainages at each profile to finally define the minimum pixel size needed to capture the shape of the channels at Cotopaxi volcano (Figure 3).
4.3 Mathematical/physical model
Having establish the source scenario and identified an appropriate spatial resolution for the DEM, the next step is to employ a suitable simulator, a mathematical model that accurately describes flow dynamics. In this study, we utilized Kestrel model for shallow surface flows of sediments (Langham and Woodhouse, 2024), which has been calibrated for lahars as the LaharFlow webtool, www.laharflow.bristol.ac.uk (Woodhouse et al., 2016). This model provides a robust framework for simulating gravitational flows, enabling us to simulate the dynamics of lahars effectively, and is available for free on https://kestrel-unibristol.readthedocs.io/en/latest/index.html. The model solves the shallow layer equations on topography (DEM). It simulates erosion and deposition of sediment, and the corresponding changes in topography (morphodynamic). Importantly, erosion and deposition change the composition of the flow and the model uses a novel drag formulation that changes between a turbulent fluid (low solid concentration) and a granular flow (high solid concentration) as the flow propagate over time (Langham et al., 2023; Phillips et al., 2024).
As input parameters, Kestrel requires definition of the domain, source locations (latitude and longitude), source radius (fixed to 100 m), hydrograph (peak discharge vs. time), solid concentration (see discussion section 6.3), and simulation time (5 h). Additionally, the model requires physical parameters that are used in model closures that parameterize physical processes. In our application we use the following parameter values (Table 2). Most of these parameters have been set to default values that have been found to be suitable in model applications (https://kestrel-unibristol.readthedocs.io/en/latest/index.html), as utilized by Woodhouse et al. (2016), Langham et al. (2023) and Phillips et al. (2024). The calibration of those values and their corresponding sensitivity analysis are out of the scope of this investigation. For our modelling we use a server CPU – AMD EPYC 7551P 32-Core Processor with 125 GB of RAM. Our simulations were conducted in serial mode, utilizing a single CPU operating at 2 GHz.
Table 2. Physical parameter values used in Kestrel within the LaharFlow parameterization.
5 Results
5.1 Scenario (source conditions)
Our processing of Cotopaxi’s glacial coverage results in 27 distinct sources spanning the entirety of the glacier’s hull, assigned as Source 1 to Source 27. Among these, Source 27, and Sources 1 to 11 (12 in total) contribute to the southern drainage, Sources 12 to 20 (9 in total) drain to the north, and Sources 21 to 26 (6 in total) feed the eastern drainage (Figure 2A; Table 3).
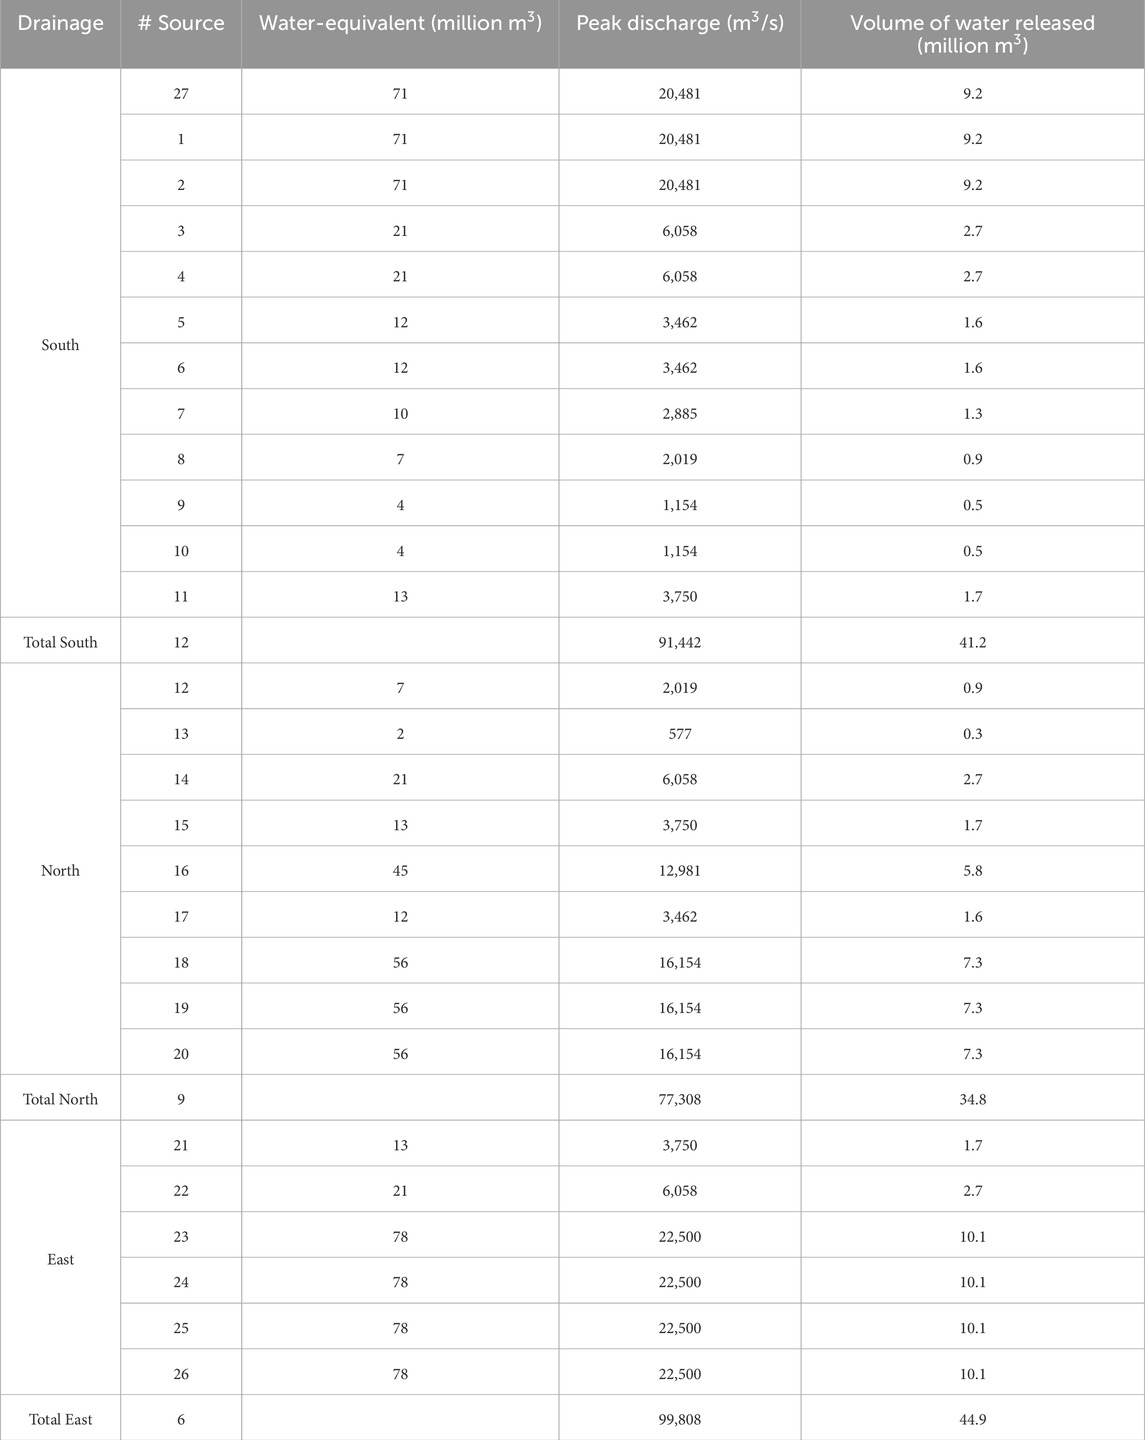
Table 3. Maximum peak discharge for each Source locations based on weighted water-equivalent volume (WEV) reported in Van Wyk de Vries et al. (2022), and a triangular hydrograph whose maximum expected peak discharge (22,500 m3/s) is reached at 2.5 min (150 s) and lasts 15 min (900 s). Note that various Source locations may fall in the same basin and therefore they share the same WEV and peak discharge (Figure 2A).
For each source, we calculated the peak discharge based on the percentage of the water-equivalent volume (WEV) reported in Van Wyk de Vries et al. (2022), representing the total volume of meltwater that could be release within each drainage network. Notably, multiple source locations may fall within the same basin, resulting in identical peak discharge values (Table 3; Figure 2A). For example, Sources 23 to 26, situated within the same basin with a maximum WEV of 78 million m3, each exhibit peak discharges of 22,500 m3/s, representing 100% discharge (Figure 2A; Table 3). Conversely, Sources three (in the southern drainage) and 14 (in the northern drainage), located in separate basins but with similar WEV of 21 million m3, exhibit peak discharges of 6,058 m3/s, corresponding to 27% of the maximums (78 million m3 and 22,500 m3/s) (Figure 2A; Table 3). By employing this methodology, the minimum peak discharge is calculated for Source 13 at 577 m3/s, positioned within a basin with a WEV of two million m3 (2.5%) (Figure 2A; Table 3). Additionally, adding the peak discharges yields a total of 91,442 m3/s for the southern drainage, 77,308 m3/s for the northern drainage, and 99,808 m3/s for the eastern drainage system.
Based on the triangular hydrograph, peak discharge can be transformed to volume for each source (Figure 2B) and to the cumulative volume delivered to every main drainage (Table 3). As a result, the eastern drainage releases the maximum amount of water of 44.9 million m3, while the southern and northern drainages receive 41.2 million m3 and 34.8 million m3, respectively. These values are consistent with recent geological studies which concluded that the eastern and southern 1877-lahars were larger in comparison to the northern ones (Pistolesi et al., 2013; Andrade et al., 2022). Interestingly, even though there are only half as many sources on the eastern flank relative to the southern flank, the amount of water released to the East is the largest, since our analysis is linked to the current volume of Cotopaxi’s glacier cap. The volume of released water obtained is also in agreement with the historical estimates. Sodiro (1877) estimated a total volume of 86.4 million m3 for the southern lahar where half was water (43.2 million m3) and half solids (Table 1), while we calculated 41.2 million m3 of water in the same drainage (see section 6.3). The total volume of water released in this scenario corresponds to 28% of the total available water in Cotopaxi’s glaciers (121/425 million m3).
5.2 Topographic analysis – The minimum gully width
The scope of our analysis extends to 85 and 157 km away from the volcano for the northern and southern drainages, respectively, which corresponds to the area covered by the 3-m DEM. Within this range, we obtained 663 perpendicular cross-sections along Cotopaxi’s drainage networks (Figure 3A; Supplementary Data sheet S1). From these profiles (240), we determined that the minimum gully width is 19 m with a median of 94 m for the northern drainage (Figure 3B), while for the southern drainage (423 profiles), the minimum is 34 m with a median of 136 m (Figure 3C). This suggests that the northern drainage generally has narrower canyons compared to the southern drainage network. Notably, we observed clusters of wider gullies between elevations of 4,500 and 3,800 masl and from 3,000 to 2,500 masl, corresponding to plains or depositional areas within the Cotopaxi National Park and urbanized regions, respectively (Figure 3).
From this analysis, the minimum pixel size required to capture the “V” shape of the narrowest ravines at the entire northern drainages is 19/3 or 6-m, while for the southern one it is 34/3 or 11-m, confirming our initial assumption that the 3-m DEM accurately capture the actual topography of Cotopaxi’s drainage network. By upscaling the 3 m DEM to 15m, we assumed a minimum gully width of 45 m instead of 19 or 34 m (red dashed line in Figures 3B,C). Our analysis revealed that using the 15-m DEM would entirely capture 91.25% and 97.87% of the northern and southern profiles, respectively, resulting in 633 out of 663 sections (Figure 3A). In contrast, upscaling the DEM to a 30-m resolution, i.e., assuming a 90-m minimum width of the ravines, would only capture 55.8% and 70.45% of the northern and southern profiles, respectively. These findings underscore the importance of using a meticulous topographical analysis prior to upscaling DEMs, since unsupported resampling could lead to inaccurate representations of the topography, increasing uncertainties of the simulation predictions (see discussion Section 6.3).
In today’s context, high-resolution DEMs are more readily available, even in large areas like Cotopaxi. Therefore, our topographical analysis represents an important step forward in optimizing dynamic-based models, as high-resolution DEMs demand robust computational resources and extended computational timeframes, especially for simulating long-distance lahars. Our approach provides an easy-to-use methodology that can be implemented prior to running any dynamic model, significantly improving computing efficiency to obtain reliable results in a reasonable timeframe. For this study, we have identified the 15-m DEM as the optimal choice for achieving accurate results within a feasible time (∼1 month).
5.3 Simulation results
After defining a plausible source configuration and selecting a suitable DEM resolution (15 m), we initiated the morphodynamic simulations using the Kestrel model. With a maximum simulation time of 5 h (300 min) and results selected at 3-min intervals (corresponding to 1% of the simulation time), we observed distinct behaviours between the northern and southern drainages. For the northern drainage, we terminated the simulation after 3 h and 30 min (70%) as the lahar reached the farthest extent of the DEM. Conversely, the simulation for the southern drainage completed the full 5-h duration. The actual computation times for obtaining results were 47 and 39 days for the northern and southern drainages, respectively.
Figure 4 depicts maps illustrating the maximum values of depth (a), speed (b), and solid fraction (c) at any time in the simulation for the northern drainage. The maximum depth ranges from 0.01 to 132.2 m, with an average of 1.4–5.3 m across the entire inundated area. Higher values are observed in the canyons (indicated by red colours), whereas lower depths are found in the plains (indicated by blue colours), which typically represent densely populated regions (Figure 4A). Our simulation closely aligns with the inundated area outlined in the 2016 hazard map (black dashed line in Figure 4A), despite minor discrepancies, particularly noticeable at Santa Clara River (see Section 6.2). The map of maximum speed reveals peak speeds of up to 100 m/s, especially at various waterfalls along the Pita River, with the highest speeds occurring in the canyons and lower speeds in the plains (Figure 4B). The average maximum speed for the entire study area ranges from 3.5 to 9 m/s. The third panel illustrates the maximum solids fraction, reflecting variations in flow density, with canyons exhibiting higher values compared to plains, indicative of the erosion and deposition processes during flow propagation (Figure 4C).
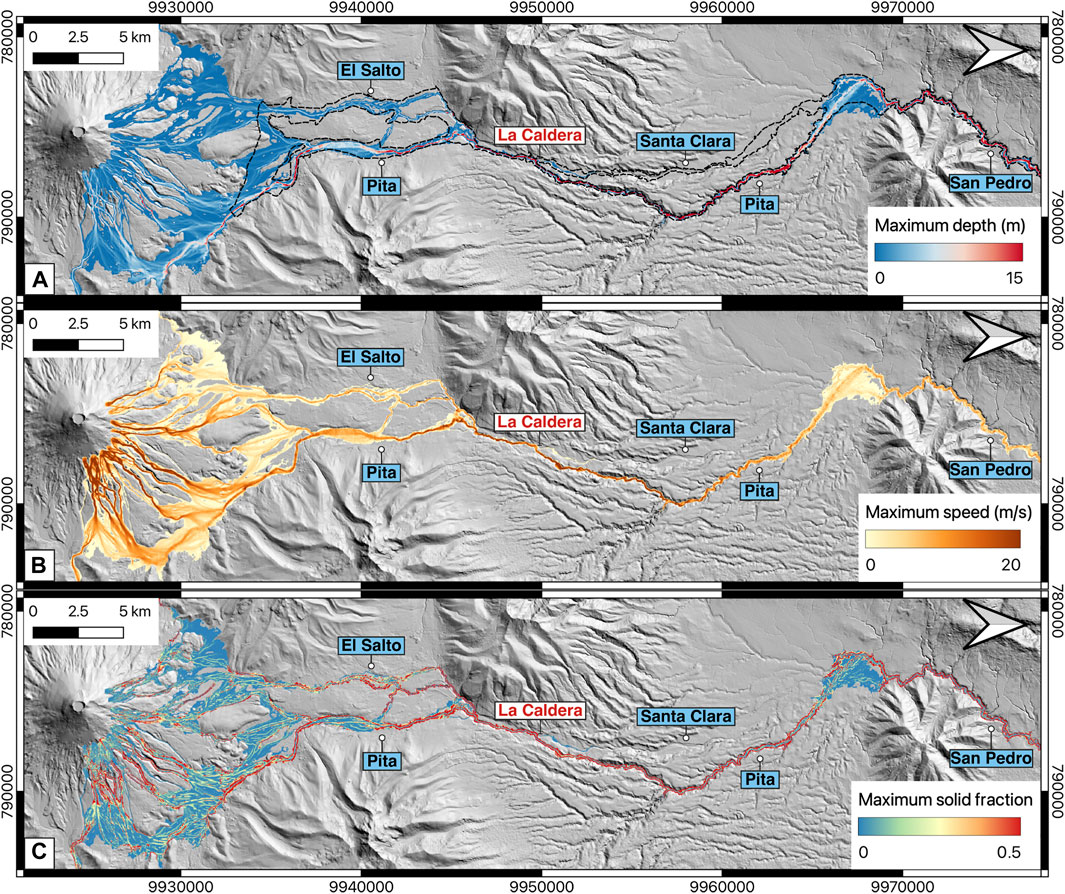
Figure 4. Maximum depth (A), speed (B) and solids fraction (C) from the simulation conducted by using a single scenario and a resampled 15 m DEM for the northern zone. Black dashed-line, in the first panel (A), is the most prone area to be inundated by lahars according to the current hazard map (Mothes et al., 2016a). Note that the North arrow points to the right.
Figure 5 presents similar maps to those in Figure 4, but for the southern drainage, showing maximum values at any time during the simulation. The maximum depth ranges from 0.01 to 60.5 m, with an average of 1.3–5.1 m, mirroring the pattern observed in the northern drainage (Figure 5A). Similarly, the highest depth values are observed in the canyons, with lower values in the plains. The map of maximum speed indicates peak speeds of up to 53.6 m/s, with the highest speeds observed in the canyons and lower speeds in the plains (Figure 5B). The average maximum speed for the entire study area ranges from 2.9 to 8.5 m/s, while the map of maximum solids fraction reveals higher values in the canyons compared to the plains, consistent with observations from the northern drainage (Figure 5C).
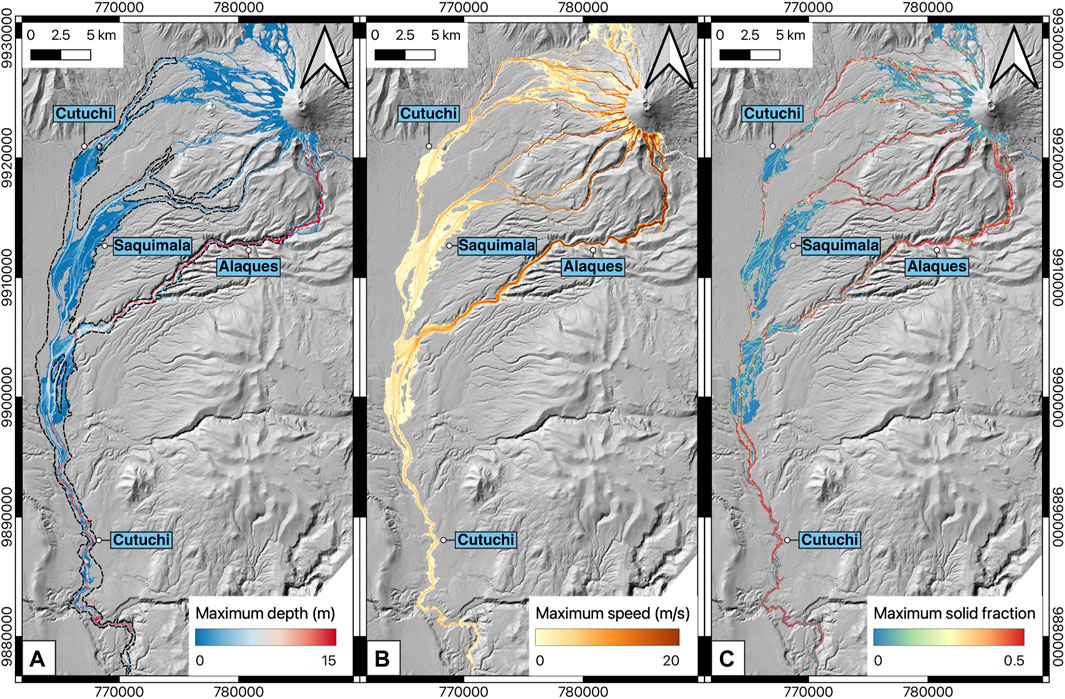
Figure 5. Maximum depth (A), speed (B) and solids fraction (C) from the simulation conducted by using a single scenario and a resampled 15 m DEM for the southern zone. Black dashed-line, in the first panel, is the most prone area to be inundated by lahars according to the current hazard map (Mothes et al., 2016b).
Moreover, we estimated average propagation speed which is the average speed at which the lahars move down the streams. For the southern and northern drainages, it varies from 6.5 m/s (24 km/h) to 10 m/s (36 km/h), respectively.
In summary, our predictions revealed maximum depths of up to 132 m in the canyons, with average maximum depths ranging from 1.3 to 5.3 m, consistent with historical records (Table 1). Maximum average flow speeds ranged from 2.9 to 9 m/s, or less than 33 km/h, with occasional peaks exceeding 100 m/s observed at the waterfalls along the Pita River. The average propagation speed was calculated to be between 6.5 and 10 m/s (24–36 km/h), aligning well with historical reports (Table 1) and observations from other lahar events globally (Pierson, 1985; Pierson et al., 1990). Importantly, our simulated inundation area closely matches that depicted in the official hazard maps, as indicated by the black dashed lines in Figure 4A; Figure 5A, with any minor discrepancies addressed in the discussion Section 6.1.
6 Discussion
6.1 Previous lahar simulations and validation of our predictions
Developing mathematical, physical, and computational models that can reliably define the phenomenology of lahars is crucial, since they can provide key information like flow depth and speed for assessing hazards and forecasting the associated risks (Aguilera et al., 2004; Frimberger et al., 2021; Lupiano et al., 2021). Simulating lahars is not new at Cotopaxi; in fact, the first study dates 20 years ago. Since the 1877-lahar event is the best described, the most studied and outcrops are the most accessible, all previous simulations and hazard maps significantly rely on the knowledge related to this specific event (Andrade et al., 2022). Thereby, much of the information derived from the historical reports and the geological studies has been utilized as input parameters and/or for validating the model predictions. An illustrative example is the common approach of comparing the simulation predictions with the inundation area depicted in the current hazard maps (Mothes et al., 2016a; Mothes et al., 2016b).
Overall, numerical models for lahar simulations tested at Cotopaxi include: a 1D hydrological model (Aguilera et al., 2004), a semi-empirical routing model (Ordoñez et al., 2013; Pistolesi et al., 2014), and several 2D physics-based models (Machado et al., 2015; Toapaxi et al., 2019; Vera et al., 2019; Frimberger et al., 2021; Lupiano et al., 2021). The physics-based models attempt to describe the complex physics of debris flows which are represented as partial differential equations that represent the conservation laws of mass, momentum, and energy. These are typically based on depth-average (shallow-layer) equations and use various formulations and parameterizations of basal drag to model flow mobility and rheology of the mixture (water and sediment). Additionally, the inclusion of entrainment and depositional processes in a subset of these models tends to dramatically increase the computational time needed to solve the complex mathematical system, especially when computations are made on high spatial resolution DEMs for long distances. Regardless of the numerical model used, field data derived from the 1877 Cotopaxi lahar has been utilized as either input data, or for calibration in all the modelling studies, which provides a unique opportunity to roughly compare the simulation predictions even though they have notable differences in the three main requirements for simulating gravity flows. A detailed summary of the lahar simulations conducted at Cotopaxi over the last 2 decades in terms of source conditions, DEM resolution, mathematical models, and their outputs are compiled in Supplementary Data sheet S2.
Here we focus on the study conducted by Frimberger et al. (2021) using RAMMS model, due to the close resemblance of the model formulation to our Kestrel simulations, with both models computing morphodynamic changes. Both models solve the conservation laws for mass and momentum and utilize similar input data, albeit employing different model closures to produce quantitative predictions. Although the scenario and DEM resolution employed in these models vary, conducting a quantitative comparison of their predictions proves insightful. Specifically, we scrutinize the model outcomes concerning inundation area, maximum depth and speed.
Frimberger et al. (2021) performed simulations in Cotopaxi’s northern and southern drainages, utilizing a 4-m resolution DEM from 2010 upscaled to 10 m. RAMMS is a physics-based dynamic model which considers a single-phase system that propagates the solid-fluid mixture as an incompressible bulk flow with mean constant density (Christen et al., 2010). It uses the two governing frictional parameters of the Voellmy-Salm rheology and provides predictions of depth, speed, impact pressure, erosion, and deposition. Frimberger et al. (2021) used two line-sources located on the glacier with a respective length of 4.5 km (south) and 2.7 km (north). Along these sources, they uniformly release 67,300 m3/s (20.2 million m3) and 64,000 m3/s (18.9 million m3) of material for the southern and northern drainages, respectively, both with an impose initial speed of 10 m/s downstream, which according to the authors, corresponds to the 1877-scenario. In contrast, we utilized a 3-m DEM (acquired in 2015) upscaled to 15 m. Our upscaling is based on a detailed topographical analysis, allowing us to quantify the minimum pixel size required to accurately represent the topography of Cotopaxi’s drainages. Additionally, we used 27 equidistant locations as sources along the entire lower glacier edge. Each source location has an assigned hydrograph, whose maximum peak discharge was calculated from the weighted volume of water available on Cotopaxi’s current glacier (Van Wyk de Vries et al., 2022). Our approach considers the current glacier conditions (area and volume), resulting in each drainage having its own volumetric flux of material. Overall, our methodology is in good agreement with field observations (Mothes et al., 2004; Pistolesi et al., 2013; Andrade et al., 2022) and chronicles (Sodiro, 1877; Wolf, 1878) regarding the different sizes of the lahars that fed each river system. For the southern drainage, we estimated a total peak discharge of 91,442 m3/s (41.2 million m3) and 77,308 m3/s (34.8 million m3) for the northern drainage system. These values correspond to the amount of water released by the glacier in topographic balance, i.e., no initial speed, while the solid fraction is incorporated by erosion (see section 6.3).
Figure 6 illustrates the areas inundated by lahars in case of a 1877-event as obtained by Frimberger et al. (2021) (orange polygon), and our study (blue polygon). Significant differences are noted in the proximal area (multihazard zone in Figure 6), while discrepancies diminish as distance increases, particularly towards the northern drainage. Overall, the area estimated by Frimberger et al. (2021) exceeds that obtained in our study (Figure 6), possibly due to the differing initial conditions (scenario). Frimberger et al. (2021) did not considered the current glacier size (area and volume) in their methodology and impose an initial speed. However, when examining model predictions over channel cross sections revealed similar trends in maximum depth and speed (Figure 6). In distal areas (profiles 1 and 4), differences range from 0.7 to 2.8 m in depth and from 2.1 to 2.6 m/s in speed. Conversely, in proximal areas (profiles 2 and 3) disparities range from 1.5 to 4.8 m in depth and from 3.2 to 7.5 m/s in speed, particularly in the southern drainage (Figure 6). In general, maximum depth, speed and inundation area values are higher in Frimberger et al. (2021) study compared to ours, but both exhibit similar trends and fall within the same order of magnitude (Figure 6). We conclude that our simulation results, which are also consistent with field observations and historical reports (Figure 6; Table 1), are reasonable.
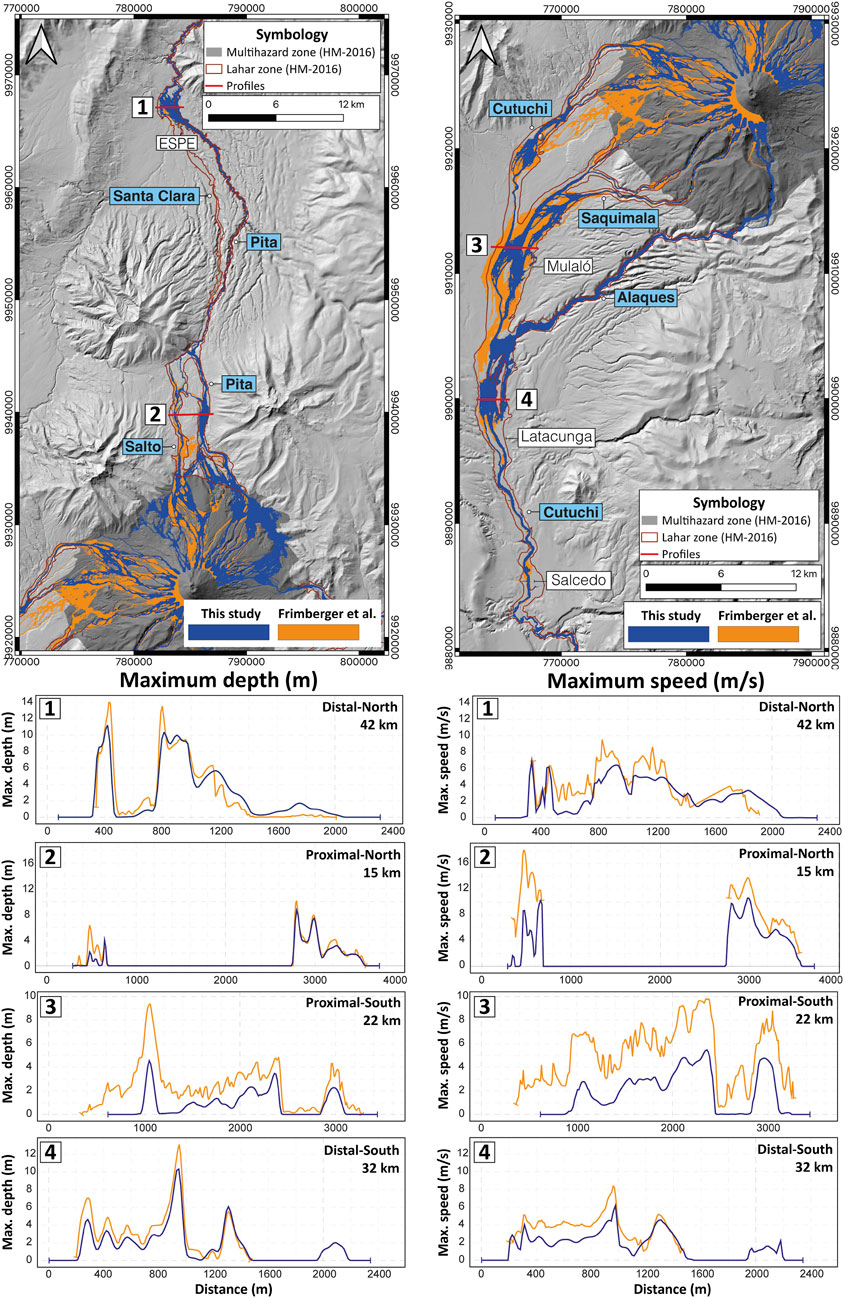
Figure 6. Comparison between the values obtained by Frimberger et al. (orange) and this study (blue) in terms of inundation area and maximum depth and speed at four random distal and proximal profiles. Note that the dark red polygons show the area inundated by lahars in the current hazard maps (HM) (Mothes et al., 2016a; Mothes et al., 2016b). Blue labels refer to main rivers and white ones to specific locations.
Neither study has fully replicated the inundation area displayed in the existing hazard maps (dark red line in Figure 6), particularly in Santa Clara River (northern drainage). This region was indeed inundated during the 1877-event (Sodiro, 1877; Wolf, 1878) and was consequently included in the current hazard maps. This discrepancy may be attributed to the volume of material released in the model scenarios, suggesting that scenarios with large volumes would inundate this area under current conditions, as demonstrated by Frimberger et al. (2021) in their scenario four. This underscores the importance of future research focused on determining the scenario required to overtop Pita River at “La Caldera” site and inundate Santa Clara River. Such analysis holds significant relevance for risk assessment, as it markedly increases the exposed urban area, as noted by Aguilera et al. (2004).
6.2 Numerical model predictions as a tool for disaster risk reduction
In the domain of disaster risk reduction, validated numerical model predictions serve as an axis for three critical components: land use planning, emergency response strategies, and vulnerability reduction efforts.
In land use planning, numerical modelling contributes to the elaboration of volcanic hazard maps, offering a quantitative view into specific volcanic processes across diverse scenarios tailored to present and/or future conditions (Nourbakhsh et al., 2006; Haynes et al., 2007; Pallister et al., 2019). These hazard maps, when combined with vulnerability data, facilitate estimations of the potential economic losses in regions susceptible to volcanic phenomena, placing the basis for risk management and disaster risk reduction initiatives (Lowenstern et al., 2022). However, previous Cotopaxi hazard maps have been prepared without the integration of numerical modelling (Miller et al., 1978; Hall and Von Hillebrandt, 1988b; Hall and Von Hillebrandt, 1988b) or with models which lack detailed physical information on the inundation areas such as maximum depth and speed (Hall et al., 2004a; 2004b; Vasconez et al., 2015; Mothes et al., 2016a; Mothes et al., 2016b). Consequently, local efforts to quantify risk have been hindered by the absence of quantitative information, as in the study conducted by Rodriguez et al. (2017). The methodology and findings presented in this study mark a significant step forward in improving risk management strategies related to Cotopaxi’s lahar hazards in Ecuador. With urban areas and critical infrastructure already placed within hazard zones, the high resolution and quantitative insights delivered by our modelling enhance assessments of potential impacts on assets within these zones. Nonetheless, the precision of impact estimations centres on comprehensive asset inventories and vulnerability assessments, which are currently scarce.
During emergency response, employing physics-based models such as Kestrel, enables the tracking of flow propagation across both time and space. In our study, we assumed simultaneous initiation of all lahars triggered by pyroclastic flows. As various gullies converge and feed major rivers through different paths, we observed how distinct lahar fronts arrive at the same locations at different times (flow dynamics). This phenomenon significantly amplifies flow depth and facilitates canyon overtopping and widespread inundation. Notably, at La Caldera site (northern drainage), historical and geological evidence suggests the overtopping of the Pita River toward the Santa Clara River; a river which originates 25 km away from the volcano (Figure 4A). Our findings reveal that, under our scenario, a portion of the Pita lahar overtops and inundates the Santa Clara River due to the arrival of multiple lahar fronts at different times (Supplementary Video S1). This highlights the necessity of considering trajectories and arrival times of various lahar fronts at the same location, especially in larger scenarios where a minimum peak discharge is required to induce overflow (Aguilera et al., 2004; Frimberger et al., 2021). Furthermore, for the southern drainage, we observed upstream inundation, contrary to previous assumptions of downstream inundation from north to south at Cutuchi River (Supplementary Video S2). Our simulations indicate that inundation occurs from South to North due to trajectories of individual lahar fronts. This underscores the significance of path trajectories, onset timing and flow dynamics, which can substantially alter arrival times to urban areas, potentially requiring adjustments in response times, early warning systems, and evacuation plans.
Finally, regarding vulnerability reduction, Kestrel and other dynamic physics-based models offer an innovative opportunity for communicating lahar hazard maps through digital animations (see Supplementary Video S1, 2) or flipbooks, allowing communities to visualize lahar flow propagation. These interactive tools serve as a meaningful way of engaging communities and enhancing understanding of lahar hazard zones and arrival times, thereby reinforcing local knowledge, and reducing vulnerability, even in communities lacking technological or electrical facilities. By transcending traditional static hazard maps, animations provide a dynamic platform for covering volcanic hazard information; the efficiency of which warrants further exploration and quantification.
6.3 Limitations and perspectives
Kestrel applies the balance of mass and momentum equations on topography, and initial propagation of the flow occurs around the circumference of a circular source. The flow is released without any imposed momentum (although with a characteristic velocity set by the ratio of volumetric flux to source area) intended to allow equilibration of the flow to the local force balance imposed by the topography on which the source is placed. This can lead to part of the flow moving upstream of the source geometry during the onset, which is a characteristic shared with other gravity flow models like RAMMS. However, RAMMS offers the option to imposes an initial flow direction and speed, forcing the flow downstream, but not in balance with the local force balance set by the topography. In both cases, if the material released at the source comprises both fluid and dense solid particles, there can be insufficient initial velocity to keep the particles in suspension as the flow adjusts to the local topography, resulting in settling of the solids near the source before the flow becomes fully developed. To address this issue, we opted to release only water, with the solid fraction incorporated during lahar transit via entrainment processes, which occurred rapidly on the proximal volcanic topography (see Figure 4C; Figure 5C). While this approach aligns with those presented in Frimberger et al. (2021) and Lupiano et al. (2021), who also found that the solid fraction primarily originates from erosion. Moreover, since we are simulating gravity flows, the location of the source could significantly impact the results. Sources located upstream will exhibit higher speeds and greater erosion capacities compared to those situated downstream. This factor is also pertinent when comparing our results with those obtained by Frimberger et al. (2021), (50–200 m difference) as it may contribute to the observed differences in the outcomes (Figure 6).
The results presented in this study are from a single scenario that reflects specific initial conditions and do not serve as predictions for future Cotopaxi eruptions. While these results may be used as referential values, additional simulations or ensembles are imperative. Ensembles should encompass a range of scenarios to effectively capture the inherent variation in natural processes, such as volcanic eruptions and subsequent lahar formation. Specifically, studies investigating the interaction between glacier and pyroclastic density currents (PDCs) are crucial for quantifying the potential water release during lahar formation. For instance, Pistolesi et al. (2013) underscored the significance of PDC type (e.g., column collapse, boiling over, etc.) in determining the water released during lahar formation at Cotopaxi. They found that the way in which PDCs interact with the glacier outweighs the glacier’s size in terms of importance. Their conclusions are based on a detailed componentry analysis and the inundation area of historical lahar deposits. However, further studies and numerical simulations are required to generalize this conclusion. In addition, Lupiano et al. (2021) made initial attempts to account for glacier melting. They simulated water released from melting 25–50 m of Cotopaxi’s entire glacier area, and gradual melting due to ballistic impacts (sinking 25–50 m). However, these scenarios have not been observed in previous pyroclastic flow-lahar forming eruptions worldwide (Pierson, 1985; Pierson et al., 1990; Worni et al., 2012) and remain exploratory at this time.
The topographic analysis presented in this study introduces a novel methodology to employ dynamic-based models for ensemble simulations in future research. By quantifying the minimum width of gullies, we determined the necessary pixel size to accurately represent ravine shapes when high-resolution DEMs are available. This preliminary step enables researchers to determine the pixel size required to achieve reliable results within a feasible computing timeframe before initiating any simulations. Despite being topographically dependent, DEM upscaling is often overlooked or inadequately justified when running surface flow models. Simulating long-distance lahars (>50 km) over high-resolution DEMs demands significant computational resources and extensive processing time, often impeding any ensemble/stochastic approaches. Our findings indicate that DEMs with spatial resolutions of 6 and 11 m adequately capture the shapes of gullies in the northern and southern Cotopaxi’s drainages, respectively, with a 100% capture rate. In contrast, a 30-m DEM only captures 55.8% and 70.45% of gully shapes, respectively. This underscores the importance of considering the actual topography of Cotopaxi’s drainages in simulation studies, as inaccuracies in DEM resolution can significantly affect predictions such as inundation area and other physical parameters. It is noteworthy that while 30-m DEMs may have been the best available option in previous Cotopaxi simulation studies, advances in technology now provide access to high-resolution DEMs even for extensive areas. Consequently, the analysis of pixel size requirements for conducting accurate simulations (cost/benefit analysis) is important for obtaining reliable results within reasonable timeframes, especially during volcanic crises.
Finally, while the influence of DEM resolution has been studied in glaciological and hydrological applications (Hugonnet et al., 2022; Rocha et al., 2022), its implications for long-distance lahars remain underexplored. Therefore, future studies should aim to quantify the actual differences resulting from the use of different upscaled DEMs. These results could open an opportunity for segmentation, wherein dynamic models automatically adjust spatial resolution based on the terrain characteristics along the same simulation. For instance, higher resolution in canyons would capture the shape of narrow gullies, while lower resolutions in plains would suffice. This approach is particularly valuable considering that most urbanized areas are situated in plains, where lower resolutions DEMs can produce reliable predictions, thus optimizing the computational timeframes and resources when utilizing dynamic models and providing the opportunity to use ensembles. Utilizing this framework in potential future probabilistic hazard simulations is valuable, as most current probabilistic models simplify the physics of the phenomena due to the lengthy computing times and high-performance demands of complex physical models. In contrast, our approach aims to optimize the initial parameters in the simulation, enabling the use of dynamic models in an ensemble fashion. This represents a significant advancement for future probabilistic studies.
6.4 Hydrostatic and hydrodynamic pressures
In densely populated areas such as the Chillos valley and Latacunga (Figure 1), there is a growing demand for mitigation infrastructure to reduce the impact of potential Cotopaxi lahars. Currently, the hazard maps for Cotopaxi only indicate areas prone to inundation by lahars and lack key physical parameters such as maximum depth, speed, and solid fraction data, which are essential for quantifying potential damage. This lack of information has hindered studies on the feasibility of constructing mitigation infrastructure capable of reducing the size of Cotopaxi’s lahars. Rodriguez et al. (2017) attempted to assess the economic cost/benefit of implementing such infrastructure to mitigate the impact of lahars at Cotopaxi. However, their study lacks detailed engineering specifications, locations and costs required to build such infrastructure to contain lahars with historically observed flow rates and volumes (Sodiro, 1877; Mothes et al., 2004; Frimberger et al., 2021). Consequently, their work remains incomplete and provides only an approximate cost of potential losses of the exposed infrastructure.
For a comprehensive cost/benefit analysis, engineers require critical physical parameters, that are essential for determining the specific design requirements of mitigation infrastructure to ensure structural integrity and prevent collapse. We can derive these parameters from our study results by utilizing maximum depth, speed, and solid fraction data (Figures 4, 5). These metrics serve as fundamental inputs for calculating momentum flux and hydrostatic and hydrodynamic pressures, which are vital for designing effective and resilient mitigation measures and for quantifying potential damage of current exposed infrastructure.
For the hydrostatic and hydrodynamic pressure we use the equations proposed by Huebl et al. (2017):
where C is the maximum solid fraction, ρsolid: solid density (2,000 kg/m3), ρwater: water density (1,000 kg/m3), g: gravity (9.81 m/s2), h: maximum depth (m) and, V maximum speed (m/s).
Finally, the impact pressure can be written as the sum of hydrostatic and hydrodynamic pressures as proposed by Chehade et al. (2021) and therefore:
By inserting Eqs 1, 2 in Eq. 3, we obtain:
By employing Eq 4, we quantified the impact pressure resulting from Cotopaxi’s lahars, based on our scenario, in both the northern and southern drainages. Previous studies provide insights into the impact pressure thresholds required to exceed the resistance of various types of buildings. For instance, Jenkins et al. (2015) reported impact pressure ranges of 18–58 kPa for rubble stone buildings and 2–7 kPa for weak squared block masonry in the Merapi area of Indonesia, where buildings are typically weakly constructed. In contrast, Zanchetta et al. (2004) proposed thresholds for different types of structures, suggesting that impact pressures exceeding 3 kPa could break a wooden door, while for reinforced concrete buildings, damage thresholds range from 3 to 35 kPa for moderate damage, 35–90 kPa for heavy damage, and over 90 kPa for complete destruction. Although these thresholds may not directly apply to the buildings in our study area, we use them as a reference to estimate potential damage (Figure 7). The average impact pressure for both drainages is approximately 70 kPa (moderate damage). The northern drainage exhibits the highest values (>100 kPa), especially in the vicinity of waterfalls, where the augmented flow speed and depth markedly amplifies the impact. Overall, the highest values are observed within the channels and gradually decrease as the flows move away from them (Figure 7).
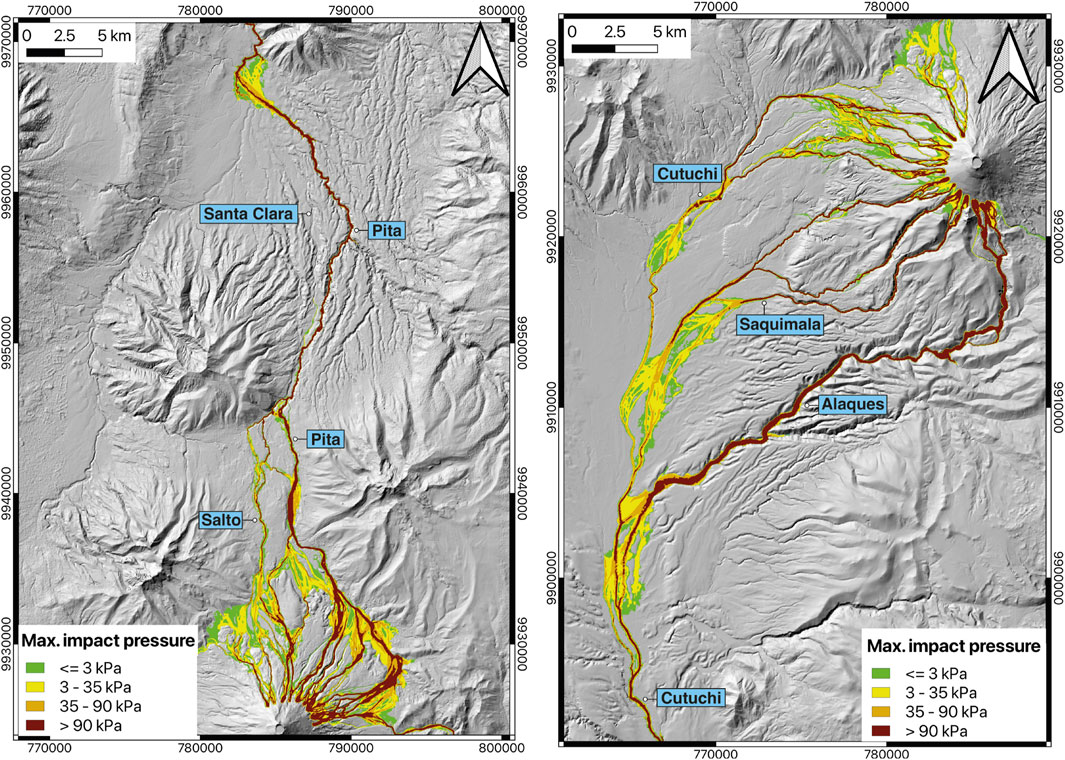
Figure 7. Impact pressure (hydrostatic + hydrodynamic) of lahars for the northern and southern drainages at Cotopaxi volcano. Note that the highest values are within the river, and decreases as the flows move away from the channels.
Damage to structures by lahars is the result of a combination of hydrostatic and hydrodynamic pressure, along with burial and the impact forces exerted by boulders (He et al., 2016; Thouret et al., 2020). However, our study solely considers hydrostatic and hydrodynamic pressure, while the effect of boulder collisions and burial are beyond the scope of this investigation. Furthermore, a comprehensive study focusing on fragility functions adapted to local construction characteristics is essential for accurately assessing potential building damage. The maps depicted in Figure 7 serve solely as reference, as these impact pressures were estimated based only on one lahar scenario.
7 Conclusion
Our study addresses the three fundamental requirements for modelling gravitational flows: (i) establishing a plausible source configuration (scenario), (ii) selecting suitable topographic data represented by a digital elevation model (DEM), and (iii) employing an appropriate mathematical model to describe the phenomenon. Integrating these elements holistically enabled us to successfully replicate the characteristics of a future 1877-type lahar at Cotopaxi volcano under current conditions, including glacier size and topography.
Concerning the scenario, we identified 27 equidistant source locations at the lower edge of the current glacier extent (500 m apart from each other). Each source was assigned its own hydrograph, calculated based on the weighted volume of water available on Cotopaxi’s current glacier. Regarding the DEM, we developed a straightforward methodology for quantifying channel width, when high-resolution DEMs are available. This novel approach allowed us to determine the minimum pixel size required to accurately represent ravine shapes at Cotopaxi. For the northern drainages, a 6-m DEM sufficed, while an 11-m DEM was adequate for the southern drainages. Since high-resolution DEMs demand significant computational resources and time, we opted to upscale Cotopaxi’s DEM from 3m to 15 m. Utilizing a 15-m DEM allows to capture over 90% of the topographic features, while reducing computing time significantly. Furthermore, we found that employing a 30-m DEM would only capture between 50%–70% of the Cotopaxi’s gullies topography, yielding results in a very short time (few days), but significantly increasing prediction inaccuracies. Optimizing DEM selection is crucial for simulating long-distance lahars, particularly when considering future ensemble approaches.
When comparing our results with previous dynamic model predictions, we noted similar trends and values for maximum depth and speed and inundation area, despite variations in scenario and DEM resolution. While our values of flow properties tend to be slightly lower, they still fall within the same order of magnitude. Notably, we observed higher depths and speeds in the canyons and lower ones in the plains. Maximum depth reached 132 m in the canyons, while averaging 1.3–5.3 m in both the northern and southern drainages. The average maximum speed was calculated to be 2.9–9 m/s, with notable peaks occurring at the waterfalls of the Pita River, while average propagation speed reaches 6.5–10 m/s (24–36 km/h). These results are consistent with historical reports, observations from other lahar events worldwide, and previous studies on Cotopaxi. Our inundation area closely aligns with the official hazard maps, with minor discrepancies observed, for instance, at Santa Clara River. This observation raises questions about the minimum peak discharge required to overtop “La Caldera” site and highlight the significance of understanding trajectories of various lahar fronts arriving at the same location at different times, emphasizing the importance of flow dynamics in hazard assessment.
Along the same lines, our findings shed light on the sequence of impact, indicating that Latacunga city will be affected before other upstream towns. This underscores the criticality of comprehending the pathways taken by various lahar fronts when onset occurs at the same time. In contrast to previous studies suggesting downstream inundation from north to south at Cutuchi River, our research reveals an opposite pattern from south to north (upstream). These findings carry significant implications for early warning systems and evacuation plans, potentially necessitating adjustments to accommodate the revised flow dynamics and ensure effective risk mitigation strategies.
Data availability statement
The raw data supporting the conclusion of this article will be made available by the authors, without undue reservation. Kestrel is available for free on https://kestrel-unibristol.readthedocs.io/en/latest/index.html, and the LaharFlow webtool on https://www.laharflow.bristol.ac.uk/.
Author contributions
FV: Conceptualization, Data curation, Formal Analysis, Investigation, Methodology, Validation, Visualization, Writing–original draft, Writing–review and editing. JP: Conceptualization, Formal Analysis, Funding acquisition, Investigation, Project administration, Resources, Supervision, Validation, Writing–review and editing. MW: Formal Analysis, Investigation, Resources, Software, Supervision, Validation, Writing–review and editing. SA: Conceptualization, Formal Analysis, Funding acquisition, Investigation, Project administration, Supervision, Validation, Writing–review and editing.
Funding
The author(s) declare that financial support was received for the research, authorship, and/or publication of this article. This work was supported by the UKRI GCRF under grant NE/S009000/1, Tomorrow’s Cities Hub.
Acknowledgments
Special thanks are owed to the late Minard L. Hall, who establish the IG-EPN out of concern for the high risk posed by a potential Cotopaxi lahar-forming eruption. Without his vision and support, Ecuadorian volcanology would have lagged by several decades, and decision-makers would have remained unaware of their catastrophic impacts. The authors also extend their gratitude to Theresa Frimberger for generously and selflessly sharing the results from Frimberger et al. (2021), enabling meaningful comparisons and enriching part of the discussion. Furthermore, the authors express their appreciation to the Kestrel team, whose significant improvements to the code facilitated this investigation. Special acknowledgement is reserved for Anais Vásconez and Pablo Samaniego, whose insightful ideas provided crucial guidance to the first author during challenging moments.
Conflict of interest
The authors declare that the research was conducted in the absence of any commercial or financial relationships that could be construed as a potential conflict of interest.
Publisher’s note
All claims expressed in this article are solely those of the authors and do not necessarily represent those of their affiliated organizations, or those of the publisher, the editors and the reviewers. Any product that may be evaluated in this article, or claim that may be made by its manufacturer, is not guaranteed or endorsed by the publisher.
Supplementary material
The Supplementary Material for this article can be found online at: https://www.frontiersin.org/articles/10.3389/feart.2024.1426088/full#supplementary-material
References
Aguilera, E., Pareschi, M. T., Rosi, M., and Zanchetta, G. (2004). Risk from lahars in the northern valleys of Cotopaxi Volcano (Ecuador). Nat. Hazards 33, 161–189. doi:10.1023/B:NHAZ.0000037037.03155.23
Andrade, S. D., Saltos, E., Nogales, V., Cruz, S., Lee, G., and Barclay, J. (2022). Detailed cartography of Cotopaxi’s 1877 primary lahar deposits obtained by drone-imagery and field surveys in the proximal northern drainage. Remote Sens. 14, 631. doi:10.3390/rs14030631
Auker, M. R., Sparks, R. S. J., Siebert, L., Crosweller, H. S., and Ewert, J. (2013). A statistical analysis of the global historical volcanic fatalities record. J. Appl. Volcanol. 2, 2. doi:10.1186/2191-5040-2-2
Baltsavias, E. P. (1999). Airborne laser scanning: basic relations and formulas. ISPRS J. photogrammetry remote Sens. 54, 199–214. Available at:. doi:10.1016/s0924-2716(99)00015-5
Barberi, F., Coltelli, M., Frullani, A., Rosi, M., and Almeida, E. (1995). Chronology and dispersal characteristics of recently (last 5000 years) erupted tephra of Cotopaxi (Ecuador): implications for long-term eruptive forecasting. J. Volcanol. Geotherm. Res. 69, 217–239. doi:10.1016/0377-0273(95)00017-8
Basile, A., Mele, G., and Terribile, F. (2003). Soil hydraulic behaviour of a selected benchmark soil involved in the landslide of Sarno 1998. Geoderma 117, 331–346. doi:10.1016/S0016-7061(03)00132-0
Bernard, B., Battaglia, J., Proaño, A., Hidalgo, S., Vásconez, F., Hernandez, S., et al. (2016). Relationship between volcanic ash fallouts and seismic tremor: quantitative assessment of the 2015 eruptive period at Cotopaxi volcano, Ecuador. Bull. Volcanol. 78, 80. doi:10.1007/s00445-016-1077-5
Biass, S., and Bonadonna, C. (2011). A quantitative uncertainty assessment of eruptive parameters derived from tephra deposits: the example of two large eruptions of Cotopaxi volcano, Ecuador. Bull. Volcanol. 73, 73–90. doi:10.1007/s00445-010-0404-5
Blong, R. (2000). “Volcanic hazards and risk management,” in Encyclopedia of volcanoes (Germany: Academic Press), 1215–1227. Available at: https://www.elsevier.com/books/encyclopedia-of-volcanoes/sigurdsson/978-0-08-054798-5.
Bürgmann, R., Rosen, P. A., and Fielding, E. J. (2000). Synthetic aperture radar interferometry to measure earth’s surface topography and its deformation. Annu. Rev. Earth Planet. Sci. 28, 169–209. doi:10.1146/annurev.earth.28.1.169
Cáceres, B. (2010). Actualización del inventario de tres casquetes glaciares del Ecuador. USA: Informe de Pasantía de Investigación en Université Nice Sophia Antipolis.
Cáceres, B. (2017). Evolución de los glaciares del Ecuador durante los últimos 60 años y su relación con el cambio climático. Available at: https://www.researchgate.net/publication/317339020_GOAL_WORKSHOP_2017_MEXICO_135_EVOLUCION_DE_LOS_GLACIARES_DEL_ECUADOR_DURANTE_LOS_ULTIMOS_60_ANOS_Y_SU_RELACION_CON_EL_CAMBIO_CLIMATICO.
Cáceres, B. E. (2016). Dramatical reduction of Cotopaxi Glaciers during the last volcano awakening 2015-2016. AGUFM, C41C–C0677.
Chehade, R., Chevalier, B., Dedecker, F., Breul, P., and Thouret, J.-C. (2021). Discrete modelling of debris flows for evaluating impacts on structures. Bull. Eng. Geol. Environ. 80, 6629–6645. doi:10.1007/s10064-021-02278-3
Christen, M., Kowalski, J., and Bartelt, P. (2010). RAMMS: numerical simulation of dense snow avalanches in three-dimensional terrain. Cold Regions Sci. Technol. 63, 1–14. Available at:. doi:10.1016/j.coldregions.2010.04.005
Coviello, V., Capra, L., Norini, G., Dávila, N., Ferrés, D., Márquez-Ramírez, V. H., et al. (2021). Earthquake-induced debris flows at popocatépetl volcano, Mexico. Earth Surf. Dynam. 9, 393–412. doi:10.5194/esurf-9-393-2021
Dubayah, R. O., and Drake, J. B. (2000). Lidar remote sensing for forestry. J. For. 98, 44–46. Available at:. doi:10.1093/jof/98.6.44
Ettinger, S., Mothes, P., Paris, R., and Schilling, S. (2007). The 1877 lahar deposits on the eastern flank of Cotopaxi volcano. Géomorphologie relief, Process. Environ. 13, 271–280. Available at:. doi:10.4000/geomorphologie.4022
Frimberger, T., Andrade, S. D., Weber, S., and Krautblatter, M. (2021). Modelling future lahars controlled by different volcanic eruption scenarios at Cotopaxi (Ecuador) calibrated with the massively destructive 1877 lahar. Earth Surf. Process. Landforms 46, 680–700. doi:10.1002/esp.5056
Guimarães, L. F., Nieto-Torres, A., Bonadonna, C., and Frischknecht, C. (2021). A new inclusive volcanic risk ranking, Part 2: application to Latin America. Front. Earth Sci. 9, 25. doi:10.3389/feart.2021.757742
Hall, M., and Mothes, P. (2008). The rhyolitic–andesitic eruptive history of Cotopaxi volcano, Ecuador. Bull. Volcanol. 70, 675–702. doi:10.1007/s00445-007-0161-2
Hall, M. L., Mothes, P. A., Samaniego, P., Yepes, H. A., and Andrade, S. D. (2004a). Mapa Regional de los Peligros Volcánicos Potenciales del Volcán Cotopaxi – Zona Norte.
Hall, M. L., Mothes, P. A., Samaniego, P., Yepes, H. A., and Andrade, S. D. (2004b). Mapa Regional de los Peligros Volcánicos Potenciales del Volcán Cotopaxi – Zona Sur.
Hall, M. L., Samaniego, P., Le Pennec, J. L., and Johnson, J. B. (2008). Ecuadorian Andes volcanism: a review of Late Pliocene to present activity. J. Volcanol. Geotherm. Res. 176, 1–6. doi:10.1016/j.jvolgeores.2008.06.012
Hall, M. L., and Von Hillebrandt, C. (1988b). Mapa de los peligros volcánicos potenciales asociados con el volcán Cotopaxi. zona sur.
Haynes, K., Barclay, J., and Pidgeon, N. (2007). Volcanic hazard communication using maps: an evaluation of their effectiveness. Bull. Volcanol. 70, 123–138. doi:10.1007/s00445-007-0124-7
He, S., Liu, W., and Li, X. (2016). Prediction of impact force of debris flows based on distribution and size of particles. Environ. Earth Sci. 75, 298. doi:10.1007/s12665-015-5180-2
Hidalgo, S., Battaglia, J., Arellano, S., Sierra, D., Bernard, B., Parra, R., et al. (2018). Evolution of the 2015 Cotopaxi eruption revealed by combined geochemical and seismic observations. Geochem. Geophys. Geosystems 19, 2087–2108. doi:10.1029/2018GC007514
Hidalgo, S., Bernard, B., Mothes, P., Ramos, C., Aguilar, J., Andrade, S. D., et al. (2024). Hazard assessment and monitoring of Ecuadorian volcanoes: challenges and progresses during four decades since IG-EPN foundation. Bull. Volcanol. 86, 4. doi:10.1007/s00445-023-01685-6
Huebl, J., Nagl, G., Suda, J., and Rudolf-Miklau, F. (2017). Standardized stress model for design of torrential barriers under impact by debris flow (according to Austrian standard regulation 24801). IJECE 10, 47–55. doi:10.13101/ijece.10.47
Hugonnet, R., Brun, F., Berthier, E., Dehecq, A., Mannerfelt, E. S., Eckert, N., et al. (2022). Uncertainty analysis of digital elevation models by spatial inference from stable terrain. IEEE J. Sel. Top. Appl. Earth Obs. Remote Sens. 15, 6456–6472. doi:10.1109/JSTARS.2022.3188922
Jenkins, S. F., Phillips, J. C., Price, R., Feloy, K., Baxter, P. J., Hadmoko, D. S., et al. (2015). Developing building-damage scales for lahars: application to Merapi volcano, Indonesia. Bull. Volcanol. 77, 75. doi:10.1007/s00445-015-0961-8
Jones, R., Manville, V., and Andrade, D. (2015). Probabilistic analysis of rain-triggered lahar initiation at Tungurahua volcano. Bull. Volcanol. 77, 68. doi:10.1007/s00445-015-0946-7
Jordan, E., Ungerechts, L., Cáceres, B., Peñafiel, A., and Francou, B. (2005). Estimation by photogrammetry of the glacier recession on the Cotopaxi Volcano (Ecuador) between 1956 and 1997. 14.
Kääb, A., Reynolds, J. M., and Haeberli, W. (2005). “Glacier and permafrost hazards in high mountains,” in Global change and mountain regions: an overview of current knowledge. Editors U. M. Huber, H. K. M. Bugmann, and M. A. Reasoner (Dordrecht: Springer Netherlands), 225–234. doi:10.1007/1-4020-3508-X_23
Laigle, D., and Bardou, E. (2021). “Mass-movement types and processes: flow-like mass movements, debris flows and Earth flows,” in Reference module in Earth systems and environmental Sciences (Germany: Elsevier). doi:10.1016/B978-0-12-818234-5.00152-8
Langham, J., and Woodhouse, M. J. (2024). The Kestrel software for simulations of morphodynamicEarth-surface flows. JOSS 9, 6079. doi:10.21105/joss.06079
Langham, J., Woodhouse, M. J., Hogg, A. J., Jenkins, L. T., and Phillips, J. C. (2023). Simulating shallow morphodynamic flows on evolving topographies. Proc. R. Soc. A. doi:10.48550/arXiv.2306.16185
Lowenstern, J. B., Wallace, K., Barsotti, S., Sandri, L., Stovall, W., Bernard, B., et al. (2022). Guidelines for volcano-observatory operations during crises: recommendations from the 2019 volcano observatory best practices meeting. J. Appl. Volcanol. 11, 3. doi:10.1186/s13617-021-00112-9
Lupiano, V., Catelan, P., Calidonna, C. R., Chidichimo, F., Crisci, G. M., Rago, V., et al. (2021). LLUNPIY simulations of the 1877 northward catastrophic lahars of Cotopaxi Volcano (Ecuador) for a contribution to forecasting the hazards. Geosciences 11, 81. Available at:. doi:10.3390/geosciences11020081
Machado, G., Lupiano, V., Crisci, G. M., and Di Gregorio, S. (2015). “LLUNPIY preliminary extension for simulating primary lahars - application to the 1877 cataclysmic event of Cotopaxi Volcano,” in Proceedings of the 5th International Conference on Simulation and Modeling Methodologies, Technologies and Applications, (Colmar, Alsace, France: SCITEPRESS-Science and and Technology Publications), USA, July 21-23, 2015, 367–376. doi:10.5220/0005542903670376
Manville, V., Hodgson, K. A., and White, J. D. L. (1998). Rheological properties of a remobilised-tephra lahar associated with the 1995 eruptions of Ruapehu volcano, New Zealand. N. Z. J. Geol. Geophys. 41, 157–164. doi:10.1080/00288306.1998.9514800
Marrero, J. M., Vasconez, F., Espín, P., Ortiz, R., Yepes, H., García, A., et al. (2018). MDTanaliza: understanding digital elevation models when facing gravity-driven flows in a hazard assessment context. Earth Sci. Inf. 12, 257–274. doi:10.1007/s12145-018-0372-4
Martel, C., Andújar, J., Mothes, P., Scaillet, B., Pichavant, M., and Molina, I. (2018). Storage conditions of the mafic and silicic magmas at Cotopaxi, Ecuador. J. Volcanol. Geotherm. Res. 354, 74–86. doi:10.1016/j.jvolgeores.2018.02.006
Mead, S. R., and Magill, C. R. (2017). Probabilistic hazard modelling of rain-triggered lahars. J. Appl. Volcanol. 6, 8. doi:10.1186/s13617-017-0060-y
Mikhail, E. M., Bethel, J. S., and McGlone, J. C. (2001). Introduction to modern photogrammetry. USA: John Wiley and Sons.
Miller, C., Mullineaux, D. R., and Hall, M. L. (1978). Mapa de reconocimientos de Riesgos Volcánicos Potenciales del Volcán Cotopaxi, Ecuador.
Mothes, P., Espín, P., Hall, M., Vasconez, F., Sierra, D., and Andrade, S. D. (2016a). Mapa Regional de Amenazas potenciales del volcán Cotopaxi-Zona Norte. Available at: https://drive.google.com/drive/folders/0B1GypW4co7KbZ0t5NER4OU1obzQ.
Mothes, P., Espín, P., Hall, M., Vasconez, F., Sierra, D., Córdova, M., et al. (2016b). Mapa Regional de Amenazas potenciales del volcán Cotopaxi-Zona Sur. Available at: https://drive.google.com/drive/folders/0B1GypW4co7KbZ0t5NER4OU1obzQ.
Mothes, P., Hall, M. L., Andrade, D., Yepes, H., Pierson, T. C., Gorki Ruiz, A., et al. (2004). Character, stratigraphy and magnitude of historical lahars of Cotopaxi volcano (Ecuador). Acta vulcanol. 16, 1000–1023. Available at: https://www.torrossa.com/en/resources/an/2231623. doi:10.1400/19097
Mothes, P. A., Hall, M. L., and Janda, R. J. (1998). The enormous Chillos valley lahar: an ash-flow-generated debris flow from Cotopaxi Volcano, Ecuador. Bull. Volcanol. 59, 233–244. doi:10.1007/s004450050188
Mothes, P. A., and Vallance, J. W. (2015). “Chapter 6 - lahars at Cotopaxi and Tungurahua volcanoes, Ecuador: highlights from stratigraphy and observational records and related downstream hazards,” in Volcanic hazards, risks and disasters. Editors J. F. Shroder, and P. Papale (Boston: Elsevier), 141–168. doi:10.1016/B978-0-12-396453-3.00006-X
Nourbakhsh, I., Sargent, R., Wright, A., Cramer, K., McClendon, B., and Jones, M. (2006). Mapping disaster zones. Nature 439, 787–788. Available at:. doi:10.1038/439787a
Ordoñez, J., Samaniego, P., Mothes, P., and Schilling, S. (2013). Las potenciales zonas de inundación por lahares en el volcán Cotopaxi. Publicación Inst. Geofísico-Escuela Politécnica Nac. 20.
Pallister, J., Papale, P., Eichelberger, J., Newhall, C., Mandeville, C., Nakada, S., et al. (2019). Volcano observatory best practices (VOBP) workshops - a summary of findings and best-practice recommendations. J. Appl. Volcanol. 8, 2. doi:10.1186/s13617-019-0082-8
Phillips, J., Barclay, J., Cole, P., Johnson, M., Miller, V., and Robertson, R. (2024). Impacts and prospective hazard analysis of rainfall-triggered lahars on St Vincent 2021–22. SP 539, 245–266. doi:10.1144/SP539-2022-313
Pierson, T. C. (1985). Initiation and flow behavior of the 1980 pine creek and muddy river lahars, mount st. Helens, Washington. Geol. Soc. Am. Bull. 96, 1056–1069. doi:10.1130/0016-7606(1985)96<1056:iafbot>2.0.co;2
Pierson, T. C., Daag, A. S., Delos Reyes, P. J., Regalado, M. T. M., Solidum, R. U., and Tubianosa, B. S. (1996). Flow and deposition of posteruption hot lahars on the east side of Mount Pinatubo, July–October 1991. Fire Mud eruptions lahars Mt. Pinatubo, Philipp., 921–950.
Pierson, T. C., Janda, R. J., Thouret, J.-C., and Borrero, C. A. (1990). Perturbation and melting of snow and ice by the 13 November 1985 eruption of Nevado del Ruiz, Colombia, and consequent mobilization, flow and deposition of lahars. J. Volcanol. Geotherm. Res. 41, 17–66. Available at:. doi:10.1016/0377-0273(90)90082-q
Pistolesi, M., Aravena, A., Costantini, L., Vigiani, C., Cioni, R., and Bonadonna, C. (2021). Explosive behavior of intermediate magmas: the example of Cotopaxi Volcano (Ecuador). Geochem Geophys Geosyst 22. doi:10.1029/2021GC009991
Pistolesi, M., Cioni, R., Rosi, M., and Aguilera, E. (2014). Lahar hazard assessment in the southern drainage system of Cotopaxi volcano, Ecuador: results from multiscale lahar simulations. Geomorphology 207, 51–63. doi:10.1016/j.geomorph.2013.10.026
Pistolesi, M., Cioni, R., Rosi, M., Cashman, K. V., Rossotti, A., and Aguilera, E. (2013). Evidence for lahar-triggering mechanisms in complex stratigraphic sequences: the post-twelfth century eruptive activity of Cotopaxi Volcano, Ecuador. Bull. Volcanol. 75, 698. doi:10.1007/s00445-013-0698-1
Pistolesi, M., Rosi, M., Cioni, R., Cashman, K. V., Rossotti, A., and Aguilera, E. (2011). Physical volcanology of the post-twelfth-century activity at Cotopaxi volcano, Ecuador: behavior of an andesitic central volcano. Geol. Soc. Am. Bull. 123, 1193–1215. doi:10.1130/B30301.1
Planet Team (2017). Planet application program interface: in space for life on Earth. Available at: https://www.planet.com/.
Ramírez, J., Vasconez, F. J., López, A., Valencia, F., Quilumba, F., Vásconez Müller, A., et al. (2022). Impact of volcanic ash from Cotopaxi-2015 and Tungurahua-2016 eruptions on the dielectric characteristics of suspension insulators, Ecuador. J. Appl. Volcanol. 11, 7. doi:10.1186/s13617-022-00117-y
Rana, N., Sharma, S., Sundriyal, Y., Kaushik, S., Pradhan, S., Tiwari, G., et al. (2021). A preliminary assessment of the 7th February 2021 flashflood in lower Dhauli Ganga valley, Central Himalaya, India. J. Earth Syst. Sci. 130, 78. doi:10.1007/s12040-021-01608-z
Rocha, J., Duarte, A., Fabres, S., Quintela, A., and Serpa, D. (2022). Influence of DEM resolution on the hydrological responses of a terraced catchment: an exploratory modelling approach. Remote Sens. 15, 169. doi:10.3390/rs15010169
Rodriguez, F., Toulkeridis, T., Sandoval, W., Padilla, O., and Mato, F. (2017). Economic risk assessment of Cotopaxi volcano, Ecuador, in case of a future lahar emplacement. Nat. Hazards 85, 605–618. doi:10.1007/s11069-016-2589-1
Rosen, P. A., Hensley, S., Joughin, I. R., Li, F. K., Madsen, S. N., Rodriguez, E., et al. (2000). Synthetic aperture radar interferometry. Proc. IEEE 88, 333–382. Available at:. doi:10.1109/5.838084
Saalfeld, M. A., Kelley, D. F., and Panter, K. S. (2019). Insight on magma evolution and storage through the recent eruptive history of Cotopaxi Volcano, Ecuador. J. S. Am. Earth Sci. 93, 85–101. doi:10.1016/j.jsames.2019.04.019
Schuster, R. L., NietoThomas, A. S., O’Rourke, T. D., Crespo, E., and Plaza-Nieto, G. (1996). Mass wasting triggered by the 5 March 1987 Ecuador earthquakes. Eng. Geol. 42, 1–23. doi:10.1016/0013-7952(95)00024-0
Shugar, D. H., Jacquemart, M., Shean, D., Bhushan, S., Upadhyay, K., Sattar, A., et al. (2021). A massive rock and ice avalanche caused the 2021 disaster at Chamoli, Indian Himalaya. Science 373, 300–306. doi:10.1126/science.abh4455
Sierra, D., Vasconez, F., Andrade, S. D., Almeida, M., and Mothes, P. (2019). Historical distal lahar deposits on the remote eastern-drainage of Cotopaxi Volcano, Ecuador. J. S. Am. Earth Sci. 95, 102251. doi:10.1016/j.jsames.2019.102251
Smith, G. A., and Lowe, D. R. (1991). “Lahars: volcano-hydrologic events and deposition in the debris flow—hyperconcentrated flow continuum,” in Sedimentation in volcanic settings. Editors R. V. Fisher, and G. A. Smith (Germany: SEPM Society for Sedimentary Geology), 0. doi:10.2110/pec.91.45.0059
Sodiro, L. (1877). Relacion sobre la erupcion del Cotopaxi acaecida el dia 26 de junio de 1877. China: Imprenta Nacional. Available at: https://repositorio.flacsoandes.edu.ec/handle/10469/12657 (Accessed May 16, 2024).
Souris, M. (2006). Ecuador DEMs from digitized topographic maps (1:50000 and 1:100000). Available at: http://www.savgis.org/ecuador.htm (Accessed December 29, 2023).
Tadini, A., Azzaoui, N., Roche, O., Samaniego, P., Bernard, B., Bevilacqua, A., et al. (2022). Tephra fallout probabilistic hazard maps for Cotopaxi and guagua pichincha volcanoes (Ecuador) with uncertainty quantification. JGR Solid Earth 127. doi:10.1029/2021JB022780
Tadini, A., Roche, O., Samaniego, P., Azzaoui, N., Bevilacqua, A., Guillin, A., et al. (2021). Eruption type probability and eruption source parameters at Cotopaxi and Guagua Pichincha volcanoes (Ecuador) with uncertainty quantification. Bull. Volcanol. 83, 35. doi:10.1007/s00445-021-01458-z
Thouret, J.-C. (1990). Effects of the November 13, 1985 eruption on the snow pack and ice cap of Nevado del Ruiz volcano, Colombia. J. Volcanol. Geotherm. Res. 41, 177–201. Available at:. doi:10.1016/0377-0273(90)90088-w
Thouret, J.-C., Antoine, S., Magill, C., and Ollier, C. (2020). Lahars and debris flows: characteristics and impacts. Earth-Science Rev. 201, 103003. doi:10.1016/j.earscirev.2019.103003
Toapaxi, J., Torres, C., Khaled, H., Vera, P., and Méndez, J. (2019). Análisis de la Modelación Numérica del Flujo Producto de una Erupción del Volcán Cotopaxi – Flanco Norte. Rev. Politéc. 44, 7–14. doi:10.33333/rp.vol44n1.01
Vallance, J. W. (2005). “Volcanic debris flows,” in Debris-flow hazards and related phenomena (Germany: Springer), 247–274.
Van Wyk de Vries, M., Carchipulla-Morales, D., Wickert, A. D., and Minaya, V. G. (2022). Glacier thickness and ice volume of the Northern Andes. Sci. Data 9, 342. doi:10.1038/s41597-022-01446-8
Vasconez, F., Sierra, D., Almeida, M., Andrade, D., Marrero, J. M., Mothes, P. A., et al. (2015). Mapa Preliminar de amenazas potenciales del volcán Cotopaxi Zona Oriental. Available at: https://www.igepn.edu.ec/cotopaxi-mapa-de-amenza-volcanica.
Vasconez, F. J., Maisincho, L., Andrade, S. D., Cáceres, B., Bernard, B., Argoti, C., et al. (2021). Secondary lahars triggered by periglacial melting at chimborazo volcano, Ecuador. Rev. Politécnica 48, 19–30. doi:10.33333/rp.vol48n1.02
Vasconez, F. J., Samaniego, P., Phillips, J., Andrade, S. D., Simbaña, E., Nogales, V., et al. (2022a). Evidence of destructive debris flows at (pre-) Hispanic Cayambe settlements, Ecuador. Quat. Int. S1040618222002233, 65–80. doi:10.1016/j.quaint.2022.06.006
Vasconez, F. J., Vásconez, R., and Mothes, P. A. (2022b). Flujos de lodo del volcán Carihuairazo provocados por el terremoto de Ambato, Ecuador, en 1698 y su reconstrucción numérica con perspectivas a futuro. Rev. Geofísica 1, 20. doi:10.35424/rgf.v0i69.937
Vásconez Müller, A., Bernard, B., and Vasconez, F. J. (2024). Near real-time ash cloud height estimation based on GOES-16 satellite imagery: a case study of the 2022-2023 eruption of Cotopaxi volcano, Ecuador. Volcanica 7, 405–419. doi:10.30909/vol.07.01.405419
Vera, P., Ortega, P., Casa, E., Santamaría, J., and Hidalgo, X. (2019). Modelación Numérica y Mapas de Afectación por Flujo de Lahares Primarios en el Drenaje Sur del Volcán Cotopaxi. Rev. Politécnica 43, 61–72. doi:10.33333/rp.vol43n1.971
Vezzoli, L., Apuani, T., Corazzato, C., and Uttini, A. (2017). Geological and geotechnical characterization of the debris avalanche and pyroclastic deposits of Cotopaxi Volcano (Ecuador). A contribute to instability-related hazard studies. J. Volcanol. Geotherm. Res. 332, 51–70. doi:10.1016/j.jvolgeores.2017.01.004
Walker, A. S. (1995). Analogue, analytical and digital photogrammetric workstations: practical investigations of peformance. Photogrammetric Rec. 15, 17–25. doi:10.1111/0031-868X.00002
Wolf, T. (1878). Memoria sobre el Cotopaxi y su última erupcion, acaecida el 26 de junio de 1877, por Teodoro Wolf: Con una lámina y una carta topográfica. Imp. del comercio. Available at: https://archive.org/details/memoriasobreelco00wolf/page/2/mode/2up.
Woodhouse, M., Hogg, A., Phillips, J., Espín Bedón, P., Almeida, S., and Andrade, D. (2016). A model of lahars for hazard assessment. (Puerto Varas Chile). doi:10.13140/RG.2.2.35597.95201
Worni, R., Huggel, C., Stoffel, M., and Pulgarín, B. (2012). Challenges of modeling current very large lahars at Nevado del Huila Volcano, Colombia. Bull. Volcanol. 74, 309–324. doi:10.1007/s00445-011-0522-8
Yu, G., Zhang, M., Cong, K., and Pei, L. (2015). Critical rainfall thresholds for debris flows in sanyanyu, zhouqu county, gansu province, China. QJEGH 48, 224–233. doi:10.1144/qjegh2014-078
Zanchetta, G., Sulpizio, R., Pareschi, M. T., Leoni, F. M., and Santacroce, R. (2004). Characteristics of May 5–6, 1998 volcaniclastic debris flows in the Sarno area (Campania, southern Italy): relationships to structural damage and hazard zonation. J. Volcanol. Geotherm. Res. 133, 377–393. doi:10.1016/S0377-0273(03)00409-8
Keywords: debris flow, lahar, DEM, numerical simulation, glacier, Cotopaxi volcano
Citation: Vasconez FJ, Phillips J, Woodhouse MJ and Andrade SD (2024) Numerical simulation of long-distance debris flows (lahars) on glacier-clad volcanoes: the case of Cotopaxi, Ecuador. Front. Earth Sci. 12:1426088. doi: 10.3389/feart.2024.1426088
Received: 30 April 2024; Accepted: 18 June 2024;
Published: 12 July 2024.
Edited by:
Jacopo Selva, University of Naples Federico II, ItalyReviewed by:
Francesco Neglia, University of Bari Aldo Moro, ItalyLorenzo Borselli, Instituto de geologia–Universidad Autonoma de San Luis Potosi, Mexico
Copyright © 2024 Vasconez, Phillips, Woodhouse and Andrade. This is an open-access article distributed under the terms of the Creative Commons Attribution License (CC BY). The use, distribution or reproduction in other forums is permitted, provided the original author(s) and the copyright owner(s) are credited and that the original publication in this journal is cited, in accordance with accepted academic practice. No use, distribution or reproduction is permitted which does not comply with these terms.
*Correspondence: Francisco J. Vasconez, Zmp2YXNjb25lekBpZ2Vwbi5lZHUuZWM=, ZmoudmFzY29uZXpAYnJpc3RvbC5hYy51aw==