 Qi Wenhua
 Xia Chaoxu
 Zhang Jie
 Nie Gaozhong1,2
 Li Huayue
- 1Institute of Geology, China Earthquake Administration, Beijing, China
- 2Key Laboratory of Seismic and Volcanic Hazards, China Earthquake Administration, Beijing, China
- 3China Earthquake Networks Center, Beijing, China
- 4Anhui Earthquake Agency, Hefei, China
Introduction: Buildings that collapse or are damaged by earthquakes are responsible for the majority of earthquake-related casualties. High-precision building data are the key to improving the accuracy of risk assessments of earthquake disaster loss. Many countries and regions have also proposed varying regional building exposure models, but most of these models are still based on administrative-level (city or county) statistical data; furthermore, they cannot accurately reflect the differences among buildings in different towns or villages.
Methods: Although field investigation-based “township to township” methods can obtain more accurate building inventory data, considering costs and timeliness, remote sensing and other diverse data should be combined to acquire building data. Based on the field survey data of three cities in shanxi Province, combined with Global Human Settlement Layer (GHSL) data, this study is conducted on building inventory data. Data regarding the proportion of each building type and corresponding lethality level in each township are obtained based on the classification of building height, and the overall lethality level at the building level and township level is calculated on this basis.
Results: The fitting results between the calculated results and the field survey results are good, the error is within 0.15, and the fitting R2 values of Xian, Baoji and Ankang are 0.6552, 0.5788 and 0.5937, respectively. Therefore, an earthquake disaster loss risk assessment is conducted based on the building level.
Discussion: The findings indicate that the risk of casualties caused by the same building type can vary by city. Generally, the areas with high disaster loss risk in the three cities are distributed mainly in urban areas; the disaster loss risk in the newly built areas of each city is relatively low. According to the quantitative assessment results for each city, Xi’an has the highest loss risk, while Baoji and Ankang have the same loss risk. Based on the method constructed in this paper, we can realize the quantitative assessment of earthquake disaster loss risk at the building level to better target pre-earthquake emergency preparation and post-earthquake auxiliary decision-making.
1 Introduction
Rapid assessments of earthquake disaster losses are the basis for postearthquake emergency work. Furthermore, assessment methods based on various influencing factors are key to conducting rapid postearthquake assessments. Among these factors, exposure data include the elements at risk of potential losses (UNISDR, 2009),which include the following: personnel exposure data, which refers to the number of people who may be injured or killed during a disaster and may include residents, workers, tourists, rescue workers, etc.; building exposure data, which refers to the number of buildings that may be damaged or collapse during a disaster and may include residential, commercial, and public buildings; infrastructure exposure data, which refers to the number of infrastructures that may be affected during a disaster and may include transportation, communication, power, water supply, sanitation, etc.; economic exposure data, which refers to the economic losses that may be caused during a disaster and may include property damage, production loss, trade loss, etc.; and social exposure data, which refers to the impact that may be caused on social development during a disaster and may include social order, public safety, environmental protection, etc. For earthquake disasters, exposure refers mainly to personnel exposure and building exposure.
The casualties and economic losses caused by earthquakes are mainly due to the collapse and destruction of buildings, when a building is damaged in an earthquake, its structure can change or even collapse, causing injury or even death to the people inside it, therefore, building data are the most commonly used factor in various assessment methods, and the accuracy and detail of building data are particularly important for the accuracy of the final assessment results, for the assessment of earthquake disaster losses, the destruction of buildings is indeed a key factor and a major cause of casualties (Neumayer and Barthel, 2011; Yuan et al., 2008; Xu et al., 2016a). Building data play a crucial role in relevant assessment methods, these data include the structural type, material type, construction year, and use of buildings, which are highly important for assessing the impacts of earthquakes on buildings and predicting possible casualties. In China, due to geographical and climatic factors, earthquake disasters are relatively frequent, and different regions not only have significant differences in natural geographical environments, but also differ greatly in terms of their geographical environments and economic development levels, these factors can affect the construction of building assessment methods, as inaccuracies or lack of detail in building data may lead to inaccurate evaluation results, which may affect decision-making and resource allocation. Therefore, a clear understanding of the building stock is even more urgent for seismically active and disaster-susceptible countries such as China (Allen et al., 2009), where rapid urbanization has led to a massive increase in both the asset value and population that are exposed to a potential seismic hazard (Hu et al., 2010; Yang and Kohler, 2008; Ye et al., 2018).
The use of modern technology such as remote sensing and GIS can improve the accuracy of obtaining and evaluating building data. Generally, current assessment methods are based mainly on official statistics organized by administrative units (e.g., country, province, prefecture, county/district, etc.), which are more commonly used to model building values exposed to future earthquakes; therefore, to enhance the accuracy of seismic risk assessments, aggregated building statistical data need to be spatialized into high-resolution grid levels. New developments in science and technology have enabled researchers to propose and construct many databases for buildings in different regions with different levels of accuracy, such as the Prompt Assessment of Global Earthquake for Response (PAGER) building inventory database (Jaiswal et al., 2010), fatality assessment data is based on human occupancies in different structure types; these data include housing/dwelling units rather than the distribution of building types. The HAZUS building database, which mainly focuses on the earthquake environment in the United States, assigns structural classes to a grid representing occupancy, and the structural classes are directly linked to damage functions (Schneider and Schauer, 2006; De Bono and Mora, 2014). The Global Exposure Database for the Global Earthquake Model project (GED4GEM) dataset includes the country level, which is classified by building type and residential/nonresidential, and the local level, which is classified by single buildings/dwellings level information (Gamba et al., 2012; Dell'Acqua et al., 2013; De Bono and Mora, 2014), and the building stock data published in the United Nations International Strategy for Disaster Reduction (UNISDR) (Geneva and Switzerland, 2009).
Many scholars have carried out various studies on disaster risk assessment. Among them, building vulnerability assessment is a central component that includes hazard identification and accounts for the impacts of social, cultural, economic, and built systems (Aroquipa and Hurtado, 2022; Suwal and Uprety, 2023; Lu et al., 2022). However, when using these data to carry out regional earthquake disaster risk assessments in China, scholars found that the current results and datasets of various buildings are based on statistical data at the national, administrative unit, or kilometer grid levels. Although these data can reflect the overall situation of buildings in a certain region, they cannot provide detailed information about individual buildings, and fine-grained assessments and management for individual buildings are difficult to undertake. There is relatively little data at the building level. Therefore, to improve the accuracy of building data, relevant research has also been carried out.
In recent years, research has been conducted to improve the accuracy of building data. These studies usually focus on building features, such as location, urban/rural classification, type of occupancy, and building typology. A common approach is to use remote sensing images and machine learning techniques to extract building features. For example, the building inventory stock model, which captures important attributes such as geographical location, urban/rural classification, type of occupancy (e.g., residential and nonresidential), and building typology (e.g., wood, concrete, masonry, etc.) (Gunasekera et al., 2015; Yang and Kohler, 2008; Lu et al., 2013; Lin et al., 2020; Xin et al., 2021; Gómez and Zapata et al., 2022; Chrysoulakis et al., 2014; Godefroid and Koedam, 2007; He et al., 2018) and some datasets, such as the Global Human Settlement Layer (GHSL) report by the Joint Research Centre (JRC) and the European Commission’s Science and Knowledge Service, have also been developed to provide more accurate building data. These datasets provide information about the spatial extent of human settlements, building height, and settlement characteristics (Pesaresi and Politis, 2022). Esch et al. (2013); Esch et al. (2017) provides the Global Urban Footprint (GUF) dataset, which is a unique information source for the identification of built-up areas with unique spatial details. The results indicate that the TDM data and the proposed UFP have much potential to provide highly accurate geodata for improved global mapping of human settlements. Wang et al. (2017) based on the Landsat dataset, used the hierarchical object-based texture (HOTex) classification approach to produce a global map of human built-up and settlement extent. Biljecki et al. (2023) considered the state of building information in Open Street Map (OSM) and its ability to serve as a reliable source of such data. They provided a comprehensive study to assess the quality of attribute (descriptive) data of globally mapped building stock, e.g., building function, which are key to many analyses and simulations in the built environment. We examined three aspects, namely, completeness, consistency, and accuracy (Biljecki et al., 2023). Paprotny et al. (2020) used building footprints (polygons) from the Open Street Map as a starting point and utilized high-resolution elevation models of 30 European capitals and pan-European raster datasets to construct a Bayesian network-based model that can predict building height. D’Amato et al. (2020) used the data in the Da.D.O. database to presented a seismic risk analysis of masonry buildings based on damage data of L’Aquila 2009 earthquake, and the loss curves proposed permits to economically assess the effectiveness of some local and very frequent interventions (such as chains/ring beams), and their consequent impact in seismic risk mitigation. Laguardia et al. (2023) based on the buildings stock of 12,016 Reinforced Concrete (RC) buildings of Da.D. O. database to propose vulnerability, fragility, and loss curves, as well as an Expected Annual Loss (EAL) assessment. The obtained results highlight that the completed database allows a more reliable seismic risk assessment, even if resulting EAL is poorly influenced by reference municipality assumed for undamaged buildings estimation (Laguardia et al., 2023). Tatangelo et al. (2022) compare the damage of buildings stocks archived after earthquakes survey activities based on the data of L'Aquila 2009 and Emilia 2012 earthquakes, which are available in the web-gis Da.D.O platform,the results show that, with reference to the two masonry buildings stocks considered, the higher contribution to the (EALtot) is given by the damage level D3, that may be considered as the life safety limit state. In the case analyzed, the corresponding EALD3 results almost equal to 1/3 of EALtot. Among these models, the GHS-BUILT-C spatial raster datasets delineate the boundaries of human settlements at 10 m resolution and describe their inner characteristics in terms of the morphology of the built environment and functional use (Schiavina et al., 2022). Combined with building function and building height results, these methods classify two building types, residential and nonresidential, into 10 types. This method may also support earthquake disaster risk assessments based on these data.
For earthquake disaster risk assessments, detailed and accurate basic data, such as building and population data, have a significant impact on the final assessment results. Currently, an effective method is to obtain more detailed and accurate assessment and calculation results through field surveys. Although the results can be more accurate, this method has significant limitations in time and costs, resulting in a certain lag. Therefore, the use of relevant research results for rapid and accurate disaster risk assessments is particularly important. As the construction methods, construction dates, and construction quality of each type of building vary significantly, the actual mortality levels of different types of buildings also differ. Therefore, in this study, the traditional seismic disaster risk assessment method is improved; a quantitative assessment method is built based on the mortality rate of each intensity represented by the lethality level; mortality levels are assigned to different types of buildings based on GHSL building data and field survey results; high-precision population data are combined; a high-precision seismic disaster risk assessment method is constructed; and the accuracy and applicability of the results are improved.
2 Method and data
2.1 Data
One type of data used in this study is field survey data collected in Xi’an, Baoji, and Ankang cities in shanxi Province. The survey used a “township-to-township” approach for which 2–3 representative administrative villages (the selection of sampling survey points follows principles such as economic level, population size, geographical environment, and location distribution, etc.) were selected in each township. In total, 46 township units were surveyed in Xi’an, 34 in Baoji, and 28 in Ankang, with 138, 101, and 84 village-level survey points, respectively. Based on field surveys, the lethality levels and population proportion coefficients of each survey point were obtained, which enabled calculations of the overall lethality level of each township. The distribution of survey points in each city is shown in Figure 1. For data collection, we mainly adopt the method of field investigation, we conduct field investigations on each village, with buildings as the main content of the investigation. Firstly, based on the number, type, and proportion of buildings in the village, we conduct actual surveys on each type of building, including the construction year, construction materials, construction quality, etc., the detailed investigation parameters mainly include the type of building construction measures (with or without ring beams and structural columns), foundation type, roof type, building materials, wall bonding materials, building height, construction year, building attachments, site conditions, geographical and geomorphic environment, distance from fault zones, and a series of other factors. We record and analyze detailed information about each type of building, different construction years and materials have an impact on the seismic resistance of buildings. Similarly, the construction method will directly affect its ability level, for example, for brick concrete structures, buildings with structural measures such as ring beam structural columns have a lower lethality level than those without ring beam structural columns. Similarly, there are significant differences between prefabricated slab roofs and cast-in-place roofs. Based on this situation, we need to divide and record different types of buildings based on various factors during the on-site investigation process, calculate the lethality level of each type of building separately, and combine the proportion data of each type of building to obtain the lethality level of each type of building. This lethality level is a quantitative expression of the seismic resistance of the building. The results indicate that the selected survey points are relatively reasonably distributed and generally cover the main distribution areas of faults. Although some districts and counties were not surveyed, the current number of surveys and their locations provide a good representation of the basic characteristics of each city.
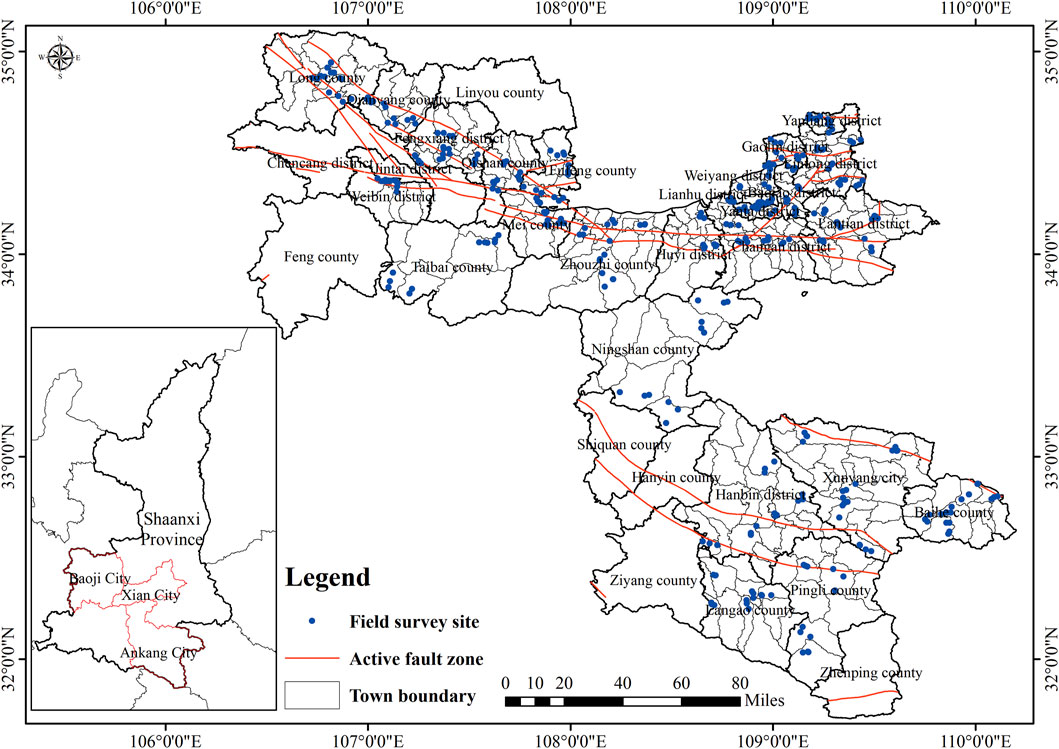
Figure 1. Field survey points in Xi’an, Baoji and Ankang.
As shown in Attach file 1, In fact, through field investigations in three cities, it was found that there are certain patterns in the types and regional distribution of buildings, and there are differences in the types and quality of buildings between urban and rural areas. In general, urban areas are mainly characterized by frame structures and fortified brick and concrete structures, while buildings in rural areas are mainly constructed with brick and concrete structures, and are mainly composed of undefended brick and concrete structures. At the same time, we also found that there are significant differences in the height of buildings in different regions. For example, buildings in urban areas generally have a height of over 6 m (such as reinforced concrete structures), and frame structures are generally high-rise buildings exceeding 30 m. In rural areas, due to the lack of reinforced concrete structures, buildings are mostly single story buildings with a height generally below 6 m. The detailed investigation results are summarized in Appendix 1.
The other data are the building data of the GHSL, which are the spatial raster dataset depicts the spatial distribution of the building heights as extracted from the filtering of a composite of global digital elevation models (DEM) and the filtering of satellite imagery using linear regression techniques (Pesaresi and Politis, 2023). The used input DEMs are the ALOS World 3D–30 m (AW3D30, 2006–2011) and the Shuttle Radar Topography Mission 30 m (SRTM30, 2000). The building heights extracted from these sources are updated using the support of the shadow markers extracted from the Sentinel2 image data composite of the year 2018 (GHS-composite-S2 R2020A). The morphological settlement zone (MSZ) delineates the spatial domain of all the human settlements at the neighboring scale. The objective is to fill the open spaces that are surrounded by large patches of built space. The MSZ, open spaces, and built spaces basic class abstractions are derived by mathematical morphology spatial filtering (opening, closing, regional maxima) via the BUFRAC function. The building height information is downscaled to a 10 m resolution by using the connected components of the BUMARKERS as spatial units. This approach enables the different building heights in residential and nonresidential areas to be obtained. The specific classification results are shown in Table 1 (Pesaresi et al., 2021).
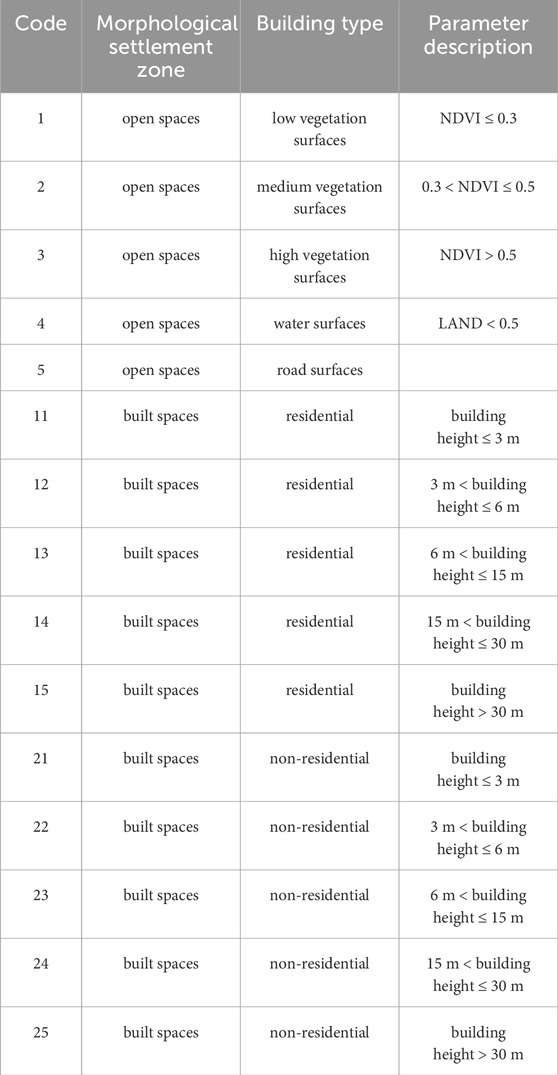
Table 1. The GHSL building data classification results.
2.2 Calculating method of the regional lethality level
Different building types have different probability levels of causing casualties after an earthquake. Even for the same types of buildings, due to the construction methods, construction materials, and construction ages, the lethality levels are different. The factors causing death in earthquakes are complex, which may be caused by building damage, secondary disasters, or damage to building ancillary facilities. However, for a certain intensity, these complex factors are reflected in the mortality rate. Fatality mainly refers to the comprehensive possibility of causing death in a certain area after an earthquake. In order to quantify this comprehensive possibility, we use the comprehensive mortality rate under a certain intensity to represent it, that is, different levels of lethality correspond to a set of different sub intensity mortality rates.
The likelihood of casualties caused by buildings within the same earthquake intensity varies due to the different seismic capabilities of various types of structures, which means that buildings also have differentlethality levels. If the lethality level of the area can be obtained during field investigation, then after the earthquake, the possible number of casualties can be calculated based on the intensity range of the area, combined with the mortality rate and population data corresponding to its lethality level.
A region possesses a definitive level of lethality, primarily ascertained through quantitative assessments that encompass buildings, geographical environment, and other pertinent factors. Our previous research endeavors were grounded in a vast array of data and intricate calculations, enabling us to determine the lethality levels of various building types and establish the respective ranges within which these levels fluctuate. For example, the lethality level of brick-concrete structures is consistently found to lie within a range of 0.3–0.67. Consequently, during field investigations, if a building is identified as a brick-concrete structure, its lethality level can be expected to fall within this predetermined range. To pinpoint the exact lethality level, we have devised a comprehensive model that incorporates multiple influencing factors, including construction techniques, building materials, age, roof type, and so on. It is important to note that even among buildings of the same type, the lethality level can vary due to differences in materials and other sources. The specific methodology employed for calculating these variations is outlined in the subsequent formula. The lethality level range of different types of buildings is mainly based on the author’s previous research results (Xia et al., 2020; Xia et al., 2021; Xia et al., 2022a; Xia et al., 2022b; Xia et al., 2023a; Xia et al., 2023b).
Based on the interval range of each type of building and the influence weight ratio coefficient of each influencing factor, a calculation method is constructed, as shown in Equation 1:
Among them, LLactual is the actual lethality level of a certain type of building, LLmax is the upper limit of the lethality level interval for a certain type of building, LLmin is the lower limit of the lethality level interval of a certain type of building, and n is the type of factor affecting the lethality level of a certain type of building, which is selected according to the actual conditions of different types of buildings. wi is the weight ratio coefficient of the ith type of influencing factor in the building, and the selection is based on the actual situation of the building. wij is the weight ratio coefficient of the jth building structure among the ith type of influencing factor in the building, and it is selected based on the actual situation of the building.
Based on the lethality level of various types of buildings and the proportional data of each type of building, a calculation model for the overall lethality level of the survey area is established, as shown in Equation 2:
where LLall is the lethality level of the region based on buildings, LLactual-i is the actual lethality level of the ith type of building in the region, and Pi is the proportion of the ith type of building.
The lethality level of the town-level calculation method is constructed based on the population proportion coefficient, as shown in Equation 3:
where LLtown is the overall lethality level of the township administrative unit, LLtownship is the lethality level in the township area, LLcountryside-i is the lethality level of the ith administrative village in the administrative unit of the township, α is the ratio coefficient of the population of the town to the population of the whole township, β is the ratio coefficient of the population of the administrative village to the population of the whole town, and α + β = 1. The parameter γi is the ratio coefficient of the population of the ith administrative village to the total population of the administrative village.
Based on previous research results, the range of lethality levels for various types of buildings has been defined, and the weight ratios of various influencing factors on lethality levels have been quantified. Therefore, in the process of field investigation, based on the survey results of various influencing factors, we used Equation 1 to calculate the actual lethality level of a certain type of building at the survey site. Based on this method, we calculated the lethality level of various types of buildings at the survey site. Using the proportion data of various types of buildings obtained from the survey, we calculated the lethality level of the survey site based on Equation 2. Since each township is sampled from 3 to 4 villages, the overall lethality level of the township is calculated using Equation 3 on the basis of obtaining the overall lethality level of each survey site.
2.3 Method for assigning the lethality level of the GHSL building data
The GHSL supports housing and urban development, poverty reduction, sustainable development, climate change, crisis management, global disaster risk reduction initiatives (DRRs) and regional analysis (Pesaresi et al., 2015; Schiavina et al., 2022). The accuracy, drivers, dynamics, and impacts of the human settlement layer are essential. A key component in this context is the availability of an up-to-date and spatially consistent map of the location and distribution of human settlements. Among them, global remote sensing technology and the application of big data provide powerful support for urban research. The use of high-resolution satellite images and advanced data processing techniques enables urban features such as buildings, roads, and green spaces to be accurately extracted and analyzed. These data can be used to study issues such as urban expansion, land use changes, and population distribution, helping us better understand the driving factors and dynamics of urban development (Martino Pesaresi, 2016). We can assign a lethality level to each type of building based on the actual survey results and information such as the building type and height in each township. On this basis, the overall lethality level of the township is calculated by combining the proportional data of various types of buildings, as shown in Equation 4:
where LLall is the overall lethality level of a town, LLi is the actual lethality level of the ith type of building (code 11–25) within the town, and Pi is the proportion of the ith type of building within the town.
3 Results
Based on the data, a total of 15 types of areas were classified, of which codes 1–5 were open spaces, mainly referring to nonbuilding information such as vegetation, water bodies, and roads. Codes 11–15 and 21–25 were building spaces, divided into residential and nonresidential areas and according to five levels of building height. By analyzing the distribution of buildings, we could conduct a statistical analysis and classification of buildings in various townships. Based on the area of each building type, the proportion of each building type within the scope of each township can be calculated, and the corresponding regional lethality level can be obtained.
As shown in Figure 2, the distributions of buildings in the three cities have relatively distinct characteristics, which are closely related to geographical features and the level of economic and social development. Among them, the main landform of Xi’an (area A in Figure 2) is composed of the Qinling Mountains and Weihe Plain, which have very clear boundaries. The differences in landforms in Xi’an have led to an uneven distribution of buildings. The buildings in Xi’an are mainly concentrated in the northern plains, such as the Lianhu district, Beilin district, and Xincheng district within the urban area, while the number of buildings in the southern region of Xi’an is relatively small and also dominated by hills and mountains. From the perspective of building types, those in the urban area of Xi’an are complex, regardless of whether they are in residential or nonresidential areas. These buildings mainly have heights less than 30 m, especially those within the urban area, where building heights are less than 15 m. The areas with heights above 30 m in Xi’an are mainly concentrated in the peripheral areas of Xian city, such as Weiyang district, Yanta district, and Changan district. This distribution is also in line with the urban development law. Among these areas, residential areas are widely distributed and account for a large proportion, mainly in the urban center and surrounding areas. The buildings in nonresidential areas are concentrated mainly in the city’s main transportation hubs, commercial centers, and some important administrative areas. In addition, some buildings are quite tall, which may be related to the acceleration of urbanization in recent years.
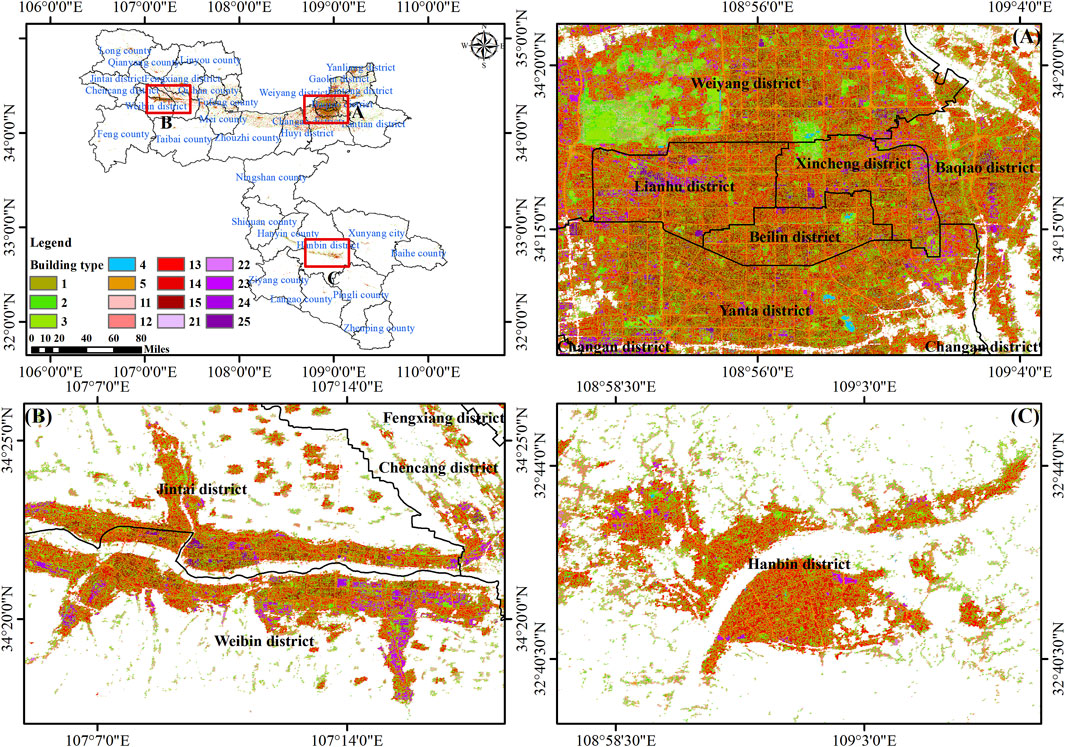
Figure 2. Distribution of different types of buildings in Xi’an, Baoji and Ankang [(A): Xian city; (B) Baoji city; (C) Ankang city].
Baoji city (area B in Figure 2) is surrounded by mountains to the south, west, and north and expands eastward in an open-angle trough shape with the Weihe River as the central axis. Thus, it is defined by its terrain and landforms. In terms of distribution, buildings in Baoji city are mainly concentrated in flat areas along the Weihe River in the districts of Weibin, Jintai, Qishan, and Fufeng, while buildings in other areas, such as Qianyang and Linyou counties, are primarily concentrated in township areas, though these buildings are relatively few in number. In terms of building type distribution, residential buildings are relatively scattered and are mainly concentrated in city centers and surrounding areas, while nonresidential buildings are mainly concentrated in important administrative areas, industrial parks, and transportation hubs. In addition, some buildings show a height trend, which may be related to the accelerated urbanization process in Baoji city in recent years. The buildings are mainly below 15 m, with relatively few buildings above 15 m. The distribution is also relatively scattered, with a concentrated distribution in the peripheral areas of the Weibin and Chencang districts.
The landform of Ankang city (area C in Figure 2) is characterized by high mountains in the south and north, and the city has a river valley basin in its center. The terrain and landforms are complex and diverse, leading to significant regional differences in building distribution. In the plains and river valleys, the building distribution is relatively dense, as is the case in the urban areas of the Hanbin district and Hanyin district; among them, residential buildings are relatively concentrated in the city center and surrounding areas, and nonresidential buildings are mainly found in important administrative areas, commercial centers, and transportation hubs. In mountainous areas, the building distribution is relatively sparse, the buildings heights are typically below 15 m, with relatively few buildings above 15 m, and the distribution is also relatively scattered and concentrated mainly in the peripheral areas of the Hanbin district.
As shown in Figure 3, a statistical analysis was conducted on the proportions of buildings of different heights in each township. An analysis of the building data of each township in the three cities indicated that there are relatively obvious characteristics in the building types and proportions of each township, especially in the distribution of buildings of different heights. In Xi’an city, the proportion of each building height is relatively even, and the city mainly consists of buildings below 30 m. Each township has buildings of each height, but the proportions may vary, and the number of townships with buildings above 30 m is relatively high. In Baoji city, the distribution of building heights in each township shows a decreasing trend as the building height increases; compared to that in Xi’an city, the number of buildings above 15 m in each township is relatively small. In contrast, most of the buildings in Ankang’s townships are below 6 m, though some are above 15 m; very few of these townships have buildings above 30 m, which is distinct from both Xi’an and Baoji.
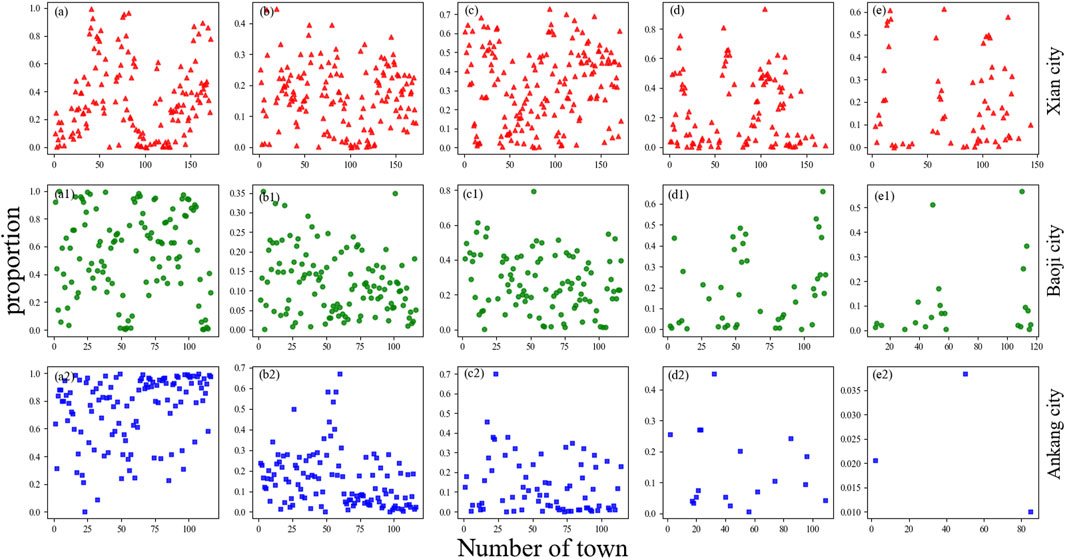
Figure 3. The proportions of buildings of different heights in various towns in Xi’an, Baoji and Ankang [(a,a1,a2): building height ≤ 3 m, (b,b1,b2): 3 m < building height ≤ 6 m, (c,c1,c2): 6 m < building height ≤ 15 m, (d,d1,d2):15 m < building height ≤ 30 m, (e,e1,e2): building height >30 m].
So considering the height characteristics of buildings, we conducted corresponding statistical analysis on the height data of buildings in each township of the three cities. As a result, it can be found that although the number of townships varies in the three cities, the proportion of buildings at different heights shows a relatively consistent pattern. There are a large number of townships in Xi’an (Figures 3A–E), and the proportion of buildings with a height of over 15 m is relatively small. The height of buildings in Xi’an is concentrated between 6 and 15 m (as shown in Figures 3B, C), while the height of buildings in Baoji is concentrated between 3 and 15 m (as shown in Figures 3a1, b1). On the other hand, the height of buildings in Ankang City is generally below 15 m, and the number of townships with a height above 15 m is relatively small, with only a few townships having this type of building. (Including Xi’an City, Baoji City, and Ankang City, Figures 3A–E; Figures 3a1–e; Figures 3a2–e2, with the horizontal axis representing the number of townships in each city and the vertical axis representing the proportion of buildings of different heights in each township).
As shown in Figure 4, the trend of the proportion of buildings of different heights in the three cities becomes even more evident. For example, the proportions of buildings below 3 m in Xi’an, Baoji, and Ankang are 29.63%, 55.34%, and 71.71%, respectively, showing a clear upward trend; moreover, the distributions of other types of buildings generally follow a downward trend. In fact, the distribution characteristics of buildings in each city reflect certain real-world situations; the building heights in Xi’an are mainly between 6 and 15 m, while buildings below 3 m are also present in large numbers and are located mainly in older urban areas and remote rural regions. In Baoji, buildings under 3 m are dominant, but buildings between 6 and 15 m account for 22.86%. On the other hand, in Ankang, buildings below 3 m are the most common, and the proportion decreases as the building height increases. The proportion of buildings below 3 m is much greater than that at other building heights.
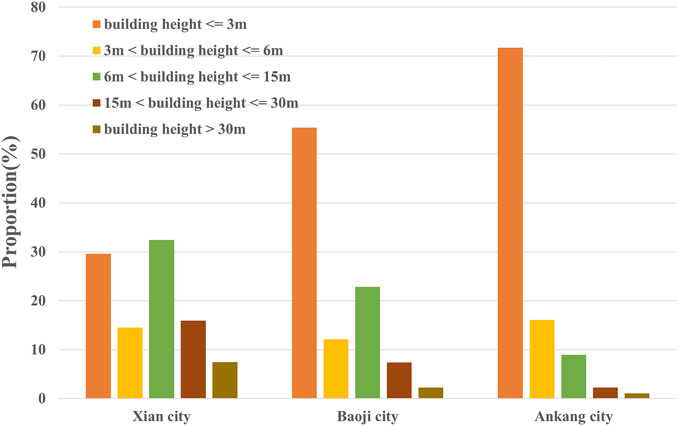
Figure 4. The proportions of buildings of different heights in the three cities of Xi’an, Baoji and Ankang.
Based on the proportion data of buildings of different heights, we obtained the basic distribution characteristics of buildings in each city. Basically, buildings in urban areas are mainly taller than 6 m, while buildings in rural areas are mainly shorter than 6 m. The proportion of buildings below 6 m in urban areas is relatively small, and they are mainly distributed in old urban areas. This distribution characteristic is also in line with the basic characteristics of urban development. To achieve a subdivision of buildings based on residential and nonresidential areas and on building height and other information, we can calculate the mortality level of buildings based on the results, especially field survey results. Thus, determining the mortality level assignment of GHSL data is the key to carrying out building-level risk assessment.
3.1 Lethality level assignment of GHSL data
Based on the results of field surveys, we found that the same building types can have different lethality levels in different cities and even in different districts and towns in the same city; therefore, based on the results of field surveys, we combined two types of data and calculated the lethality levels of each type of building at the township level. Specifically, we evaluated and assigned lethality levels to different building types based on information such as building height, usage, and structural type. Table 2 shows the lethality levels of buildings of different heights in various towns. These data can help us better understand and assess the risk status of buildings in different regions, providing a basis for formulating more scientific and reasonable disaster prevention and mitigation measures. Due to the influence of different building types, materials, service lives, and other factors, the assignment of lethal levels is subjective and uncertain. Therefore, when conducting risk assessments, it is necessary to consider a variety of factors, including field survey data, building types, geographical environments, and historical disaster data, to ensure the accuracy and reliability of the assessment results.
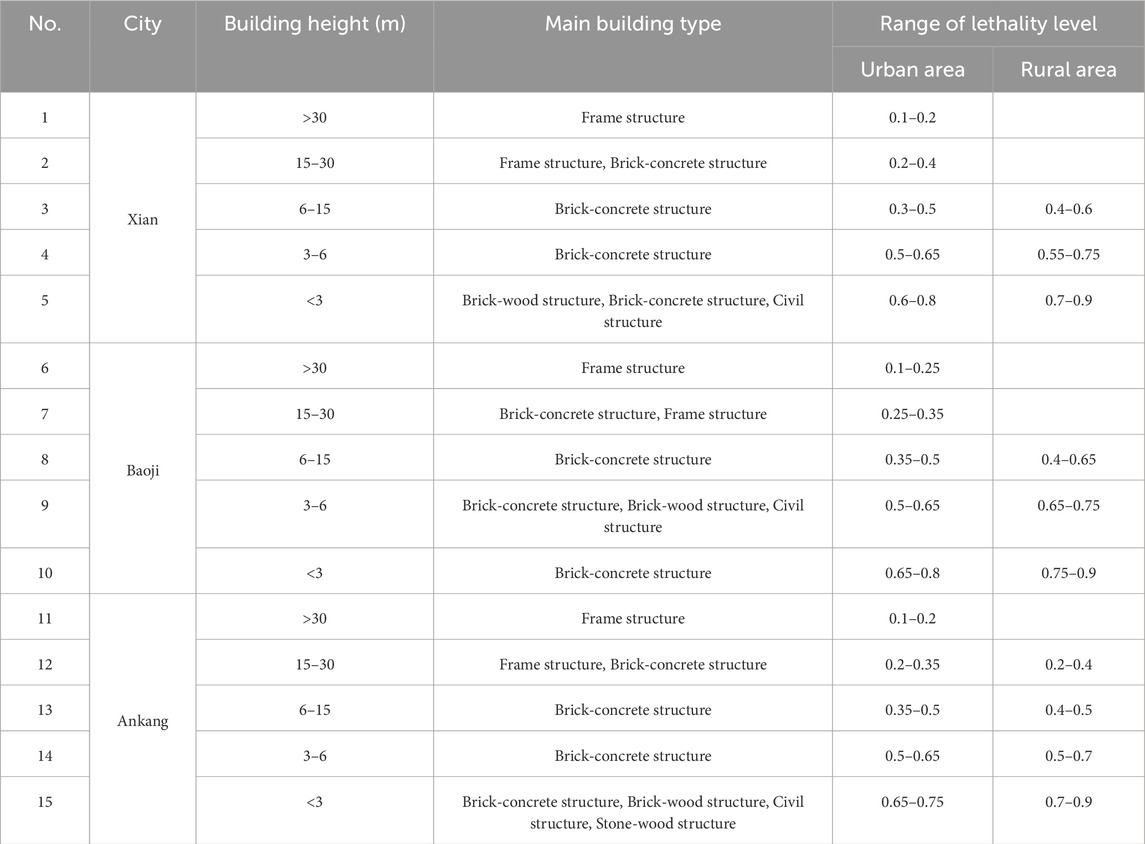
Table 2. Assignment range of lethality level for different height buildings in different regions of Xi’an, Baoji and Ankang.
For the assignment intervals of lethality levels for buildings of different heights in different cities in Table 2, we mainly evaluated and calculated based on two types of data. Firstly, during the field investigation process, we calculated the lethality level for each type of building and also obtained the height range of different types of buildings. Based on the height range data of the two types of data, we can determine the building type of different building height data, and thus determine the lethality level of different building heights, due to the lethality level of buildings surveyed in the field is a definite value, while GHSL data only contains information on building height, based on building height, it can only be determined that it belongs to a certain type of building (such as frame structures with a height of over 30 m). However, based on the results of the field survey, it can be found that different buildings, even if they are all frame structures, are affected by building materials, age, etc., and their specific lethality level levels vary. Therefore, based on the results of the field survey and height data, we have provided an interval range for each type of building. In the specific calculation process, we will combine the results of the field survey for specific analysis.
Based on the results of field investigations, we found that the quality of buildings in the urban area of Xian is greater than that in other regions or cities, so the corresponding lethality level is relatively low. Generally, in urban areas, buildings with heights less than 6 m are brick-wood structures or unfortified brick-concrete structures, buildings with heights of 6–30 m are fortified brick-concrete structures, and buildings with heights greater than 30 m are steel‒concrete structures or frame structures. In rural areas, buildings with heights less than 6 m are mainly brick-concrete structures, brick-wood structures, civil structures, and stone-wood structures, and buildings with heights of 3–6 m are generally brick-concrete structures, which are divided into fortified brick-concrete and unfortified brick-concrete structures. Building quality also differs by region. Single-story buildings in rural areas of Xian, including brick-wood structures, brick-wood structures, and civil structures, are generally unfortified brick-concrete structures. In the rural areas of Baoji city, single-story buildings are mainly nonfortified brick-concrete and brick-wood structures, while buildings below 6 m in Ankang city include brick-concrete, brick-wood, and civil structures, with brick-wood and nonfortified brick-concrete structures predominating, as shown in Table 2 (Among them, Brick concrete structure refers to the use of bricks or blocks for the vertical load-bearing walls in buildings, and reinforced concrete structures for the structural columns and horizontal load-bearing beams, floor slabs, roof panels, etc. That is to say, brick concrete structure is a structure that is supported by a small amount of reinforced concrete and most of the brick walls, Frame structure is a structure composed of many beams and columns to bear the entire load of a building. For high-rise civil buildings and multi story industrial factories, the load-bearing capacity of brick walls can no longer meet the requirements of heavy loads, and frames are often used as load-bearing structures, Brick wood structure refers to a building structure in which the walls, columns, etc. of the vertical load-bearing structure are built with bricks or blocks, and the floor slabs, roof trusses, etc. are built with wooden structures, Civil structures mainly refer to various building forms in which bamboo strips are used instead of steel bars, clay (sometimes mixed with straw) is used instead of concrete to compact the walls of houses, wood beams are used as beams, and tiles or hay are used as covers. The main construction materials include bamboo, wood, rammed earth, straw, hay, adobe bricks, and tiles, which are commonly used structural forms for rural residential houses in China.).
In the three cities, most buildings above 15 m are concentrated in urban areas, and these buildings account for a relatively large proportion, generally in residential areas. Buildings between 6–15 m are mainly 3–5 stories, while those between 3–6 m are mainly two stories and found in residential areas. The building types are mainly brick-concrete structures with various structural forms. Based on field survey results, brick-concrete structures in the urban areas of Xian are defined by girders and bracket columns; the proportion of such structures is relatively large, especially in urban and rural areas. Although the buildings in rural areas are also brick-concrete structures, most of these are unfortified, i.e., they do not have bracket columns or girders; however, some structures do have girders but not bracket columns. This situation creates significant differences among buildings of the same type in urban and rural areas. For buildings less than 3 m in height, the corresponding building types are more complex. The single-story buildings in urban areas are mainly unfortified brick-concrete structures without floor beams, while the single-story buildings in rural areas comprise three types, including unfortified brick-concrete structures, brick-wood structures, and civil structures. Therefore, based on the classification results of the building height and field survey results, the lethality level range of each building type was determined, and the overall lethality level of each region was calculated based on the mid-range. We used field surveys to obtain the lethality levels of 108 townships in three cities, as shown in Table 3. The lethality level results of the urban and rural areas in each township were combined with the population ratio coefficients of the two areas to calculate the overall lethality level of each township. Generally, the lethality level of urban areas is lower than that of rural areas, and the population ratio coefficient of urban areas is greater than that of rural areas. Furthermore, based on the building ratio data of each township and the lethality level of each type of building, we used GHSL data to obtain the overall lethality level of each township. Based on these two results, we conducted a trend analysis on the lethality level of each township.
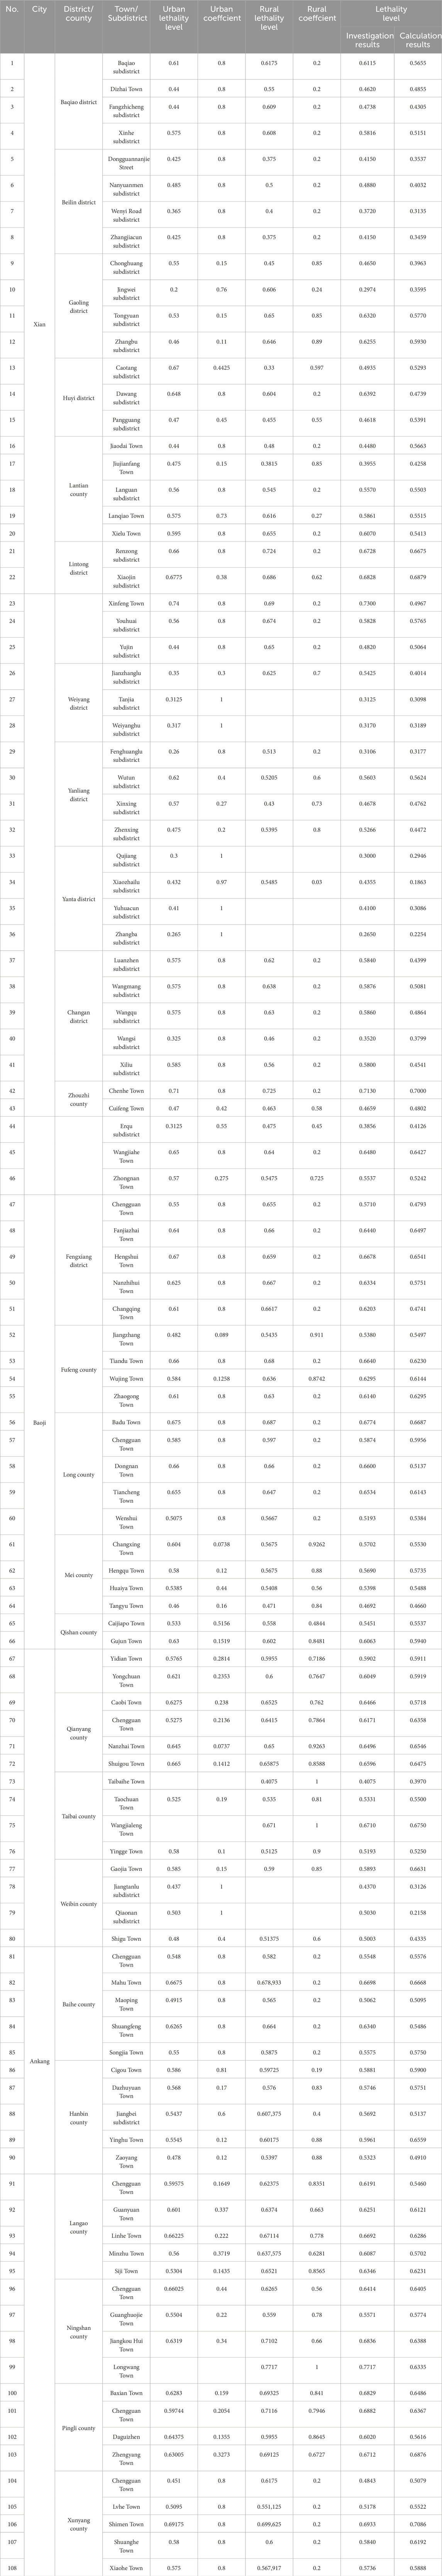
Table 3. Lethality levels of 108 townships in Xi’an, Baoji and Ankang.
As shown in Figure 5, the distribution characteristics of the lethality level of buildings in the three cities are similar to the results of field surveys. The lethality level in urban areas is relatively low. Furthermore, for townships, the lethality level in town areas is lower than that in rural areas. Generally, the lethality level of urban areas is less than 0.4, while the rural areas is concentrated in the range of 0.5 and above. Moreover, we analyzed the distribution of lethality levels in areas adjacent to the three participating cities, these areas included Zhouzhi County in Xian city, Mei County in Baoji city, and Ningshan County in Ankang city, although the types and proportions of buildings in these counties are not exactly the same, the lethality levels of buildings in adjacent areas are in the same range; these findings can be used to prevent errors in adjacent areas that occur due to simple administrative divisions.
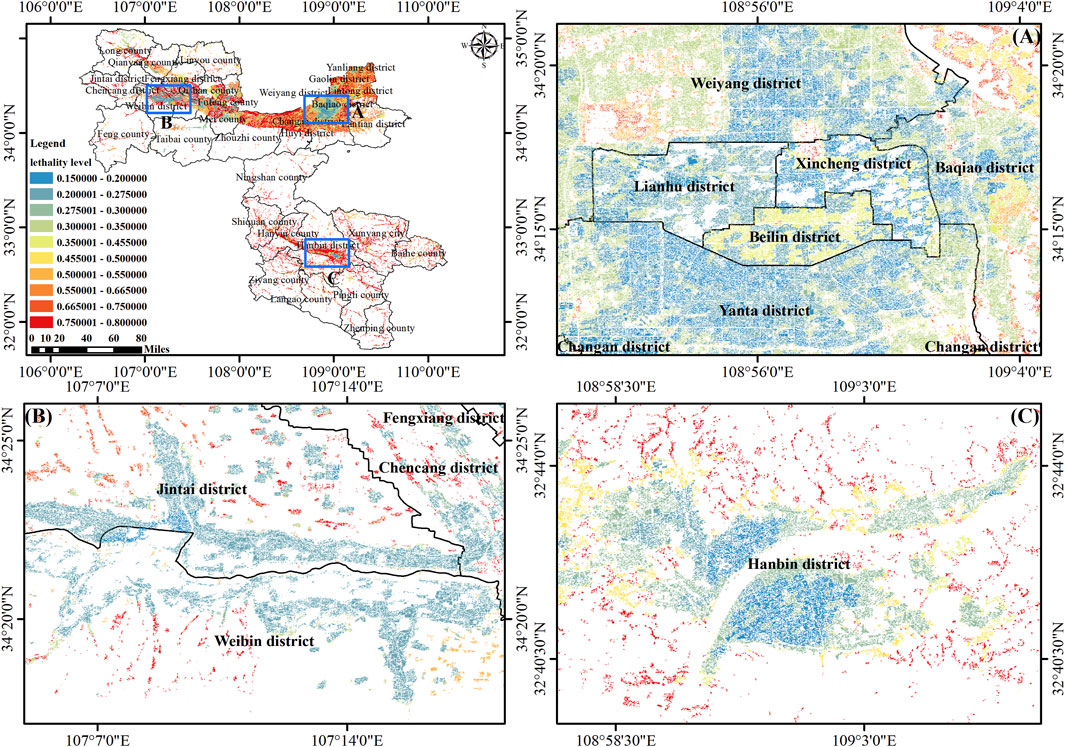
Figure 5. Results of the distribution of lethal levels of different types of buildings in three cities [(A): Xian city; (B) Baoji city; (C) Ankang city].
As shown in Figure 6, the R2 values between the calculated results and the field survey results are good, and the R2 values are all above 0.5. The R2 values of the field survey and the calculations for 46 towns in Xi’an city are shown in Figure 6A, the R2 values are not significantly different from those of the field survey results, and the overall fitting result R2 is 0.6552; as shown in Figure 6B, the R2 value of the fitting results for 34 towns in Baoji city is 0.5788, except for some towns with significant differences, and the difference between the calculation results and the field survey results is within an acceptable range; as shown in Figure 6C, the R2 values of 28 towns in Ankang city are relatively concentrated, and the R2 value is 0.5937. We can also find that for field investigation results, if calculations can be made based on remote sensing data on the basis of field investigation results, it can to some extent ensure the accuracy of the results, and the error is relatively small.
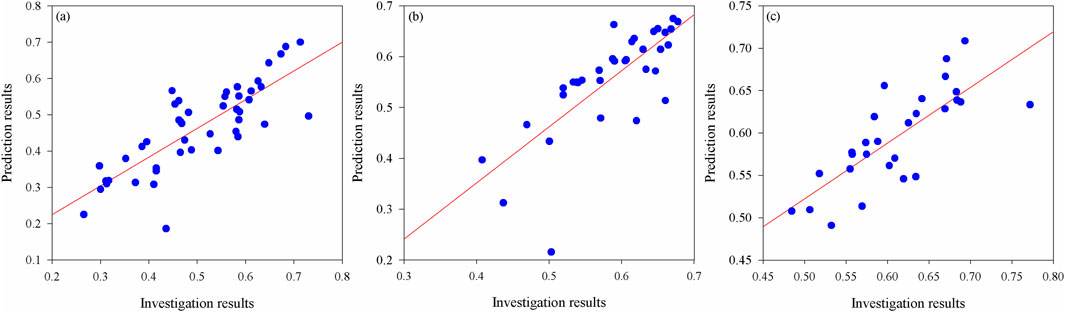
Figure 6. Fitting analysis of the results of field surveys on the lethality level and calculated results in three cities. [(A): Xi’an, (B): Baoji, (C): Ankang].
As shown in Figure 7, a comparison of the calculated results for the three cities with the field survey results. Figure 7A shows a comparison of 46 towns in Xi’an city, the calculated results for 24 towns are generally lower than the survey results. Figure 7B shows a comparison of 34 towns in Baoji city, the calculated results is also generally lower than the survey results, 16 towns have a calculated result lower than the survey result. Figure 7C shows a comparison of 28 towns in Ankang city, the calculated result is generally lower than the survey results; nine towns have a calculated result lower than the survey result. Thus, based on building information alone, for towns, the calculated lethality level is generally lower than the survey result lethality level. Although in some cases the calculated result is higher than the survey result, for each town, the error of the calculated result higher than the survey result is relatively large, mainly concentrated in the range of 0.15, while the error of the calculated result lower than the survey result is relatively small, mainly concentrated in the range of 0.05. As shown in Figure 7D, the calculated results are almost always greater than the survey results, and the error rates are within 15%, though most are actually within 10%. However, when the calculated results are lower than the survey results, their maximum error rate can reach approximately 50%, though most are actually within 10%–15%.
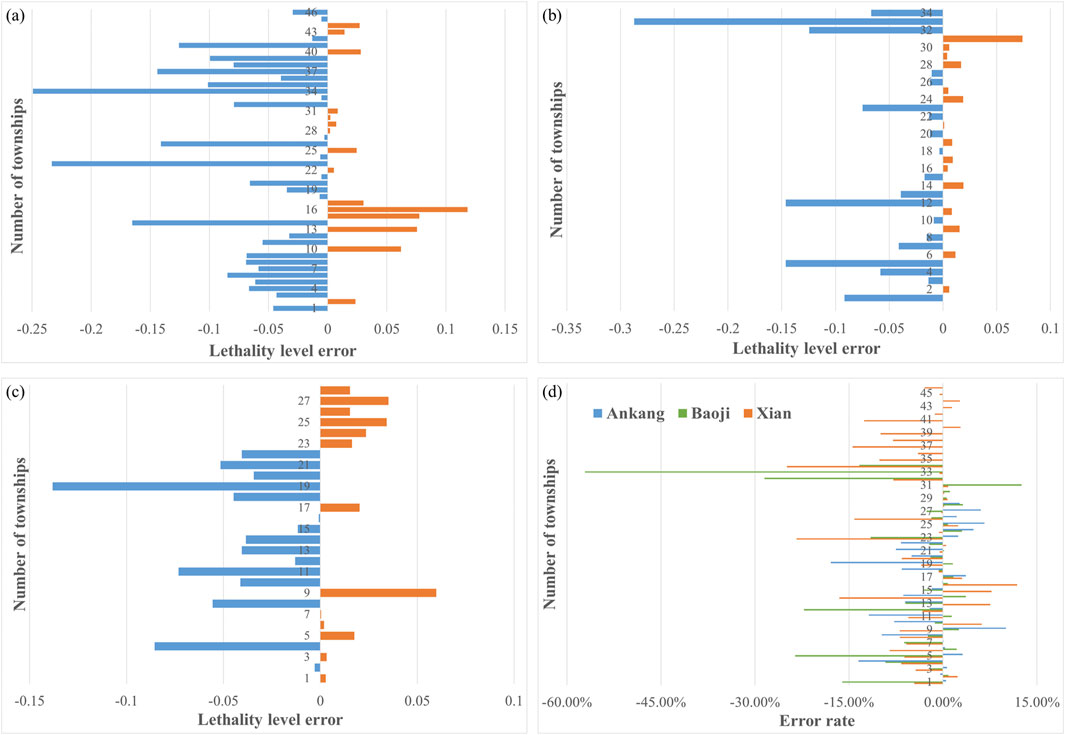
Figure 7. Error analysis of the calculated and field survey results of lethality levels in each district and county of the three cities. (A): Xi'an city, (B): Baoji city, (C): Ankang city, (D): overall of the three cities.
As shown in Figure 8, the distribution of lethality levels in three cities was obtained based on GHSL data and field survey methods. Among the three cities, the areas with high lethality levels are mainly distributed in the northern region of Baoji city, the southern region of Ankang city, and the junction area of the three cities, including Zhouzhi County, Taibai County, and Ningshan County. The lethality levels in the junction area of the three cities are similar, and the distribution is not significantly affected by administrative boundaries. As shown in Figure 8A, based on the field survey results, the areas with low lethality levels are mainly distributed in urban areas, and these levels are much lower than those in rural areas, especially for Xi’an city and Baoji city. Along the east edge of the Qinling-Huaihe fault, the lethality levels are low. As shown in Figure 8B, based on the calculated results of the GHSL data, the overall distribution areas, especially for Xi’an city and Baoji city, are basically the same, and the overall lethality level is lower than the field survey result. However, in Ankang city, based on the calculated results, the overall lethality level and distribution areas are greater than those in the field survey. In summary, based on each township’s calculated results, an overall distribution pattern similar to that of the field survey results was obtained. However, due to differences in data sources and methods, some discrepancies may occur. Therefore, further research is needed to verify and improve the accuracy of these methods.
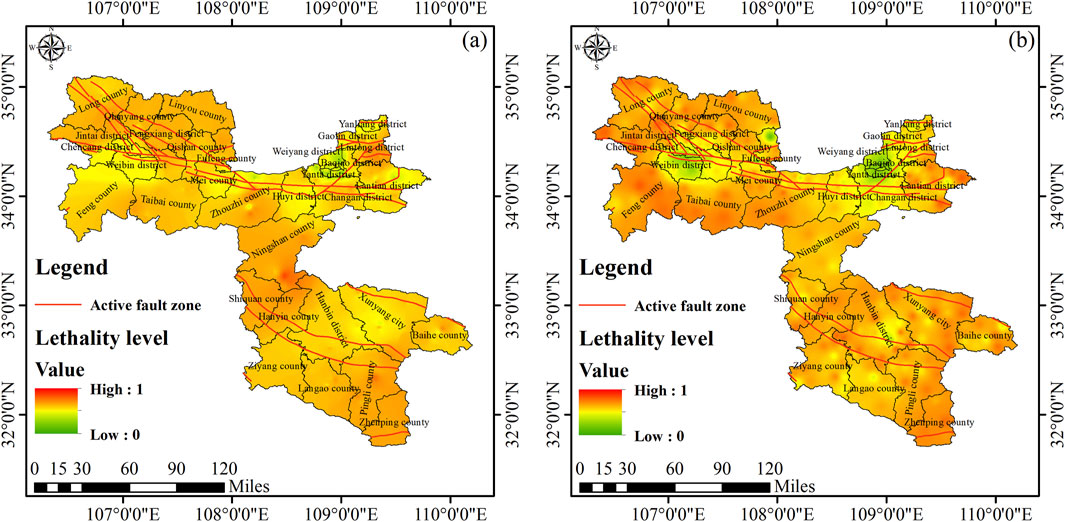
Figure 8. Distribution of lethality levels in three cities obtained from the two methods. (A): field survey results, (B): calculated results.
Therefore, based on the lethality level results obtained from GHSL data, risk assessments can be conducted. As shown in Figure 9, the distribution of population in the three cities parallels that of buildings, with the majority of the population concentrated in the central areas of each city. The population data for urban areas are much greater than those for rural areas. Another feature is the significant clustering of the population. In the southern regions of Xi’an city and Baoji city, which are mainly mountainous areas, the population distribution is relatively sparse, while in Ankang city, which is also mainly mountainous, the population distribution is scattered, and the population distribution is relatively small.
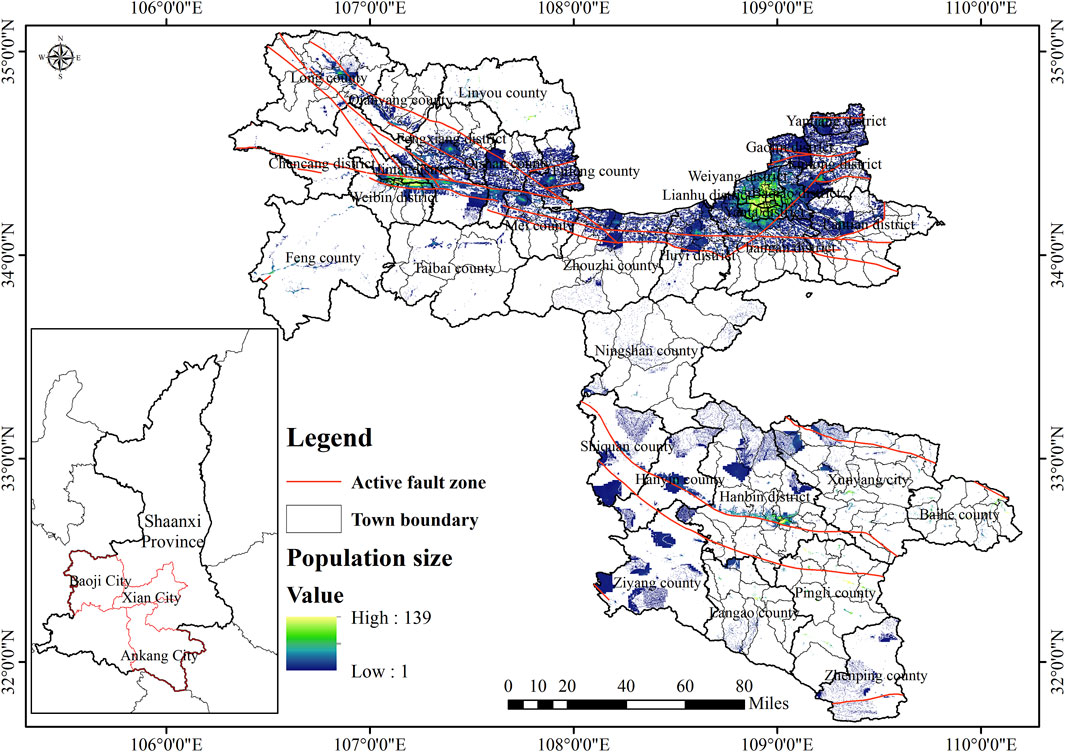
Figure 9. Population distribution results of the three cities.
As shown in Figure 10, based on the peak ground acceleration (PGA) results of the three cities, we can obtain the seismic hazard analysis results,the zoning map in the form of seismic parameters adopts a standard (PGA) of 10% probability of exceedance over 50 years (earthquake recurrence period of 475 years). The seismic hazard distribution has obvious characteristics, the PGA in the central areas of Xi’an city and Baoji city is high; and it decreases from north to south. Based on relevant methods, we can convert the PGA parameters into earthquake intensity and then calculate the intensity range of different towns. In this way, the corresponding mortality rate can be determined based on the intensity range and lethality level of each township.
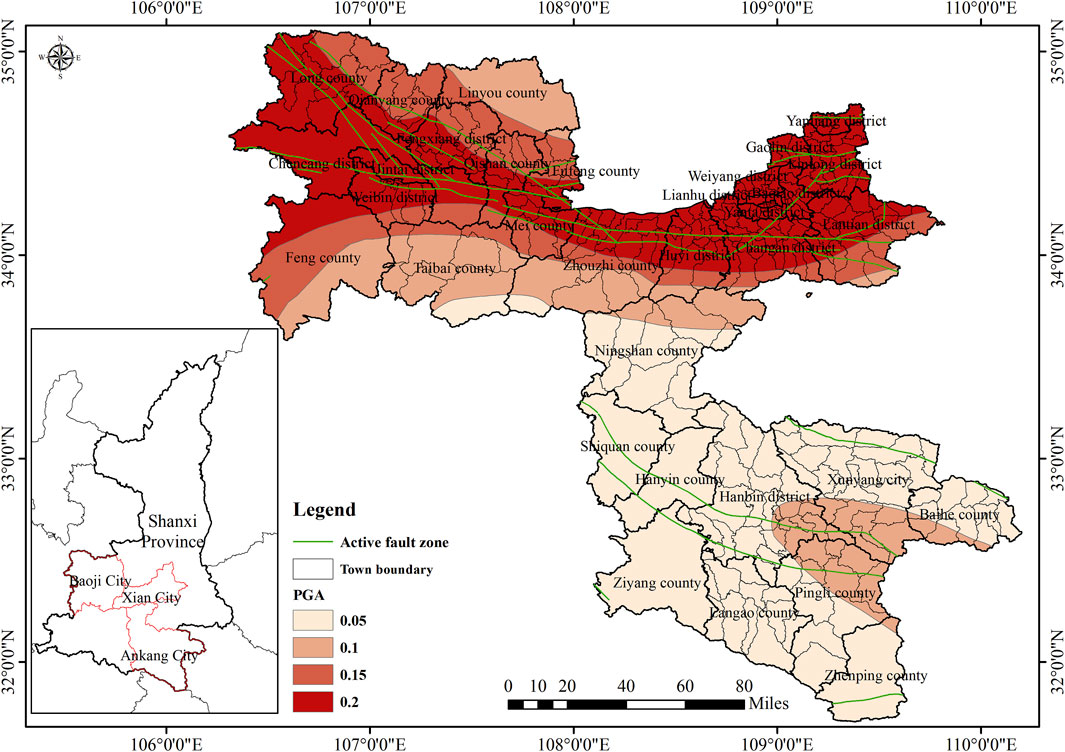
Figure 10. Distribution of PGA parameters in three cities.
Based on the lethality level, population distribution results, and intensity distribution, the mortality rate of each building under different intensities can be determined, enabling quantitative calculations of earthquake disaster risks. Although data of different resolutions can be used to obtain different assessment results, consistent results are essential; therefore, data integration is necessary to ensure consistency, and calculations are conducted using consistent grid data precision to obtain building-level casualty risk assessment results. Due to our field investigation, we obtained the lethality levels of various types of buildings and the number of permanent residents. Based on the distribution results of PGA parameters, we can obtain the intensity range of each building. Therefore, based on the lethality level results of each building, we can obtain the corresponding personnel mortality rate for each building. Combined with the population size, we can obtain the possible personnel mortality results for each building. This type of casualty risk mainly refers to the possible number of personnel casualties that exceed the currently given PGA parameters.
As shown in Figure 11, each city has different earthquake disaster risk characteristics. Figure 11A shows that high risk areas in Xi’an city are mainly concentrated in urban areas, the areas mainly in old urban areas such as Lianhu District and Yanta District. Overall, there is a decreasing trend from the city center to the outer areas, especially in rural areas where the risks are relatively low. Figure 11B shows that the risk distribution results in Baoji city are mainly concentrated in central areas, such as the Jintai District to Mei County, while mountainous areas have relatively low risks, especially in southern areas such as Feng County and Taibai County. Figure 11C shows that areas with high risks in Ankang city are mainly concentrated in urban areas, such as Hanbin District, Xunyang District, and Pingli County, while the other areas have relatively low risk levels.
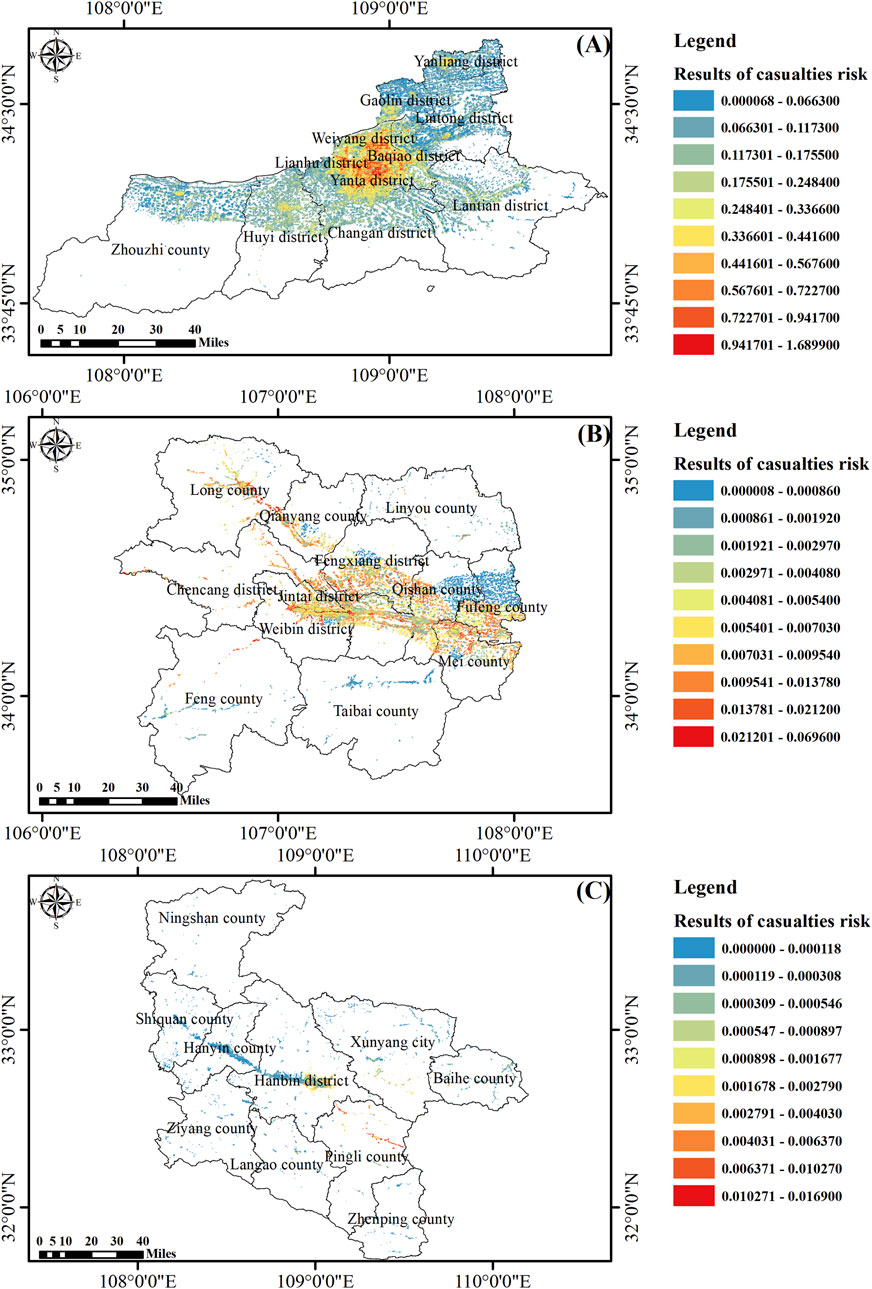
Figure 11. Quantitative evaluation of earthquake casualty risk in three cities. (A): Xian city, (B): Baoji city, (C): Ankang city.
Based on the analysis of the subdistrict level assessment results, at the town level, the calculated results based on buildings are more accurate than those based on grid calculations. Based on the GHSL data, the building-level personnel casualty risk calculation results can be obtained; different adjacent buildings have different risk results. However, the distributions of different risk levels actually have relatively consistent distribution characteristics. As shown in Figure 12, the building distribution in Wenqu subdistrict, Xi’an city, is relatively dense, and the earthquake disaster risk distribution is similar throughout it. The risk is relatively high in the northwestern part, while the southeastern part has a relatively low risk; furthermore, the distribution of different risk grades is also scattered. As shown in Figure 13, in Jiangtan subdistrict, Baoji city, buildings are mostly concentrated in the eastern area and are relatively sparse in the western area; however, the risk distribution shows the opposite trend, with higher risks concentrated mainly in the western area. Similarly, as shown in Figure 14, in Xincheng subdistrict, Ankang city, buildings are mostly concentrated in the northern area, and the overall risk in this area is relatively low. In the urban‒rural fringe areas far from the city center, the risk is relatively high, while the urban area has a relatively low risk and a relatively concentrated distribution feature.
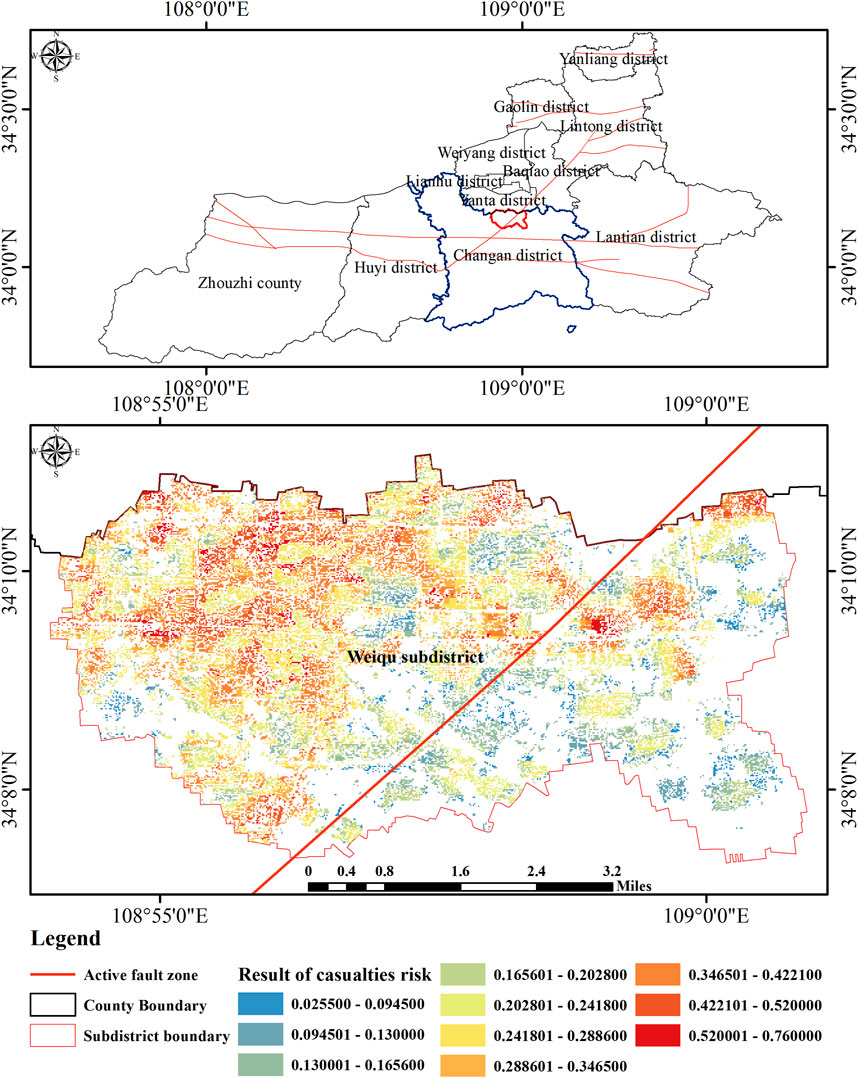
Figure 12. Earthquake casualty risk assessment results for Weiqu Subdistrict, Xi’an city.
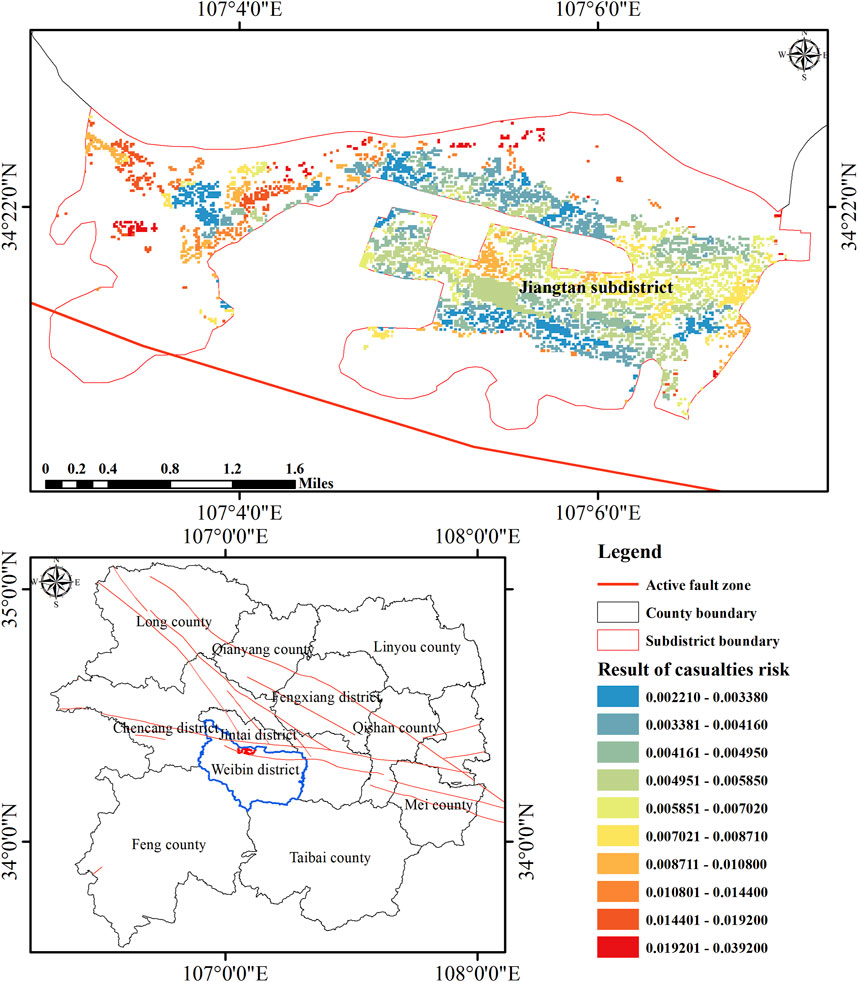
Figure 13. Earthquake casualty risk assessment results for Weibin subdistrict, Baoji city.
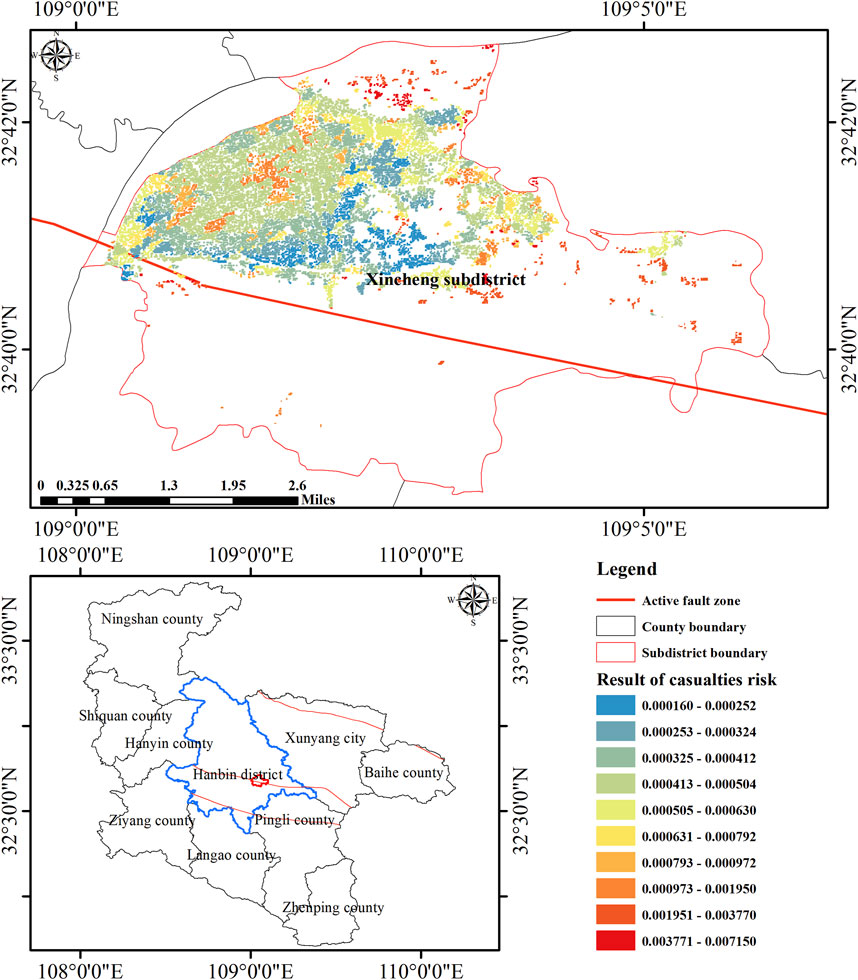
Figure 14. Earthquake casualty risk assessment results for Xincheng subdistrict, Ankang city.
4 Discussion
Based on field surveys, the lethality levels of Xian, Baoji, and Ankang were determined to be at generally at a medium-high level. Overall, the lethality level of urban areas is lower than that of other areas, such as the Yanta district of Xian, the Weibin district of Baoji, and the city of Xingyang of Ankang, which has a much lower lethality level than the other districts and counties. These findings indicate an obvious regional distribution pattern that parallels the economic development levels and geographical landscapes of the three cities. These results can support subsequent earthquake disaster risk assessments.
However, the regional lethality level relies mainly upon sampling surveys to obtain the overall level of the region and may have some errors. In addition, the field survey approach has relatively large errors; therefore, remote sensing data must be used to obtain the lethality level of a region on the basis of field investigations. Thus, converting the results of field investigations based on current surveys and other relevant data (mainly building data) obtained by remote sensing is the key to carrying out efficient and accurate earthquake disaster risk assessments. The building data provided by the GHSL are classified according to residential and nonresidential areas and are based on building height; different buildings heights and proportions of different building heights are found in each township. However, these results are not classified according to building styles, so how to classify different building heights based on field survey results and obtain the lethality level of buildings of different heights is also important.
In fact, the types of buildings corresponding to different heights are relatively uniform. For example, according to the results of field surveys, buildings with heights less than 3 m generally correspond to civil structures, brick-wood structures, and unprotected brick-concrete structures, and buildings with heights of 3–6 m generally correspond to brick-concrete structures. However, brick-concrete structures differ among cities or regions. Buildings with heights of 15–30 m are generally located in urban areas and are mainly fortified brick-concrete structures; buildings with heights greater than 30 m are also mostly located in urban areas, and their building structures are mainly frame structures. Based on these basic characteristics, we combined the results of field surveys in each town and used them to convert the building structure results. Then, we calculated the actual lethality level of each type of building. These results indicated that even adjacent buildings could have different lethality levels.
GHSL building data, which subdivide buildings by area (residential and nonresidential) and height, are used in this study. These subdivisions and field survey results are used to calculate the lethality level of buildings. However, this direct classification method, which divides buildings by height, still has large errors in calculating the overall level of the region, especially for brick-concrete structures. Based on field survey data, brick-concrete structures are affected by various factors, such as construction methods, materials, quality, and time; therefore, even for buildings of the same height and type, their actual lethality level can vary significantly. This variance is one of the main reasons for errors in the regional lethality level based on GHSL data.
Based on the proportion of each type of building and its lethality level in each township, the overall lethality level of each town can be obtained. A comparative analysis with the field survey results indicated that the fitting results for each city are relatively good, with an R2 value ranging from 0.57 to 0.66. The calculation results and survey results for each investigated town have relatively small errors, generally concentrated at 0.1 or lower. Moreover, the errors in the three cities are mainly negatively correlated, meaning that the calculated results are generally smaller than the field survey results. One of the main reasons for this difference is that the calculated results are mainly based on building data, while the field survey results account for comprehensive factors such as the geographical environment and secondary disasters. Additionally, we analyzed towns where the calculated results are greater than the field survey results and found that the current building data mainly come from 2018 fitting results, while the field survey results are from 2023. In the past 5 years, some towns have experienced significant changes in building types and proportions, which may have led to a decrease in actual lethality levels.
That is to say, both methods can obtain the basic data of the research area, and the error between the accuracy of the data results is within an acceptable range. Firstly, if the results obtained through on-site investigation are accurate and realistic, it can ensure the accuracy and timeliness of the data. However, this method requires a large amount of on-site work, which incurs significant time and economic costs, making it difficult to conduct large-scale investigations, Although there are errors between the results obtained based on GHSL building data and field investigations, these errors are within an acceptable range. This method can quickly obtain results in a large area, with fast speed and guaranteed accuracy. However, there are differences between the data obtained by this method and the actual data. Currently, the data results are generally 2–3 years earlier than the actual data, and the data updates are slower. Moreover, this method also requires data based on field investigation results. Therefore, the best way is to combine two methods for evaluation and calculation, based on GHSL building data, conduct targeted field investigations, and then evaluate and calculate based on the results of the field investigations. This can reduce the workload of on-site investigations while ensuring the accuracy of the results.
Based on the analysis of these results, this method of combining field surveys with remote sensing data provides a way to assess and calculate the overall lethality level of a region. On the one hand, this approach can reduce the time and personnel required for conducting extensive field surveys, further improving the timeliness of the evaluation and calculation; on the other hand, based on the results of field sampling surveys, calculating the remote sensing data can maintain the relative consistency of the data and avoid errors in the actual lethality level of the same building type associated with different survey personnel, thus ensuring the accuracy of the results.
Earthquake disaster risk analysis can be conducted by combining the distribution of earthquake risk with analyses of the lethality level of buildings, thus enabling quantitative assessments of disaster losses at the building level. The earthquake risk level and population distribution in the three cities mostly overlap; thus, the calculated human casualty risk based on these factors have obvious regional characteristics. Furthermore, the calculated results and the distribution of buildings in the three cities are strongly correlated; for example, for the same area, different building types yield different levels of casualties. Thus, this casualty risk assessment result is more targeted.
Based on such building data, quantitative risk assessments of casualties at the building level can be obtained. Due to the different types and proportions of buildings in each city, the corresponding assessment results are also different. The human casualty risk at the building level in Xian is greater than that in the other two cities. This difference is the comprehensive result of multiple factors, including the lethality level of the different buildings, population level, and PGA distribution. Therefore, under the premise that other influencing factors remain basically unchanged, it is crucial to quickly and accurately obtain the lethality level of each building type (or individual building) to carry out a precise quantitative assessment of earthquake-induced human casualty risks.
According to the results of the earthquake disaster risk analysis in three cities and our field results, the overall distribution characteristics are relatively similar, with relatively high risks in urban areas and relatively low risks in rural areas. The possible reasons for these findings are as follows: first, during the rapid urbanization process, some old buildings in urban areas were not been extensively updated, while rural areas underwent building updates and reinforcement due to economic development and other factors, which led to higher lethality levels in some urban areas than in rural areas; second, population distribution also directly affected the final assessment. The field survey process determined that the population in each city is mainly concentrated in urban areas, while rural areas have fewer permanent residents; even if the lethality level is high due to the high number of buildings, the low population in rural areas leads to lower risk analysis results.
5 Conclusion
The on-site investigation results show that the types of buildings in different cities are basically similar, with undefended brick concrete structures and brick wood structures being the main ones in rural areas. Generally, the number of floors for brick concrete structures is 2, and for brick wood structures it is 1. Through the analysis of GHSL data, it was found that the height of buildings in rural areas of three cities is mainly less than 3 m and 3–6 m. So, based on the results of building height data and field investigations, a rapid assessment and calculation of regional lethality level can be carried out.
Based on detailed field investigations of buildings in the research area, we can obtain the lethality levels of different types of buildings in different regions, which can better reflect the seismic resistance of the area. However, considering factors such as time and workload, this article conducted a study on the calculation method of regional lethality level based on GHSL data, based on the results of field investigations and the different characteristics of buildings. This approach provides a way to convert the results of field surveys and remote sensing data in the future. The regional lethality level obtained based on this method can reflect the actual situation of the area, and the remote sensing data are generally consistent with the field survey results, with an error rate of ±15% for each town. However, because the calculated results based on GHSL data consider only the lethality level of buildings, they are lower than the field survey results because the field survey results are comprehensive calculations that consider the influence of regional geographical and traffic conditions.
Based on building data calculations, the lethality level of each building type can be obtained, as can the lethality level distribution for different administrative levels, such as townships and districts. These results can also better reflect the distribution characteristics and the lethality level of buildings in a region; compared with traditional calculations based on administrative levels, these results reflect the distribution of lethality levels within different administrative units and further quantify the lethality levels at the township level. The distribution of building lethality levels is relatively accurate, especially for adjacent administrative regions. Furthermore, the lethality levels of buildings of the same type are not significantly different; in contrast, different types of buildings within the same area exhibit significant differences in their lethality levels.
After obtaining the lethality level at the building level, we can combine data such as the resident population and PGA to evaluate the risk of personnel injury. The results show that the overall trend of personnel injury risk in the three cities is relatively consistent, showing a decreasing trend from the city center to rural areas. However, there are significant differences in the evaluation results based on the township level, especially in urban areas where the high-risk areas are mainly old residential areas or urban villages, and there is no clear distribution pattern of risk. Therefore, based on field investigation results data, we can use GHSL data to achieve risk assessment at the township or building level, which is more directional.
Based on the distribution results of building lethality levels, combined with earthquake hazard results and population data, corresponding quantitative calculations of human casualty risks can be carried out, and building-level results can be obtained. On the one hand, these results can provide the potential number of human casualties caused by different types of buildings after an earthquake, achieving a quantitative calculation of casualties. On the other hand, based on the results of the building risk evaluations and comparative analyses of various building vulnerabilities, high-precision assessments and calculations of people buried by location may be possible; such information could help to further evaluate, classify, and identify key disaster areas. This process can also provide accurate data support for pre-earthquake disaster risk prevention and post-earthquake emergency rescue work.
Data availability statement
The original contributions presented in the study are included in the article/supplementary material, further inquiries can be directed to the corresponding authors.
Author contributions
QW: Investigation, Writing–review and editing, Validation. XC: Investigation, Writing–review and editing, Conceptualization, Funding acquisition, Methodology, Writing–original draft. ZJ: Data curation, Investigation, Writing–review and editing. NG: Conceptualization, Methodology, Writing–review and editing. LH: Data curation, Investigation, Writing–review and editing.
Funding
The author(s) declare that financial support was received for the research, authorship, and/or publication of this article. This work was jointly supported by the National Natural Science Foundation of China (Grant No. 42207532), the National Nonprofit Fundamental Research Grant of China, Institute of Geology, China Earthquake Administration (Grant No. IGCEA 1905), and the National Natural Science Foundation of China (Grant No. 41907397).
Conflict of interest
The authors declare that the research was conducted in the absence of any commercial or financial relationships that could be construed as a potential conflict of interest.
Publisher’s note
All claims expressed in this article are solely those of the authors and do not necessarily represent those of their affiliated organizations, or those of the publisher, the editors and the reviewers. Any product that may be evaluated in this article, or claim that may be made by its manufacturer, is not guaranteed or endorsed by the publisher.
References
Allen, T., Machemer, H., and Steckler, M. (2009). Earthquake risk reduction in developing countries: a global challenge. Bull. Seismol. Soc. Am. 99 (5), 2407–2421.
Aroquipa, H., and Hurtado, A. (2022). Seismic resilience assessment of buildings: a simplified methodological approach through conventional seismic risk assessment. Int. J. Disaster Risk Reduct. 77, 103047. doi:10.1016/j.ijdrr.2022.103047
Biljecki, F., Chow, Y. S., and Lee, K. (2023). Quality of crowdsourced geospatial building information: a global assessment of Open Street Map attributes. Build. Environ. 237, 110295. doi:10.1016/j.buildenv.2023.110295
Bono, A. D., and Mora, M. G. (2014). A global exposure model for disaster risk assessment. 10, 442–451. doi:10.1016/j.ijdrr.2014.05.008
Chrysoulakis, N., Feigenwinter, C., Triantakonstantis, D., Penyevskiy, I., Tal, A., Parlow, E., et al. (2014). A conceptual list of indicators for urban planning and management based on earth observation. ISPRS Int. J. Geo-Information 3, 980–1002. doi:10.3390/ijgi3030980
D’Amato, M., Laguardia, R., Di Trocchio, G., Coltellacci, M., and Gigliotti, R. (2020). Seismic risk assessment for masonry buildings typologies from L’aquila 2009 earthquake damage data. J. Earthq. Eng. 26, 4545–4579. doi:10.1080/13632469.2020.1835750
De Bono, A., and Mora, M. G. (2014). A global exposure model for disaster risk assessment. Int. J. Disaster Risk Reduct. 10, 442–451. doi:10.1016/j.ijdrr.2014.05.008
Dell’Acqua, F., Gamba, P., and Jaiswal, K. (2013). Spatial aspects of building and population exposure data and their implications for global earthquake exposure modeling. Nat. Hazards 68 (3), 1291–1309. doi:10.1007/s11069-012-0241-2
Esch, T., Heldens, W., Hirner, A., Keil, M., Marconcini, M., Roth, A., et al. (2017). Breaking new ground in mapping human settlements from space - the Global Urban Footprint. ISPRS J. Photogrammetry Remote Sens. 134, 30–42. doi:10.1016/j.isprsjprs.2017.10.012
Esch, T., Marconcini, M., Felbier, A., Roth, A., Heldens, W., Huber, M., et al. (2013). Urban footprint processor—fully automated processing chain generating settlement masks from global data of the TanDEM-X mission. IEEE Geoscience Remote Sens. Lett. 10 (6), 1617–1621. doi:10.1109/LGRS.2013.2272953
Gamba, P., Cavalca, D., Jaiswal, K., Huyck, C., and Crowley, H. (2012) The GED4GEM project: development of a global exposure database for the global earthquake model initiative, (IEM, Lisbon, Portugal).
Godefroid, S., and Koedam, N. (2007). Urban plant species patterns are highly driven by density and function of built-up areas. Landsc. Ecol. 22 (8), 1227–1239. doi:10.1007/s10980-007-9102-x
Gómez Zapata, J. C., Zafrir, R., Pittore, M., and Merino, Y. (2022). Towards a sensitivity analysis in seismic risk with probabilistic building exposure models: an application in valparaíso, Chile using ancillary open-source data and parametric ground motions. ISPRS Int. J. Geo-Information 11 (2), 113. doi:10.3390/ijgi11020113
Gunasekera, R., Ishizawa, O., Aubrecht, C., Blankespoor, B., Murray, S., Pomonis, A., et al. (2015). Developing an adaptive global exposure model to support the generation of country: disaster risk profiles. Earth-Science Rev. 150, 594–608. doi:10.1016/j.earscirev.2015.08.012
He, Q., He, W., Song, Y., Wu, J., Yin, C., and Mou, Y. (2018). The impact of urban growth patterns on urban vitality in newly built-up areas based on an association rules analysis using geographical ‘big data. Land Use Policy 78, 726–738. doi:10.1016/j.landusepol.2018.07.020
Hu, Y., Li, X., and Xu, X. (2010). Urban seismic risk assessment and mitigation in China. J. Earthq. Tsunami 4 (3), 243–257.
Jaiswal, K. S., Wald, D. J., Hearne, M., and Ellenberger, S. (2010). PAGER: a web-based global fatality estimation tool. Earthq. Spectra 26 (4), 1087–1103.
Laguardia, R., D’Amato, M., Coltellacci, M., Trocchio, G.Di, and Gigliotti, R. (2023). Fragility curves and economic loss assessment of RC buildings after L’aquila 2009 earthquake. J. Earthq. Eng. 27 (5), 1126–1150. doi:10.1080/13632469.2022.2038726
Lin, D., Tan, M., Liu, K., Liu, L., and Zhu, Y. (2020). Accuracy comparison of four gridded population datasets in guangdong province, China. Trop. Geogr. 40 (2), 346–356. doi:10.13284/j.cnki.rddl.003220
Lu, L., Guo, H., Pesaresi, M., Soille, P., and Ferri, S. (2013). “Automatic recognition of built-up areas in China using780cbers-2b hr data,” in Proceedings of the JURSE 2013 (Brazil), 21–23. Available at: https://publications.jrc.ec.europa.eu/repository/handle/JRC86187.
Lu, X., Ji, X., and Yan, Z. (2022). Seismic collapse assessment of reinforced concrete frames infilled with hollow concrete bricks. J. Build. Eng. 59, 105156. doi:10.1016/j.jobe.2022.105156
Neumayer, E., and Barthel, F. (2011). The human cost of natural disasters: a global perspective. Routledge.
Paprotny, D., Kreibich, H., Morales-Nápoles, O., Terefenko, P., and Schröter, K. (2020). Estimating exposure of residential assets to natural hazards in Europe using open data. Nat. Hazards Earth Syst. Sci. 20, 323–343. doi:10.5194/nhess-20-323-2020
Pesaresi, M., Corbane, C., Ren, C., and Edward, N. (2021). Generalized Vertical Components of built-up areas from global Digital Elevation Models by multi-scale linear regression modelling. PLoS One 16, e0244478. doi:10.1371/journal.pone.0244478
Pesaresi, M., Ehrlich, D., Ferri, S., Florczyk, A., Freire, S., Haag, F., et al. (2015). Global human settlement analysis for disaster risk reduction. ISPRS - Int. Archives Photogrammetry, Remote Sens. Spatial Inf. Sci. XL-7/W3, 837–843. doi:10.5194/isprsarchives-xl-7-w3-837-2015
Pesaresi, M., and Politis, P. (2023) GHS-BUILT-H R2023A - GHS building height, derived from AW3D30, SRTM30, and Sentinel2 composite (2018). European Commission, Joint Research Centre JRC. Available at: http://data.europa.eu/89h/85005901-3a49-48dd-9d19-6261354f56fe.
Schiavina, M., Melchiorri, M., Pesaresi, M., Politis, P., Freire, S., Maffenini, L., et al. (2022). GHSL data package 2022. (Luxembourg: Publications Office of the European Union). ISBN 978-92-76-53071-8.129516.
Schneider, P. J., and Schauer, B. A. (2006). HAZUS – its development and its future. Nat. Hazards Rev. 7 (2), 40–44. doi:10.1061/(asce)1527-6988(2006)7:2(40)
Suwal, R., and Uprety, R. (2023). Seismic fragility assessment of low-rise reinforced concrete frame: a comparative study of bare and infill model. J. Eng. Issues Solutions 2 (1), 37–49. doi:10.3126/joeis.v2i1.49373
Tatangelo, M., Audisio, L., D'Amato, M., and Gigliotti, R. (2022). Seismic risk analysis on masonry buildings damaged by L'Aquila 2009 and Emilia 2012 earthquakes. Procedia Struct. Integr. 44. doi:10.1016/j.prostr.2023.01.128
UNISDR (2009). Global assessment report on disaster risk reduction: risk and poverty in a changing climate. (Geneva, Switzerland: United Nations International Strategy for Disaster Reduction).
Wang, P., Huang, C., Tilton, J. C., Tan, B., and Brown de Colstoun, E. C. (2017). HOTEX: an approach for global mapping of human built-up and settlement extent,” in 2017 IEEE international geoscience and remote sensing symposium (IGARSS) (Fort Worth, TX), 1562–1565. doi:10.1109/igarss.2017.8127268
Xia, C. X., Nie, G. Z., Fan, X. W., Li, H. Y., Zhou, J. X., and Zeng, X. (2022b). A new model for the quantitative assessment of earthquake casualties based on the correction of anti-lethal level. Nat. Hazards 110, 1199–1226. doi:10.1007/s11069-021-04988-z
Xia, C. X., Nie, G. Z., Fan, X. W., Zhou, J. X., Li, H. Y., and Pang, X. K. (2020). Research on the rapid assessment of earthquake casualties based on the anti-lethal levels of buildings. Geomat. Nat. Hazards Risk 11 (1), 377–398. doi:10.1080/19475705.2019.1710581
Xia, C. X., Nie, G. Z., Li, H. Y., Fan, X. W., and Qi, W. H. (2023a). A composite database of casualty-inducing earthquakes in mainland China. Nat. Hazards 116, 3321–3351. doi:10.1007/s11069-022-05811-z
Xia, C. X., Nie, G. Z., Li, H. Y., Fan, X. W., and Yang, R. (2022a). Study on the seismic lethal level of buildings and seismic disaster risk in Guangzhou, China. Geomat. Nat. Haz Risk 13 (1), 800–829. doi:10.1080/19475705.2022.2041109
Xia, C. X., Nie, G. Z., Li, H. Y., Fan, X. W., Yang, R., and Zeng, X. (2021). Comparative analysis of the earthquake disaster risk of cities in Eastern China based on lethal levels – a case study of Yancheng City, Suqian City and Guangzhou City. Geomat. Nat. Hazards Risk 12 (1), 3224–3264. doi:10.1080/19475705.2021.2009580
Xia, C. X., Nie, G. Z., Li, H. Y., Fan, X. W., Zhou, J. X., Yang, R., et al. (2023b). Research on lethal levels of buildings based on historical seismic data. Front. Earth Sci. 10, 767586. doi:10.3389/feart.2022.767586
Xin, D., Daniell, J. E., Tsang, H.-H., and Wenzel, F. (2021). Residential building stock modelling for mainland China targeted for seismic risk assessment. Nat. Hazards Earth Syst. Sci. 21 (10), 3031–3056. doi:10.5194/nhess-21-3031-2021
Xu, X., Wen, X., Wang, Y., and Huang, R. (2016a). A rapid post-earthquake loss assessment method based on building inventory and vulnerability curves. Nat. Hazards 83 (3), 1747–1766.
Yang, W., and Kohler, N. (2008). Simulation of the evolution of the Chinese building and infrastructure stock. Build. Res. and Inf. 36 (1), 1–19. doi:10.1080/09613210701702883
Yang, Y., and Kohler, M. (2008). Seismic risk assessment and mitigation in urban areas of China. Nat. Hazards 46 (3), 389–405.
Ye, X., Yu, X., Yu, C., Tayibazhaer, A., Xu, F., Skidmore, A. K., et al. (2018). Impacts of future climate and land cover changes on threatened mammals in the semi-arid Chinese altai mountains. Sci. Total Environ. 612, 775–787. doi:10.1016/j.scitotenv.2017.08.191
Keywords: field survey results, lethality level, GHSL building data, disaster loss risk, PGA
Citation: Wenhua Q, Chaoxu X, Jie Z, Gaozhong N and Huayue L (2024) Seismic risk assessment based on residential building stock and field survey results: a case study of 3 cities in Shanxi Province. Front. Earth Sci. 12:1424382. doi: 10.3389/feart.2024.1424382
Received: 27 April 2024; Accepted: 19 August 2024;
Published: 02 September 2024.
Edited by:
Karoly Nemeth, Institute of Earth Physics and Space Science (EPSS), HungaryReviewed by:
Naida Ademovic, University of Sarajevo, Bosnia and HerzegovinaAndrea Nettis, Politecnico di Bari, Italy
Michele D’Amato, University of Basilicata, Italy
Copyright © 2024 Wenhua, Chaoxu, Jie, Gaozhong and Huayue. This is an open-access article distributed under the terms of the Creative Commons Attribution License (CC BY). The use, distribution or reproduction in other forums is permitted, provided the original author(s) and the copyright owner(s) are credited and that the original publication in this journal is cited, in accordance with accepted academic practice. No use, distribution or reproduction is permitted which does not comply with these terms.
*Correspondence: Qi Wenhua, cWl3ZW5odWFAaWVzLmFjLmNu; Xia Chaoxu, eGlhY2hhb3h1QGllcy5hYy5jbg==