- Department of Earth Sciences, University of Geneva, Geneva, Switzerland
Earthquakes in fluid-saturated rocks induce sudden changes in pore-pressures that can lead to appreciable postseismic deformation. However, earthquakes can also release fluids from overpressured parts of the crust, which can also contribute to additional postseismic effects. In this study, we use two-dimensional poroelastic models to investigate postseismic deformation and fluid pressures following ruptures on overpressured dip-slip faults that slide according to rate- and state-dependent friction. We show that when the crust prior to rupture has pore pressures in hydrostatic equilibrium, then ruptures induce fluid pressure anomalies according to the field of coseismic elastic volumetric strain. These pore pressure anomalies relax with time to produce characteristic postseismic deformation that depends on the slip magnitude and fault style, as typically observed. However, very different results are obtained if the crust is appreciably overpressured at the time an earthquake is nucleated. In this case, the poroelastic response is overwhelmingly dominated by drainage and fluid pressure drop within the overpressured crust, which is facilitated by an increase in permeability on the fault during rupture. This results in transient postseismic subsidence that occurs irrespective of the faulting style, fault geometry, slip magnitude or details of the coseismic strain field. The time scale and magnitude of this postseismic subsidence are controlled by the magnitude of the fluid overpressure prior to rupture, the maximum coseismic permeability and how rapidly the fault permeability recovers following an earthquake. The poroelastic effects associated with rupturing of overpressured faults may be at least an order of magnitude greater that the classic poroelastic response (i.e., relaxation of pore pressures generated by coseismic elastic volumetric strain). Overall, our results highlight the potentially dramatic effect that the breaching of deep overpressured fluid reservoirs can have on fluid pressures and surface displacements following earthquakes.
1 Introduction
After a major earthquake, surface deformation is influenced by many post-seismic processes occurring at different spatial and temporal scales. These processes include postseismic slip along the fault plane (Shrivastava et al., 2016; Freed et al., 2017; Huang et al., 2017; Guo et al., 2019a), viscoelastic relaxation in the lower crust and underlying mantle (Freed and Lin, 2001; Guo et al., 2019b; Peña et al., 2020), and poroelastic deformation due to the migration of pressurized pore fluids (Peltzer et al., 1996; 1998; Jónsson et al., 2003). Most previous research on poroelastic effects (e.g. (Peltzer et al., 1996; 1998; Jónsson et al., 2003)) has focused on how pore pressure changes that result from coseismic faulting induce time-dependent postseismic deformation. In this research, we focus on the poroelastic response linked to earthquakes on overpressurised dip-slip faults, especially immediately following large ruptures.
When an earthquake occurs in a fluid-saturated porous medium, changes in mean stress resulting from differential displacements may induce variations in pore fluid pressure in the surrounding crust. These fluid pressure anomalies then relax, inducing time-dependent displacement, a phenomenon known as poroelastic rebound (Segall, 2010). Depending on the permeability of the rocks, poroelastic rebound can last for months (Jónsson et al., 2003; Árnadóttir et al., 2005), or even years (Fialko, 2004). Understanding the poroelastic response induced by earthquakes is essential because it may control stress transfer, earthquake triggering and afterschocks (Freed and Lin, 2001; Miller et al., 2004; Hughes et al., 2010).
Poroelastic rebound is generally thought to be strongly linked to the tectonic regime and style of faulting (Muir-Wood and King, 1993; Segall, 2010; Doglioni et al., 2014). For example, in the case of normal faulting, dilational volumetric coseismic strain in the handingwall block close to the surface is expected to reduce fluid pressures whereas contractional strain in the footwall block will tend to increase pore pressures (Segall, 2010). Relaxation of these pore fluid pressures anomalies following rupture may then result in additional deformation. The opposite is expected for reverse faulting. No changes in mean stress will occur adjacent to infinitely long strike-slip faults. However, finite length strike slip faults will perturb volumetric strain in the vicinity of fault tips (or fault jogs), which may induce significant poroelastic effects [e.g., see Jónsson et al. (2003)].
Although some observations of pore pressure changes and postseismic deformation are broadly consistent with coseismic strain fields (Muir-Wood and King, 1993; Quilty and Roeloffs, 1997; Jónsson et al., 2003; Akita and Matsumoto, 2004), other studies indicate a more complicated picture (Wang and Manga, 2015). For example, following the 1999 M7.5 Chi-Chi earthquake in Taiwan, most wells experienced a coseismic increase in water levels where the strain field should have caused dilation (Koizumi et al., 2004; Wang et al., 2001). Cox et al. (2021) suggested that earthquake-induced liquefaction and changes in well levels following the 2010 Darfield earthquake in New Zealand indicate that porous flow is not generated by the coseismic displacement field but by the breaching of an overpressured fluid reservoir at depth, facilitated by an abrupt change in coseismic permeability. Similar conclusions have been made by Miller et al. (2004) and Terakawa et al. (2010). These interpretations are consistent with the general view that some faults may act as pressure valves, opening abruptly during earthquakes, thus enabling fluid overpressures to dissipate, before closing by mineral precipitation during the interseismic period (Sibson, 1990).
In this study, we investigate how drainage from overpressured fault zones during and immediately following rupture impacts on the displacement and pressure fields in the surrounding crust. Our analysis is based on a two dimensional numerical model of poroelastic deformation associated with reverse and normal faults that rupture according to rate- and state-dependent friction. Our model includes classic poroelastic effects generated in response to coseismic volumetric strain, as modeled previously by others (Peltzer et al., 1996; 1998; Jónsson et al., 2003). In addition, we consider that faults are overpressured at the time of rupture and that permeability on the fault increases sharply during an earthquake before decreasing postseismically. Our objectives are to understand how these phenomena influence the poroelastic response in comparison to the classic theory. We do not consider why or how fluid overpressures in the crust may be generated, which may involve a variety of processes including devolatisation reactions (Connolly, 1997), magmatic dewatering (Norton, 1984) or compaction (Walder and Nur, 1984). Additionally, we have not incorporated additional features that may lead to postseismic deformation such as viscoelastic deformation or postseismic fault afterslip. These features are omitted only in order to highlight the poroelastic response, not because we believe them to be unimportant.
2 Methodology
Our model considers two dimensional poroelastic deformation adjacent to a predefined normal or reverse fault that slips according to rate-state friction. Faults with background friction coefficients of 0.6 are assumed to be optimally oriented with respect to frictional sliding. Thus, for convergent experiments, the reverse fault has a dip of about 30°, while in extension, the normal fault has a dip of close to 60°. Faulting is assumed to be confined to the upper half of an elastic layer that has a total thickness of 30 km.
Our model is a variant of that already presented by Marguin and Simpson (2023). It is based on quasi-static force balance, which in two-dimensions can be written as
where
The stress-strain relation for an isotropic elastic material can be written as
where
where
We discretise this equation using a forward Euler finite difference approximation and substitute it into Equation 1 to leave a system of equations with velocities and fluid pressure as the unknowns.
Fault motion is governed by Coulomb behaviour combined with rate- and state-dependent friction. Here, the Coulomb condition is modified to account for radiation damping:
where
In this equation
where
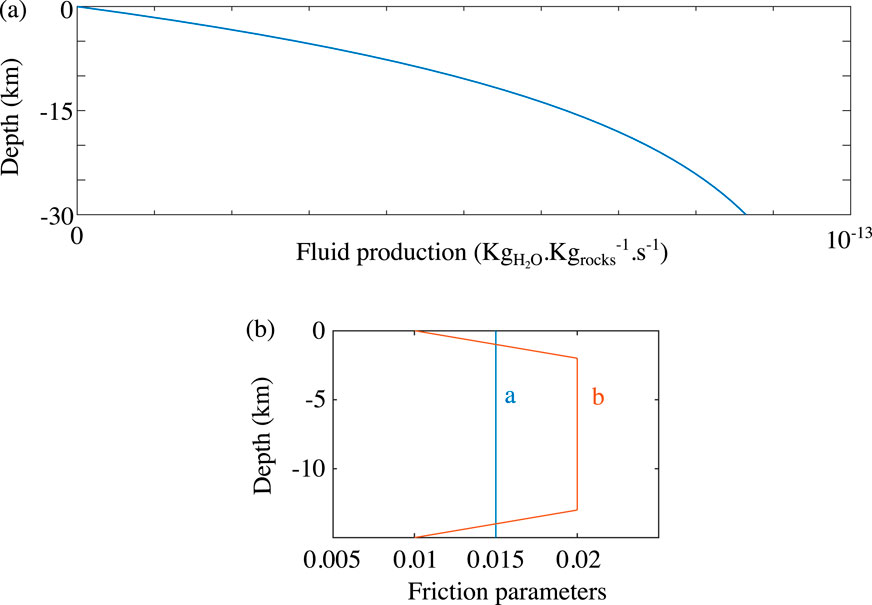
Figure 1. (A) Fluid production rate in model with
The fluid pressure equation is obtained by combining mass balance of the fluid with Darcy’s law. This equation can be written as
where
Fluid overpressures are introduced into the model by considering a fluid source in the crust that increases exponentially with depth:
where
Regarding the crust permeability, we have taken the empirical relation established by Manning and Ingebritsen (1999):
where
where
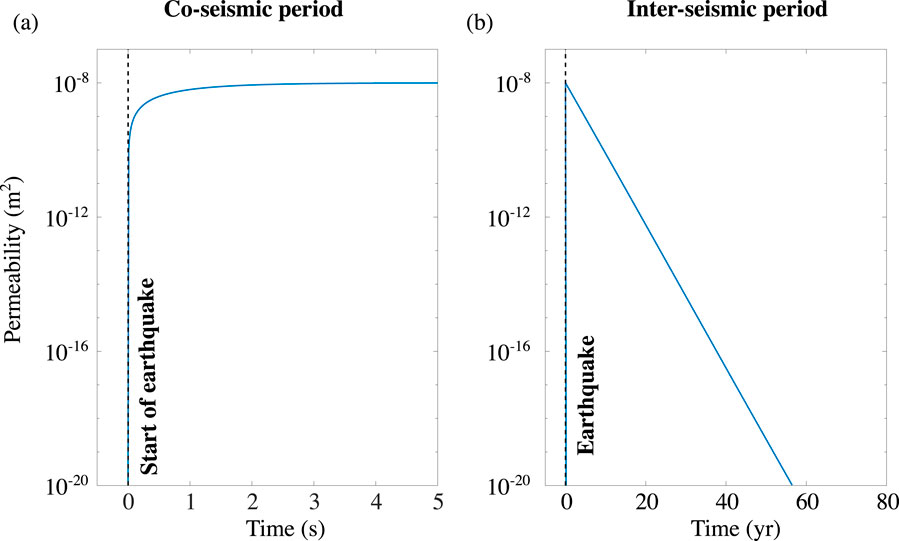
Figure 2. Illustration of permeability evolution (see Equation 11) on the fault during (A) coseismic period (when
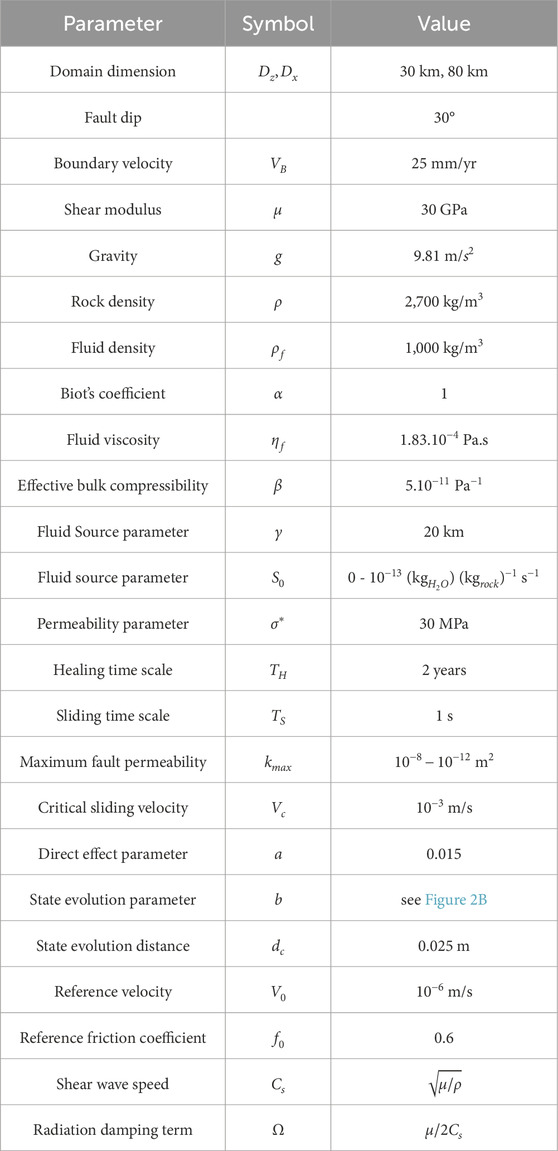
The parameters appearing in these equations are poorly constrained owing to the complexity of the governing processes and the difficulty of obtaining measurements at the relevant spatial and temporal scales. The most important parameter is undoubtedly
Note that kb appearing in Equation 12 is computed from Equation 10 while kf is calculated from Equation 11.
The above system of partial differential equations is solved for velocities and fluid pressure using the continuous Galerkin Finite Element method employing 7-node triangles and 7 integration points (Simpson, 2017). We use an unstructured mesh that permits local refinement adjacent to the fault, where the node spacing is
Boundary conditions employed for the numerical calculations are illustrated in Figure 3. We assume that the vertical effective stress is initially given by
where
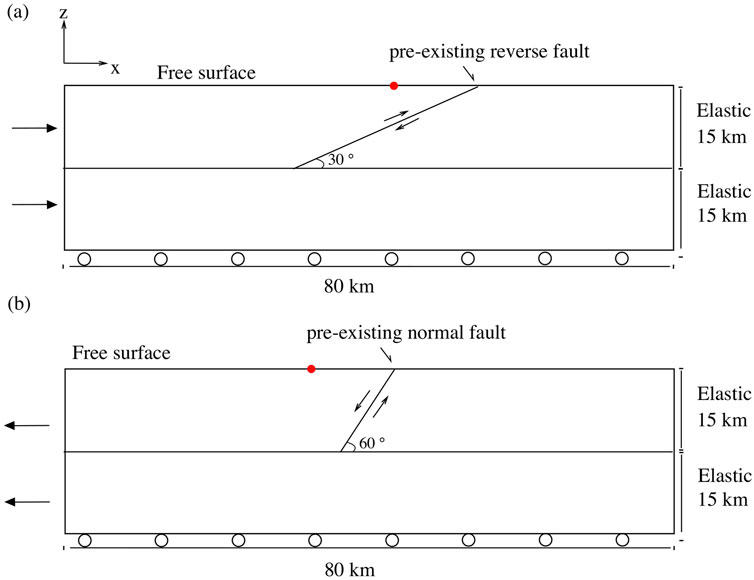
Figure 3. Geometry of the model, consisting of an elastic layer with an embedded discrete planar fault. For convergent experiments (A) we assume that the fault has a dip of 30°, while for extensional experiments (B) the fault has a dip of 60°, implying that faults are optimally oriented for frictional sliding (assuming a background friction angle of 30°). Figures 10–13 show surface displacements at locations indicated by red dots.
where
where
3 Results
We seek to understand how coseismic and post-seismic drainage of an overpressured fault zone influences the pressure and displacement fields following ruptures on normal and reverse faults. For comparison we compute results with no fluid pressure variations (i.e., fully drained), which might refer to a system with a very high permeability. In addition, we present results with no pre-rupture fluid overpressure, so that all poroelastic effects are induced by coseismic volumetric strain. We focus mainly on fluid pressure variations and vertical displacements or velocities at the surface.
Figure 4 illustrates the mean slip on normal and reverse faults based on three models: fully drained, without overpressure, and with overpressure at the onset of rupture. For the normal fault, the inter-seismic periods are approximately equivalent. In this case, because the earthquakes nucleate around 6–7 km below the surface, the influence of the fluid source (greatest near the base of the fault) is secondary on the earthquake recurrence. For reverse faults, where nucleation occurs at greater depths (see Supplementary Figure S1), we find that for simulations with overpressure at the onset of the fault slip, the inter-seismic period and co-seismic slip are reduced compared to others simulations, consistent with many previous studies (Kozdon and Dunham, 2013; Lapusta and Rice, 2003; Liu et al., 2005; Marguin and Simpson, 2023).
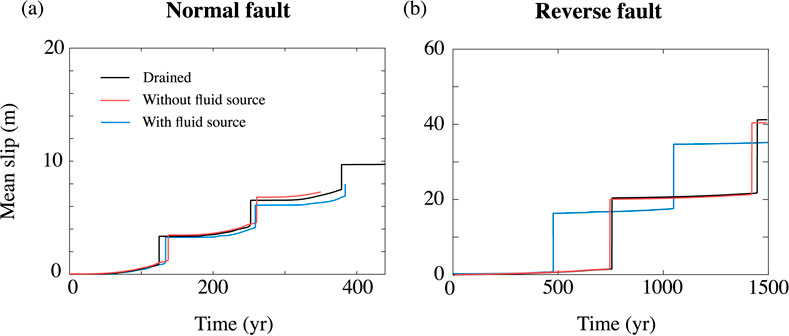
Figure 4. Mean slip for a normal fault (A) and reverse fault (B) encompassing 3 simulations: fully drained (black curve), no pre-rupture fluid overpressure (red curve) and with a pre-rupture fluid overpressure (blue curve).
Figure 5 shows excess fluid pressures shortly before, during and immediately after ruptures on normal and reverse faults in partially-drained simulations without a fluid source. In both cases, fluid pressure variations are directly linked with changes in coseismic volumetric strain, with compressional zones generating positive fluid pressure anomalies and extensional regions leading to reduction in fluid pressures. The fluid pressure anomalies associated with the normal fault rupture are opposite in sign to those related to the reverse rupture and they are a factor of several times smaller because the ruptures are smaller in extension, due to the less compressive stress state and lower shear stress level (see also Supplementary Figure S1). Although the coseismic fluid pressure anomalies dissipate somewhat after rupture, they continue to persist during the interseismic period, especially near the base of faults due to relatively low permeabilities at depth.
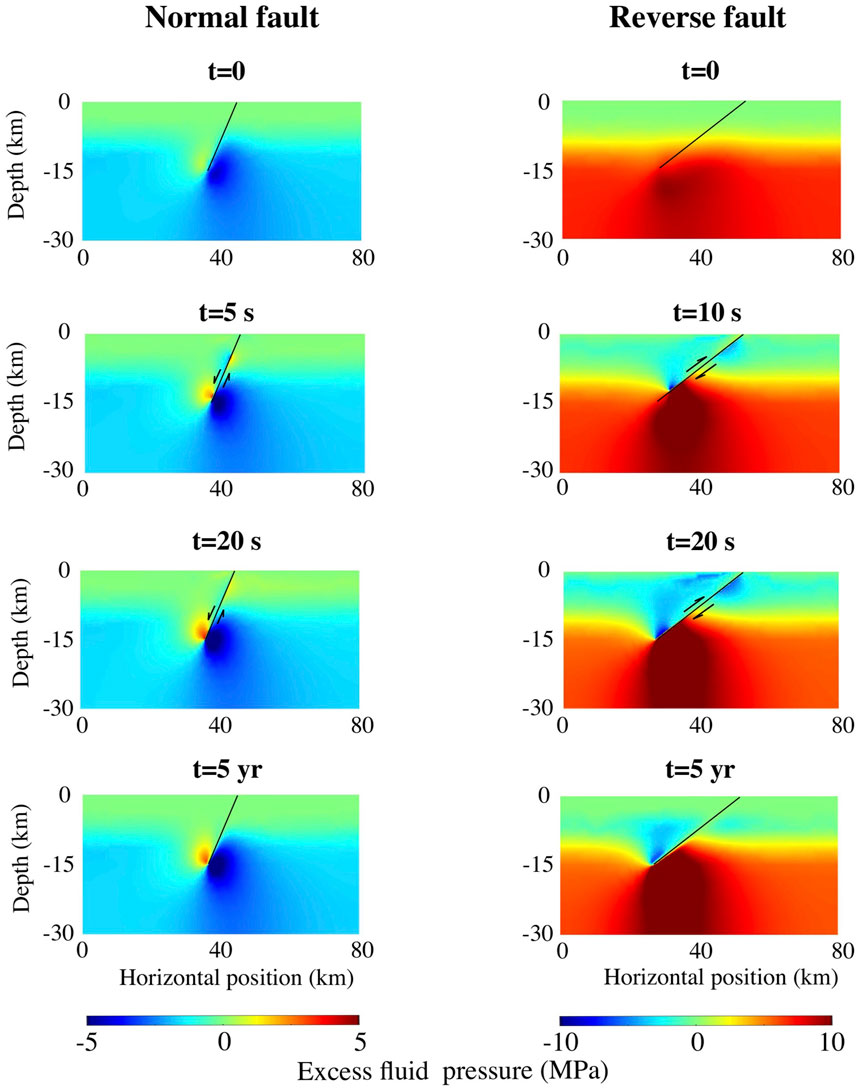
Figure 5. Snapshots of the fluid overpressure at different times shortly before, during, and after ruptures on normal (left) and reverse (right) faults in simulations with no pre-rupture fluid overpressure (i.e., without fluid source,
Figures 6, 7 illustrate fluid pressures associated with ruptures on normal and reverse faults in simulations with a long term fluid source at depth. In both cases, the bases of the faults are significantly overpressured at the onset of ruptures. During ruptures, fluid pressure variations are mostly induced by changes in coseismic volumetric strain, as they were previously (i.e., see Figure 5 and also Figures 8A, B). Although the faults experience a large coseismic increase in permeability on the faults, there is insufficient time during ruptures to enable significant drainage of the pre-rupture fluid pressure anomalies. However, large decreases in excess fluid pressures are observed close to the faults in the few years following ruptures (see also Figures 8C, D), which results from fluid flow up the fault. Efficient fluid pressure drainage is favoured by large increases in coseismic permeability and relatively long permeability healing times (i.e., large
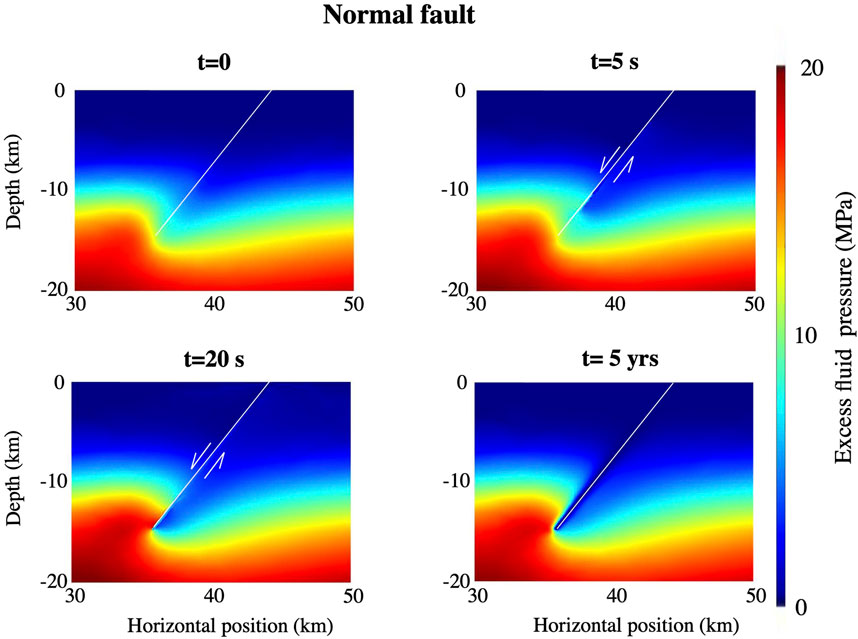
Figure 6. Snapshots of the fluid overpressure at different times shortly before, during, and after a large mainshock on a normal fault with a preexisting fluid overpressure due to fluid production (
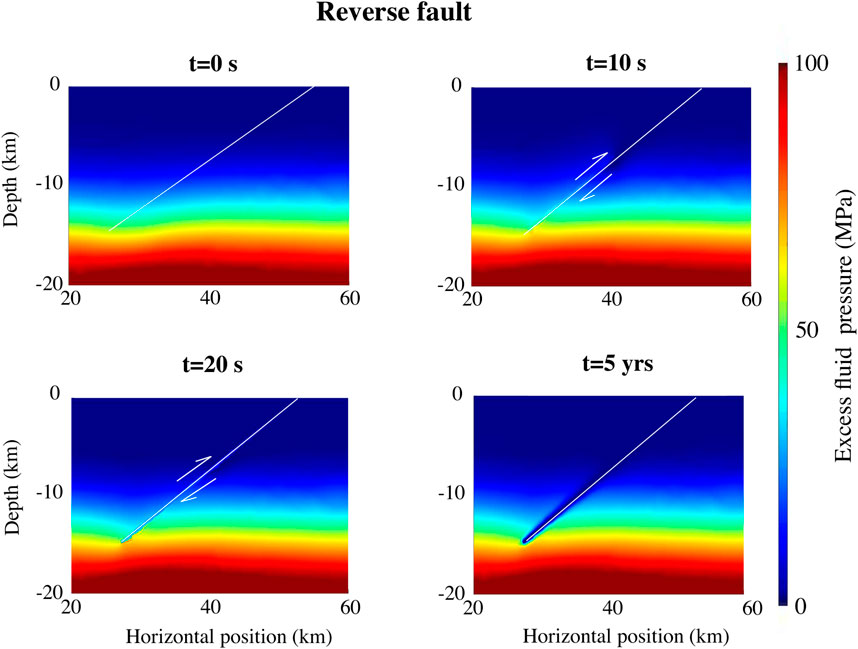
Figure 7. Snapshots of the fluid overpressure at different times shortly before, during, and after a large mainshock on a reverse fault with a preexisting fluid overpressure due to fluid production (
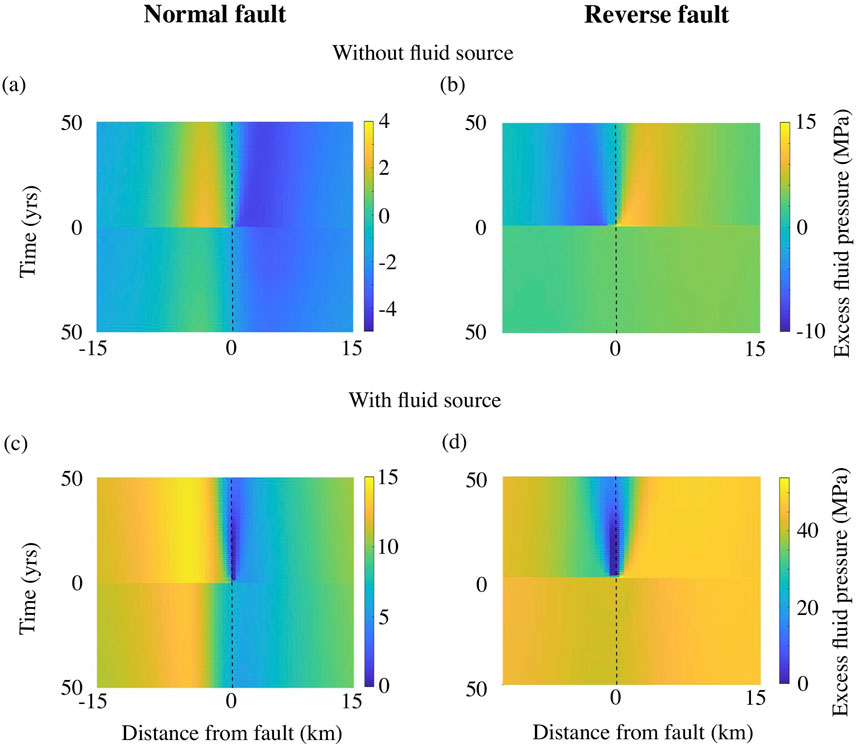
Figure 8. Excess fluid pressure at 12.5 km depth several years before and after earthquakes on normal (A, C) and reverse (B, D) faults. The two upper panels (A, B) are results from simulations without a fluid source, whereas the lower panels (C, D) are from simulations that included a fluid source. The dashed black lines indicate the fault position. Times are relative to the onset of rupture.
Figure 9 illustrates vertical velocities at the surface (with the background velocity removed) following ruptures on normal and reverse faults for the various fluid pressure scenarios. For the fully drained cases (Figure 9A), one observes only minor differences in velocities following rupture, which are localised close to the fault trace and largely independent of time. For simulations that include coseismic fluid pressure variations but without a fluid source, the surface velocity depends sensitively on the loading regime, with post-seismic subsidence in the case of normal faulting and postseismic uplift in the case of reverse faulting (Figure 9B). These effects are directly linked to the relaxation of coseismic fluid pressure anomalies generated close to the surface. For the simulations that included a finite fluid source, one observes post-seismic subsidence for both faulting regimes. In such cases, the surface subsidence is the result of drainage of a deep fluid pressure anomaly permitted by the permeability increase during rupture. The time scales of the post-seismic velocity variations at the surface in all models are controlled by the permeability structure of the crust and fault zone following rupture, since it controls how rapidly fluid pressure anomalies can be equilibrated. For the permeability parameters used in the simulations, the poroelastic response lasts a few years and is largely complete after about 1-2 decades.
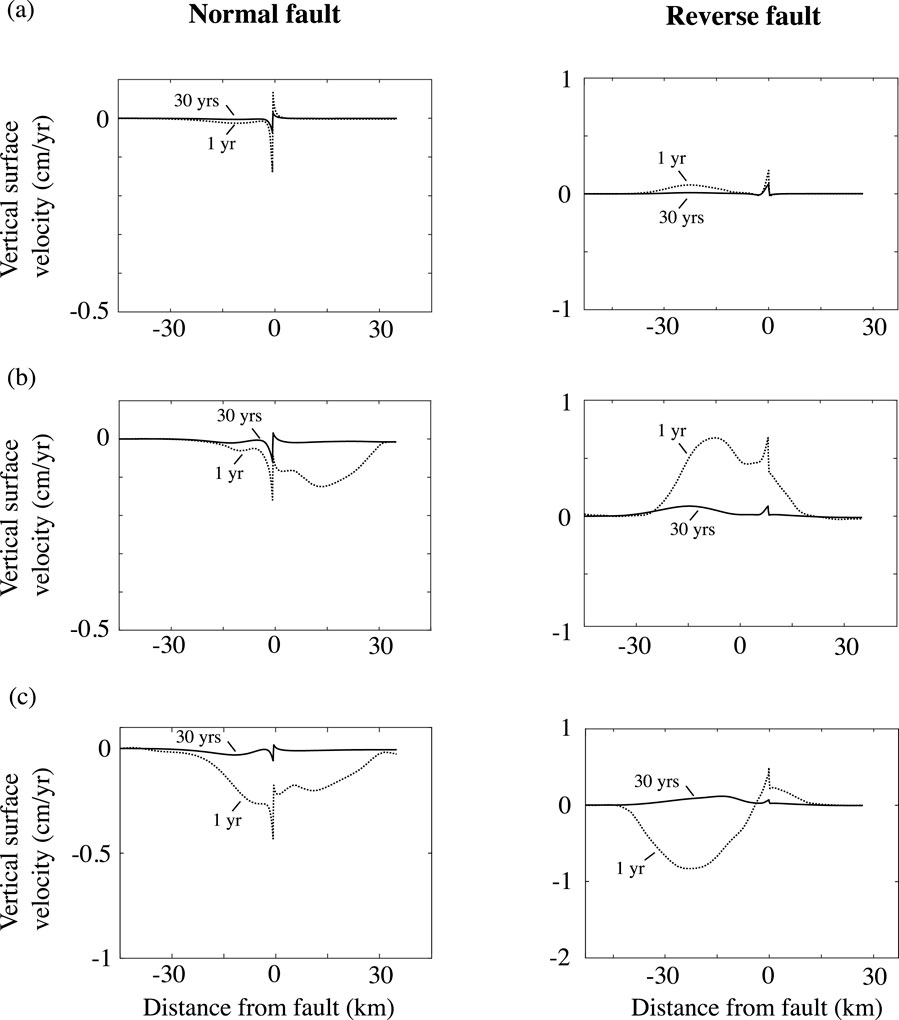
Figure 9. Vertical velocities at the surface (with the background velocity removed) following ruptures on normal (left) and reverse (right) faults with different fluid pressure regimes and
Figures 10, 11 shows similar results but in this case plotted in terms of vertical displacements and fluid pressures of single points versus time. Several aspects are noteworthy. First, in fully-drained models, displacements of the hangingwall blocks are linear in time (Figures 10A, 11A), whereas in all other models they are nonlinear, due to variations in fluid pressure. Second, in partially-drained models without a fluid pressure anomaly prior to rupture, the variations in displacement and fluid pressure are opposite for normal and reverse faulting (Figures 10B, 11B). This is because the fluid pressure anomalies result from variations in coseismic volumetric strain, which depend directly on the faulting style. Third, in models where faults are overpressured prior to rupture, both the fluid pressure and surface displacement responses are independent of fault style and are dominated by drainage of the pre-rupture fluid pressure anomaly. For the models investigated, the magnitude of the poroelastic response is significantly larger (by a factor of about 10) that in models where fluid pressure variations result solely from faulting.
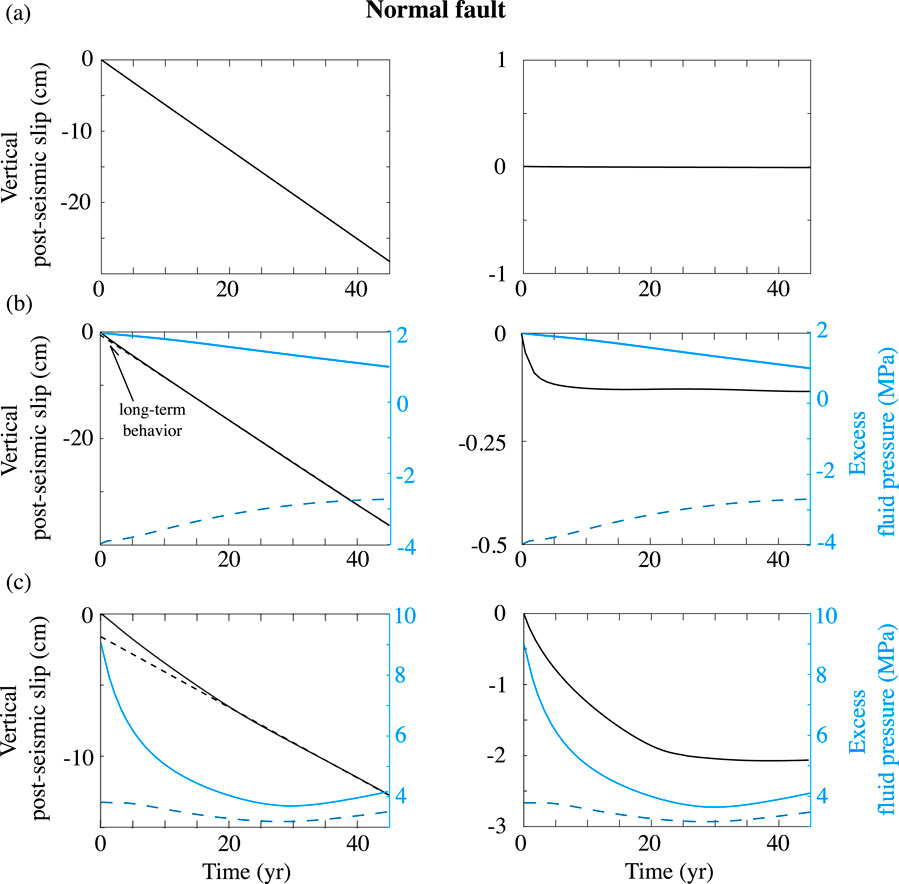
Figure 10. Vertical surface displacements in the hanging wall (−10 km from the fault, see Figure 1) and excess fluid pressure at 12.5 km depth and ± 2 km from the fault (i.e., light blue curve for the hanging-wall block and dash dark blue curve for the footwall block) for the time interval immediately following an earthquake (time = 0) on a normal fault with
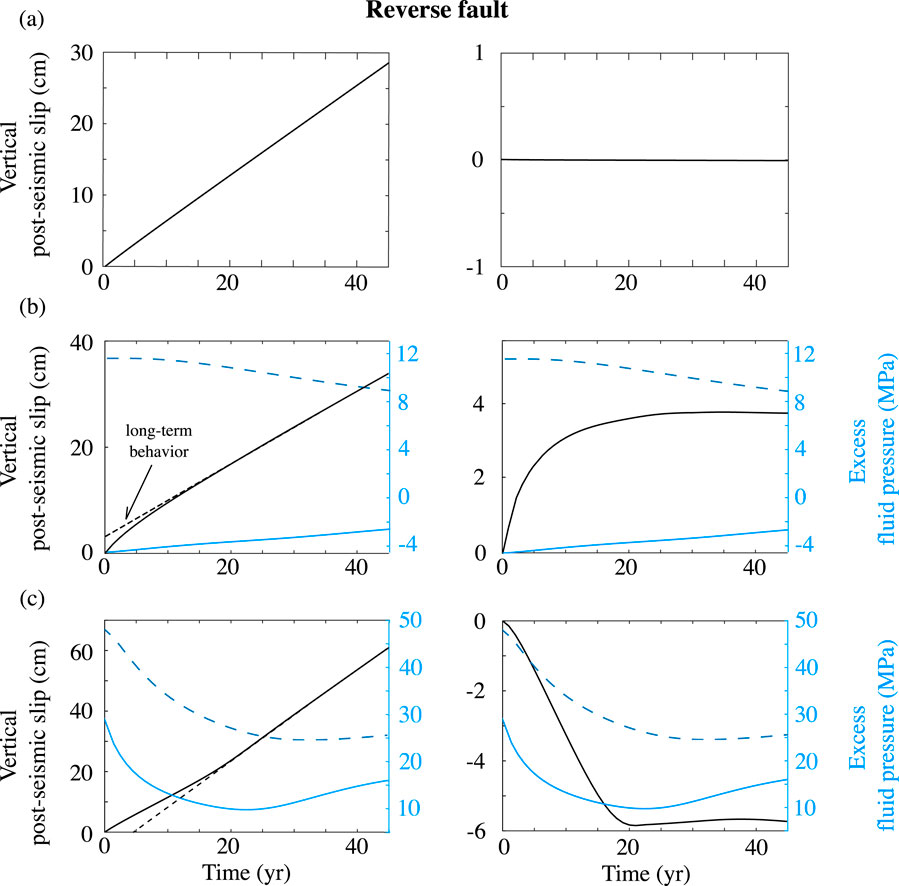
Figure 11. Vertical surface displacements in the hanging wall (−10 km from the fault, see Figure 1) and excess fluid pressure at 12.5 km depth and ± 2 km from the fault (i.e., light blue curve for the hanging-wall block and dashed dark blue curve for the footwall block) for the time interval immediately following an earthquake (time = 0) on a reverse fault with
Figure 12 shows horizontal displacements of single points versus time following ruptures on normal and reverse faults for the same fluid pressure scenarios. In the case of a normal fault (see Figure 12A), we found that the horizontal displacement at the surface following an earthquake is linear and decreases in time, indicating that the hangingwall block moves to the left (i.e., in the extensional direction, see Figure 1B). For this fault type, there is little difference in horizontal displacement between the three model scenarios (fully drained, without fluid overpressure before rupture, and with fluid overpressure before rupture). Thus, in this case, horizontal displacements are insensitive to postseismic drainage of fluid pressure anomalies. In the case of reverse faulting, the hangingwall block is expected to move in the direction of compression following an earthquake, as is observed in the fully drained model (see black curve in Figure 12B). However, in the model where the fault was overpressured at the time of rupture, the hangwall block experiences a phase lasting
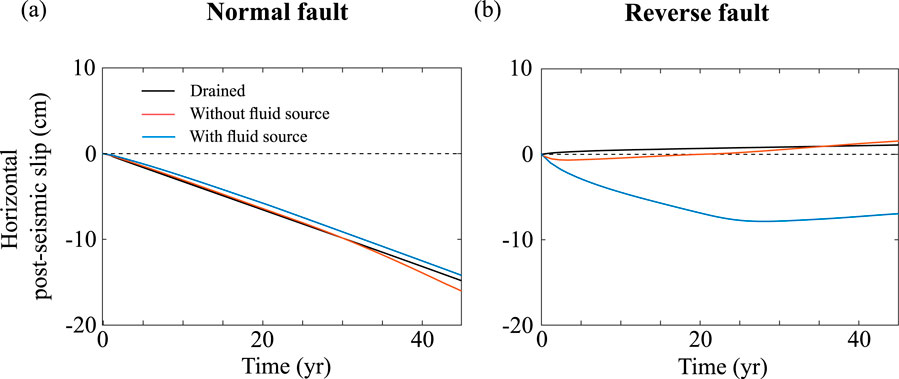
Figure 12. Horizontal surface displacements in the hanging wall (−10 km from the fault, see Figure 1) for the time interval immediately following an earthquake (time = 0), with
In models where faults are overpressurised at the onset of rupture, the time scale for poroelastic relaxation is dependent on the maximum coseismic permeability
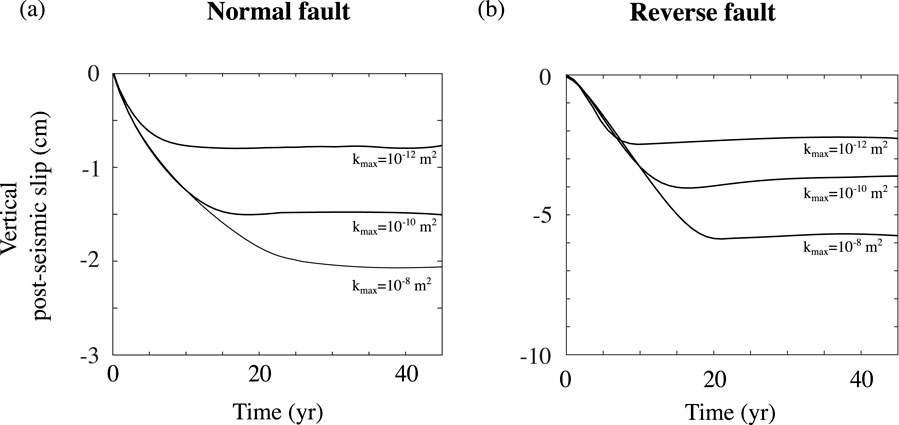
Figure 13. Vertical surface displacements in the hanging wall (−10 km from the fault, see Figure 1) versus time following ruptures on normal (A) and reverse (B) faults from simulations with long term fluid production, computed with different coseismic fault permeabilities
4 Discussion
Many studies have drawn upon poroelasticity in order to explain transient displacement fields following large earthquakes (e.g., Peltzer et al., 1996; 1998; McCormack et al., 2020; Peña et al., 2022). However in most previous work, the poroelastic effects investigated are linked to the relaxation of pore pressure anomalies created during coseismic slip. Here we focus on a different poroelastic phenonemon that stems from the possibility that faults may already be overpressured at the time of rupture (e.g., see Sibson et al., 1988; Sibson, 1990; Cox, 2005; Curzi et al., 2023). We highlight that drainage from an overpressured fault zone can have an important additional influence on the postseismic displacement field following rupture. Ultimately, our results suggest that the postseismic displacements (especially in the vertical direction) may contain important information concerning the fluid pressure state and permeability structure of faults during and immediately following earthquakes.
In this research we have shown that in situations where faults are overpressurised at the time they rupture, then fluid drainage along a ruptured fault and the resulting fluid pressure decrease may induce a distinct phase of postseismic subsidence, observable at the surface. The time scale and magnitude of this poroelastic subsidence (i.e., above overpressurised faults) depends on the coseismic permeability and on how rapidly the fault permeability recovers following an earthquake, whereas it is independent of the size of an earthquake, since it is driven not by the magnitude of coseismic slip but by the magnitude of fluid pressure relaxation. This relaxation occurs irrespective of the faulting regime and fault geometry and is therefore quite different from the classic coseismic poroelastic response (Segall, 2010) as well as other postseismic effects related to either post-rupture fault slip (e.g., Freed et al., 2017; Guo et al., 2019a; Huang et al., 2017; Shrivastava et al., 2016) or viscous deformation (e.g., Freed and Lin, 2001; Guo et al., 2019b). In addition, whereas the magnitude of pore pressure changes induced by coseismic strain are typically on the order of 1 MPa, the variations resulting from rupture of previously overpressurised fault zones are potentially at least an order of magnitude greater.
Although we have not attempted to apply our models to specific observations, our results might aid in interpreting and understanding some data. For example, Pritchard et al. (2013) observed significant post-seismic subsidence in the weeks following the 2010 Maule earthquake in Chile. They suggest that this subsidence is possibly associated with the release of fluids from hydrothermal systems, facilitated by increased permeability in fault zones, which is consistent with our models (see Figures 10, 11, 13). A similar explanation was proposed to account for anomalous subsidence of the Yellowstone caldera linked to seismicity which began in 1985 (Waite and Smith, 2002). In cases when faults are not significantly overpressured at the time of rupture, we expect a normal poroelastic postseismic geodetic response, similar to that which has been described in previous studies (e.g., Peltzer et al., 1996; 1998; McCormack et al., 2020; Peña et al., 2022). Some studies have noted that the hydrological changes induced by earthquakes that are not well predicted by the coseismic strain field (e.g., Cox et al., 2012; Manga and Rowland, 2009; Wang et al., 2004), which is consistent with our model results when faults are overpressurised. Cox et al. (2012) in particular suggested that groundwater changes and liquefaction associated with the 2011 Darfield earthquake near Christchurch (New Zealand) resulted from rapid fluid release from an overpressured reservoir, which is entirely plausible based on our results. Similar interpretations have been made by Miller et al. (2004) and Terakawa et al. (2010). Other studies have noted significant changes in seismic velocities of the crust surrounding recently ruptured faults (Chaves and Schwartz, 2016; Chiarabba et al., 2022). Large fluid pressure changes resulting from rupture would provide a potential explanation for these transient variations, though other explanations are also possible (Rubinstein and Beroza, 2004).
At this stage, there are several factors that severely limit the predictive capability of our modelling. First, we have somewhat arbitrarily assumed that fluid pressures are generated in the lower part of the crust. Although we think this is plausible, we have not attempted to incorporate specific processes responsible for fluid production (e.g., dehydration reactions) or to quantify whether our fluid production rates are physically reasonable. Having said that, the magnitude of our fluid pressure anomalies at the time of rupture are reasonable in that many studies have reported evidence for significant fluid overpressures at mid-crustal depths (Etheridge et al., 1984; Fisher et al., 1995; Sibson, 2017; Suppe, 2014). Second, we have assumed an ad hoc law describing how the permeability changes over an earthquake cycle. Our equation is physically reasonable but governed by two poorly constrained parameters, the maximum coseismic permeability
5 Conclusion
Our study shows that the poroelastic response to earthquakes on dip-slip faults depends critically on the fluid pressure state in the crust prior to rupture. If the crust is normally pressurised (i.e., with hydrostatic fluid pressures) then pore-pressure variations induced by rupture are entirely controlled by the field of volumetric elastic strain. In this case, the poroelastic response depends on the magnitude of coseismic slip and the faulting style. On the other hand, if the crust is appreciably overpressured at the time of rupture, these effects may be entirely overwhelmed by the overall tendency for drainage and fluid pressure decrease from the overpressured crust. In this case, postseismic subsidence is observed at the surface irrespective of fault style or details of the strain field. The magnitude of this postseismic subsidence could be at least an order of magnitude greater than the classic poroelastic response (i.e., relaxation of pore pressures generated by coseismic elastic volumetric strain). Large postseismic subsidence is favoured by large pre-rupture fluid overpressures, large permeabilities during rupture and slow recovery of the permeability following rupture. The results suggest that postseismic deformation associated with overpressured crust may be distinctly different from that in crust with no long term fluid overpressure.
Data availability statement
The original contributions presented in the study are included in the article/Supplementary Material, further inquiries can be directed to the corresponding author.
Author contributions
VM: Conceptualization, Formal Analysis, Investigation, Methodology, Validation, Visualization, Writing–original draft, Writing–review and editing. GS: Conceptualization, Formal Analysis, Funding acquisition, Investigation, Methodology, Project administration, Supervision, Validation, Writing–original draft, Writing–review and editing, Visualization.
Funding
The author(s) declare that financial support was received for the research, authorship, and/or publication of this article. The Swiss National Science Foundation (project 200021_184626) is thanked for funding.
Conflict of interest
The authors declare that the research was conducted in the absence of any commercial or financial relationships that could be construed as a potential conflict of interest.
Publisher’s note
All claims expressed in this article are solely those of the authors and do not necessarily represent those of their affiliated organizations, or those of the publisher, the editors and the reviewers. Any product that may be evaluated in this article, or claim that may be made by its manufacturer, is not guaranteed or endorsed by the publisher.
Supplementary material
The Supplementary Material for this article can be found online at: https://www.frontiersin.org/articles/10.3389/feart.2024.1423174/full#supplementary-material
References
Akita, F., and Matsumoto, N. (2004). Hydrological responses induced by the Tokachi-oki earthquake in 2003 at hot spring wells in Hokkaido, Japan. Geophys. Res. Lett. 31. doi:10.1029/2004gl020433
Árnadóttir, T., Jónsson, S., Pollitz, F. F., Jiang, W., and Feigl, K. L. (2005). Postseismic deformation following the June 2000 earthquake sequence in the south Iceland seismic zone. J. Geophys. Res. Solid Earth 110. doi:10.1029/2005jb003701
Barbot, S., and Fialko, Y. (2010). A unified continuum representation of post-seismic relaxation mechanisms: semi-analytic models of afterslip, poroelastic rebound and viscoelastic flow. Geophys. J. Int. 182, 1124–1140. doi:10.1111/j.1365-246x.2010.04678.x
Chaves, E. J., and Schwartz, S. Y. (2016). Monitoring transient changes within overpressured regions of subduction zones using ambient seismic noise. Sci. Adv. 2, e1501289. doi:10.1126/sciadv.1501289
Chiarabba, C., De Gori, P., Valoroso, L., Petitta, M., and Carminati, E. (2022). Large extensional earthquakes push-up terrific amount of fluids. Sci. Rep. 12, 14597. doi:10.1038/s41598-022-18688-6
Connolly, J. (1997). Devolatilization-generated fluid pressure and deformation-propagated fluid flow during prograde regional metamorphism. J. Geophys. Res. Solid Earth 102, 18149–18173. doi:10.1029/97jb00731
Cox, S. C., Rutter, H., Sims, A., Manga, M., Weir, J., Ezzy, T., et al. (2012). Hydrological effects of the mw 7.1 Darfield (canterbury) earthquake, 4 september 2010, New Zealand. N. Z. J. Geol. Geophys. 55, 231–247. doi:10.1080/00288306.2012.680474
Cox, S. C., van Ballegooy, S., Rutter, H. K., Harte, D. S., Holden, C., Gulley, A. K., et al. (2021). Can artesian groundwater and earthquake-induced aquifer leakage exacerbate the manifestation of liquefaction? Eng. Geol. 281, 105982. doi:10.1016/j.enggeo.2020.105982
Cox, S. F. (2005) “Coupling between deformation, fluid pressures, and fluid flow in ore-producing hydrothermal systems at depth in the crust,” in One hundredth anniversary, Volume. Littleton, USA: Society of Economic Geologists. doi:10.5382/av100.04
Cox, S. F., and Munroe, S. M. (2016). Breccia formation by particle fluidization in fault zones: implications for transitory, rupture-controlled fluid flow regimes in hydrothermal systems. Am. J. Sci. 316, 241–278. doi:10.2475/03.2016.02
Curzi, M., Cipriani, A., Aldega, L., Billi, A., Carminati, E., Van der Lelij, R., et al. (2023). Architecture and permeability structure of the sibillini mts. thrust and influence upon recent, extension-related seismicity in the central apennines (Italy) through fault-valve behavior. GSA Bull. 136, 3–26. doi:10.1130/b36616.1
Dal Zilio, L., and Gerya, T. (2022). Subduction earthquake cycles controlled by episodic fluid pressure cycling. Lithos 426, 106800. doi:10.1016/j.lithos.2022.106800
Dieterich, J. H. (1979). Modeling of rock friction: 1. experimental results and constitutive equations. J. Geophys. Res. Solid Earth 84, 2161–2168. doi:10.1029/jb084ib05p02161
Doglioni, C., Barba, S., Carminati, E., and Riguzzi, F. (2014). Fault on–off versus coseismic fluids reaction. Geosci. Front. 5, 767–780. doi:10.1016/j.gsf.2013.08.004
Etheridge, M. A., Wall, V., Cox, S. F., and Vernon, R. (1984). High fluid pressures during regional metamorphism and deformation: implications for mass transport and deformation mechanisms. J. Geophys. Res. Solid Earth 89, 4344–4358. doi:10.1029/jb089ib06p04344
Fialko, Y. (2004). Evidence of fluid-filled upper crust from observations of postseismic deformation due to the 1992 Mw7.3 Landers earthquake. J. Geophys. Res. Solid Earth 109. doi:10.1029/2004jb002985
Fisher, D. M., Brantley, S. L., Everett, M., and Dzvonik, J. (1995). Cyclic fluid flow through a regionally extensive fracture network within the Kodiak accretionary prism. J. Geophys. Res. Solid Earth 100, 12881–12894. doi:10.1029/94jb02816
Freed, A. M., Hashima, A., Becker, T. W., Okaya, D. A., Sato, H., and Hatanaka, Y. (2017). Resolving depth-dependent subduction zone viscosity and afterslip from postseismic displacements following the 2011 tohoku-oki, Japan earthquake. Earth Planet. Sci. Lett. 459, 279–290. doi:10.1016/j.epsl.2016.11.040
Freed, A. M., and Lin, J. (2001). Delayed triggering of the 1999 Hector Mine earthquake by viscoelastic stress transfer. Nature 411, 180–183. doi:10.1038/35075548
Gischig, V. S. (2015). Rupture propagation behavior and the largest possible earthquake induced by fluid injection into deep reservoirs. Geophys. Res. Lett. 42, 7420–7428. doi:10.1002/2015gl065072
Guo, R., Zheng, Y., Xu, J., and Jiang, Z. (2019a). Seismic and aseismic fault slip associated with the 2017 Mw 8.2 Chiapas, Mexico, earthquake sequence. Seismol. Res. Lett. 90, 1111–1120. doi:10.1785/0220180262
Guo, R., Zheng, Y., Xu, J., and Riaz, M. S. (2019b). Transient viscosity and afterslip of the 2015 Mw 8.3 Illapel, Chile, earthquake. Bull. Seismol. Soc. Am. 109, 2567–2581. doi:10.1785/0120190114
Heap, M. J., and Kennedy, B. M. (2016). Exploring the scale-dependent permeability of fractured andesite. Earth Planet. Sci. Lett. 447, 139–150. doi:10.1016/j.epsl.2016.05.004
Huang, M.-H., Fielding, E. J., Liang, C., Milillo, P., Bekaert, D., Dreger, D., et al. (2017). Coseismic deformation and triggered landslides of the 2016 w 6.2 Amatrice earthquake in Italy. Geophys. Res. Lett. 44, 1266–1274. doi:10.1002/2016gl071687
Hughes, K. L., Masterlark, T., and Mooney, W. D. (2010). Poroelastic stress-triggering of the 2005 M8. 7 nias earthquake by the 2004 M9.2 sumatra–andaman earthquake. Earth Planet. Sci. Lett. 293, 289–299. doi:10.1016/j.epsl.2010.02.043
Im, K., Elsworth, D., and Wang, C. (2019). Cyclic permeability evolution during repose then reactivation of fractures and faults. J. Geophys. Res. Solid Earth 124, 4492–4506. doi:10.1029/2019jb017309
Ishibashi, T., Elsworth, D., Fang, Y., Riviere, J., Madara, B., Asanuma, H., et al. (2018). Friction-stability-permeability evolution of a fracture in granite. Water Resour. Res. 54, 9901–9918. doi:10.1029/2018wr022598
Jónsson, S., Segall, P., Pedersen, R., and Björnsson, G. (2003). Post-earthquake ground movements correlated to pore-pressure transients. Nature 424, 179–183. doi:10.1038/nature01776
Koizumi, N., Kitagawa, Y., Matsumoto, N., Takahashi, M., Sato, T., Kamigaichi, O., et al. (2004). Preseismic groundwater level changes induced by crustal deformations related to earthquake swarms off the east coast of Izu Peninsula, Japan. Geophys. Res. Lett. 31. doi:10.1029/2004gl019557
Kozdon, J. E., and Dunham, E. M. (2013). Rupture to the trench: dynamic rupture simulations of the 11 March 2011 Tohoku earthquake. Bull. Seismol. Soc. Am. 103, 1275–1289. doi:10.1785/0120120136
Lamur, A., Kendrick, J., Eggertsson, G., Wall, R., Ashworth, J., and Lavallée, Y. (2017). The permeability of fractured rocks in pressurised volcanic and geothermal systems. Sci. Rep. 7, 6173. doi:10.1038/s41598-017-05460-4
Lapusta, N., and Rice, J. R. (2003). Nucleation and early seismic propagation of small and large events in a crustal earthquake model. J. Geophys. Res. Solid Earth 108. doi:10.1029/2001jb000793
Liu, S.-F., Nummedal, D., Yin, P.-G., and Luo, H.-J. (2005). Linkage of Sevier thrusting episodes and Late Cretaceous foreland basin megasequences across southern Wyoming (USA). Basin Res. 17, 487–506. doi:10.1111/j.1365-2117.2005.00277.x
Lupi, M., Saenger, E. H., Fuchs, F., and Miller, S. A. (2013). Lusi mud eruption triggered by geometric focusing of seismic waves. Nat. Geosci. 6, 642–646. doi:10.1038/ngeo1884
Maestrelli, D., Bonini, M., Delle Donne, D., Manga, M., Piccardi, L., and Sani, F. (2017). Dynamic triggering of mud volcano eruptions during the 2016–2017 Central Italy seismic sequence. J. Geophys. Res. Solid Earth 122, 9149–9165. doi:10.1002/2017jb014777
Manga, M., and Rowland, J. C. (2009). Response of alum rock springs to the October 30, 2007 Alum rock earthquake and implications for the origin of increased discharge after earthquakes. Geofluids 9, 237–250. doi:10.1111/j.1468-8123.2009.00250.x
Manga, M., and Wang, C. (2015). Earthquake hydrology. Treatise Geophys., 305–328. doi:10.1016/b978-0-444-53802-4.00082-8
Manning, C. E., and Ingebritsen, S. E. (1999). Permeability of the continental crust: implications of geothermal data and metamorphic systems. Rev. Geophys. 37, 127–150. doi:10.1029/1998rg900002
Marguin, V., and Simpson, G. (2023). Influence of fluids on earthquakes based on numerical modeling. J. Geophys. Res. Solid Earth 128, e2022JB025132. doi:10.1029/2022jb025132
Marone, C. (1998). The effect of loading rate on static friction and the rate of fault healing during the earthquake cycle. Nature 391, 69–72. doi:10.1038/34157
McClure, M. W. (2015). Generation of large postinjection-induced seismic events by backflow from dead-end faults and fractures. Geophys. Res. Lett. 42, 6647–6654. doi:10.1002/2015gl065028
McClure, M. W., and Horne, R. N. (2011). Investigation of injection-induced seismicity using a coupled fluid flow and rate/state friction model. Geophysics 76, WC181–WC198. doi:10.1190/geo2011-0064.1
McCormack, K., Hesse, M. A., Dixon, T., and Malservisi, R. (2020). Modeling the contribution of poroelastic deformation to postseismic geodetic signals. Geophys. Res. Lett. 47, e2020GL086945. doi:10.1029/2020gl086945
Miller, S. A. (1997). The behavior of 3-Dimensional fluid-controlled earthquake model: applications and implications. ETH Zurich.
Miller, S. A., Collettini, C., Chiaraluce, L., Cocco, M., Barchi, M., and Kaus, B. J. (2004). Aftershocks driven by a high-pressure CO2 source at depth. Nature 427, 724–727. doi:10.1038/nature02251
Muir-Wood, R., and King, G. C. (1993). Hydrological signatures of earthquake strain. J. Geophys. Res. Solid Earth 98, 22035–22068. doi:10.1029/93jb02219
Noir, J., Jacques, E., Bekri, S., Adler, P., Tapponnier, P., and King, G. (1997). Fluid flow triggered migration of events in the 1989 Dobi earthquake sequence of Central Afar. Geophys. Res. Lett. 24, 2335–2338. doi:10.1029/97gl02182
Norton, D. L. (1984). Theory of hydrothermal systems. Annu. Rev. Earth Planet. Sci. 12, 155–177. doi:10.1146/annurev.earth.12.1.155
Peltzer, G., Rosen, P., Rogez, F., and Hudnut, K. (1996). Postseismic rebound in fault step-overs caused by pore fluid flow. Science 273, 1202–1204. doi:10.1126/science.273.5279.1202
Peltzer, G., Rosen, P., Rogez, F., and Hudnut, K. (1998). Poroelastic rebound along the Landers 1992 earthquake surface rupture. J. Geophys. Res. Solid Earth 103, 30131–30145. doi:10.1029/98jb02302
Peña, C., Heidbach, O., Moreno, M., Bedford, J., Ziegler, M., Tassara, A., et al. (2020). Impact of power-law rheology on the viscoelastic relaxation pattern and afterslip distribution following the 2010 Mw 8.8 Maule earthquake. Earth Planet. Sci. Lett. 542, 116292. doi:10.1016/j.epsl.2020.116292
Peña, C., Metzger, S., Heidbach, O., Bedford, J., Bookhagen, B., Moreno, M., et al. (2022). Role of poroelasticity during the early postseismic deformation of the 2010 Maule megathrust earthquake. Geophys. Res. Lett. 49, e2022GL098144. doi:10.1029/2022gl098144
Pritchard, M., Jay, J., Aron, F., Henderson, S., and Lara, L. (2013). Subsidence at southern Andes volcanoes induced by the 2010 Maule, Chile earthquake. Nat. Geosci. 6, 632–636. doi:10.1038/ngeo1855
Quilty, E. G., and Roeloffs, E. A. (1997). Water-level changes in response to the 20 December 1994 earthquake near Parkfield, California. Bull. Seismol. Soc. Am. 87, 310–317. doi:10.1785/bssa0870020310
Renard, F., Gratier, J.-P., and Jamtveit, B. (2000). Kinetics of crack-sealing, intergranular pressure solution, and compaction around active faults. J. Struct. Geol. 22, 1395–1407. doi:10.1016/s0191-8141(00)00064-x
Rubinstein, J. L., and Beroza, G. C. (2004). Evidence for widespread nonlinear strong ground motion in the mw 6.9 Loma Prieta earthquake. Bull. Seismol. Soc. Am. 94, 1595–1608. doi:10.1785/012004009
Ruina, A. (1983). Slip instability and state variable friction laws. J. Geophys. Res. Solid Earth 88, 10359–10370. doi:10.1029/jb088ib12p10359
Segall, P., and Rice, J. R. (1995). Dilatancy, compaction, and slip instability of a fluid-infiltrated fault. J. Geophys. Res. Solid Earth 100, 22155–22171. doi:10.1029/95jb02403
Shrivastava, M. N., González, G., Moreno, M., Chlieh, M., Salazar, P., Reddy, C., et al. (2016). Coseismic slip and afterslip of the 2015 w 8.3 Illapel (Chile) earthquake determined from continuous GPS data. Geophys. Res. Lett. 43, 10–710. doi:10.1002/2016gl070684
Sibson, R. H. (1986). Rupture interaction with fault jogs. Earthq. Source Mech. 37, 157–167. doi:10.1029/gm037p0157
Sibson, R. H. (1990) Conditions for fault-valve behaviour, 54. London, UK: Geological Society, London, Special Publications, 15–28.
Sibson, R. H. (2017). Tensile overpressure compartments on low-angle thrust faults. Earth, Planets Space 69, 113–115. doi:10.1186/s40623-017-0699-y
Sibson, R. H., Robert, F., and Poulsen, K. H. (1988). High-angle reverse faults, fluid-pressure cycling, and mesothermal gold-quartz deposits. Geology 16, 551–555. doi:10.1130/0091-7613(1988)016<0551:harffp>2.3.co;2
Simpson, G. (2017). Practical finite element modeling in earth science using matlab. John Wiley and Sons.
Suppe, J. (2014). Fluid overpressures and strength of the sedimentary upper crust. J. Struct. Geol. 69, 481–492. doi:10.1016/j.jsg.2014.07.009
Tenthorey, E., Cox, S. F., and Todd, H. F. (2003). Evolution of strength recovery and permeability during fluid–rock reaction in experimental fault zones. Earth Planet. Sci. Lett. 206, 161–172. doi:10.1016/s0012-821x(02)01082-8
Terakawa, T., Zoporowski, A., Galvan, B., and Miller, S. A. (2010). High-pressure fluid at hypocentral depths in the l’aquila region inferred from earthquake focal mechanisms. Geology 38, 995–998. doi:10.1130/g31457.1
Waite, G. P., and Smith, R. B. (2002). Seismic evidence for fluid migration accompanying subsidence of the yellowstone caldera. J. Geophys. Res. Solid Earth 107. doi:10.1029/2001jb000586
Walder, J., and Nur, A. (1984). Porosity reduction and crustal pore pressure development. J. Geophys. Res. Solid Earth 89, 11539–11548. doi:10.1029/jb089ib13p11539
Wang, C.-Y., Cheng, L.-H., Chin, C.-V., and Yu, S.-B. (2001). Coseismic hydrologic response of an alluvial fan to the 1999 Chi-Chi earthquake, Taiwan. Geology 29, 831–834. doi:10.1130/0091-7613(2001)029<0831:chroaa>2.0.co;2
Wang, C.-Y., and Manga, M. (2015). New streams and springs after the 2014 Mw6.0 south napa earthquake. Nat. Commun. 6, 7597. doi:10.1038/ncomms8597
Wang, C.-y., Wang, C.-H., and Manga, M. (2004). Coseismic release of water from mountains: evidence from the 1999 (Mw = 7.5) chi-chi, taiwan, earthquake. Geology 32, 769–772. doi:10.1130/g20753.1
Xue, L., Li, H.-B., Brodsky, E. E., Xu, Z.-Q., Kano, Y., Wang, H., et al. (2013). Continuous permeability measurements record healing inside the Wenchuan earthquake fault zone. Science 340, 1555–1559. doi:10.1126/science.1237237
Keywords: poroelasticity, earthquakes, fluid pressure, permeability and porosity, numerical modelling
Citation: Marguin V and Simpson G (2024) Poroelastic effects associated with earthquakes on overpressured reverse and normal faults. Front. Earth Sci. 12:1423174. doi: 10.3389/feart.2024.1423174
Received: 25 April 2024; Accepted: 21 August 2024;
Published: 20 September 2024.
Edited by:
Paolo Capuano, University of Salerno, ItalyReviewed by:
Andrea Billi, National Research Council (CNR), ItalyCarlos Peña, GFZ German Research Centre for Geosciences, Germany
Copyright © 2024 Marguin and Simpson. This is an open-access article distributed under the terms of the Creative Commons Attribution License (CC BY). The use, distribution or reproduction in other forums is permitted, provided the original author(s) and the copyright owner(s) are credited and that the original publication in this journal is cited, in accordance with accepted academic practice. No use, distribution or reproduction is permitted which does not comply with these terms.
*Correspondence: Valentin Marguin, dmFsZW50aW4ubWFyZ3VpbkBpY2xvdWQuY29t
 Valentin Marguin
 Guy Simpson