 Pengyan Du
 Jingong Cai2*
94% of researchers rate our articles as excellent or good
Learn more about the work of our research integrity team to safeguard the quality of each article we publish.
Find out more
ORIGINAL RESEARCH article
Front. Earth Sci., 31 July 2024
Sec. Geochemistry
Volume 12 - 2024 | https://doi.org/10.3389/feart.2024.1421404
Whether mudstone is rich in or free of organic matter has a great influence on the occurrence of water. Comparing different types of water in organic-rich and organic-free mudstones is helpful for further understanding the role of water in hydrocarbon generation. Thermogravimetric analysis (TGA) and differential thermal analysis (DTA) combined with mass spectrometry (MS) afford the opportunity to identify the mass change, reactions and products of the sample in a real-time monitored heating process. This study compared the pyrolysis characteristics of an organic-rich mudstone (CN1) and an organic-free mudstone (CW1) by using the TGA/DTA-MS method to estimate the content of different types of H2O and CO2 in organic-rich mudstones. The results show that the mass changes in CN1 and CW1 can be divided into the three thermogravimetric (TG) stages of 0°C–200°C, 200°C–650°C, and 650°C–900°C, while the peak temperatures of H2O and CO2 obtained through MS are different for CN1 and CW1. The differences in mineral components and organic matter between CN1 and CW1 suggest that the MS peaks of H2O and CO2 in CW1 are mainly influenced by clay and carbonate minerals, and that those of CN1 are also influenced by organic matter. In addition, quantification equations for CO2 and H2O contents from both the organic and inorganic origin of the organic-rich mudstone can be established by using the MS peak area of CO2 and H2O, mass loss in TGA and the mineral composition of the organic-free mudstone. This work provides useful insights for further understanding the hydrocarbon generation mechanism, as well as quantifying different types of water in organic-rich mudstones.
In recent years, organic-inorganic interactions during hydrocarbon generation and preservation in source rocks has increasingly received attention (Ballice, 2005; Sert et al., 2009; Al-Harahsheh et al., 2011; Yan et al., 2013; Pan et al., 2016; Zhu et al., 2021; Gao et al., 2023), especially the role of water in petroleum formation, which researchers have proven to be very important (Jurg and Eisma, 1964; Hoering, 1984; Hunt et al., 1991; Lewan, 1997; Lewan and Roy, 2011; Kuila et al., 2014). The water in mudstones is present in different forms, such as adsorption water, interlayer water, crystal water and structural water (Földvári, 1991). Mudstone can be rich in organic matter or free of organic matter, which has a great influence on the occurrence of water, such as interlayer water acting as “water bridges” that bind montmorillonite and organic matter together in organo-clay complexes (Mortland, 1970; Yariv and Cross, 2001; Yariv, 2004; Cai et al., 2012). Thus, quantifying the content of different types of water and understanding the relationship between water and organic matter during the pyrolysis process of organic-rich mudstones and organic-free mudstones are helpful for further understanding the influence of water on hydrocarbon generation.
At present, the common methods of water quantification in rocks are Dean Stark, Retort, Thermogravimetric analysis (TGA), Karl Fischer Titration (KF), and Nuclear magnetic resonance (NMR) (Coburn et al., 1989; Larsen et al., 2005; Sondergeld et al., 2010; Handwerger, Keller, and Vaughn, 2011; Li et al., 2018). However, all these methods have limitations in quantifying water in organic-rich mudstones. The Dean Stark method can only quantify the free water and adsorption water of rocks, but cannot separate the two types of water. The Retort method can quantify the total water of the rock, but it cannot quantify the different types of water respectively. The TGA quantifies the water by measuring the weight loss of samples during pyrolysis, so it is only suitable for some pure minerals. The KF method is not suitable for rocks containing carbonate minerals because the carbonate will react with the Karl Fischer reagent, which will affect the quantitative results of water. The NMR method uses the nuclear magnetic signal of the water on the T1-T2 diagram to quantify the water content, however, it is also unable to quantify the different types of occurrences of water.
To sum up, quantifying the different types of water in organic-rich mudstones is still difficult. As samples in thermogravimetric analysis (TGA) undergo continuous mass changes and those in differential thermal analysis (DTA) undergo exothermic or endothermic changes in a specific atmosphere (Coats and Redfern, 1963; Yariv and Cross, 2001), mass spectrometry (MS) can identify compounds generated from the pyrolysis of samples (Steck et al., 1970; Maher et al., 2015), TGA and DTA combined with MS (TGA/DTA-MS) can identify the mass change, reactions and products of samples in a real-time monitored heating process. These thermal analysis methods have been widely used in research on minerals, organic matter and various rocks (Marshall et al., 2002; Kaljuvee et al., 2011; Tiwari and Deo, 2012a; 2012b; Pan et al., 2015; Labus and Lempart, 2018; Labus and Matyasik, 2019; Klaja et al., 2020). In addition, previous TGA/DTA-MS studies on the water quantification or identification mostly focused on the minerals or organic-free mudstones, and the pyrolysis mostly focused on the influence of minerals or heating rate on the pyrolysis of source rocks (Földvári, 1991; Xie et al., 2001; Sert et al., 2009; Handwerger et al., 2011; Liu et al., 2013; Liu et al., 2014; Kuligiewicz and Derkowski, 2017; Klaja et al., 2020; da Silva Favero et al., 2019). However, water quantification in organic-rich mudstones is still difficult, and the interactions between water and organic matter in organic-rich mudstones during such pyrolysis processes have undergone little discussion.
This study collected an organic-rich mudstone and an organic-free mudstone from Dongying Sag in Bohai Bay Basin, China, and used the TGA/DTA-MS test to compare the differences between organic-rich and organic-free mudstones during pyrolysis, especially the difference of water. Then we explored a useful method to quantify the different types of occurrences of water, and analyzed the interaction between water and organic matter in the organic-rich mudstone. This work can provide a scientific basis for the further study of the hydrocarbon generation mechanism and the petroleum resource evaluation.
The samples studied in this work are from the Dongying Sag of the Jiyang Depression in Bohai Bay Basin (Figure 1). Dongying Sag is an important petroleum sag with the exploration area of approximately 5,850 km2 (Zhang et al., 2009; Du et al., 2019). The sag is formed during the Cenozoic faulting, and is connected to the Qingtuozi Uplift in the east, the Luxi Uplift in the south, Chenjiazhuang Uplift in the north, and the Qingcheng-Fanlinjia-Binxian Uplift in the west (Figure 1B). The Cenozoic stratigraphy of the Dongying Sag comprises Paleogene, Neogene, and Quaternary strata. The Paleogene is dominated by lacustrine deposits, and is the main source rock formation that develops the Kongdian, Shahejie, and Dongying layers from bottom upward (Feng et al., 2013; Li et al., 2016; Bai et al., 2018; Zeng et al., 2018).
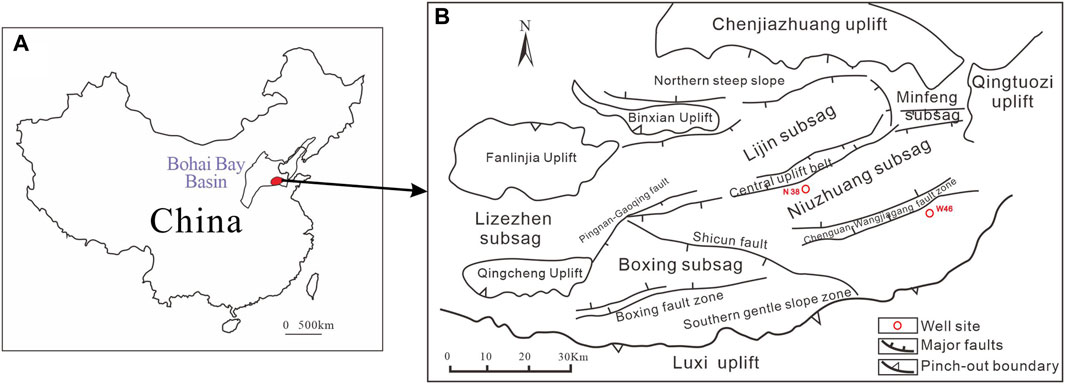
Figure 1. (A) Study area location in the Jiyang Depression, Bohai Bay Basin, China. The red dot denotes the study area, the Dongying Sag (B) Tectonic setting of the Dongying Sag, modified after Zhang et al.
In this research, two mudstone samples were obtained from distinct wells with two comparative lithologies. A black mudstone, labeled CN1, was collected from well N38 at a depth of 3,324.64 m in the Shahejie Formation, representing an organic-rich mudstone. Conversely, a red mudstone, labeled CW1, was collected from well W46 at a depth of 3,788.59 m within the Kongdian Formatio, representing an organic-free mudstone. The categorization of ‘organic-free’ and ‘organic-rich’ is mainly identified by total organic carbon (TOC) content (Ju et al., 2014). In our study, the organic-free samples are generally characterized by TOC levels below 0.1%, and the TOC of organic-rich samples are predominantly exceeding 1%.
Samples were initially crushed using an agate mortar and screened through a 100 mesh (<0.15 mm) sieve. To meticulously control sample moisture content and to eliminate potential variations from ambient humidity, a crucial step entailed subjecting the crushed samples to a 24-h drying cycle at 105°C within an electric thermostatic oven. This specific temperature was deliberately chosen to effectively remove adsorption water, which includes both pore water and water physically bounded to mineral surfaces, without causing significant alteration to the structure or composition of the samples, especially in light of the presence of swelling clay minerals like smectite. It is noteworthy that 105°C is a commonly adopted temperature in similar studies; alternative temperatures ranging from 100°C to 120°C have also been employed by various researchers (ASTM D1974, 2007; Földvári, 1991; Nutting, 1943; Pan et al., 2015; Pérez-Rodríguez et al., 2006; Tiwari and Deo, 2012a; Tiwari and Deo, 2012b), affirming the appropriateness of our chosen parameter. Following this thorough drying procedure, the samples were stored in a desiccator to preserve their dry condition until further analysis.
In addition, the <2 μm clay fraction was prepared. First, the crushed sample were placed in an ultrasonic tank and vibrated at a frequency of 40 Hz for 3 h to make a dispersed suspension. Then, the clay component with a particle size of less than 2 μm was extracted from the suspension according to Stokes’ law. Finally, the clay component was centrifuged at 7,200 rpm, then dried at 60°C and stored in a desiccator.”
The Rock-Eval VI pyrolysis apparatus (RE6, Vinci Technologies, Nanterre, France) was used to obtain the basic organic parameters of the two samples. The testing includes following processes: First, preheated the instrument to a constant temperature of 300°C, then put 100 mg of the sample into the pyrolysis device, keep it at 300°C for 2.5 min in a helium atmosphere to obtain free hydrocarbons (S1). Then, samples were heated from 300°C to 650°C with a heating rate of 25°C/min, obtaining parameters of pyrolysis hydrocarbons (S2), CO2 content (S3), and the temperature of maximum hydrocarbon generation (Tmax). The total organic carbon (TOC) value was calculated based on S1, S2, and S3.
The elemental analysis of the carbon, hydrogen and nitrogen (CHN) of samples were performed using the elemental analyzer Vario EL III of Elementar. 20 mg of each sample was placed into the analyzer, which functions at an operational temperature of 850°C, employing a Thermal Conductivity Detector (TCD) for the analysis. This experiment could yield the content of elements C, H, and N, with an analytical precision of 0.3%.
The mineral composition was determined by X-ray diffraction (XRD) analysis using a Rigaku D/max-III X-ray diffractometer (PANalytical, Amelo, Netherlands). The XRD experiment was conducted in condition of 20 mA and 40 kV with the CuKα radiation setting at 1.5 Å, the scattering slit at 1°, and the receiving slit at 0.3 mm. Whole rock mineralogy was determined on random slides of the whole rock sample, and clay mineralogy was determined on oriented slides (air dried, ethylene glycol saturated, and heating to 550°C) of the clay fraction (Li et al., 2016; Moore and Reynolds, 1997).
The TGA/DTA-MS experiment was performed using a thermogravimetric instrument (Netzsch STA 449 F3 Jupiter) coupled with a mass spectrometer (Netzsch QMS 403 D Aeolos). Put 20 mg of the sample into the thermogravimetric instrument. Then samples were heated from room temperature to 900°C in an argon atmosphere with a heating rate of 10°C/min. The outlet of the thermogravimetric instrument was connected to the mass spectrometer through a capillary column, which was heated to 210°C to prevent gas condensation. Gases formed in the thermogravimetric instrument were simultaneously purged in the mass spectrometer by argon flow (20 mL min-1) through the hot capillary column.
The dominant mineral phases of CN1 and CW1 identified are quartz, calcite, feldspar, and clay minerals (Table 1). Both samples have relatively high clay mineral content, and CN1 contains 36% calcite. The illite-smectite mixed layer (I-Sm) and illite content account for the largest proportion of the clay fraction of CN1 and CW1 (Table 1).
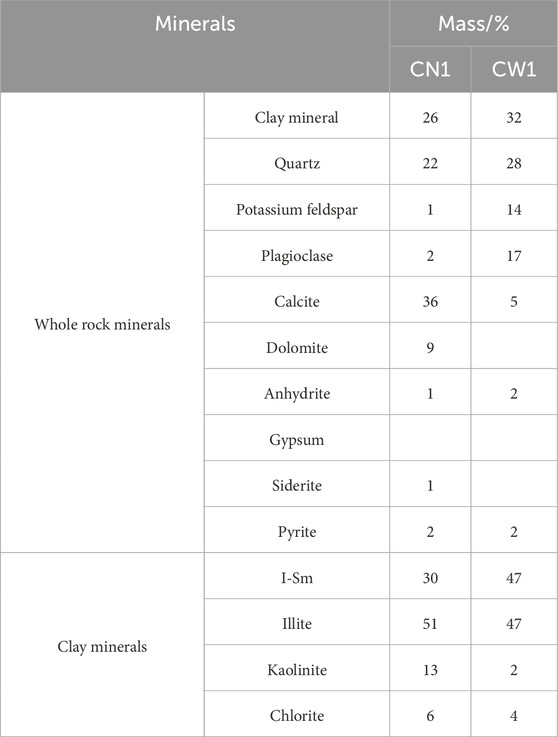
Table 1. Mineral compositions of samples CN1 and CW1.
The Rock-Eval VI pyrolysis results show that the TOC content of CN1 and CW1 are 2.21% and 0.07%, revealing that CN1 is rich in organic matter and CW1 contains almost no organic matter (Table 2). The other pyrolysis parameters (e.g., S1, S2, and Tmax) all reflect that CW1 contains almost no organic matter. The elemental analysis shows the carbon content of CN1 is far larger than CW1, and the hydrogen content of the two samples is similar.
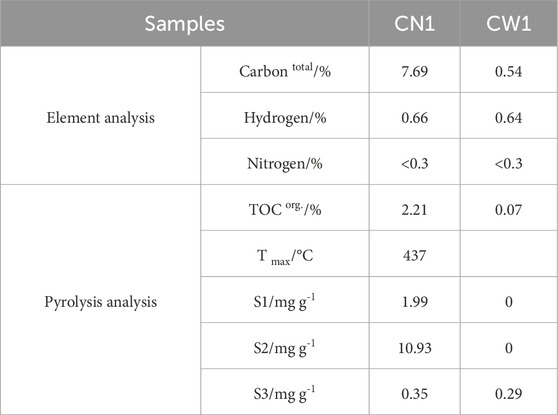
Table 2. Elemental analysis and pyrolysis analysis of samples CN1 and CW1.
According to TGA, three main stages of mass loss occur during pyrolysis of CN1 (Figure 2A). In the first stage (temperature range: 35°C–200°C), the sample mass lost only 0.08%, and there was a weak endothermic peak with a peak temperature of 112°C. In the second stage (temperature range: 200°C–650°C), the sample mass loss is 5.81%, and there were two endothermic peaks with peak temperatures of 460°C and 520°C. In the third stage (temperature range: 650°C–900°C), the sample mass lost 17.78%, and there was one large endothermic peak with a peak temperature of 824°C. After 830°C, the sample mass did not change. In conclusion, the order of the amount of mass loss is stage 3 > stage 2 > stage 1, one endothermic peak occurred in stage 1, one occurred in stage 3, but two occurred in stage 2.
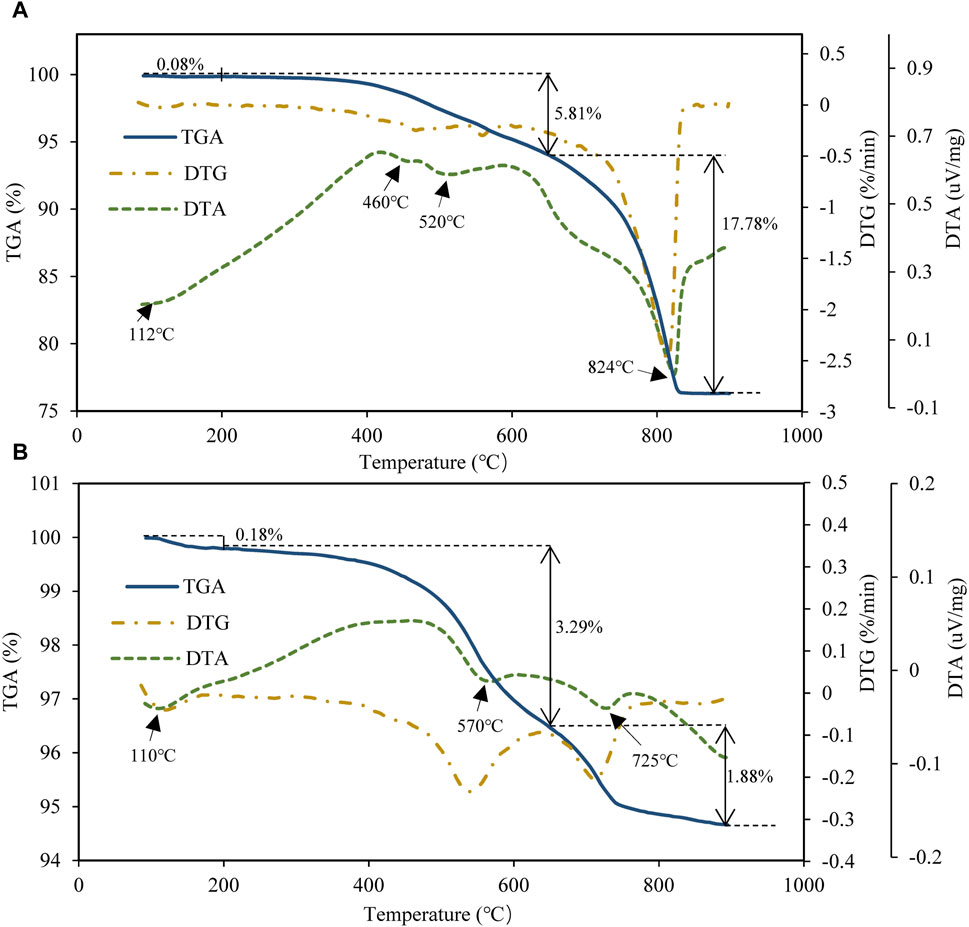
Figure 2. TG, DTG and DTA curves of the pyrolysis process of mudstones: (A) sample CN1, (B) sample CW1.
Sample CW1 also has three mass loss stages, and the temperature ranges of the three stages are similar to those of CN1 (Figure 2B). In the first stage (temperature range: 35°C–200°C), the sample mass lost only 0.18%, and there was an endothermic peak with a peak temperature of 110°C; in the second stage (temperature range: 200°C–650°C); the sample mass lost 3.29%, and there was one endothermic peak with a peak temperature of 570°C; in the third stage (temperature range: 650°C–900°C), the sample mass lost 1.88%, and there was one endothermic peak with a peak temperature of 725°C. The mass loss in stage 2 was the largest among the three stages, and there was one endothermic peak in each of the three stages.
The MS results show that CN1 has abundant organic gas signals but CW1 has few organic gas signals (Figure 3), which is associated with the sample feature that CN1 is rich in organic matter and CW1 has little organic matter. The organic products of CN1 mostly appear in the temperature range of 200°C–500°C, and their MS peak temperatures are approximately 350°C (Figure 3A).
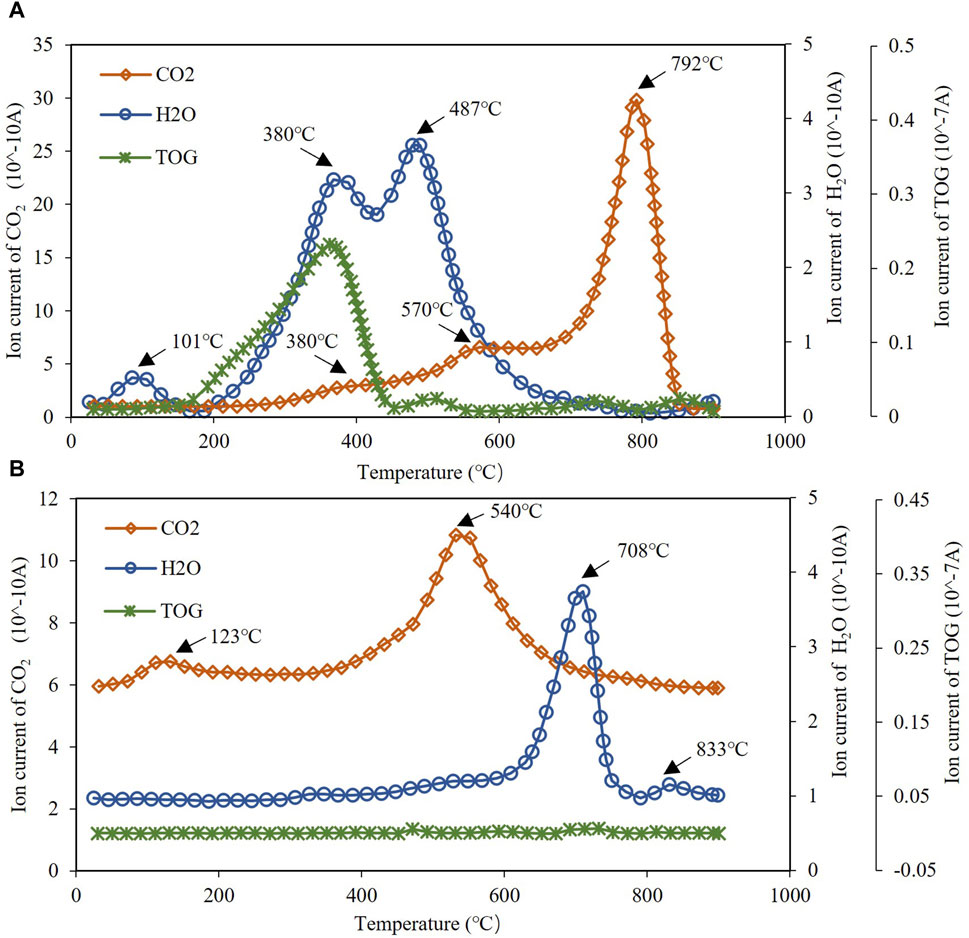
Figure 3. Mass spectrometry signals of organic gas, H2O and CO2 generated from the pyrolysis process of (A) sample CN1 and (B) sample CW1 (TOG: total organic gas).
For inorganic compositions generated during the pyrolysis process, only H2O and CO2 have strong MS signals (Figure 3). CN1 has three MS peaks of H2O and three MS peaks of CO2: H2O peaks occur at 101°C, 380°C, and 487°C, and CO2 peaks occur at 380°C, 574°C, and 792°C respectively (Figure 3A). Besides, CW1 has two MS peaks of H2O and two MS peaks of CO2: H2O peaks occur at 123°C and 540°C, and CO2 peaks occur at 708°C and 833°C (Figure 3B).
According to the TGA and DTA results, both CN1 and CW1 have three thermogravimetric (TG) stages. As previous studies also showed the three significant mass loss stages of mudstones in different areas (Williams and Ahmad, 2000; Labus and Matyasik, 2019; Klaja et al., 2020), it seems that the characteristic of 3 TG stages would be a general feature of mudstones. Additionally, there were also three obvious differences between CN1 and CW1. The mass loss amount was significantly different between the two samples. The total mass loss was approximately 24% in CN1 but was only approximately 5% in CW1. The largest mass loss was in stage 3 in CN1 but in stage 2 in CW1. The numbers of endothermic peaks were also different: CN1 had four peaks, but CW1 had three peaks. The temperatures of the endothermic peaks in the three mass loss stages were all different between CN1 and CW1. All these thermal differences may have been caused by the content and type of mineral components of the two samples.
There are different types of water in mudstones, and they have different locations, bonding types, removal temperatures, quantities, etc (Pérez-Rodríguez et al., 2006). According to the mineral types in the two samples, the water can be divided into four types in this paper: adsorption water, interlayer water, crystal water and structural water (Table 3). The adsorption water is mainly located in rock pores and external surfaces in the form of H2O and the dehydration temperature is in the range of 40°C–100°C. Most interlayer water is in the form of H2O and little is in the form of OH, which would be free water in the interlayer or be adsorbed in the interlayer surface by van der Waals forces or H-bonding. The dehydration temperature range of interlayer water is wide, as montmorillonites largely release interlayer water at 122°C, the I-Sm releases interlayer water at 119°C. There are two kinds of crystal water. One type is named normal crystal water in form of H2O, and the dehydration temperature is within the range of 200°C–500°C, and gypsum dehydrates the last 1/2 H2O (crystal water) at 250°C (Taylor, 1997); the other type is defective crystal water, which is in form of H2O or OH and has a large dehydration temperature, and it usually appears in the normally anhydrous minerals (NAMs) crystal lattice; for example, feldspars have three kinds of defective crystal water that type I-H2O crystal water could release before 600°C, but the crystal water types I-OH and II-OH need higher temperatures (Johnson and Rossman, 2004). Structural water is in the form of OH in the mineral structure, and only when the molecular structure is destroyed can the water be released. The dehydroxylation temperature is very high compared to that in the other three types of water; for example, the structural water of kaolinite is generally removed in the temperature range of 500°C–600°C (Bellotto et al., 1995), and the dehydroxylation temperature of montmorillonite is in the range of 500°C–1,000°C (Grenne-Kelly, 1957; Xie et al., 2001).
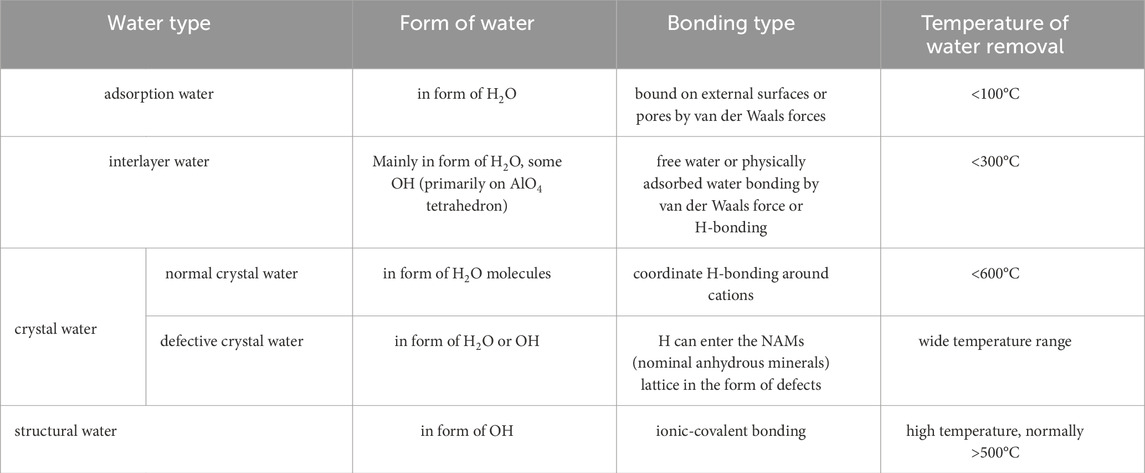
Table 3. Types of water in mudstones (partially modified from Földvári).
For sample CN1, the MS peak of H2O at 101°C is very small, which indicates free water or little interlayer water (Figure 3A). Although sample CN1 contains 26% clay minerals, little interlayer water is released in the first H2O peak range. This suggests that the interlayer water may be released in the other two water peak regions in the temperature range of 200°C–650°C. The second MS peak of H2O at 380°C is consistent with the MS peak of organic products with a peak temperature of approximately 350°C. Previous studies have shown that interlayer water acts as a “water bridge” binding montmorillonite and organic matter together in organo-clay complexes (Mortland, 1970; Yariv and Cross, 2001; Yariv, 2004), and only after interlayer organic matter is expelled can the interlayer water be desorbed (Cai et al., 2012). For the mudstone with large organic matter and clay minerals, some soluble organic matter would stay in the interlayer of silicate minerals (Cai et al., 2007; Pillot et al., 2014; Sarkar et al., 2018). Thus, the water peak of CN1 at 380°C could be contributed by interlayer water. The third MS peak of H2O at 487°C can be attributed to crystal-structural water because the peak temperature is high.
In addition, as sample CW1 is almost pure inorganic rock and there are large clay minerals, especially many montmorillonites, and the sample preprocessing has removed the adsorption water, the first MS peak of H2O in CW1 at 123°C should represent interlayer water, and the second MS peak of H2O at 540°C may contain both crystal water and structural water. This H2O peak is defined as crystal-structural water (Figure 3B).
As different carbonate minerals need different pyrolysis temperatures to produce CO2 (Pillot et al., 2014), the three MS peaks of CO2 in CN1 are the mixed peak of CO2 produced by both organic matter and carbonate minerals (Figure 3A). Because different carbonate minerals need different pyrolysis temperatures (Pillot et al., 2014), and CN1 has abundant carbonate minerals such as 2% siderite, 9% dolomite and 36% calcite, the CO2 peak at 380°C could be produced by the siderite and organic matter adsorbed in the clay minerals; the CO2 peak at 574°C could be contributed by the dolomite and the organic matter released from the adsorption by “water bridge” (Cai et al., 2012); the CO2 peak at 792°C could be generated from the calcite, as well as some residual organic carbon, which could react with the oxygen in the crystal structure of the montmorillonite that may produce CO2 in such high temperature (Xie et al., 2001). In addition, the calcite content is much larger than that of the other two carbonate minerals, that would make the CO2 peak at 792°C be significantly higher than the other two CO2 peaks. While the two CO2 peaks of CW1 might initially suggest the involvement of both dolomite and calcite. The former one has a large area, and the temperature range is 500°C–800°C; the latter is much smaller and has a temperature range of 800°C–900°C (Figure 3B). Nonetheless, given that XRD analysis reveals an absence of dolomite and siderite in CW1, it becomes evident that both CO2 peaks are attributed solely to the calcite present.
Comparing the TGA, DTA and MS results of CW1 and CN1, the two samples both produce H2O in the first and second TG stages, but CN1 also generates organic gas in the second TG stage; the CO2 in CW1 and CN1 are mainly released in the third TG stage (Figure 4). The dehydration of adsorption water, interlayer water and crystal-structural water and the generation of CO2 from the pyrolysis of carbonate minerals correspond exactly to the DTA peaks (Figure 4).
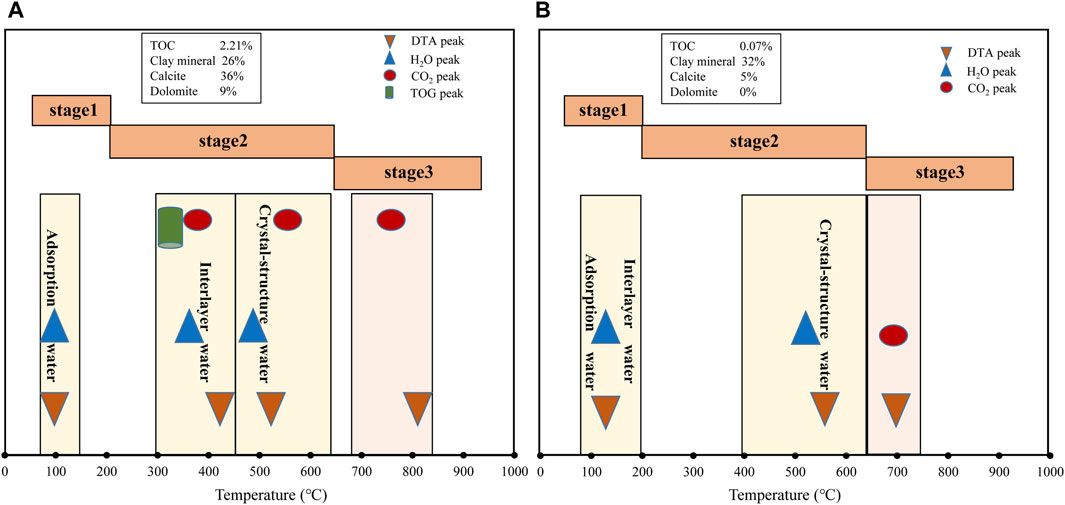
Figure 4. Comprehensive comparison of TGA, DTA and MS characteristics of (A) sample CN1 and (B) sample CW1.
The total area of the H2O peak is 834 for CW1 and is 873 for CN1, revealing that the H2O contents generated during pyrolysis of both samples are similar (Figure 5). However, in the first TG stage, the H2O peak area is 82 for CW1, which is much larger than the H2O peak area of 36 for CN1. This difference may be the reason that CW1 dehydrated adsorption water and interlayer water, while CN1 released adsorption water only in the first TG stage. In the second TG stage, the H2O peak area is 837 for CN1, which is greater than the H2O peak area of 752 for CW1. Because the contents of clay minerals and feldspars are 26% and 3% for CN1 and 32% and 31% for CW1 (Table 1), the total H2O peak area for CW1 should be greater than that for CN1; however, it is opposite in reality. These results also reveal that much interlayer water in CN1 dehydrated in stage 2 but not in stage 1.
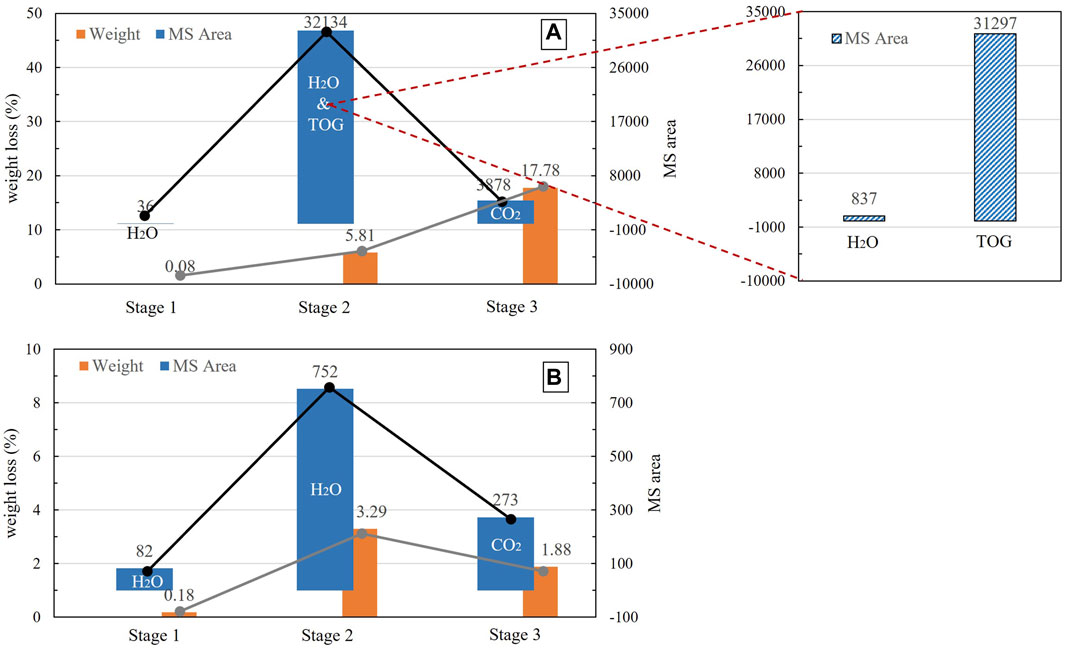
Figure 5. Correlation between mass loss and MS peak area in (A) sample CN1 and (B) sample CW1 (Weight represents the mass loss of CN1 and CW1 in the 3 TG stages; MS Area represents the integral area of MS peaks for H2O, CO2 or TOG).
As sample CW1 is similar to a pure inorganic rock, it is reasonable to use the MS peak area of CO2 and the carbonate mineral content and mass loss of CW1 and CN1 to quantify the CO2 in CN1 from a mineral origin, as shown in Eq. (1):
where
According to the three chemical formulas (cf 1, cf 2, cf 3),
The CO2 content in CN1 from organic and inorganic origin can be quantified by combining the peak area of CO2 from a mineral origin with the TGA data, as shown by (Eqs 3, 4):
where the parameter
The mass loss and peak area of H2O in CW1 can be used to quantify the H2O mass of CN1 according to Eq. (5):
where
According to the calculation results (Table 4), the CO2 peak area in CN1 contributed by carbonate minerals is approximately 2,569, and the mass content is approximately 11.78%; the total CO2 peak area in CN1 is approximately 3,878, the area with an organic origin is approximately 1,309, and the corresponding mass content is approximately 6%. The H2O mass generated from CN1 is approximately 3.63%, the adsorption water is approximately 0.08%, and the interlayer water and crystal-structural water of CN1 are approximately 2.55% in total.
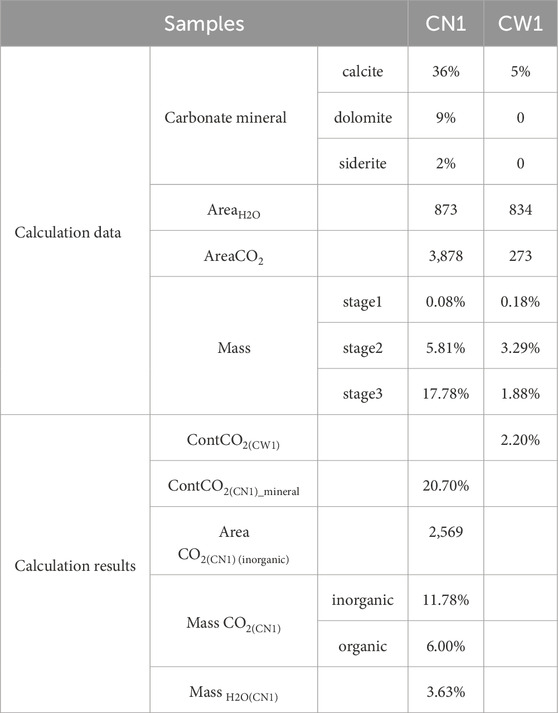
Table 4. Calculation of the mass of CO2 and H2O in sample CN1 from organic and inorganic origins.
In this paper, we used simultaneous thermal analysis coupled with mass spectrometry (TGA/DTA-MS) to investigate the pyrolysis differences of organic-rich (CN1) and organic-free (CW1) mudstones. By comparing the mineral composition difference and the pyrolysis products H2O and CO2 between CN1 and CW1, we identified the different types of water in the organic-rich mudstone, learned the relationship between water and organic matter in the mudstone, and then established the quantitative equation of the H2O, CO2 content for the organic-rich mudstone. The conclusions can be achieved as follows.
(1) The thermogravimetric changes in CN1 and CW1 all can be divided into 3 TG stages of 0°C–200°C, 200°C–650°C, and 650°C–900°C. The 3 TG stages would also be a general characteristic of mudstones.
(2) The H2O and CO2 of CN1 and CW1 are different in each of the three TGA stages and have different MS peak temperatures. The water in CN1 and CW1 is divided into three types: adsorption water, interlayer water, crystal-structure water. The interlayer water of CN1 owns higher MS peak temperature than that of CW1, and the CO2 of CN1 in the third TG stage has higher MS temperature than CW1, that is attributed to the influence of organic matter.
(3) The peak area of MS for CO2 and H2O, the mass loss recorded by TGA, and the mineral composition of CN1 and CW1 collectively facilitate the establishment of a quantification equation for determining the CO2 and H2O contents in CN1. This equation is designed to quantify H2O and CO2 of both organic and inorganic origin in organic-rich mudstones.
(4) This work provides useful insights on further understanding the hydrocarbon generation mechanism, as well as quantifying different types of water in organic-rich mudstones. As the water can promote organic matter to generate more hydrocarbons in source rocks, the quantification method of different types of water can be significant on improving petroleum resource evaluation.
The original contributions presented in the study are included in the article/Supplementary Material, further inquiries can be directed to the corresponding authors.
PD: Conceptualization, Data curation, Investigation, Methodology, Software, Visualization, Writing–original draft, Writing–review and editing, Funding acquisition, Project administration, Formal Analysis, Resources, Supervision, Validation. JC: Funding acquisition, Methodology, Project administration, Resources, Supervision, Writing–review and editing. HL: Resources, Software, Visualization, Writing–review and editing. XZ: Resources, Writing–review and editing. JW: Data curation, Writing–review and editing. LY: Resources, Writing–review and editing. YZ: Resources, Writing–review and editing.
The author(s) declare that financial support was received for the research, authorship, and/or publication of this article. This work was supported by the National Natural Science Foundation of China [grant numbers 41672115, 41972126]; the National Petroleum Major Project of China [grant number 2016ZX05006001-003]; the Natural Science Basic Research Plan in Shaanxi Province of China [2023-JC-QN-0346]; the Doctoral Research Startup Project of Yan’an University [YAU202303873].
Authors XZ and JW were employed by Exploration and Development Research Institute of Shengli Oilfield Company.
The remaining authors declare that the research was conducted in the absence of any commercial or financial relationships that could be construed as a potential conflict of interest.
All claims expressed in this article are solely those of the authors and do not necessarily represent those of their affiliated organizations, or those of the publisher, the editors and the reviewers. Any product that may be evaluated in this article, or claim that may be made by its manufacturer, is not guaranteed or endorsed by the publisher.
Al-Harahsheh, M., Al-Ayed, O., Robinson, J., Kingman, S., Al-Harahsheh, A., Tarawneh, K., et al. (2011). Effect of demineralization and heating rate on the pyrolysis kinetics of Jordanian oil shales. Fuel Process. Technol. 92 (9), 1805–1811. doi:10.1016/j.fuproc.2011.04.037
ASTM (2007). Standard test methods for moisture, ash, and organic matter of peat and other organic soils, D2974-07a. West Conshohocken, PA: ASTM International.
Bai, C., Yu, B., Liu, H., Xie, Z., Han, S., Zhang, L., et al. (2018). The genesis and evolution of carbonate minerals in shale oil formations from Dongying depression, Bohai Bay Basin, China. Int. J. Coal Geol. 189, 8–26. doi:10.1016/j.coal.2018.02.008
Ballice, L. (2005). Effect of demineralization on yield and composition of the volatile products evolved from temperature-programmed pyrolysis of Beypazari (Turkey) oil shale. Fuel Process. Technol. 86, 673–690. doi:10.1016/j.fuproc.2004.07.003
Bellotto, M., Gualtieri, A., Artioli, G., and Clark, S. (1995). Kinetic study of the kaolinite-mullite reaction sequence. Part I: kaolinite dehydroxylation. Phys. Chem. Minerals 22 (4), 207–217. doi:10.1007/BF00202253
Cai, J., Bao, Y., Yang, S., Wang, X., Fan, D., Xu, J., et al. (2007). Research on preservation and enrichment mechanisms of organic matter in muddy sediment and mudstone. Sci. China Ser. D-Earth Sci. 50 (5), 765–775. doi:10.1007/s11430-007-0005-0
Cai, J., Lu, L., Bao, Y., Fan, F., and Xu, J. (2012). The significance and variation characteristics of interlay water in smectite of hydrocarbon source rocks. Sci. China-Earth Sci. 55 (3), 397–404. doi:10.1007/s11430-011-4316-9
Coats, A. W., and Redfern, J. P. (1963). Thermogravimetric analysis. A review. Analyst 88 (1053), 906–924. doi:10.1039/AN9638800906
Coburn, T. T., Oh, M. S., Crawford, R. W., and Foster, K. G. (1989). Water generation during pyrolysis of oil shales. 1. Sources. Energy and Fuels 3 (2), 216–223. doi:10.1021/ef00014a016
da Silva Favero, J., dos Santos, V., Weiss-Angeli, V., Gomes, L. B., Veras, D. G., Dani, N., et al. (2019). Evaluation and characterization of Melo Bentonite clay for cosmetic applications. Appl. Clay Sci. 175, 40–46. doi:10.1016/j.clay.2019.04.004
Du, P., Cai, J., Liu, Q., and Wang, J. (2019). The role transformation of soluble organic matter in the process of hydrocarbon generation in mud source rock. Petroleum Sci. Technol. 37 (15), 1800–1807. doi:10.1080/10916466.2019.1602637
Feng, Y., Li, S., and Lu, Y. (2013). Sequence stratigraphy and architectural variability in late Eocene lacustrine strata of the Dongying depression, Bohai Bay Basin, eastern China. Sediment. Geol. 295, 1–26. doi:10.1016/j.sedgeo.2013.07.004
Földvári, M., Smykatz-Kloss, , and Slade St. J., W. (1991) “Measurement of different water species in minerals by means of thermal derivatography,” in Thermal analysis in the geosciences. (Berlin, Heidelberg: Springer Berlin Heidelberg).
Gao, J., Li, X., Cheng, G., Luo, H., and Zhu, H. (2023). Structural evolution and characterization of organic-rich shale from macroscopic to microscopic resolution: the significance of tectonic activity. Adv. Geo-Energy Res. 10 (2), 84–90. doi:10.46690/ager.2023.11.03
Grenne-Kelly, R. (1957). The montmorillonite minerals,” in The Differential Thermal Investigation of Clays. Editors R. C. Mackenzie, and V. Chap(London: Mineralogical Society), 140–164.
Handwerger, D. A., Suarez-Rivera, R., Vaughn, K. I., and Keller, J. F. (2011) “Improved petrophysical core measurements on tight shale reservoirs using Retort and crushed samples,” in SPE annual technical conference and exhibition. (Denver, CO: Society of Petroleum Engineers), Vol. 21.
Hoering, T. C. (1984). Thermal reactions of kerogen with added water, heavy water and pure organic substances. Org. Geochem. 5 (4), 267–278. doi:10.1016/0146-6380(84)90014-7
Hunt, J. M., Lewan, M. D., Hennet, R. J. C., et al. (1991). Modeling oil generation with time-temperature index graphs based on the Arrhenius equation. Aapg Bulletin-American Assoc. Petroleum Geol. 75 (4), 795–807. doi:10.1306/0c9b2853-1710-11d7-8645000102c1865d
Johnson, E. A., and Rossman, G. R. (2004). A survey of hydrous species and concentrations in igneous feldspars. Am. Mineralogist 89 (4), 586–600. doi:10.2138/am-2004-0413
Ju, Y., Wang, G., Bu, H., Li, Q., and Yan, Z. (2014). China organic-rich shale geologic features and special shale gas production issues. J. Rock Mech. Geotechnical Eng. 6 (3), 196–207. doi:10.1016/j.jrmge.2014.03.002
Jurg, J. W., and Eisma, E. (1964). Petroleum hydrocarbons: generation from fatty acid. Science 144 (3625), 1451–1452. doi:10.1126/science.144.3625.1451
Kaljuvee, T., Keelmann, M., Trikkel, A., and Kuusik, R. (2011). Thermooxidative decomposition of oil shales. J. Therm. Analysis Calorim. 105 (2), 395–403. doi:10.1007/s10973-010-1033-0
Klaja, J., Przelaskowska, A., Kulinowski, P., Bujok, P., and Klempa, M. (2020). Investigation of fine-grained siliciclastic rocks of different clay content using thermal methods. J. Petroleum Sci. Eng. 184, 106531. doi:10.1016/j.petrol.2019.106531
Kuila, U., McCarty, D. K., Derkowski, A., Fischer, T. B., Topór, T., and Prasad, M. (2014). Nano-scale texture and porosity of organic matter and clay minerals in organic-rich mudrocks. Fuel 135, 359–373. doi:10.1016/j.fuel.2014.06.036
Kuligiewicz, A., and Derkowski, A. (2017). Tightly bound water in smectites. Am. Mineralogist 102, 1073–1090. doi:10.2138/am-2017-5918
Labus, M., and Lempart, M. (2018). Studies of Polish Paleozoic shale rocks using FTIR and TG/DSC methods. J. Petroleum Sci. Eng. 161, 311–318. doi:10.1016/j.petrol.2017.11.057
Labus, M., and Matyasik, I. (2019). Application of different thermal analysis techniques for the evaluation of petroleum source rocks. J. Therm. Analysis Calorim. 136 (3), 1185–1194. doi:10.1007/s10973-018-7752-3
Larsen, J. W., Kidena, K., Ashida, R., and Parikh, H. (2005). Kerogen chemistry 3. Shale elemental analysis and clay dehydroxylation. Energy and Fuels 19 (4), 1699–1703. doi:10.1021/ef050004v
Lewan, M. D. (1997). Experiments on the role of water in petroleum formation. Geochimica Cosmochimica Acta 61 (17), 3691–3723. doi:10.1016/s0016-7037(97)00176-2
Lewan, M. D., and Roy, S. (2011). Role of water in hydrocarbon generation from Type-I kerogen in Mahogany oil shale of the Green River Formation. Org. Geochem. 42 (1), 31–41. doi:10.1016/j.orggeochem.2010.10.004
Li, J., Huang, W., Lu, S., Wang, M., Chen, G., Tian, W., et al. (2018). Nuclear magnetic resonance T1–T2 map division method for hydrogen-bearing components in continental shale. Energy and Fuels 32 (9), 9043–9054. doi:10.1021/acs.energyfuels.8b01541
Li, Y., Cai, J., Song, M., Ji, J., and Bao, Y. (2016). Influence of organic matter on smectite illitization: a comparison between red and dark mudstones from the Dongying depression, China. China 101 (1), 134–145. doi:10.2138/am-2016-5263
Liu, H., Yuan, P., Qin, Z., Liu, D., Tan, D., Zhu, J., et al. (2013). Thermal degradation of organic matter in the interlayer clay–organic complex: a TG-FTIR study on a montmorillonite/12-aminolauric acid system. Appl. Clay Sci. 80-81, 398–406. doi:10.1016/j.clay.2013.07.005
Liu, Q. Q., Han, X. X., Li, Q. Y., Huang, Y. R., and Jiang, X. M. (2014). TG–DSC analysis of pyrolysis process of two Chinese oil shales. J. Therm. Analysis Calorim. 116 (1), 511–517. doi:10.1007/s10973-013-3524-2
Moore, D. M, and Reynolds, R. C. (1997). X-ray diffraction and identification and analysis of clay mineralsn. 2nd Edn. New York: Oxford University Press.
Maher, S., Jjunju, F. P., and Taylor, S. (2015). Colloquium: 100 years of mass spectrometry: perspectives and future trends. Rev. Mod. Phys. 87 (1), 113–135. doi:10.1103/RevModPhys.87.113
Marshall, C. P., Kannangara, G., Wilson, M. A., Guerbois, J. P., Hartung-Kagi, B., and Hart, G. (2002). Potential of thermogravimetric analysis coupled with mass spectrometry for the evaluation of kerogen in source rocks. Chem. Geol. 184 (3), 185–194. doi:10.1016/S0009-2541(01)00362-X
Mortland, M. M. (1970). “Clay-organic complexes and interactions,” in Advances in agronomy. Editor N. C. Brady (Cambridge, MA: Academic Press), Vol. 22, 75–117.
Nutting, P. G. (1943). “Some standard thermal dehydration curves of minerals,” in U. S. Geological Survey, Profess paper 197E, 197–216
Pan, L., Dai, F., Huang, J., Liu, S., and Li, G. (2016). Study of the effect of mineral matters on the thermal decomposition of Jimsar oil shale using TG–MS. Thermochim. Acta 627-629, 31–38. doi:10.1016/j.tca.2016.01.013
Pan, L., Dai, F., Li, G., and Liu, S. (2015). A TGA/DTA-MS investigation to the influence of process conditions on the pyrolysis of Jimsar oil shale. Energy 86, 749–757. doi:10.1016/j.energy.2015.04.081
Pérez-Rodríguez, J. L., Pascual, J., Franco, F., Jiménez de Haro, M., Duran, A., Ramírez del Valle, V., et al. (2006). The influence of ultrasound on the thermal behaviour of clay minerals. J. Eur. Ceram. Soc. 26 (4), 747–753. doi:10.1016/j.jeurceramsoc.2005.07.015
Pillot, D., Deville, E., and Prinzhofer, A. (2014). Identification and quantification of carbonate species using Rock-Eval pyrolysis. Oil Gas Sci. Technology–Revue d’IFP Energies Nouvelles 69 (2), 341–349. doi:10.2516/ogst/2012036
Sarkar, B., Singh, M., Mandal, S., Churchman, G. J., and Bolan, N. S. (2018). “Chapter 3 - clay minerals—organic matter interactions in relation to carbon stabilization in soils,” in The future of soil carbon. Editors C. Garcia, P. Nannipieri, and T. Hernandez (Cambridge, MA: Academic Press), 71–86.
Sert, M., Ballice, L., Yüksel, M., and Sağlam, M. (2009). Effect of mineral matter on product yield and composition at isothermal pyrolysis of Turkish oil shales. Oil Shale 26, 463. doi:10.3176/oil.2009.4.03
Sondergeld, C. H., Newsham, K. E., Comisky, J. T., Rice, M. C., and Rai, C. S. (2010). Petrophysical considerations in evaluating and producing shale gas resources. Richardson, TX: SPE Unconventional Gas Conference, OnePetro.
Steck, S. J., Muenow, D. W., and Margrave, J. L. (1970). Mass spectrometric volatilization studies of oil shale. Chicago, IL: Division of fuel chemistry, American Chemical Society Chicago.
Tiwari, P., and Deo, M. (2012a). Compositional and kinetic analysis of oil shale pyrolysis using TGA–MS. Fuel 94, 333–341. doi:10.1016/j.fuel.2011.09.018
Tiwari, P., and Deo, M. (2012b). Detailed kinetic analysis of oil shale pyrolysis TGA data. AIChE J. 58 (2), 505–515. doi:10.1002/aic.12589
Williams, P. T., and Ahmad, N. (2000). Investigation of oil-shale pyrolysis processing conditions using thermogravimetric analysis. Appl. Energy 66 (2), 113–133. doi:10.1016/S0306-2619(99)00038-0
Xie, W., Gao, Z., Liu, K., Pan, W. P., Vaia, R., Hunter, D., et al. (2001). Thermal characterization of organically modified montmorillonite. Thermochim. Acta 367-368, 339–350. doi:10.1016/S0040-6031(00)00690-0
Yan, J., Jiang, X., Han, X., and Liu, J. (2013). A TG–FTIR investigation to the catalytic effect of mineral matrix in oil shale on the pyrolysis and combustion of kerogen. Fuel 104, 307–317. doi:10.1016/j.fuel.2012.10.024
Yariv, S. (2004). The role of charcoal on DTA curves of organo-clay complexes: an overview. Appl. Clay Sci. 24 (3), 225–236. doi:10.1016/j.clay.2003.04.002
Zeng, X., Cai, J., Dong, Z., Bian, L., and Li, Y. (2018). Relationship between mineral and organic matter in shales: the case of Shahejie Formation, Dongying Sag, China. Minerals 8 (6), 222. doi:10.3390/min8060222
Zhang, L., Liu, Q., Zhu, R., Li, Z., and Lu, X. (2009). Source rocks in mesozoic–Cenozoic continental rift basins, east China: a case from Dongying depression, Bohai Bay Basin. Org. Geochem. 40 (2), 229–242. doi:10.1016/j.orggeochem.2008.10.013
Zhu, H., Huang, C., Ju, Y., Bu, H., Li, X., Yang, M., et al. (2021). Multi-scale multidimensional characterization of clay-hosted pore networks of shale using FIBSEM, TEM, and X-raymicro-tomography: implications for methane storage and migration. Appl. Clay Sci. 213 (2021), 106239. doi:10.1016/j.clay.2021.106239
Keywords: organic-rich mudstone, organic-free mudstone, quantification, H2O, CO2
Citation: Du P, Cai J, Li H, Zhang X, Wang J, Yang L and Zhen Y (2024) Quantification of organic and inorganic hydrogen in mudstones: a novel approach using the difference between organic-rich and organic-free mudstones during pyrolysis process. Front. Earth Sci. 12:1421404. doi: 10.3389/feart.2024.1421404
Received: 22 April 2024; Accepted: 09 July 2024;
Published: 31 July 2024.
Edited by:
Calin Baciu, Babeș-Bolyai University, RomaniaReviewed by:
Hongjian Zhu, Yanshan University, ChinaCopyright © 2024 Du, Cai, Li, Zhang, Wang, Yang and Zhen. This is an open-access article distributed under the terms of the Creative Commons Attribution License (CC BY). The use, distribution or reproduction in other forums is permitted, provided the original author(s) and the copyright owner(s) are credited and that the original publication in this journal is cited, in accordance with accepted academic practice. No use, distribution or reproduction is permitted which does not comply with these terms.
*Correspondence: Pengyan Du, cGVuZ3lhbmR1ZHVAZ21haWwuY29t; Jingong Cai, amdjYWlAdG9uZ2ppLmVkdS5jbg==
Disclaimer: All claims expressed in this article are solely those of the authors and do not necessarily represent those of their affiliated organizations, or those of the publisher, the editors and the reviewers. Any product that may be evaluated in this article or claim that may be made by its manufacturer is not guaranteed or endorsed by the publisher.
Research integrity at Frontiers
Learn more about the work of our research integrity team to safeguard the quality of each article we publish.