 Jiyong Zhang
 Qianjin Zou
 Huadong Guan3*
- 1School of Resources and Environmental Engineering, Jiangxi University of Science and Technology, Ganzhou, Jiangxi, China
- 2Jiangxi Provincial Key Laboratory of Low-Carbon Processing and Utilization of Strategic Metal Mineral Resources, Ganzhou, Jiangxi, China
- 3School of Civil and Surveying and Mapping Engineering, Jiangxi University of Science and Technology, Ganzhou, Jiangxi, China
Crack propagation is an important cause of damage to rock bodies. In this study, uniaxial compression tests were conducted on specimens with rock-like mass containing fissures with different inclination angles to study the effect of crack angle on the crack evolution and fracture characteristics of rock bodies. The specimen surface deformation and internal response characteristics during fracture were analyzed via digital image correlation (DIC) and acoustic emission (AE) techniques. The results indicated that the AE characteristics of the fractured specimens exhibited a high degree of activity during the pore compaction and crack propagation stages. The prefabricated fissure configuration affected the stress state at the fissure tip, leading to differences in the crack evolution paths and rupture modes of fissure specimens with different angles. Under the uniaxial peak intensity, the relative position of the normalized global strain curve peak point gradually shifted from the specimen tip to the middle of the specimen as the crack angle increased, which corresponded to the shear damage-tension-shear mixed damage-tension damage modes of the specimen. The findings of this study indicate that normalized global strain curves can reflect the characteristics of crack evolution and provide a basis for the discrimination of fissured rock mass damage modes.
1 Introduction
Rock fracture damage is the main cause of many engineering disasters and is rooted in the destabilization and propagation of the fracture surface under external forces. Since Brace (Brace and Bombolakis, 1963), scholars have focused on the effect of fractures on the mechanical properties and damage modes of rocks, achieving important results (Bobet, 2000; Sagong and Bobet, 2002; Haeri et al., 2014; Haeri, 2015; Shimbo et al., 2022; Tian et al., 2024). However, most of these previous studies focused on the effects of different numbers and spatial locations of fissures and loading conditions on the mechanical properties and fracture characteristics of fissured rock bodies (Bobet, 2000; Sagong and Bobet, 2002; Haeri et al., 2014; Haeri, 2015).
Monitoring techniques such as high-speed photography, digital image correlation (DIC), acoustic emission (AE), and computer tomography (CT) scanning have been widely used to study rock damage evolution and better understand the characteristics of different rock fracture stages. Previous studies have shown that high-speed photography can accurately capture the crack initiation process at the crack tip (Yang et al., 2012; Yang et al., 2013; Cao et al., 2015; Zhou et al., 2014; Wong and Einstein, 2009a) and distinguish between the crack penetration pattern and crack type at the crack tip. Based on high-speed photography, scholars have systematically studied the crack evolution law and damage mode of fractured specimens based on DIC technology (Wu et al., 2022; Wang et al., 2022; Nguyen et al., 2011; Jin et al., 2021; Lotidis et al., 2020) and found that DIC can better analyze the fracture damage mechanism of fractured specimens under fine-grained conditions, which greatly promotes the understanding of fracture growth and propagation in rock masses.
With the continuous development of technology, CT scanning technology provides a new means of studying rock mechanics, especially for identifying internal rock damage and crack evolution. Previous studies based on CT scanning technology have conducted in-depth investigations on the dynamic damage evolution process in fracture-containing rocks (Wu et al., 2022; Wang et al., 2022; Li et al., 2010) and have gained a profound understanding of the connection between the microstructural and mechanical properties of materials (Li et al., 2010; Qin et al., 2024; Gao et al., 2023; Huang et al., 2023). Similarly, AE is a widely used and effective monitoring method to study the damage and fracture behavior inside rocks (Ghasemi et al., 2020; Moradian et al., 2010; Labuz et al., 2011; Zhang et al., 2019). The AE signal parameters can not only reflect the characteristic changes of stress-strain curves (Yang and Jing, 2011; Li et al., 2022) but can also be used to characterize the progressive destruction process of rock cracks and the damage fracture evolution law (Wang et al., 2021).
These aforementioned techniques have significantly enriched the crack evolution monitoring methods for fissured rock masses. However, a single monitoring method will always have limitations. Therefore, in this study, we used a combination of the AE and DIC techniques to analyze the surface deformation and internal response characteristics during the rupture of a fissured specimen under uniaxial compression conditions to establish an early warning evaluation method for the rupture evolution stage based on macro- and fine-scale multi-parameter characteristics. Additionally, the relationship between the evolution of the global strain field characteristics during the crack propagation stage and the damage mode of the fissured rock mass was also established. The experimental results provide a reference for identifying the damage mode of fissured rock bodies.
2 Materials and methods
2.1 Digital image correlation principles
When a rock mass is subjected to external loading, it is often accompanied by the generation of internal acoustic signals and external deformation (Omondi et al., 2016). The scattering spots on the surface of the rock body change their spatial location as the rock body deforms. Based on this, Ranson (Ranson and Peters, 1982) and Yamaguchi (Yamaguchi, 1981) proposed DIC as a non-contact method for measuring deformation. The DIC principle is to obtain the displacement and strain distribution on the surface of the specimen by calculating the grayscale of the scattering image before and after deformation of the region of interest (ROI) using an image-matching technique. The DIC principle is illustrated in Figure 1, in which several subsets with varying scattering characteristics exist in the ROI. When the specimen is deformed, the gray level of scattering within the subset changes. The displacement components u and v of the scattering spots in the subset region before and after deformation can be calculated via matching analysis, and the full-field displacement of the ROI can be derived by repeating this process.
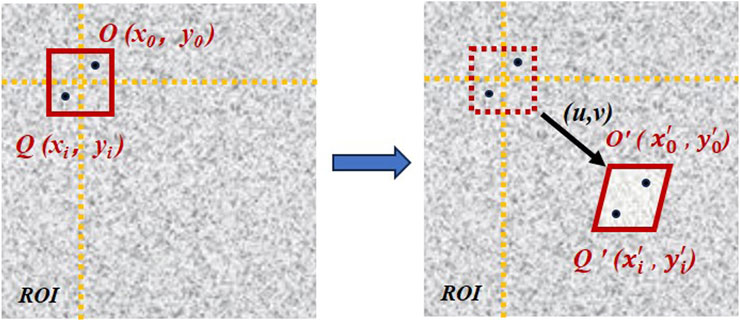
Figure 1. Schematic of the digital image correlation method principle.
In this study, the DIC post-processing software ncorr, which was developed by Blaber et al. (Blaber et al., 2015), was used to calculate the strain field in the ROI, and
where
where
where
where (2M + 1) × (2M + 1) denotes the reference subset range. Equation 13 is the definition of M:
2.2 Test specimen preparation
The influence of the specimen size on the test results was significant. In general, the ASTM standard requires a plate and block for the specimen shape. Table 1 summarizes the specimen sizes related to previous studies on crack propagation in fissured rock masses. In the tests, the specimen shape was often set as cubic (i.e., plate and block), which is conducive to observing the crack propagation law under the action of an external force. In these studies, the height-to-width ratio ranges between 1.33 and 2.5, and the thickness-to-width ratio ranges between 0.2 and 0.5. Among them, (Zhou et al., 2014; Wong and Einstein, 2009b) found that when the height and width of the specimen was two and the thickness-to-width ratio ranged between 0.2 and 0.363, the test is less affected by size, and the strength of the specimen is basically at the same level.
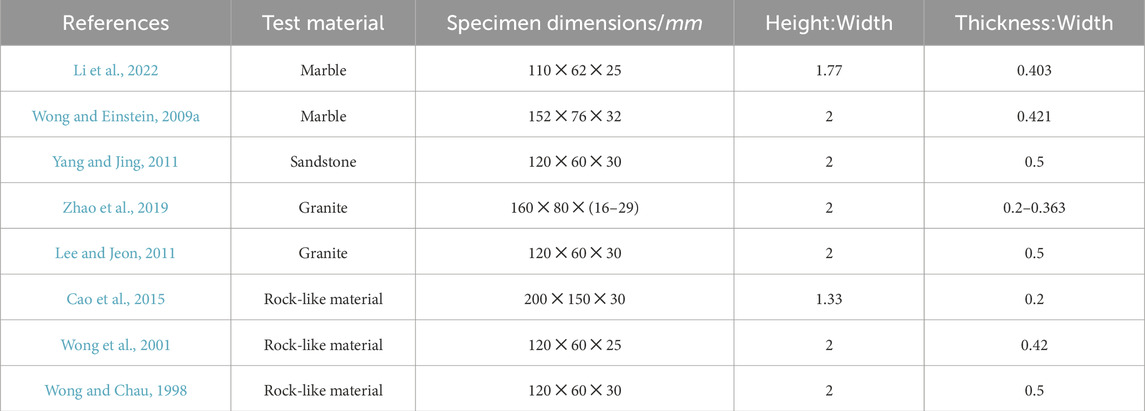
Table 1. Specimen sizes for the study of crack extension patterns in partially fractured rock bodies.
In this study, cubic specimens were used to perform the uniaxial compression tests. The fracture inside the specimens was characterized by the evolutionary features of the cracks on the specimen surface. However, the evolution characteristics of real three-dimensional cracks during compression are qualitatively different from those of ideal two-dimensional cracks. Additionally, Nolen-Hoeksema et al. (Nolen-Hoeksema and Gordon, 1987) also found that crack propagation inside rocks was asymmetric. To make the characterization method representative, the size of the test specimens should satisfy the requirement of accurately obtaining the crack propagation paths while reducing the influence of size. Therefore, the thickness of the test specimens should not be excessively high. Otherwise, crack propagation will occur in three dimensions inside the specimen, resulting in an unrepresentative surface crack-propagation pattern. However, the specimens should not be extremely thin either. Otherwise, out-of-plane bending can occur easily, resulting in test errors. After considering the above factors and preparatory test results, the thickness of the specimens was finally selected as 20 mm, which ensured a two-dimensional crack state without generating large bending or out-of-plane deformation. The length and width of the specimens were set to 100 and 50 mm, respectively. At this time, the height-to-width ratio of the specimen was 2, and the thickness-to-width ratio was 0.4, which is in line with the test requirements. The test program design is presented in Table 2. A front view of the slit specimen is shown in Figure 2.
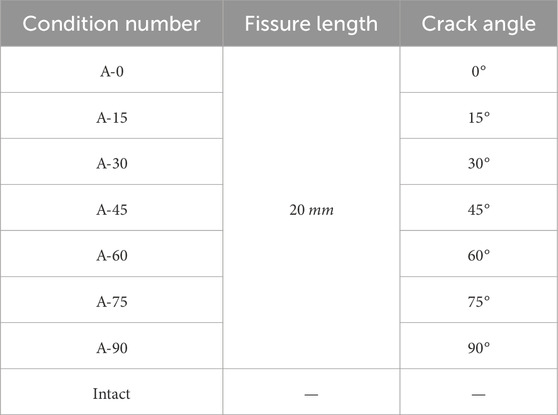
Table 2. Experimental design conditions.
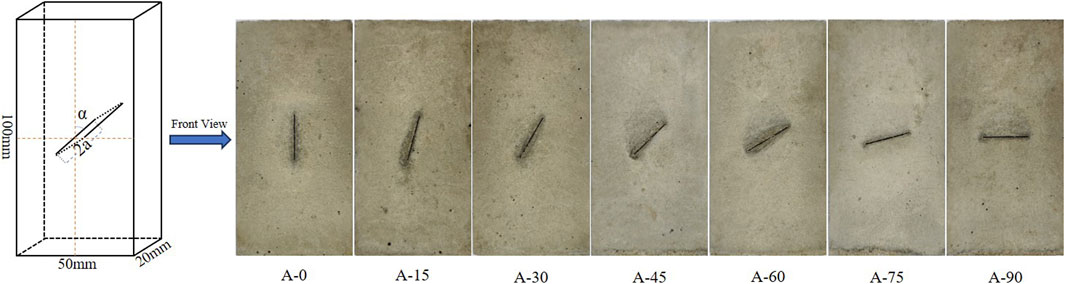
Figure 2. Fracture specimen model and frontal views for different crack angles.
To meet the test requirements, many scholars have used rock-like materials to simulate the problems encountered in real engineering (Wu et al., 2024; Wu et al., 2020; Jing et al., 2020). In this study, rock-like materials were used to fracture the specimens for testing. The materials were mixed and poured into molds made via 3D printing at a 42.5 cement:sand:water mass ratio of 1:2:0.65. The penetration cracks were prefabricated by inserting 20-mm-wide 0.4-mm-thick stainless-steel sheets during the casting process and pulling them out before the specimens were consolidated. The specimen preparation process is illustrated in Figure 3. The primary mechanical parameters are listed in Table 3.
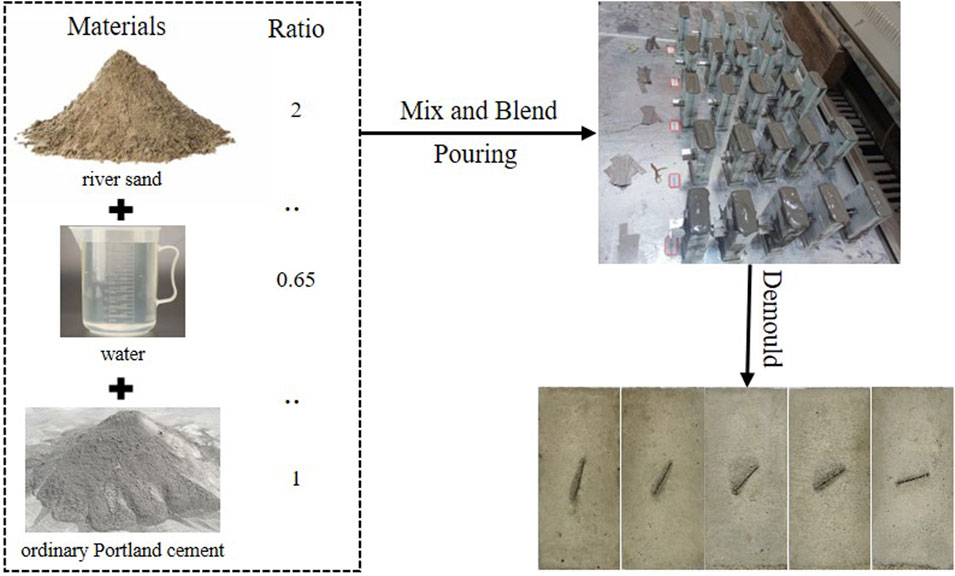
Figure 3. Specimen preparation process.
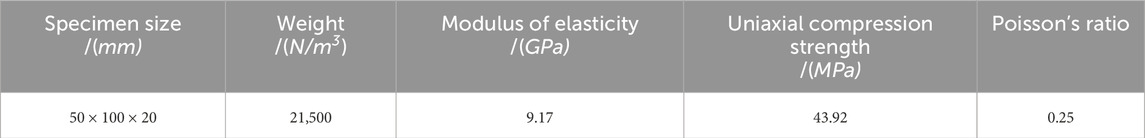
Table 3. Mechanical parameters of the materials.
2.3 Test specimen production
As shown in Figure 4, the test equipment consisted of a loading system, AE signal acquisition system, and DIC image acquisition system. The loading system was an RMT-150c electro-hydraulic servo press. A uniaxial compression test was performed on the specimens under each condition using displacement loading at a loading rate of 0.01 mm/s. The time, displacement, and load information of the test process were recorded simultaneously. The AE signal acquisition system used was Micro-II AE acquisition equipment from the Physical Acoustics Company. The transducer probes were placed on both sides of each specimen, the preamplifier gain was set to 40 dB, the sampling rate was set to 1 MHz, and the threshold value was 45 dB. The DIC image acquisition system used a charge-coupled device (CCD) industrial camera for acquisition. The acquisition pixels were set to 3840 × 2,160 pixels and LED lights were set on both sides to assist the camera in collecting scattered images of the specimen surface.
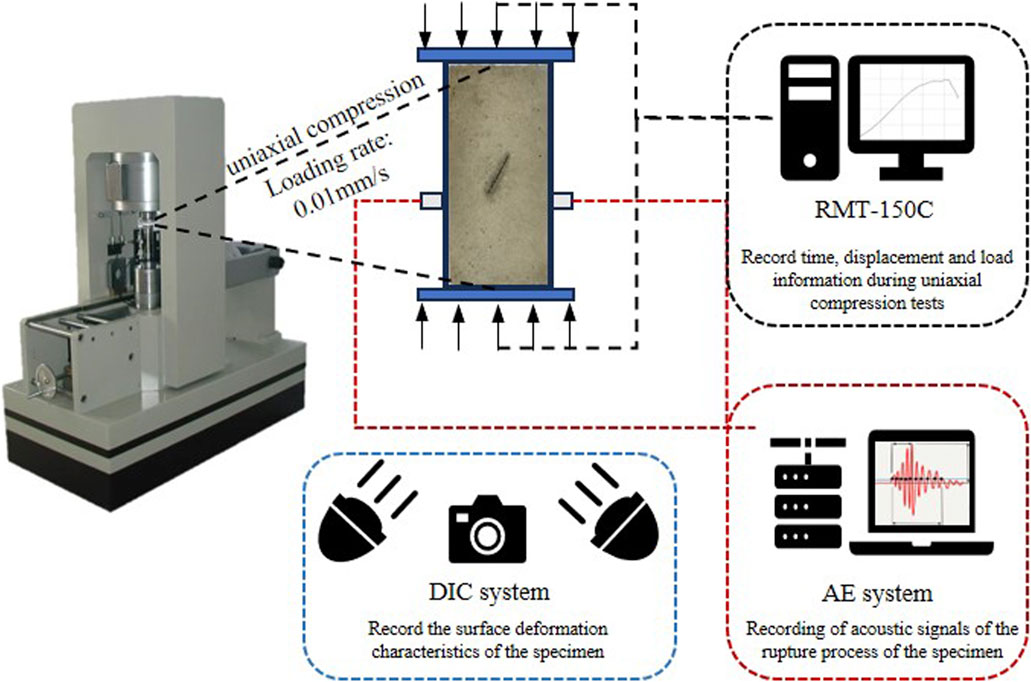
Figure 4. Test system.
During the test, the DIC image and AE signal acquisition systems were respectively used to collect surface images and internal acoustic information of the specimen under uniaxial compression. After the test, relevant analysis software was used to process and analyze the images and AE signals before and after deformation, and the characteristic parameters of the specimen in the fracture stage were obtained. Finally, a combined analysis was performed to complete the test.
3 Test results and analysis
3.1 Mechanical characteristics
3.1.1 Stress-strain curves
Uniaxial compression tests were performed on the specimens listed in Table 2, and their stress-strain curves are shown in Figure 5. As can be seen, the stress-strain curves of the intact and fissured specimens are generally similar. Both exhibit four developmental stages: initial pore compaction, linear elastic deformation, nonlinear hardening deformation, and post-peak damage. Compared with the intact specimens, the peak stress and elastic modulus of the slit specimens exhibit different degrees of decrease. When the slit inclination angle exceeds 15, a sudden drop in stress is commonly observed in the pre-peak stage of the stress-strain curves of the slit specimens. In the post-peak stage, the slit specimens exhibit a pattern of retaining a certain bearing capacity after the ductility decreases, whereas the intact specimens exhibit a rapid decrease.
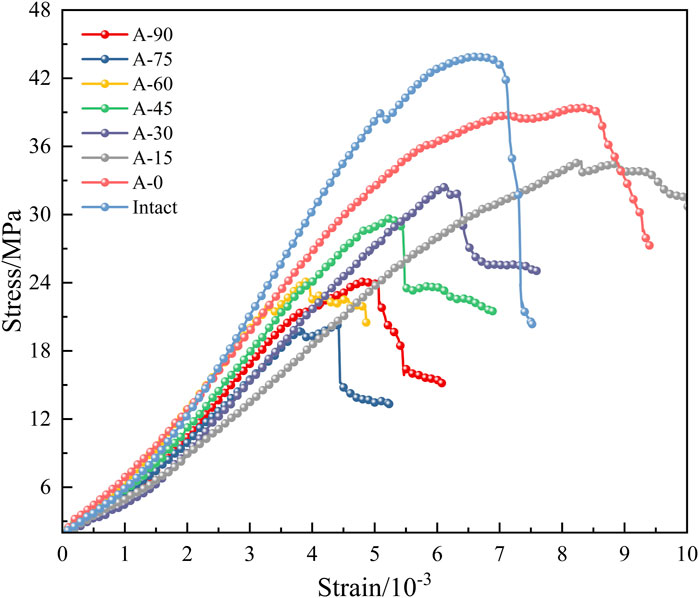
Figure 5. Stress-strain curves for each test specimen.
3.1.2 Strength-deformation characteristics
To quantitatively analyze the effect of slit inclination on the strength damage of the specimens, the ratio of the peak stress reduction magnitude of the prefabricated slit specimens compared to the intact specimen to the peak stress of the intact specimen was defined as the initial damage degree (Wang et al., 2018). The peak stress, strain, and initial damage of the specimens with different slit inclination angles are shown in Figure 6.
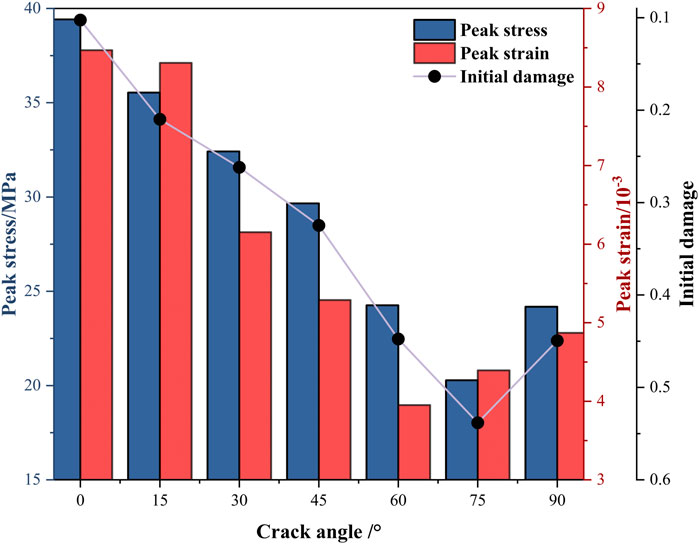
Figure 6. Peak stresses and strains and initial damage in specimens with different crack inclinations.
Different prefabricated fissure specimens showed 10.25%–53.83% initial damage compared to the intact specimens. This indicated a higher sensitivity of the specimen strength to the inclination of the prefabricated fissure. As the inclination angle α of the prefabricated fissure increases, the peak stress of the fissure specimen exhibits a pattern of decreasing and then increasing. Simultaneously, the initial damage degree exhibits a pattern of increasing and then decreasing. For α = 75°, both the peak strength and initial damage degree show inflection values of 20.28 MPa and 53.83%, respectively. For α < 60°, the peak strain of the fissure specimen decreases as the fissure inclination increases. For α > 60°, the peak strain increases as α increases, and the inflection point value of the peak strain is 3.951 × 10⁻³.
Compared with the intact specimen, the slit specimens were more prone to stress concentration under loading, leading to specimen damage. The inclination angle of the prefabricated cracks affected the stress concentration at the crack tip, resulting in different crack propagation modes in the specimen, which ultimately affected the damage mode of the cracked specimens.
3.2 Delineation of the rock rupture stages
The damage evolution process in a rock mass can be regarded as the initiation and evolution of microdefects. The AE signal, an important parameter in the rock fracture evolution process, reflects the stress state of the rock body at different evolution stages. The crack strain characteristics captured and analyzed based on the DIC technique can be used to describe the damage mechanism during the rock fracture evolution process. Compared with single-parameter analysis, the combination of DIC macro-deformation characteristics and AE microscopic signals can more accurately identify and distinguish the fracture stages of a rock mass.
3.2.1 Rupture stage characterization for fractured rock bodies
In this study, the rock rupture stage was divided based on the AE and DIC techniques combined with acoustic and image features. The specific rupture stage delineation method is to delineate the rupture stage when a significant increase or decrease in the AE event rate occurs or when the slope of the cumulative AE event number curve shows a significant change. Additionally, the crack-propagation stage was divided based on the AE event rate and cumulative AE event number curve slope combined with the DIC images.
The rupture stages of the intact and fractured specimens are shown in Figure 7. The rock rupture process can be roughly divided into four stages using different colored backgrounds: compaction (Stage I: cyan), elasticity (Stage II: yellow), crack propagation (Stage III: orange), and post rupture (Stage IV: red). Points a and b represent the crack initiation stress and peak stress points, respectively. The strain characteristics corresponding to points a and b are shown in two cloud diagrams (a: left; b: right).
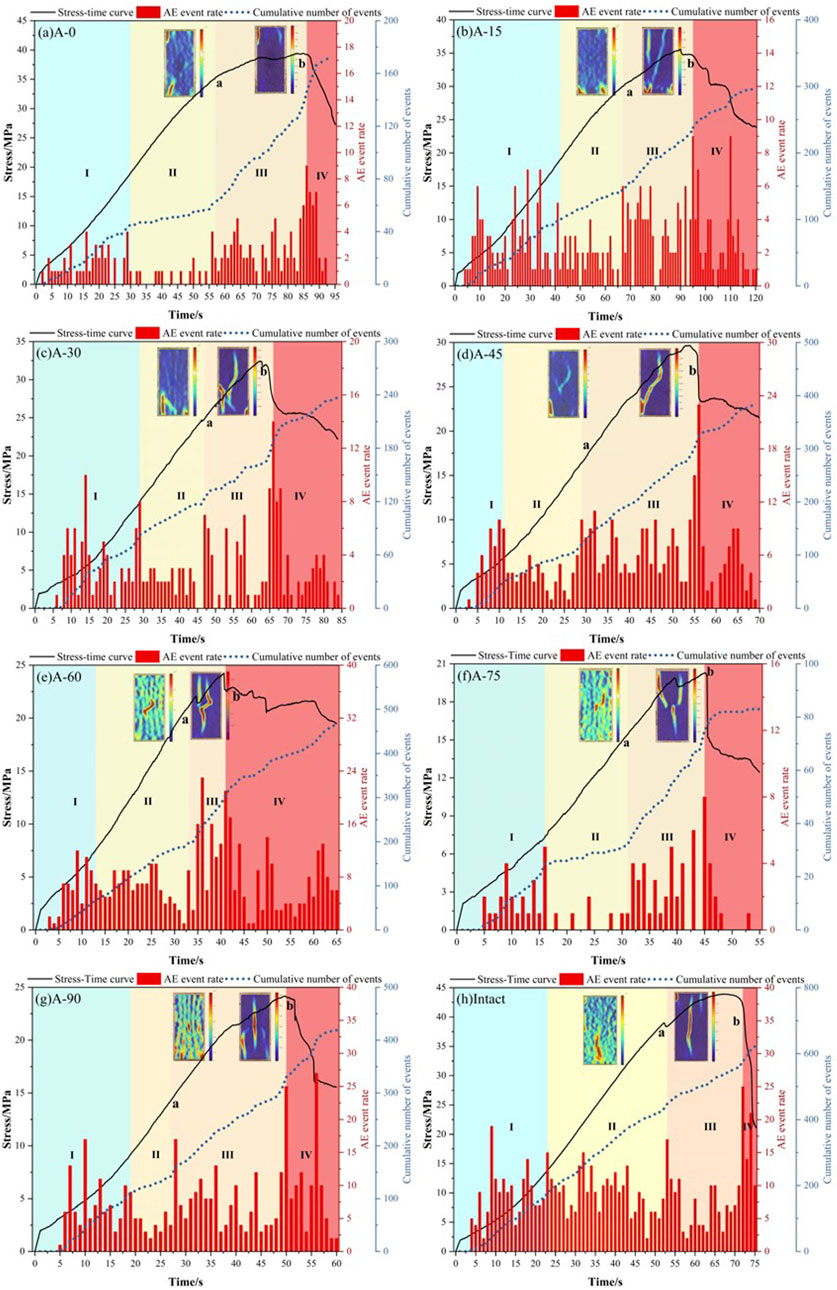
Figure 7. Rupture stage classification based on acoustic and optical characteristics: (A) A-0; (B) A-15; (C) A-30; (D) A-45; (E) A-60; (F) A-75; (G) A-90; (H) Intact.
The stress-strain curve exhibited a downward concave shape when the cracked specimen was in Stage I. With the application of an axial load, the prefabricated cracks and microscopic defects inside the specimen gradually closed and were accompanied by a violent ringing sound. At this time, the AE rate was high, and the cumulative event number curve slope was larger.
In Stage II, after compaction, the fractured specimen underwent elastic deformation owing to the interaction of the internal crystals. The stress-strain curve increases linearly, the AE rate was low, and the cumulative event curve slope decreases.
In Stage III, stress concentration occurred at the prefabricated crack tip. When the load reaches the crack initiation stress point, the prefabricated crack tip begins to produce nascent cracks. At this point, the AE event rate increased abruptly, exhibiting high sensitivity to crack propagation, and reached a maximum at the peak stress point. The rock approaches destabilization damage at the end of this stage.
As the axial load increased to the peak stress, the stress-strain curves entered Stage IV. The curves exhibit varying degrees of decrease. The specimens lost more load-carrying capacities. At this time, the acoustic signal parameters were in a low-interval range.
Unlike the rupture characteristics of the fissure specimens, the AE event rate in the intact specimen gradually increased to a high level during Stages I and II. This is because the intact specimen had fewer internal voids and the stress distribution was relatively uniform during the loading process, which did not produce a small and prominent acoustic signal during Stage I owing to the stress concentration phenomenon in some areas.
In summary, when the fissured rock mass is in different rupture stages, the AE event rate exhibits a high-low–high-low active law, which corresponds to the rupture characteristics of pore compression and density within the specimen: elastic deformation, crack propagation and extension, and rupture destabilization, respectively. The AE feature can be used as an early warning signal for rock mass destabilization precursors. When the value changes from small to large, it is often accompanied by crack evolution inside the rock mass, which implies destabilization of the rock mass.
3.2.2 Crack evolution characterization
A strain–cloud diagram of the crack propagation stage (Stage III) is shown in Figure 8. The four subplots for each condition in the figure represent the crack evolution at each of the four fetch points in Stage III (the first is crack initiation point a, and the fourth is peak point b).
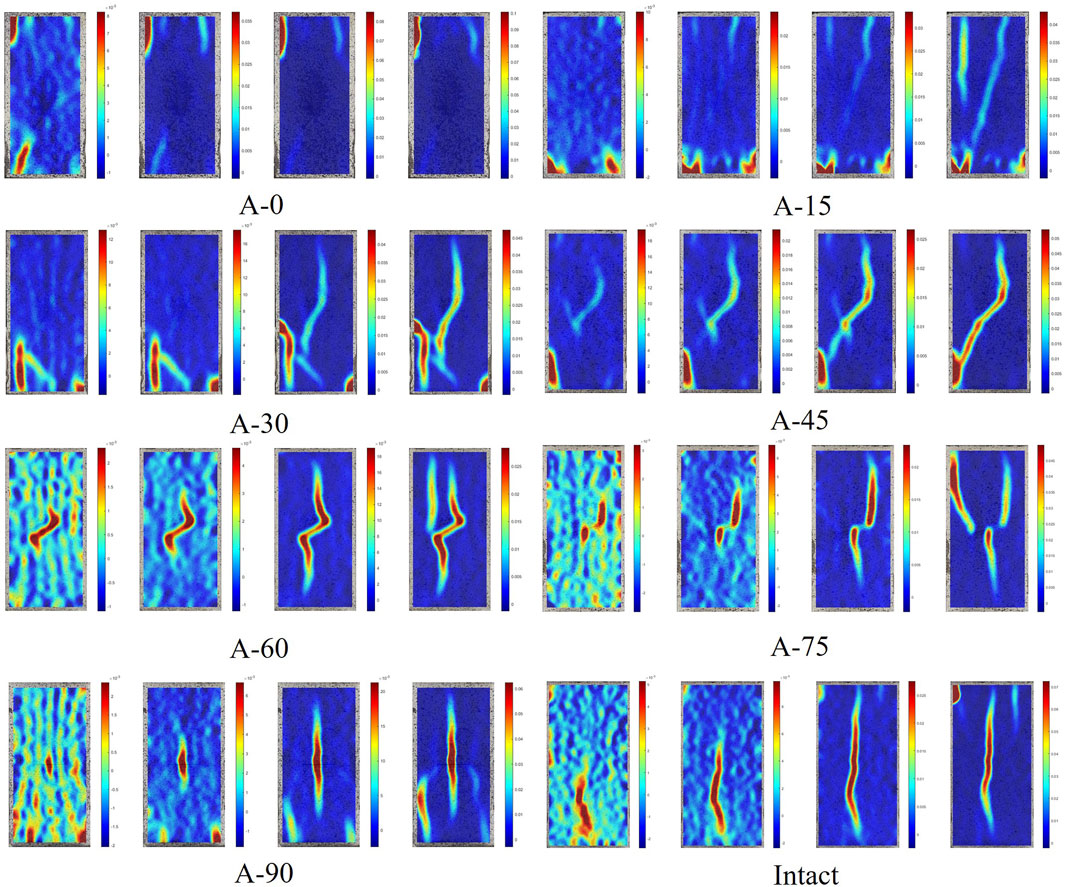
Figure 8. Strain maps of the crack initiation and expansion stages for each specimen.
For α ≤ 30°, the cracked specimens exhibit similar crack initiation characteristics as the intact specimen. After the load reached the crack initiation stress, stress concentration occurred mainly around the specimens. Crack propagation did not first sprout from the prefabricated crack tip, instead it appeared around the perimeter of the specimen towards the center.
For α > 30°, crack propagation in the specimen sprouting under the initiation stress starts from the prefabricated crack tip. At peak point b, each cracked specimen exhibited different strain characteristics. As α gradually increased, the damage modes of the specimens were shear damage due to shear crack propagation (0°–15°) - mixed tension-shear damage due to tension-shear crack propagation (30°–45°) - tension damage due to tension crack propagation (60°–90°). It is worth noting that the nascent cracks in the intact specimens, although shear cracks, were eventually mixed with tension-shear damage owing to tension-shear crack propagation.
3.3 Variation law of the principal strain field during crack initiation and evolution
Under uniaxial compressive loading, crack propagation and penetration were the main causes of damage to cracked specimens. Therefore, analyzing the strain field state of the rock in the crack propagation stage can effectively reveal the damage mode of the rock. This study was based on the strain component in the xyz-direction during Stage III. The global strain field curves of crack initiation points a and b were established with the central axis as the calculation path and the ROI as the calculation range. The curve was then normalized. This principle is illustrated in Figure 9. The horizontal coordinate in the figure represents the normalized strain component
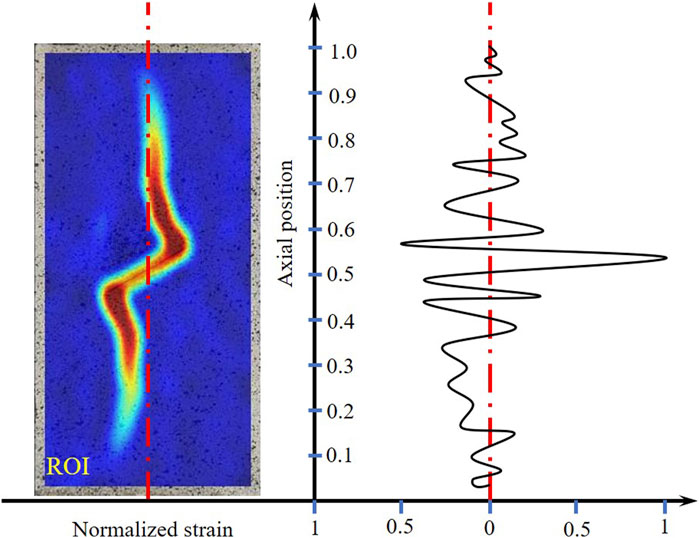
Figure 9. Normalized global strain field profile with the ROI as the calculation range.
The analysis results are presented in Figure 10. Under crack initiation stress, the normalized global strain field curves of the fractured specimens exhibit different characteristics. For α ≤ 15°, the peak of the normalized strain field curve appears at the end position of the specimen. For crack angles of 30° and 45°, the peak region of the curve gradually increases and is mainly distributed at the relative position of 0.5–1. For α ≥ 60°, the strain field curves of the specimens are uniformly distributed.
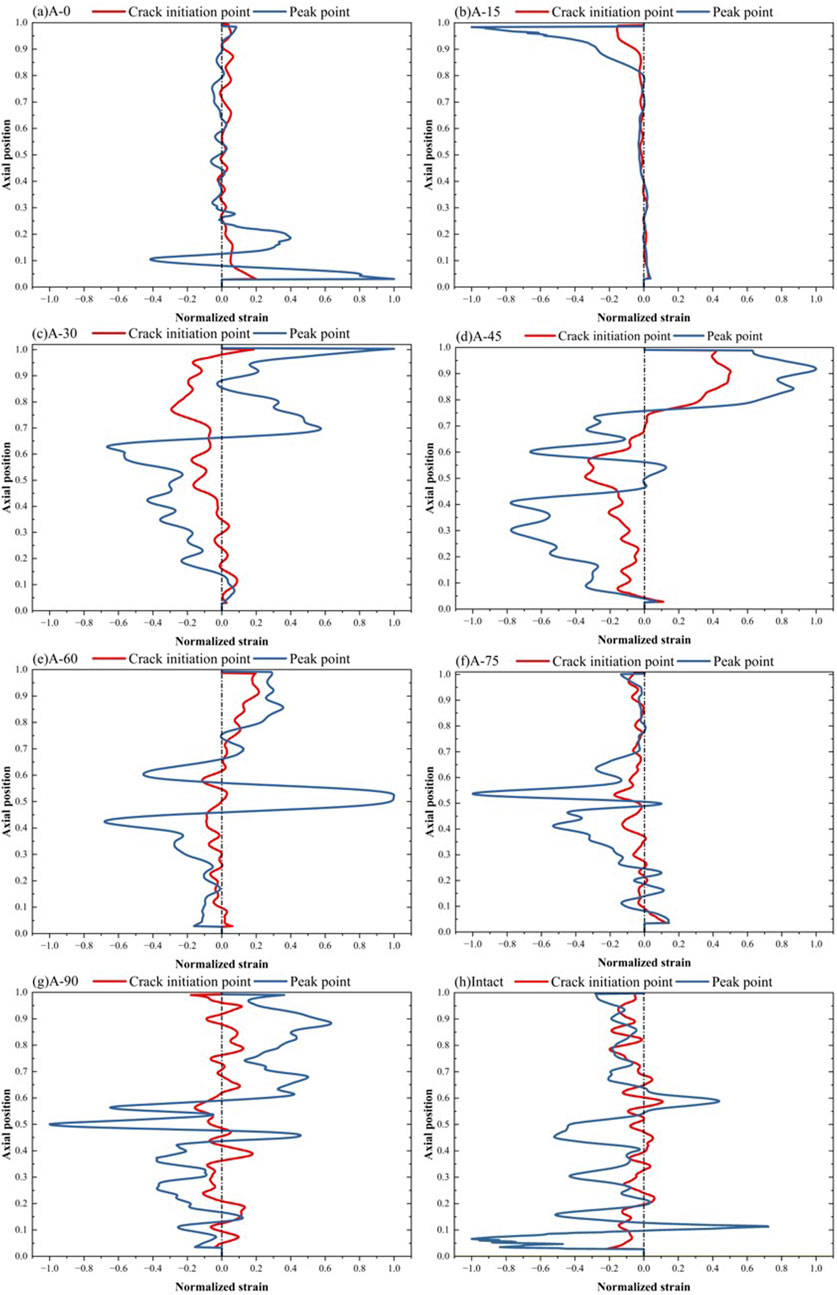
Figure 10. Global strain field curves at the initiation and peak points: (A) A-0; (B) A-15; (C) A-30; (D) A-45; (E) A-60; (F) A-75; (G) A-90; (H) Intact.
Under the uniaxial peak stress, For α ≤ 15°, the strain field distribution law behaves similarly to the strain field state of the intact specimen. With the relative axial position from the ends to the center of the specimen, the strain gradually changes from high to low. The maximum value of the normalized strain field curves appears at the end position of the specimen, and the relative positions are mainly between 0 and 0.25 and 0.8–1. For crack angles of 30° and 45°, the normalized strain field curves are uniformly distributed. The curve peak appears mainly between the ends of the specimen and the crack tip, and the relative positions are between 0.2 and 0.4 and 0.6–1. For α ≥ 60°, the strain field curve peak of the specimen is mainly concentrated in the relative position of the prefabricated crack tip.
4 Discussion
The crack initiation characteristics and damage modes of the fissure specimens were the main factors affecting the strain field characteristics. For α ≤ 15°, shear cracks sprouted around the slit specimen. With an increase in the axial load, the crack connected with the crack generated at the pre-set crack tip, leading to shear damage. Therefore, the normalized strain field curves at both the crack initiation point a and peak point b exhibit end projection characteristics.
For crack angles of 30° and 45°, the specimen sprouts tension cracks at the end of the prefabricated cleavage under the crack initiation stress and is accompanied by shear cracks around the specimen. With an increase in the axial load, mixed tension-shear damage due to tension-shear crack propagation occurred in the specimen. The high-strain areas of the strain field at initiation points a and b were distributed at the end and center of the specimen. For α ≥ 60°, the prefabricated crack tip sprouts a tension crack under load. Eventually, the specimen experienced tension damage caused by the tension crack propagation at the prefabricated crack tip. The normalized strain field curves of the specimen at both crack initiation points a and b show a prominent center.
During the fracturing of a fissured rock mass, the crack evolution law determines the damage mode of the rock mass. The strain field characteristics calculated using the strain component
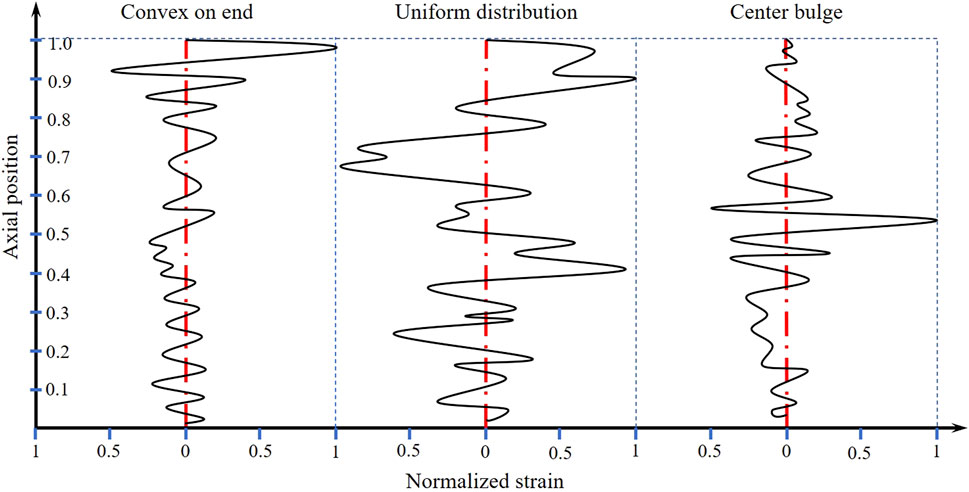
Figure 11. Types of normalized strain field curve characteristics.
However, the deformation and destruction of a rock mass are long-term processes. It is worth noting that the AE and DIC techniques used in the tests are limited to the analysis of the collected data, which made it difficult to monitor and predict ruptures in real time and over the long term. In future work, simplifying the processing steps of the AE and DIC data should be considered to enhance the timeliness of the data for real-time monitoring and rock mass rupture prediction.
5 Conclusion
To study the influence of prefabricated cracks on crack evolution and fracture characteristics, uniaxial compression tests were performed on crack specimens with different slit angles (0°–90°), and the fracture stages of crack specimens under uniaxial compression load were divided using AE and DIC technology. Based on the
(1) Based on the acoustic and optical data collected during the test, the fracture process of the specimen could be roughly divided into four stages: Stage I: compaction; Stage II: elastic deformation; Stage III: crack propagation; and Stage IV: post rupture. In contrast to the intact specimen, the closure and expansion of the prefabricated cracks led to a higher activity of the AE parameters in Stages I and III.
(2) Under uniaxial compression loading, the prefabricated crack structure affects the stress state of the crack tip, resulting in a difference in the crack evolution path. The failure mode showed shear failure, tensile failure, and tensile failure with an increase in the prefabricated crack angle. The difference between the shear and tensile failure resistance was the main reason why the strength of the specimens first decreased and then increased.
(3) With the difference in failure modes, the normalized global strain curve shows end protruding characteristics (0°–15°), uniform distribution (30°–45°), and center protrusion (60°–90°), which provide a good characterization of the fracture characteristics of the specimens.
Data availability statement
The original contributions presented in the study are included in the article/supplementary material, further inquiries can be directed to the corresponding author.
Author contributions
JZ: Conceptualization, Funding acquisition, Writing–original draft, Writing–review and editing. QZ: Conceptualization, Data curation, Formal Analysis, Investigation, Methodology, Software, Writing–original draft, Writing–review and editing. HG: Conceptualization, Project administration, Writing–review and editing.
Funding
The author(s) declare that no financial support was received for the research, authorship, and/or publication of this article. This study was funded by the Science and Technology Research Program of Jiangxi Provincial Department of Education [GJJ200857] and 2023 Jiangxi Province “Science and Technology + Emergency Response” Joint Program Project: Research on Safe and Efficient Mining Technology and Application Demonstration in Gannan Tungsten Mine [2023KYG01002].
Conflict of interest
The authors declare that the research was conducted in the absence of any commercial or financial relationships that could be construed as a potential conflict of interest.
Publisher’s note
All claims expressed in this article are solely those of the authors and do not necessarily represent those of their affiliated organizations, or those of the publisher, the editors and the reviewers. Any product that may be evaluated in this article, or claim that may be made by its manufacturer, is not guaranteed or endorsed by the publisher.
References
Blaber, J., Adair, B., and Antoniou, A. (2015). Ncorr: open-source 2D digital image correlation matlab software. Exp. Mech. 55 (6), 1105–1122. doi:10.1007/s11340-015-0009-1
Bobet, A. (2000). The initiation of secondary cracks in compression. Eng. Fract. Mech. 66 (2), 187–219. doi:10.1016/s0013-7944(00)00009-6
Brace, W. F., and Bombolakis, E. G. (1963). A note on brittle crack growth in compression. J. Geophys. Res. 68 (12), 3709–3713. doi:10.1029/jz068i012p03709
Cao, P., Liu, T. Y., Pu, C. Z., and Lin, H. (2015). Crack propagation and coalescence of brittle rock-like specimens with pre-existing cracks in compression. Eng. Geol. 187 (17), 113–121. doi:10.1016/j.enggeo.2014.12.010
Gao, B., Cao, S., and Yilmaz, E. (2023). Effect of content and length of polypropylene fibers on strength and microstructure of cementitious tailings-waste rock fill. Minerals-Basel. 13 (2), 142. doi:10.3390/min13020142
Ghasemi, S., Khamehchiyan, M., Taheri, A., Nikudel, M. R., and Zalooli, A. (2020). Crack evolution in damage stress thresholds in different minerals of granite rock. Rock Mech. Rock Eng. 53 (3), 1163–1178. doi:10.1007/s00603-019-01964-9
Haeri, H. (2015). Crack analysis of pre-cracked brittle specimens under biaxial compression. J. Min. Sci. 51 (6), 1091–1100. doi:10.1134/s1062739115060344
Haeri, H., Shahriar, K., Marji, M. F., and Moarefvand, P. (2014). On the strength and crack propagation process of the pre-cracked rock-like specimens under uniaxial compression. Strength. Mater 46 (1), 140–152. doi:10.1007/s11223-014-9525-y
Huang, Z. Q., Cao, S., and Yilmaz, E. (2023). Microstructure and mechanical behavior of cemented gold/tungsten mine tailings-crushed rock backfill: effects of rock gradation and content. J. Environ. Manage. 339, 117897. doi:10.1016/j.jenvman.2023.117897
Jin, A. B., Wang, S. L., and Wang, B. X. (2021). Study on the fracture mechanism of 3D-printed-joint specimens based on DIC technology. Rock. Soil Mech. 41 (10), 3214–3224. doi:10.16285/j.rsm.2020.0004
Jing, H., Wu, J., Yin, Q., and Wang, K. (2020). Deformation and failure characteristics of anchorage structure of surrounding rock in deep roadway. Int. J. Min. Sci. Techno 30, 593–604. doi:10.1016/j.ijmst.2020.06.003
Labuz, J. F., Cattaneo, S., and Chen, L. H. (2011). Acoustic emission at failure in quasi-brittle materials. Constr. Build. Mater. 15, 225–233. doi:10.1016/s0950-0618(00)00072-6
Lee, H., and Jeon, S. (2011). An experimental and numerical study of fracture coalescence in pre-cracked specimens under uniaxial compression. Int. J. Solids. Struct. 48 (6), 979–999. doi:10.1016/j.ijsolstr.2010.12.001
Li, K. S., Zhao, Z., Ma, D. P., Liu, C., and Zhang, J. (2022). Acoustic emission and mechanical characteristics of rock-like material containing single crack under uniaxial compression. Arab. J. Sci. Eng. 47, 4749–4761. doi:10.1007/s13369-021-06251-w
Li, T. C., Lu, H. B., and Wang, H. (2010). CT real-time scanning tests on double cracks propagation under uniaxial compression. Rock. Soil Mech. 31 (1), 9–14.
Lotidis, M. A., Nomikos, P. P., and Sofianos, A. I. (2020). Laboratory study of the fracturing process in marble and plaster hollow plates subjected to uniaxial compression by combined acoustic emission and digital image correlation techniques. Rock. Mech. Rock. Eng. 53 (4), 1953–1971. doi:10.1007/s00603-019-02025-x
Moradian, Z. A., Ballivy, G., Rivard, P., Gravel, C., and Rousseau, B. (2010). Evaluating damage during shear tests of rock joints using acoustic emissions. Int. J. Rock Mech. Min. Sci. 47 (4), 590–598. doi:10.1016/j.ijrmms.2010.01.004
Nguyen, T. L., Hall, S. A., Vacher, P., and Viggiani, G. (2011). Fracture mechanisms in soft rock: identification and quantification of evolving displacement discontinuities by extended digital image correlation. Tectonophysics 503 (1), 117–128. doi:10.1016/j.tecto.2010.09.024
Nolen-Hoeksema, R. C., and Gordon, R. B. (1987). Optical detection of crack patterns in the opening-mode fracture of marble. Int. J. Rock Mech. Min. 24 (2), 135–144. doi:10.1016/0148-9062(87)91933-4
Omondi, B., Aggelis, D. G., Sol, H., and Sitters, C. (2016). Improved crack monitoring in structural concrete by combined acoustic emission and digital image correlation techniques. Structl Health Monit. 15 (3), 359–378. doi:10.1177/1475921716636806
Qin, H., Cao, S., and Yilmaz, E. (2024). Mechanical, energy evolution, damage and microstructural behavior of cemented tailings-rock fill considering rock content and size effects. Constr. Build. Mater. 411, 134449. doi:10.1016/j.conbuildmat.2023.134449
Ranson, W. F., and Peters, W. H. (1982). Digital imaging techniques in experimental stress analysis. Opt. Eng. 21 (3), 427–431. doi:10.1117/12.7972925
Sagong, M., and Bobet, A. (2002). Coalescence of multiple flaws in a rock-model material in uniaxial compression. Int. J. Rock Mech. Min. Sci. 39 (2), 229–241. doi:10.1016/s1365-1609(02)00027-8
Shimbo, T., Shinzo, C., Uchii, U., Itto, R., and Fukumoto, Y. (2022). Effect of water contents and initial crack lengths on mechanical properties and failure modes of pre-cracked compacted clay under uniaxial compression. Eng. Geol. 301, 106593. doi:10.1016/j.enggeo.2022.106593
Tian, X. Y., Zhao, F. J., Wang, W. J., Chen, B., Ma, Y. j., and Fan, B. j. (2024). Study on energy evolution and fractal characteristics of sandstone with different fracture dip angles under uniaxial compression. Sci. Rep. 14 (1), 10464. doi:10.1038/s41598-024-60902-0
Wang, H., Gao, Y. T., and Zhou, Y. (2022). Experimental and numerical studies of brittle rock-like specimens with unfilled cross fissures under uniaxial compression. Theor. Appl. Fract. Mec. 117, 103167. doi:10.1016/j.tafmec.2021.103167
Wang, Y. L., Tang, J. X., Dai, Z. Y., and Yi, T. (2018). Experimental study on mechanical properties and failure modes of low-strength rock samples containing different fissures under uniaxial compression. Eng. Fract. Mech. 197, 1–20. doi:10.1016/j.engfracmech.2018.04.044
Wang, Y. Y., Deng, H. C., Deng, Y., Chen, K., and He, J. (2021). Study on crack dynamic evolution and damage-fracture mechanism of rock with pre-existing cracks based on acoustic emission location. J. Petrol Sci. Eng. 201, 108420. doi:10.1016/j.petrol.2021.108420
Wong, L. N. Y., and Einstein, H. H. (2009a). Crack coalescence in molded gypsum and Carrara marble: Part 1. Macroscopic observations and interpretation. Rock Mech. Rock Eng. 42 (3), 475–511. doi:10.1007/s00603-008-0002-4
Wong, L. N. Y., and Einstein, H. H. (2009b). Systematic evaluation of cracking behavior in specimens containing single flaws under uniaxial compression. Int. J. Rock Mech. Min. 46 (2), 239–249. doi:10.1016/j.ijrmms.2008.03.006
Wong, R. H. C., and Chau, K. T. (1998). Crack coalescence in a rock-like material containing two cracks. Int. J. Rock Mech. Min. 35 (2), 147–164. doi:10.1016/s0148-9062(97)00303-3
Wong, R. H. C., Chau, K. T., Tang, C. A., and Lin, P. (2001). Analysis of crack coalescence in rock-like materials containing three flaws Part I: experimental approach. Int. J. Rock Mech. Min. 38 (7), 909–924. doi:10.1016/s1365-1609(01)00064-8
Wu, J., Jing, H., Yin, Q., Yu, L., Meng, B., and Li, S. (2020). Strength prediction model considering material, ultrasonic and stress of cemented waste rock backfill for recycling gangue. J. Clean. Prod. 276, 123189. doi:10.1016/j.jclepro.2020.123189
Wu, J., Wong, H. S., Zhang, H., Yin, Q., Jing, H., and Ma, D. (2024). Improvement of cemented rockfill by premixing low-alkalinity activator and fly ash for recycling gangue and partially replacing cement. Cem. Concr. Comp 145, 105345. doi:10.1016/j.cemconcomp.2023.105345
Wu, X., Zhang, L. Y., Sun, J. L., Guo, Q., Pan, J., and Gao, J. (2022). Strength characteristics and failure mechanism of granite with cross cracks at different angles based on DIC method. Adv. Mater Sci. Eng. 2022, 1–9. doi:10.1155/2022/9144673
Yamaguchi, I. (1981). A laser-speckle strain gauge. J. Phys. E. 14 (11), 1270–1273. doi:10.1088/0022-3735/14/11/012
Yang, S. Q., and Jing, H. W. (2011). Strength failure and crack coalescence behavior of brittle sandstone samples containing a single fissure under uniaxial compression. Int. J. Fract. 168 (2), 227–250. doi:10.1007/s10704-010-9576-4
Yang, S. Q., Liu, X. R., and Jing, H. W. (2013). Experimental investigation on fracture coalescence behavior of red sandstone containing two unparallel fissures under uniaxial compression. Int. J. Rock Mech. Min. 63, 82–92. doi:10.1016/j.ijrmms.2013.06.008
Yang, S. Q., Yang, D. S., Jing, H. W., Li, Y. H., and Wang, S. Y. (2012). An experimental study of the fracture coalescence behaviour of brittle sandstone specimens containing three fissures. Rock. Mech. Rock. Eng. 45, 563–582. doi:10.1007/s00603-011-0206-x
Zhang, G. K., Li, H. B., and Wang, M. Y. (2019). Crack propagation characteristics in rocks containing single fissure based on acoustic testing and camera technique. Rock. Soil Mech. 40 (S1), 63–72. doi:10.16285/j.rsm.2018.2103
Zhao, F., Sun, Q., Yang, D., and Zhang, W. (2019). Thermal effects on failure characteristics of granite with pre-existing fissures. Geotech. Res. 6 (4), 302–311. doi:10.1680/jgere.19.00019
Keywords: crack evolution1, digital image correlation2, rock mechanics3, acoustic emission4, fracture characterization5
Citation: Zhang J, Zou Q and Guan H (2024) Fracture characterization of fractured rock bodies based on acoustic and optical characteristics. Front. Earth Sci. 12:1421355. doi: 10.3389/feart.2024.1421355
Received: 22 April 2024; Accepted: 16 August 2024;
Published: 28 August 2024.
Edited by:
Jiangyu Wu, China University of Mining and Technology, ChinaReviewed by:
Erol Yilmaz, Recep Tayyip Erdoğan University, TürkiyeWeiqiang Zhang, China University of Mining and Technology, China
Haitao Wang, Chongqing University of Science and Technology, China
Lining Yang, The University of Manchester, United Kingdom
Jishi Geng, Xi’an University of Science and Technology, China
Copyright © 2024 Zhang, Zou and Guan. This is an open-access article distributed under the terms of the Creative Commons Attribution License (CC BY). The use, distribution or reproduction in other forums is permitted, provided the original author(s) and the copyright owner(s) are credited and that the original publication in this journal is cited, in accordance with accepted academic practice. No use, distribution or reproduction is permitted which does not comply with these terms.
*Correspondence: Huadong Guan, eWlkaXh1ZXppQDEyNi5jb20=