
94% of researchers rate our articles as excellent or good
Learn more about the work of our research integrity team to safeguard the quality of each article we publish.
Find out more
ORIGINAL RESEARCH article
Front. Earth Sci., 13 June 2024
Sec. Georeservoirs
Volume 12 - 2024 | https://doi.org/10.3389/feart.2024.1419631
This article is part of the Research TopicEfficient Exploration and Development of Unconventional Natural GasView all 10 articles
 Long Ren1,2*
 Mengyuan Dou3Xiaowei Dong4Bo Chen5Ling Zhang5Jian Sun1,2Cheng Jing1,2Wugang Zhang1,2Desheng Zhou1,2Haiyan Li6
Stimulated reservoir volume (SRV) fracturing has become the most efficient technology in the treatment of unconventional hydrocarbon reservoir formations. This process aims to optimize well productivity by establishing an intricate network of fractures that integrate hydraulic and natural fractures, distal to the wellbore, thereby amplifying the contact area with the subterranean formations and fracture systems. This study introduces a quantitative framework designed to characterize the fracturing effects within naturally fractured unconventional hydrocarbon reservoirs. Leveraging existing fracturing treatment designs and production performance data, the study formulates a mathematical model of the complex fracture network, predicated on the principle of material balance. The model comprehensively accounts for the development degree of natural fractures, the morphological impact of stress differentials on the fracture network, and the imbibition displacement effects of the fracturing fluids. The model’s accuracy is verified through an integration with microseismic monitoring data and an enhanced understanding of reservoir development. Building upon this foundation, the study quantitatively dissects the impact of various engineering parameters on the efficacy of SRV fracturing. The proposed quantitative characterization method is adept for widespread application across multiple wells in oil and gas fields, offering a distinct advantage for the swift and precise assessment of SRV fracturing outcomes in naturally fractured unconventional hydrocarbon reservoirs. The research method, which is based on readily accessible fracturing construction data and is more convenient, can to a certain extent improve the efficiency of hydraulic fracturing evaluation work.
The fundamental purpose of evaluating fracturing effects is to enhance the success rate of fracturing operations, optimize fracturing design technology, enhance post-fracturing production, and guide production management post-fracturing (Zhang et al., 2020; Wang et al., 2022; Guo et al., 2023; Luo et al., 2024). The evaluation of the stimulated reservoir volume (SRV) fracturing effect entails a comprehensive assessment of the overall quality of fracturing construction. In a broad sense, it involves a qualitative evaluation of single well or block fracturing construction dynamic monitoring, the alignment of process and design during construction, long-term production performance, and economic viability. In a narrow sense, it focuses on quantitatively characterizing post-fracturing productivity changes, such as SRV, fracture conductivity, and fracture density (geometrical parameters), etc.
Over the recent years, a substantial body of research has been dedicated to the evaluation of hydraulic fracturing within the context of naturally fractured unconventional hydrocarbon reservoirs. These evaluation methodologies are bifurcated into direct and indirect approaches based on the immediacy and objectivity of the resultant data. The direct approach encompasses the acquisition of data through sophisticated monitoring instruments, including microseismic fracture monitoring, isotopic tracers, and inclinometers, to ascertain and interpret a multitude of fracture-related parameters that are indicative of the fracturing process’s efficacy (Liu et al., 2019; Eyinla et al., 2023; Wang et al., 2023). In contrast, the indirect approach involves the inversion of fracture geometry and conductivity parameters from production test data, which includes the analysis of production dynamics of fractured wells, well test evaluations, and the application of mathematical models (Niu et al., 2019; Zhang et al., 2020; Wang et al., 2024). Despite these methods, the direct approach often overestimates the SRV in comparison to the effective stimulated reservoir volume (ESRV) that includes a proppant pack (Li et al., 2019; Li et al., 2024). Meanwhile, the indirect approach, with its potential for multiple interpretive solutions, overlooks the imbibition phenomenon, thereby introducing constraints in the precise and quantitative characterization of SRV fracturing effects in horizontal wells within naturally fractured unconventional hydrocarbon reservoirs.
Aiming to address these limitations, this study introduces a novel quantitative characterization model for SRV fracturing effects in naturally fractured unconventional hydrocarbon reservoirs, predicated on the principles of material balance. The model is anchored in empirical fracturing construction and production dynamic data, and it holistically integrates the impact of natural fracture development, stress differentials on fracture network morphology, the imbibition displacement dynamics between the fracture network and matrix pores, and the material balance between the injected and produced fluid systems throughout the fracturing and flowback phases. This model provides a quantitative depiction and assessment of the degree of reserves production within a given well pattern and fracture network distribution, offering a more nuanced evaluation framework for the performance of SRV fracturing in such complex reservoir environments.
The formation process of fracture networks in unconventional hydrocarbon reservoirs through volume fracturing is highly complex. In the initial stages of fracture network development, the opening of weak planes on the main fracture walls or the limited extension of natural fractures can be disregarded, leading to the formation of primary fractures. As the geometric dimensions of the primary fractures increase, the pressure loss of the fracturing fluid also rises, necessitating an increase in the construction pressure to propagate the fractures further. At this stage, natural fractures extensively open, resulting in the formation of secondary fractures. Extensive research by numerous scholars has revealed that under constant geostress conditions, the geometric configuration of fracture networks exhibits a degree of regularity and similarity.
Based on the fluid flow and continuity equations for porous media (Li et al., 2015; Liu, 2016; Wang et al., 2018; Fend et al., 2019), while taking into account the interactions between the fluid and the fractures as well as among the fractures themselves, it is posited that the fracture network formed by the single-stage SRV fracturing is constituted by a series of orthogonal primary and secondary fractures that combine in a regular pattern. This network configures into an axisymmetric elliptical cylindrical shape along the wellbore, with the major and minor axes of the ellipse being 2a and 2b, respectively. Building on this conceptual framework, a physical model known as the two-dimensional elliptic orthogonal line network model (Cheng et al., 2013; Shi et al., 2014; Ren et al., 2015; Li et al., 2019; Ren et al., 2019; Zheng et al., 2023) has been developed to encapsulate the propagation dynamics of fracture networks with SRV fracturing in unconventional reservoirs. A visual representation of this model is delineated in Figure 1.
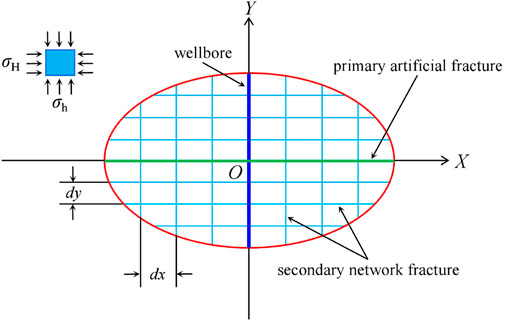
Figure 1. Physical model diagram of the fracture network propagation with single-stage SRV fracturing.
The model is predicated on several key assumptions: 1) both primary and secondary fractures extend through the entire thickness of the reservoir, with their spatial propagation adhering to the characteristics of the elliptic orthogonal line network model; 2) secondary fractures are uniformly distributed in the direction of the horizontal principal stresses (denoted as σH for the maximum and σh for the minimum horizontal principal stresses), with uniform spacing of dx and dy, respectively, and consistent fracture width; 3) the effects of viscoelasticity and wall slip on fluid flow are neglected; 4) proppant is uniformly distributed within the fractures; and 5) the impact of fracturing fluid filtration is disregarded.
According to the cylinder volume formula, the wellbore volume can be expressed as:
where Vw is the wellbore volume; rw is the wellbore radius; L represents the drilling footage.
According to the formula for the volume of a cuboid, the pore volume of the primary artificial fracture is expressed as:
where Vf is the pore volume of the primary artificial fracture; xf is the main fracture half-length (half of the effective fracture length), that is, half of the long axis of the elliptical physical model; H is the reservoir thickness of the study area; wf is the fracture width, which satisfies the England-Green equation under plane strain condition. The calculation formula can be given by:
where υ is the Poisson’s ratio; E is the elastic modulus; hf is the height of the primary fractures; pf indicates net pressure within the fractures; σmin is the minimum horizontal principal stress.
The pore volume of the secondary network fracture is determined by considering the summation of the pore area of the secondary fractures on a given plane. This area can be approximated as an ellipse, where the length of the major axis is equivalent to that of the primary fracture, and the length of the minor axis is proportional to the secondary fractures within the network. According to the volume formula for a cylinder, the pore volume of the secondary network fracture is calculated with the major axis (2a) and minor axis (2b) derived from the ratio (r) of the longitudinal to transverse lengths of the fracture network detected in microseismic monitoring data from a single fracturing stage in the study area. Specifically, the major axis is given by 2a = 2xf = r × 2b, where r is the aspect ratio. The height of the secondary fracture is considered equal to the thickness of the target reservoir (H). Consequently, the pore volume calculation model for the secondary network fracture can be articulated as:
where Vs indicates the pore volume of the secondary network fracture; λ is the width ratio of the primary and secondary fracture, which is obtained from typical well coring data; N represents the number of natural fractures within the length M of the target reservoir segment in the study area, which can be obtained from the imaging logging data of typical blocks.
The imbibition process, in which the fluid within all matrix blocks is replaced, is analogous to the surface imbibition occurring over the entire elliptical cylinder. The concept of imbibition depth is introduced to quantify and assess the efficacy of imbibition replacement within the matrix pores in proximity to the entire fracture network (Wu et al., 2017a; Wu et al., 2017b; Ju et al., 2019; Dai et al., 2020; Tao et al., 2023). Subsequently, the model for calculating the imbibition displacement volume can be formulated as follows:
where Vm is the imbibition displacement volume within matrix pores; d is equivalent imbibition depth; ϕ1 is the matrix porosity in the end of imbibition replacement.
Therefore, the aforementioned Eqs 1–5 collectively constitute the material balance equation for the fracturing injection fluid system, which can be expressed as:
where Q is the total amount of fracturing fluid; m is the number of fracturing stages.
Given that the quantity of oil recovered through imbibition is equivalent to the decrease in oil saturation within the matrix pore volume, the material balance throughout the imbibition replacement process can be characterized as follows:
where Soi and Sor are the initial oil saturation of cores before imbibition and the residual oil saturation of cores in the end of imbibition replacement, respectively; Ro is the core imbibition recovery factor.
In accordance with the principle of material balance (Moussa et al., 2020; Ren et al., 2023; Hossain and Dehghanpour, 2024), a correlation is established between the volume of fracturing fluid injected and the subsequent alterations in formation pressure and underground pore volume at the conclusion of the imbibition replacement phase for the injected fracturing fluid. The material balance equation, which accounts for reservoir elasticity during the flowback period post-fracturing, is formulated as follows:
where Qi is the injection amount of fracturing fluid in the stage i of horizontal well; co is the compression coefficient of crude oil; cc is the compression factor of reservoir volume; p1 is the average formation pressure in the end of imbibition replacement; pi is the initial formation pressure; Vc1 is the pressure sweep volume in the end of imbibition replacement and is expressed as Vc1 = 4xf (L+S)Hϕ1, with S being the spacing of the horizontal well; ϕ1 is the porosity of the rock in the end of imbibition replacement.
Similarly, a correlation is established between the surface liquid production of the oil well and the variations in formation pressure and subsurface pore volume as follows:
where Np and Wp are the cumulative oil and water production during the flowback period, respectively; Bo and Bw are the volume coefficient of crude oil and formation water, respectively; p2 is the average formation pressure in the end of fracturing flowback; pl is the pressure loss of fluid in the wellbore, and the expression is pl = 0.0028h, with h is the wellbore depth; Vc2 is the reservoir pressure ripple volume with completion of frac flowback expressed as Vc2 = 4xf (L+S)Hϕ2, with ϕ2 being the rock porosity in the end of fracturing fluid flowback.
At the culmination of the imbibition replacement process, the rock porosity is described by the following equation of state:
where cp is the compression factor of matrix pores; ϕ0 is the matrix porosity in the original state of the target reservoir.
At the conclusion of the fracturing fluid flowback, the rock porosity conforms to the following equation of state:
Building upon the aforementioned equations, the quantitative characterization model for the effects of SRV fracturing in naturally fractured unconventional hydrocarbon reservoirs, grounded in the principle of material balance, is ultimately established. The model requires the determination of four critical parameters: the effective fracture half-length (xf), the equivalent imbibition depth (d), the average formation pressure (p1) at the termination of the imbibition replacement phase, and the average formation pressure (p2) at the conclusion of the fracturing fluid flowback period.
The material balance Eqs 6–9 and the state Eqs 10, 11 collectively constitute a mathematical model for the quantitative evaluation of SRV fracturing effect. The solution process for this model is meticulously structured and includes several components: a basic data preparation module, a parameter symbol explanation module, an equation set and programming solution module, and an evaluation parameter output module. The program is developed within a Windows 11 environment, utilizing Anaconda3 (64-bit) and the Jupyter Notebook interface for coding and design. The program’s final output is formatted as Excel spreadsheets, enabling simultaneous calculations for multiple wells. The computation yields key evaluation parameters such as xf, d, p1, and p2. Furthermore, the volume of each part can be calculated, including Vw, Vf, Vs, and Vm.
The precision of the program’s solution for the mathematical characterization model is corroborated through a comprehensive analysis of microseismic monitoring data, pattern spacing, and production performance data from the M56-5 SRV-fractured horizontal well in the tight oil reservoirs within the Tuha oilfield, located in the Santanghu Basin, China. Geological characteristics, high-pressure fluid physical property parameters, and rock mechanics parameters for the target reservoir are detailed in Tables 1, 2, while Table 3 presents the fracturing reconstruction parameters specific to the M56-5 well.
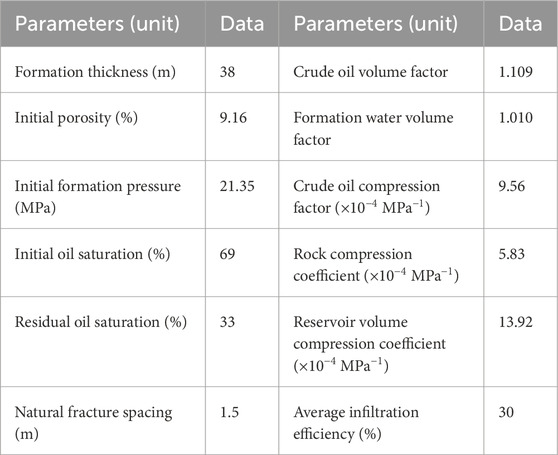
Table 1. The geological characteristic and fluid property parameters of the target reservoir.
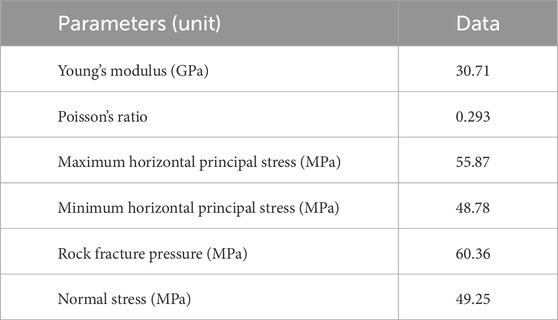
Table 2. The rock mechanics parameters of the target reservoir.
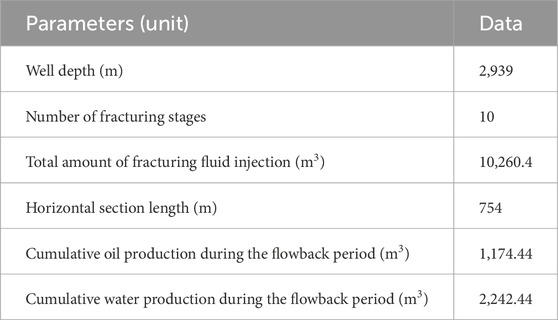
Table 3. The fracturing reconstruction parameters of M56-5 well.
Microseismic monitoring data reveal that the average bandlength and bandwidth of the fracture network formed in each stage of the M56-5 well through SRV fracturing are 346.91 m and 65.64 m, respectively. Nonetheless, in light of the actual production performance, the well spacing has been adjusted to 75 m, and the stage spacing is set at 40 m. The development dynamics indicate that no effective displacement is established between the M56-5 well and the neighboring wells. Consequently, the fracture network system of the M56-5 well remains isolated from adjacent wells, implying that the effective bandlength of fracture network should be less than the well spacing of 75 m.
As per the mathematical model and solution methodology presented in this paper, the average effective bandlength and bandwidth of the fracture network formed during each fracturing stage of the M56-5 well were determined to be 71.36 m and 17.84 m, respectively. Furthermore, this model was applied to calculate the fracture network parameters for 54 other horizontally fractured wells with SRV fracturing within the study area. The outcomes demonstrated a 92.56% concordance rate between the calculated values and actual observations, thereby attesting to the relative reliability of the mathematical characterization model and the solving process established herein.
Utilizing the fracture network parameters (xf, d, p1, and p2) derived from all SRV-fractured horizontal wells, the proportion of injected fluid in each part of the volume (Vw, Vf, Vs, and Vm) can be precisely calculated, with the results graphically depicted in Figure 2.
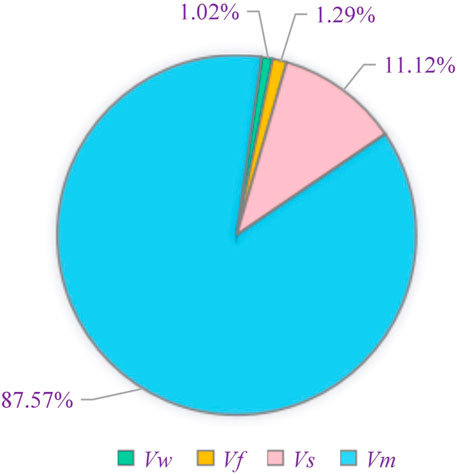
Figure 2. The proportion of the injected fluid in the volume of each part.
The calculated results indicate that the volume of imbibition displacement within the matrix pores constitutes a substantial 87.57%, underscoring the critical role of imbibition displacement in the development of naturally fractured unconventional hydrocarbon reservoirs. This result also provides a rational explanation for the typically low flowback rates observed in these reservoirs. Tight reservoirs subjected to SRV fracturing have developed a complex network of fractures with multiple pore media, significantly reducing the percolation distance that reservoir fluids must travel. During the early stages of development, there has been a qualitative shift in both the rate and the volume of fluid exchange between the matrix and the fractures. Consequently, imbibition displacement has transitioned from a secondary to a primary mechanism within the reservoir’s fluid dynamics. Furthermore, the pore volume of the secondary network fractures represents 11.12% of the total volume, demonstrating that the injection of sand-carrying fracturing fluid to create complex fracture network systems plays a significant role. In contrast, the pore volume of the primary artificial fracture (accounting for only 1.29%) and the wellbore volume (accounting for a mere 1.02%) constitute relatively smaller proportions of the overall volume.
Based on the fracturing construction parameters and the fracture network parameters calculated by the model in this paper, the relationships between imbibition volume and injection volume of single stage, equivalent imbibition depth and injection volume of single stage, average formation pressure and total injection volume during fracturing processes, and pressure drop and well liquid production during fracturing fluid flowback period were separately explored by mathematical statistical method. The statistical curves and its fitting functions between SRV fracturing parameters can be obtained, as shown in Figure 3.
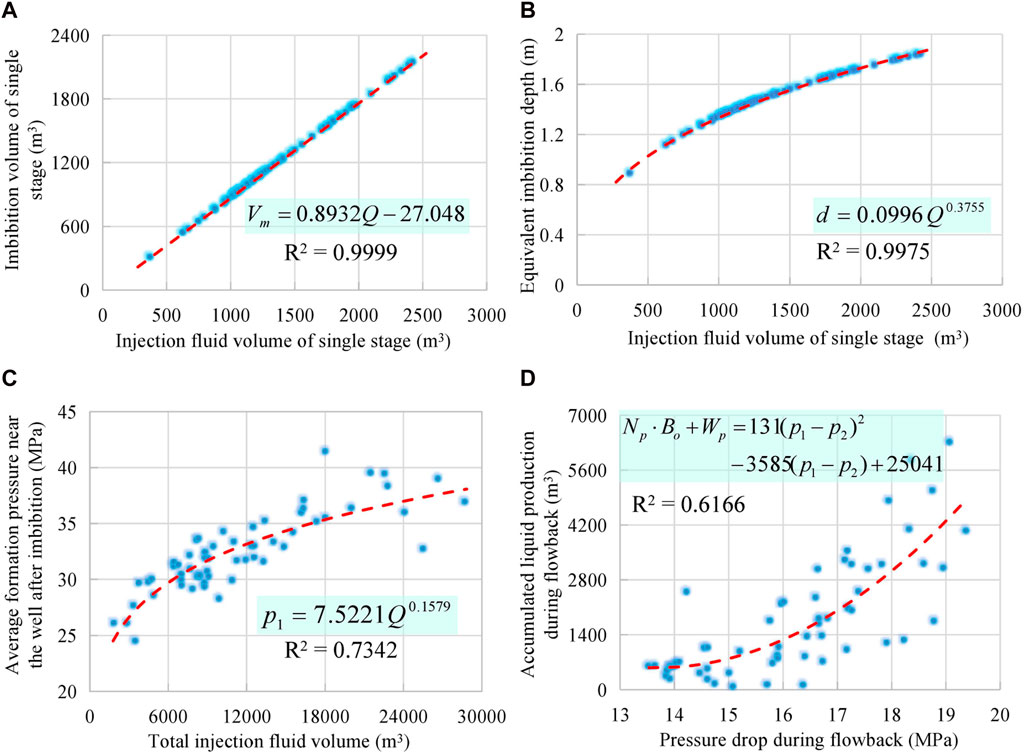
Figure 3. Statistical curves and its fitting functions between SRV fracturing parameters. (A) Injection and imbibition volume (B) Injection volume and imbibition depth (C) Injection volume and formation pressure (D) Pressure drop and well production.
Analysis of the fitting equations derived from the statistical curves reveals a definite correlation between the parameters of fracturing operations and the resulting fracture network. There is a strong linear correlation between the imbibition volume and the injection volume during a single fracturing stage. Similarly, a pronounced exponential relationship is observed between the equivalent imbibition depth and the injection volume of a single stage. Additionally, the average formation pressure exhibits an exponential relationship with the total injection volume throughout the fracturing process. During the fracturing fluid flowback period, the pressure drop is characterized by a quadratic functional relationship with the liquid production of oil well. These fitting equations offer a convenient and preliminary theoretical foundation for field engineers to design fracturing operations effectively.
To quantitatively analyze the impact of engineering parameters on the SRV fracturing effect, simulations were designed under the condition of a constant horizontal section length. Various total volumes of fracturing fluid injection (3,681 m3, 7,681 m3, 11,681 m3, 15,681 m3 and 19,681 m3) and different numbers of fracturing stages (6 stages, 7 stages, 8 stages, 9 stages and 10 stages) were considered. Consequently, the effective band length, pore volume and imbibition displacement volume within a single-stage SRV, and equivalent imbibition depth were calculated for each scenario. The influence chart of engineering parameters on SRV fracturing effect is shown in Figure 4.
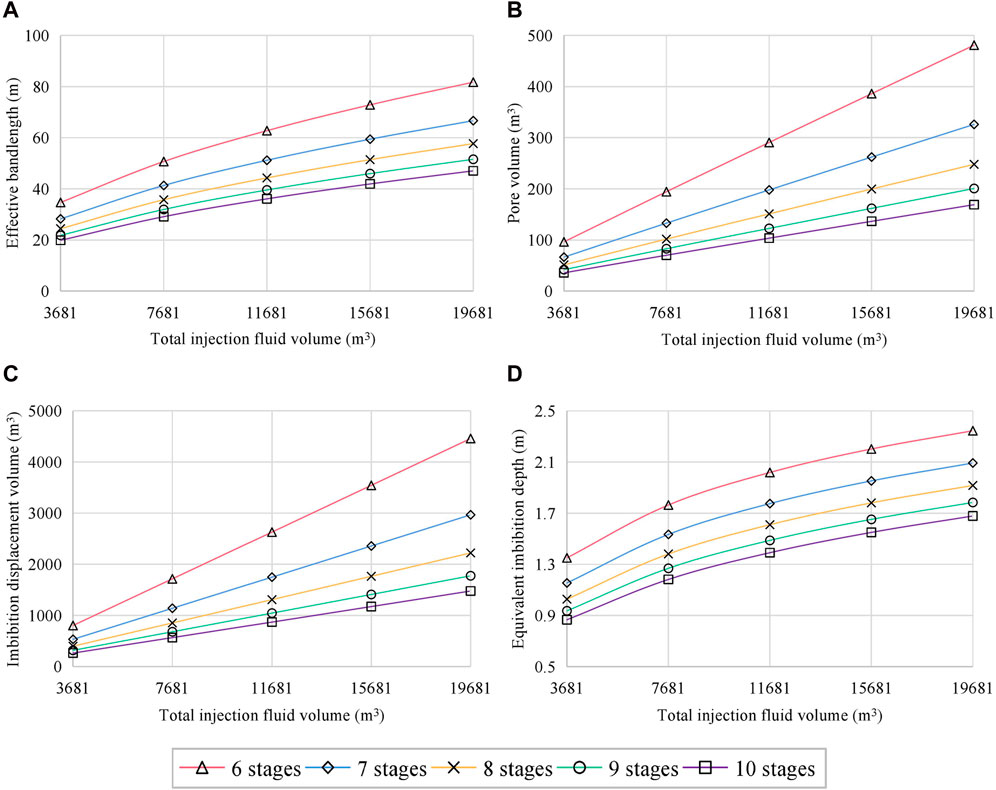
Figure 4. Influence chart of engineering parameters on SRV fracturing effect. (A) Effective bandlength (B) Pore volume within a single-stage SRV (C) Imbibition displacement volume within a single-stage SRV (D) Equivalent imbibition depth.
The influence curve of engineering parameters on the effectiveness of SRV fracturing clearly demonstrates that within the specified range of design parameters, the total volume of injected fracturing fluid exerts a substantial impact on both the pore volume and the imbibition displacement volume of the fracture network. This is attributable to the minimal interference between individual fracturing stages. Nonetheless, as the total volume of injected fracturing fluid increases, its influence on the effective bandlength and equivalent imbibition depth diminishes progressively. This suggests that while a certain amount of fluid is beneficial, an excessive volume may not yield proportional gains in fracture network development. The impact of the total injected fluid volume on the degree of fracture network stimulation is more pronounced when there are fewer fracturing stages. In such cases, the stimulation effect is stronger due to the absence of significant interference. Conversely, when there is a higher number of fracturing stages, the inter-stage interference comes into play, leading to a reduction in the overall stimulation effect of the fracture network. This complex interaction underscores the importance of optimizing the number of fracturing stages and the total volume of injected fluid to achieve the most effective SRV fracturing outcomes.
Based on the SRV fracturing construction parameters for each horizontal well, the bandlength and bandwidth of the fracture network for each fracturing stage are quantitatively computed. Utilizing the well pattern distribution and the three-dimensional spatial distribution of the fracture network parameters, a diagram depicting the well pattern distribution and characterization of the fracture network is established for various development stages of representative blocks within the tight oil reservoirs of the Tuha oilfield, as shown in Figure 5.
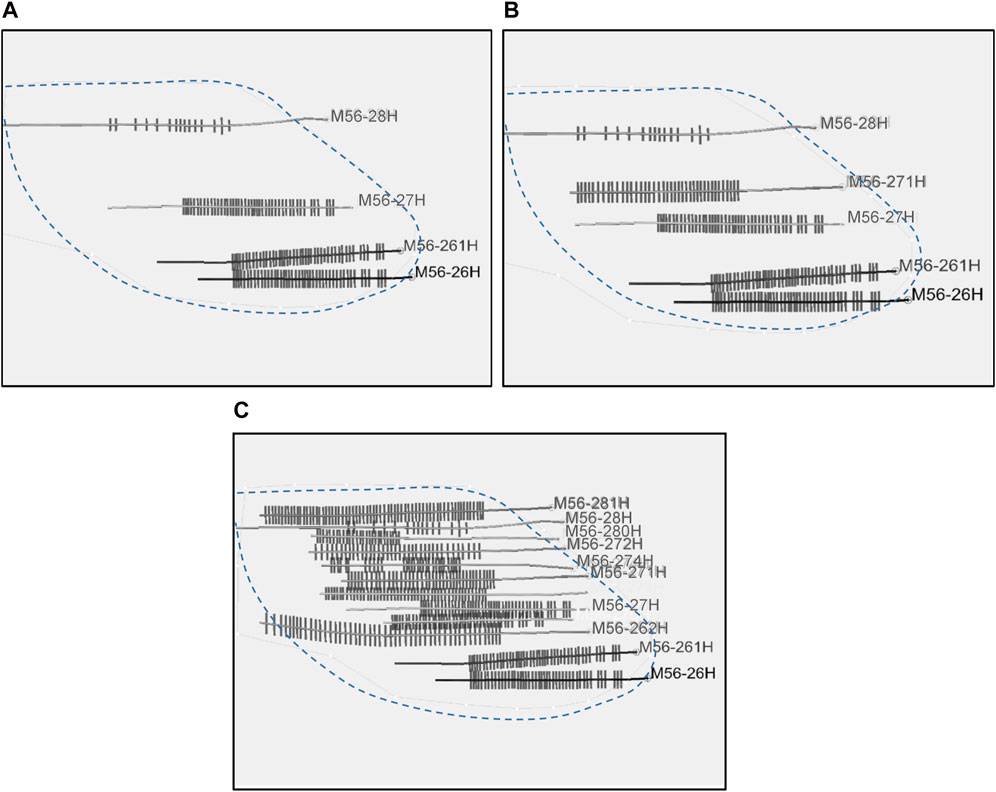
Figure 5. Diagram of well pattern distribution and fracture network characterization at different development stages of typical blocks. (A) Initial well pattern (B) Primary infilling adjustm (C) Secondary infilling adjustment.
The reserves production degree is delineated as the proportion of the stimulated area of all horizontal wells relative to the oil-bearing area of the block. The quantitative evaluation of the SRV fracturing effect is characterized as follows. 1) In the early development phase with an initial well pattern (well spacing of 300–400 m), the SRV for each horizontal well was largely isolated due to the expansive well spacing. This resulted in a inadequate overlapping relationship of fracture networks between the horizontal wells and a low matching degree between the well pattern and the fracture network. Consequently, the reserves production degree under this well pattern condition was a mere 21.31%. 2) Advancing to the primary infill well pattern (well spacing of 150–200 m), the SRV of each well remained relatively isolated, and full match between the well pattern and the fracture network was unattainable. As such, the reserves production degree under this well pattern condition only reached 32.25%. 3) Under the current secondary infill well pattern (well spacing of 75–100 m), the well spacing is sufficiently narrow to preclude any isolated SRV between horizontal wells. This has led to a more effective overlap of fracture networks and a high matching degree of congruence between the well pattern and the fracture network. As a result, the reserves production degree can soar to 83.65%. The actual production performance data from this block indicate that 80% of horizontal wells in the secondary infill well pattern have been positively affected by water flooding from neighboring wells, leading to an increase in production. This has achieved the intended objective of establishing an overlapping relationship between the fracture networks of horizontal wells. In general, the block has experienced a paradigm shift from well-controlled reserves to fracture-controlled reserves following two rounds of well pattern infilling adjustments. With continued reduction in well spacing, alongside the implementation of enhanced oil recovery techniques such as multi-periodic waterflooding huff-n-puff and energized fracturing, it is feasible to transition from single-well imbibition to a synergistic mechanism of well group imbibition and displacement. This transition stands to significantly enhance the overall recovery and productivity of the reservoir.
This paper introduces a methodology for the quantitative characterization of the effects of Stimulated Reservoir Volume (SRV) fracturing in naturally fractured unconventional hydrocarbon reservoirs, employing the principle of material balance. The research findings underscore the critical role of imbibition displacement in the development of these reservoirs and provide a credible explanation for the commonly observed low flowback rates in the field. A significant correlation exists between the parameters of the fracturing operation and the resulting fracture network. The total volume of injected fluid is decisive in determining the extent of stimulation of the fracture network induced by SRV fracturing. However, with an increasing number of fracturing stages, the influence of this volume on the degree of stimulation is progressively reduced. The methodology presented herein facilitates a quantitative evaluation of the reserves production degree within the study area, thereby enhancing the efficiency of fracturing operations. Moreover, the results yield a practical reference framework for engineers and technicians to accurately assess the SRV fracturing effects in typical blocks of naturally fractured unconventional hydrocarbon reservoirs. This approach not only refines the understanding of SRV fracturing effects but also informs the design and optimization of future fracturing operations in similar reservoir settings.
The raw data supporting the conclusion of this article will be made available by the authors, without undue reservation.
LR: Conceptualization, Formal Analysis, Methodology, Writing–original draft. MD: Conceptualization, Methodology, Resources, Writing–review and editing. XD: Formal Analysis, Resources, Writing–review and editing. BC: Data curation, Investigation, Writing–review and editing. LZ: Data curation, Investigation, Writing–review and editing. JS: Methodology, Validation, Writing–review and editing. CJ: Writing–review and editing. WZ: Writing–review and editing. DZ: Supervision, Writing–review and editing. HL: Data curation, Validation, Writing–review and editing.
The author(s) declare that financial support was received for the research, authorship, and/or publication of this article. This research was supported by the National Natural Science Foundation of China (Nos 52304036; 51934005; U23B2089) and Natural Science Basic Research Plan in Shaanxi Province of China (Nos 2023-JC-YB-344; 2023-JC-YB-433).
Authors MD, BC, and LZ was employed by PetroChina Changqing Oilfield Company. Author XD was employed by PetroChina Xinjiang Oilfield Company. Author HL was employed by Shengli Petroleum Bureau Co., Ltd. Sinopec.
The remaining authors declare that the research was conducted in the absence of any commercial or financial relationships that could be construed as a potential conflict of interest.
All claims expressed in this article are solely those of the authors and do not necessarily represent those of their affiliated organizations, or those of the publisher, the editors and the reviewers. Any product that may be evaluated in this article, or claim that may be made by its manufacturer, is not guaranteed or endorsed by the publisher.
Cheng, Y. F., Li, Y. Z., Shi, X., Wu, B. L., Wang, X., and Deng, W. B. (2013). Analysis and application of fracture network models of volume fracturing in shale gas reservoirs. Nat. Gas. Ind. 33 (9), 53–59. doi:10.3787/j.issn.1000-0976.2013.09.009
Dai, C. L., Li, Y., Xu, X. P., Zhao, M. W., Yuan, B., Xu, K., et al. (2020). Oil-water two-phase migration in imbibition process of gel breaking fluid of clean fracturing fluid. Oilfield Chem. 37 (4), 609–615. doi:10.19346/j.cnki.1000-4092.2020.04.008
Eyinla, D., Henderson, S. K., Emadi, H., Thiyagarajan, S. R., and Arora, A. (2023). Optimization of hydraulic fracture monitoring approach: a perspective on integrated fiber optics and sonic tools. Geoenergy Sci. Eng. 231, 212441. doi:10.1016/j.geoen.2023.212441
Fend, F. P., Huang, R., Lei, Y., Guo, B., Hu, C. Y., and Wang, H. Z. (2019). Evaluation of engineering effectiveness of volume fracturing based on energy conservation principles and its application. J. China Univ. Petroleum Ed. Nat. Sci. 43 (1), 81–89. doi:10.3969/j.issn.1673-5005.2019.01.010
Guo, T. K., Wang, Y. P., Chen, M., Qu, Z. Q., Tang, S. J., and Wen, D. W. (2023). Multi-stage and multi-well fracturing and induced stress evaluation: an experiment study. Geoenergy Sci. Eng. 230, 212271. doi:10.1016/j.geoen.2023.212271
Hossain, S., and Dehghanpour, H. (2024). A theory to model pseudo steady state water production and predict long-term water recovery from fractured reservoirs. Energy 288, 129586. doi:10.1016/j.energy.2023.129586
Ju, M. S., Wang, X. Y., Yu, W. S., Yang, S. L., Ye, W. Z., and Zhang, T. Q. (2019). Spontaneous imbibition of tight oil reservoirs based on NMR technology. Xinjiang Pet. Geol. 40 (3), 334–339. doi:10.7657/XJPG20190312
Li, Q., Wang, Y. L., and Owusu, A. B. (2019a). A modified Ester-branched thickener for rheology and wettability during CO2 fracturing for improved fracturing property. Environ. Sci. Pollut. Res. 26, 20787–20797. doi:10.1007/s11356-019-05386-6
Li, Q. C., Liu, J., Wang, S. M., Guo, Y., Han, X. Y., Li, Q., et al. (2024). Numerical insights into factors affecting collapse behavior of horizontal wellbore in clayey silt hydrate-bearing sediments and the accompanying control strategy. Ocean. Eng. 297, 117029. doi:10.1016/j.oceaneng.2024.117029
Li, X. W., Liu, S., Chen, Q., Su, Y. L., and Sheng, G. L. (2019b). An evaluation of the stimulation effect of horizontal well volumetric fracturing in tight reservoirs with complex fracture networks. Pet. Drill. Tech. 47 (6), 73–82. doi:10.11911/syztjs.2019126
Li, X. W., Zhang, K. S., Ma, B., Tian, S. B., and Zhang, J. L. (2015). A new method using material balance equations to interpret the effective stimulation volume of fracture network fracturing in tight reservoirs. Sci. Technol. Eng. 15 (36), 56–62.
Liu, J. C., Liu, J. J., Wang, X. Y., and Liu, C. (2019). Micro-seismic technique evaluation of the effect of volumetric fracturing in Zhongmou area. Contributions Geol. Mineral Resour. Res. 34 (1), 78–83. doi:10.6053/j.issn.1001-1412.2019.01.012
Liu, X. L. (2016). Well test analysis and evaluation after shale-gas volume fracturing stimulation. Nat. Gas. Ind. 36 (8), 66–72.
Luo, Y., Kang, B., Wang, H. H., Guo, J. C., Jiang, L. P., Cheng, Y., et al. (2024). Stacking ensemble learning based inversion for three-dimensional distribution region of hydraulic fractures in shale. Geoenergy Sci. Eng. 236, 212712. doi:10.1016/j.geoen.2024.212712
Moussa, T., Dehghanpour, H., Fu, Y. K., and Ezulike, O. (2020). The use of flowback data for estimating dynamic fracture volume and its correlation with completion-design parameters: eagle Ford cases. J. Petroleum Sci. Eng. 195, 107584. doi:10.1016/j.petrol.2020.107584
Niu, X. B., Feng, S. B., You, Y., Liang, X. W., Xin, H. G., Dan, W. D., et al. (2019). Fracture extension and distribution pattern of volume fracturing in tight reservoir: an analysis based on actual coring data after fracturing. Oil Gas Geol. 40 (3), 669–677. doi:10.11743/ogg20190322
Ren, L., Su, Y. L., Hao, Y. M., Zhang, Q., Meng, F. K., and Sheng, G. L. (2015). Dynamic analysis of SRV-fractured horizontal wells in tight oil reservoirs based on stimulated patterns. Acta Pet. Sin. 36 (10), 1272–1279. doi:10.7623/syxb201510010
Ren, L., Su, Y. L., Zhan, S. Y., and Meng, F. K. (2019). Progress of research on productivity prediction methods for stimulated reservoir volume (SRV)-Fractured horizontal wells in unconventional hydrocarbon reservoirs. Arabian J. Geosciences 12 (6), 1–15. doi:10.1007/s12517-019-4376-2
Ren, L., Wang, Z. H., Zhao, J. Z., Lin, R., Wu, J. F., Song, Y., et al. (2023). Shale gas effective fracture network volume prediction and analysis based on flow back data: a case study of southern Sichuan Basin shale. Geoenergy Sci. Eng. 228, 211963. doi:10.1016/j.geoen.2023.211963
Shi, X., Cheng, Y. F., Jiang, S., Li, Y. Z., Sun, Y. W., and Wang, X. (2014). Simulation of complex fracture network propagation and its application for shale gas reservoir. Acta Pet. Sin. 35 (6), 1130–1137. doi:10.7623/syxb201406010
Tao, L. Y., Sheng, J. C., Wang, H. M., Wang, J. G., Zhen, H. F., Huang, T. R., et al. (2023). Synergistic impacts of fracture–matrix system on recovery rate during spontaneous imbibition in tight sandstones. Geoenergy Sci. Eng. 234, 212594. doi:10.1016/j.geoen.2023.212594
Wang, F., Liu, W., Deng, J. G., Xu, K. K., Xing, C. W., and Yan, K. (2024). Hydraulic fracture propagation research in layered rocks based on 3D FEM modeling and laboratory experiments. Geoenergy Sci. Eng. 234, 212670. doi:10.1016/j.geoen.2024.212670
Wang, J. C., Zhang, H. J., Zhao, L. P., Zha, H. S., Cheng, T. T., Shi, X. H., et al. (2023). Evaluation of the coalbed methane hydraulic fracturing effect based on microseismic event locations and tomography results for surface microseismic monitoring. Geophys. Prospect. Petroleum 62 (1), 31–42+55. doi:10.3969/j.issn.1000-1441.2023.01.002
Wang, Y. F., Zhai, G. Y., Hu, Z. F., Li, J., Zhang, Y. X., Kang, H. X., et al. (2022). Reservoir characteristics of the sinian doushantuo formation and the effectevaluation of complex fracturing in yichang, hubei Province. Acta Geol. Sin. 96 (4), 1447–1459. doi:10.19762/j.cnki.dizhixuebao.2021214
Wang, Z. Y., Ding, Y. H., Yang, Z. M., He, Y., Wang, X. Y., and Ma, Z. Z. (2018). A material balance zoning productivity prediction model of fractured horizontal well in tight oil reservoirs. Bull. Sci. Technol. 34 (12), 44–48. doi:10.13774/j.cnki.kjtb.2018.12.007
Wu, R. T., Yang, S. L., Wang, M. B., Lv, D. P., and Kou, G. (2017a). Experimental study on static imbibition of tight sandstone. J. Liaoning Univ. Petroleum Chem. Technol. 37 (3), 24–29. doi:10.3969/j.issn.1672-6952.2017.03.006
Wu, R. T., Yang, S. L., Xie, J. Y., Wang, M. B., and Yan, J. W. (2017b). Experiment and mechanism of spontaneous imbibition of matrix core in tight oil-gas reservoirs. Petroleum Geol. Recovery Effic. 24 (3), 98–104. doi:10.13673/j.cnki.cn37-1359/te.2017.03.015
Zhang, A. S., Yang, Z. M., Li, X. S., Xia, D. B., Zhang, Y. P., Luo, Y. T., et al. (2020a). An evaluation method of volume fracturing effects for vertical wells in low permeability reservoirs. Petroleum Explor. Dev. 47 (2), 441–448. doi:10.1016/s1876-3804(20)60061-1
Zhang, Z. L., Shen, F., Xu, D. Z., and Li, Q. Y. (2020b). A new inversion method of stimulated reservoir volume fracturing region based on pump-stop data and its application. Unconv. Oil Gas 7 (6), 81–89.
Keywords: SRV fracturing, material balance method, imbibition depth, complex fracture network, quantitative evaluation
Citation: Ren L, Dou M, Dong X, Chen B, Zhang L, Sun J, Jing C, Zhang W, Zhou D and Li H (2024) Quantitative characterization of stimulated reservoir volume (SRV) fracturing effects in naturally fractured unconventional hydrocarbon reservoirs. Front. Earth Sci. 12:1419631. doi: 10.3389/feart.2024.1419631
Received: 18 April 2024; Accepted: 28 May 2024;
Published: 13 June 2024.
Edited by:
Qingchao Li, Henan Polytechnic University, ChinaReviewed by:
Lijun Liu, Chengdu University of Technology, ChinaCopyright © 2024 Ren, Dou, Dong, Chen, Zhang, Sun, Jing, Zhang, Zhou and Li. This is an open-access article distributed under the terms of the Creative Commons Attribution License (CC BY). The use, distribution or reproduction in other forums is permitted, provided the original author(s) and the copyright owner(s) are credited and that the original publication in this journal is cited, in accordance with accepted academic practice. No use, distribution or reproduction is permitted which does not comply with these terms.
*Correspondence: Long Ren, cmVubG9uZ0B4c3l1LmVkdS5jbg==
Disclaimer: All claims expressed in this article are solely those of the authors and do not necessarily represent those of their affiliated organizations, or those of the publisher, the editors and the reviewers. Any product that may be evaluated in this article or claim that may be made by its manufacturer is not guaranteed or endorsed by the publisher.
Research integrity at Frontiers
Learn more about the work of our research integrity team to safeguard the quality of each article we publish.