 Huifeng Liu1,2*
 Xiaohan Wang
 Zhangxin Chen
 Yan Peng
- 1CNPC R&D (DIFC) Company Limited, Dubai, United Arab Emirates
- 2Department of Chemical and Petroleum Engineering, University of Calgary, Calgary, AB, Canada
- 3College of Petroleum Engineering, China University of Petroleum-Beijing, Beijing, China
As a crucial exploration technique for unconventional reservoirs, hydraulic fracturing enables the formation of complex fracture networks, thereby facilitating the flow of oil and gas. The closure of natural fractures decreases stimulation performance. Microparticle proppants are used to fill natural fractures and effectively increase the stimulation area. The 100-mesh proppant conventionally used in field operations may be insufficiently small to effectively access natural fractures. In order to effectively overcome natural fractures closure, microparticle proppants (i.e., proppants with a diameter of 75 μm (200-mesh) or less) are required. The particle size threshold test of microparticle proppants placement is conducted to determine the size threshold of proppants flowing into natural fractures. The microparticle proppants placement experiment in multi-branch fractures is conducted to investigate the volume difference of proppants in different fractures. Numerical simulations are performed to model proppant transport within fractures of actual dimensions to facilitating the optimization of stimulation parameters. The main conclusions are as follows: (1) Effective inflow of microparticle proppants requires a size threshold of proppants. For the 200-mesh proppants, the size should be less than half of natural fractures width when microparticle proppants effectively flow into natural fractures. (2) Sand concentration affects the size threshold of microparticle proppants. The size threshold should appropriately increase to ensure the inflow of proppant. (3) Difference of multi-branch fracture width has a significant effect on volume of microparticle proppants inside fractures. When the width ratio of multi-branch fractures exceeds 2, this effect becomes obvious. (4) Particle size has an effect on proppant placement. 200-mesh proppants can obtain uniform distribution of proppants among natural fractures. 140-mesh proppants can obtain maximum proppant volume among natural fractures. Sand concentration significantly affects proppant placement performance. The optimal sand concentration is 60kg/m3. The pumping rate for a single cluster fracture should not be excessively low. The pumping rate should be larger than 0.5m3/min and the optimal pumping rate 2m3/min. In this paper, the particle size and concentration of particulate proppant are optimized and the geometric characteristics of fractures are considered. These conclusions provide important practical guidance and scientific basis for the optimization and application of hydraulic fracturing technology.
1 Introduction
As conventional reservoirs continue to deplete, unconventional reservoirs have garnered significant attention as a primary source of environmentally sustainable energy to address the increasing global energy demand (Holditch, 2006; Zou et al., 2012; Al-Fatlawi et al., 2017a; Al-Fatlawi et al., 2017b). This interest has been further amplified following the commercialization of advanced hydraulic fracturing technology (Awan et al., 2020a). Unconventional reservoirs are typically characterized by low porosity, low permeability, and low natural productivity. Unconventional reservoirs often develop natural fractures, which are typically characterized by narrow pore sizes and posing significant challenges for the penetration of proppants (Gale et al., 2014). Hydraulic fracturing is widely used in such reservoirs to form complex fracture networks, provide flow channels for oil and gas, and improve their productivity (Morteza et al., 2018; Bagher Asadi et al., 2019; Wei et al., 2019). Natural fractures and natural fractures in complex networks show different lengths and widths. These fractures may be less than or equal to millimeters in length (e.g., 10–250 microns) and less than 0.1 mm in width (e.g., 1–10 microns) (Anders et al., 2014; Nagel and Sanchez-Nagel, 2015; Wu et al., 2015; Zhou et al., 2016). Ultra-low permeability tight reservoirs are economically viable if proppant can reach these natural fractures and prevent them from closing (Apaydin et al., 2012; Cipolla et al., 2009). Therefore, Microparticle proppants (referred to as MPs) are introduced to increase the stimulation area (Dahl et al., 2015a; Kim et al., 2018; Dharmendra et al., 2019). Several studies have successfully applied MPs to the field (Nguyen et al., 2013; Bose et al., 2015; Dahl et al., 2015a; Dahl et al., 2015b; Calvin et al., 2017). Bedrikovetsky et al. and Khanna et al. proposed a staged proppant injection method (small proppants are injected first, and then large proppants are injected) (Bedrikovetsky et al., 2012; Khanna et al., 2013). Small particles infiltrate deep reservoirs, while larger particles are trapped near the wellbore. This method has been proven to be an effective technique to enhance production both in the lab and in the field (Keshavarz et al., 2015a; Keshavarz et al., 2015b; Keshavarz et al., 2016). At present, there are relatively few studies on proppant migration in fracture networks (Mayerhofer et al., 2008; Meyer et al., 2010). The transport, placement, transfer and prop mechanism of proppant in multistage branch fractures of fracture network is still unclear. The lack of theoretical guidance on pumping parameters such as pumping rate, proppant size and sand concentration in the field leads to difficulties in sand addition, insufficient natural fractures support, and rapid decline in production after compression (Li et al., 2013; Wu and Olson, 2016). The investigation of proppant placement has emerged as a critical issue within the relevant field.
Experimental model is the basis of proppant placement experimental study. The development of the proppant placement experimental model is divided into two stages. From 1959 to 2009, the single fracture visual physics experiment equipment is developed. After 2009, according to the development of research field and manufacturing technology, a larger, more complex, more accurate and more versatile visual physical experimental device for proppant placement will be developed (Yu et al., 2015; Wang, 2015). Kern et al. developed the world’s first laboratory model in 1959, using two plexiglass panels to simulate the placement of proppant in a single vertical fracture. The fracture size of this model is 5,588×1905×6.35 mm3, which has the function of fracturing fluid recovery (Kern et al., 1959). With the initiation of visualization of proppant placement, Babcock et al. developed a visual single-fracture model to simulate a vertical fracture in 1967 (Babcock et al., 1967). The model size is 2,438×304.8 mm2 and the fracture width is 4.76–25.4 mm. In 1970–1980, Schools et al. and Sievert et al. established a single fracture model. This model studied the migration path of a single particle and the placement of multiple particles by adding a high-speed camera system to the model (Schols and Visser, 1974; Sievert et al., 1981). In the 21st century, interdisciplinary research has driven the development of proppant placement models. Shah et al. built a high-pressure parallel plate flow cell with an integrated fiber optic vision system and LED for simulating downhole fractures (Shah et al., 2001). Many researchers have studied the plate model, however, the current research on this model mainly focuses on small-scale and simple single fractures (Brannon et al., 2006; Shokir and Al-Quraishi, 2007; Woodworth and Miskimins, 2007; Dayan et al., 2009; Zhai, 2012). In addition, Li developed a large-scale visualization proppant placement device in 2016 for complex fracture networks considering perforation parameters based on geometric similarity and Reynolds number similarity criteria, which can change the number and angle of fractures (Li, 2016). In 2020, Liu et al. designed a physical simulation experiment to study the effect of particles on sealing fractures to improve wellbore stability (Liu et al., 2020). In 2023, Zhang et al. studied the effects of proppant pumping strategies on proppant migration in rough rock fractures by using a validated CFD-DEM model (Zhang et al., 2023). Previous studies of proppant placement in complex fracture networks have the following shortcomings: unclear particle size thresholds for placement of MPs, shunt transport of proppant from the main fracture to the multi-branch fracture, and distribution of different particle sizes of proppant. The choice of proppant depends on the mechanical properties of the formation rock and the proppant itself (Awan et al., 2020b).
The current utilization of 100-mesh proppants may hinder their effective placement into natural fractures created during hydraulic fracturing due to their potentially excessive size. Consequently, to achieve optimal natural fracture propping, the employment of micro-proppants possessing high fluidity, specifically those with diameters of 150 μm (100 mesh) or less, are necessary. Therefore, based on a visual proppant placement model, this experiment is conducted to investigate the proppant diversion transport distribution in a complex fracture network. Two key experiments are conducted: Particle size threshold test of MPs placement and MPs placement experiment in multi-branch fractures. Combined with the numerical simulation method, the effects of fracture interval and angle on proppant placement are analyzed, and stimulation parameters like proppant particle size, sand concentration and pumping rate are optimized.
2 Particle size threshold test of MPs placement
2.1 Materials and methods
As the law of placement of MPs has not yet been fully understood, the application experience of proppant with particle size less than 100 is insufficient, and the particle size threshold of placement of MPs is unknown, this experiment employs a visual setup utilizing copper sheets and a proppant injection device, as shown in Figure 1. Stainless steel lines are used to connect the simplex pump, proppant injection device, wellbore and filtration unit. The test process is as follows: the components are connected, the proppant injection unit is pre-placed with a fixed size of sand carrier fluid, the time and pressure changes are recorded by controlling the control terminal output rate, the injection pressure is provided by a simplex pump, the proppant placement is recorded by a camera, the proppant placement is placed in a simulated natural fracture, and the fluid is entered into the filtration unit. The experimental approach involves investigating variable sand concentrations, variable fracture widths (with a minimum of 0.05 mm), and step injection methods.
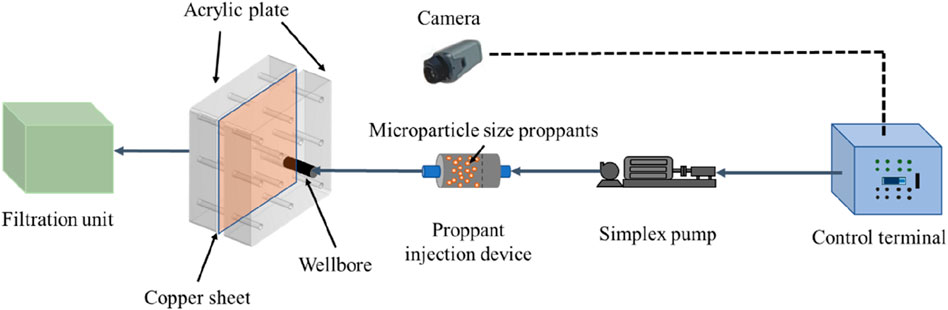
Figure 1. Schematic diagram of MPs placement experimental method.
The acrylic plate processed in the experiment is shown in Figure 2, which is used to simulate the formation. It cannot be filled with MPs, and the size is 200 mm*200 mm*50 mm. The variable sand concentration is achieved by matching the capacity of the proppant injection device in this experiment, weighing 300 mL water and 6 g guar gum to produce sand carrying fluid with 2% guar gum concentration, then weighing a certain Gram of MPs, mixing and stirring on a high-speed fluid mixer for 20 min. Example: If the sand concentration is 100kg/m3, weigh 30 g MPs and add it to stir.
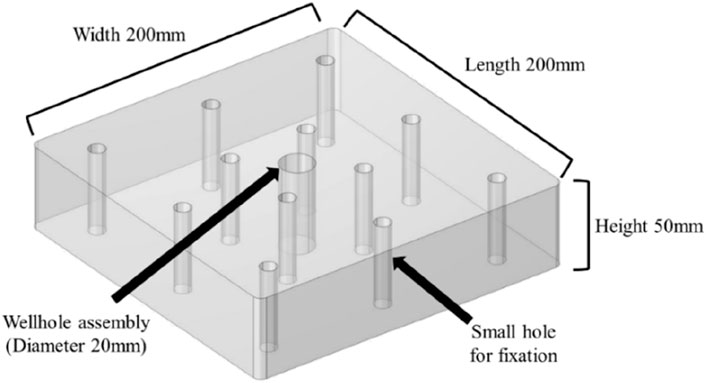
Figure 2. Acrylic sheet size diagram.
The implementation method of variable fracture width is as follows: as shown in Figure 3, two acrylic plates are used to clamp copper sheets of different thickness up and down to construct natural fractures. The size of experimentally processed copper sheets is 0.05 mm–0.6mm, which is used to simulate the natural fracture space. Multiple nuts are used to apply prestress to maintain the stability of the fracture width during the experiment. The simulated wellbore processed in the experiment has a radius of 10 mm and a length of 100mm, which can be assembled with two acrylic plates to simulate the passage from the wellbore to the formation fracture.
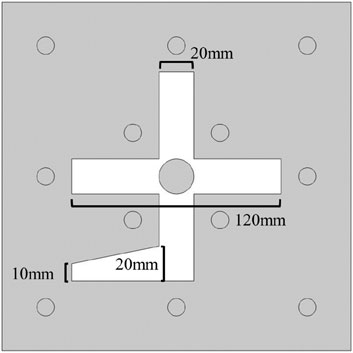
Figure 3. Simulated natural fracture space size (white is natural fracture space).
2.2 Experimental scheme
At room temperature, the injection flow rate of 1m3/min is used to carry out the experiment, and the injection liquid for the experiment is 2% guar gum concentration. Multiple placement experiments are carried out to summarize the threshold selection criteria. The fracture width is controlled by the thickness of the copper sheet. By changing the thickness of the copper sheet to control the width of the fracture, the combination of copper sheets with varying thickness from 0.05mm to 0.6 mm is selected. Sand concentration is 60kg/m3, 100kg/m3, 180kg/m3 three kinds. 22 groups of MPs placement experiments are completed to study the effects of fracture width and sand concentration on proppant placement. The experimental scheme is shown in Table 1.
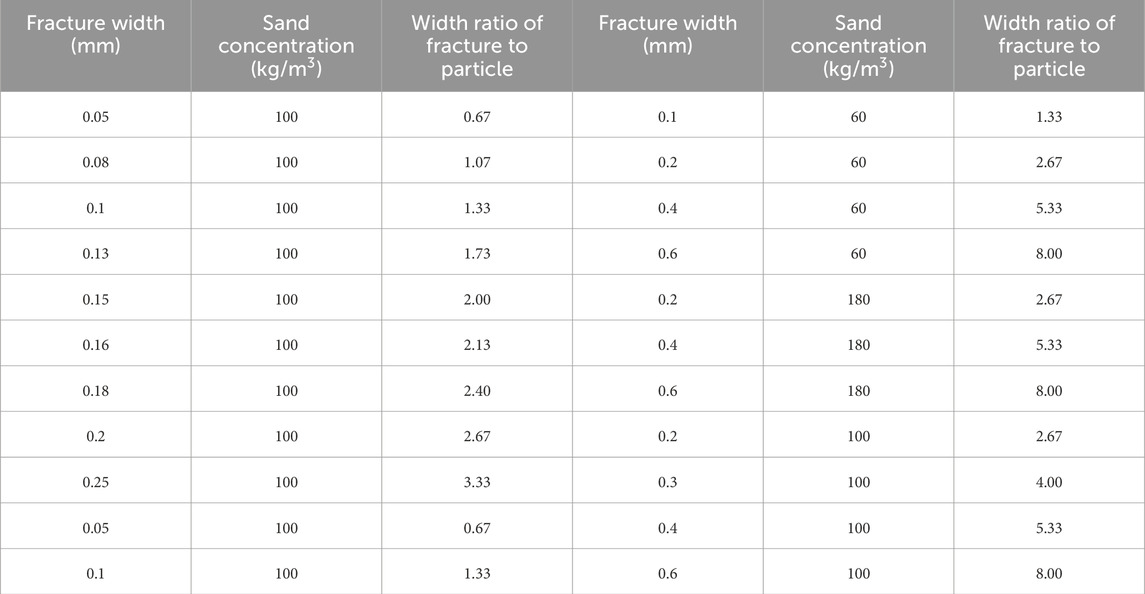
Table 1. Experimental scheme.
2.3 Experimental result
In this experiment, the MPs entering and placing natural fracture space under different sand concentrations and different width ratios is observed. In the experiment, MPs mainly existed around the wellbore (Figure 4A) and in natural fracture spaces (Figure 4B).
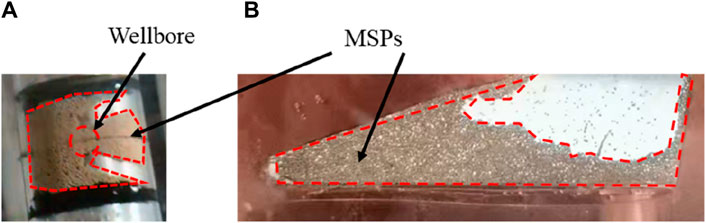
Figure 4. Proppant placement (A) Stuck in the wellbore (B) Flow into a natural fracture.
The experimental results are shown in Table 2. Among the 22 groups of experiments, eight groups of experimental MPs failed to enter the fracture, but are blocked around the wellbore. Observation and analysis suggested that the failure to enter the fracture is caused by too small width ratio or too large sand concentration. According to the results in Table 2, it can be found that part of MPs under the width ratio setting failed to enter the fracture to form effective placement, and it is considered that when MPs can enter the natural fracture, the width ratio is an effective value. For example, the group of experiments with the fracture width of 0.6 mm and sand concentration of 100kg/m3. The width ratio is 8.00, which indicates that proppant can enter the fracture and is considered to be an effective width ratio.
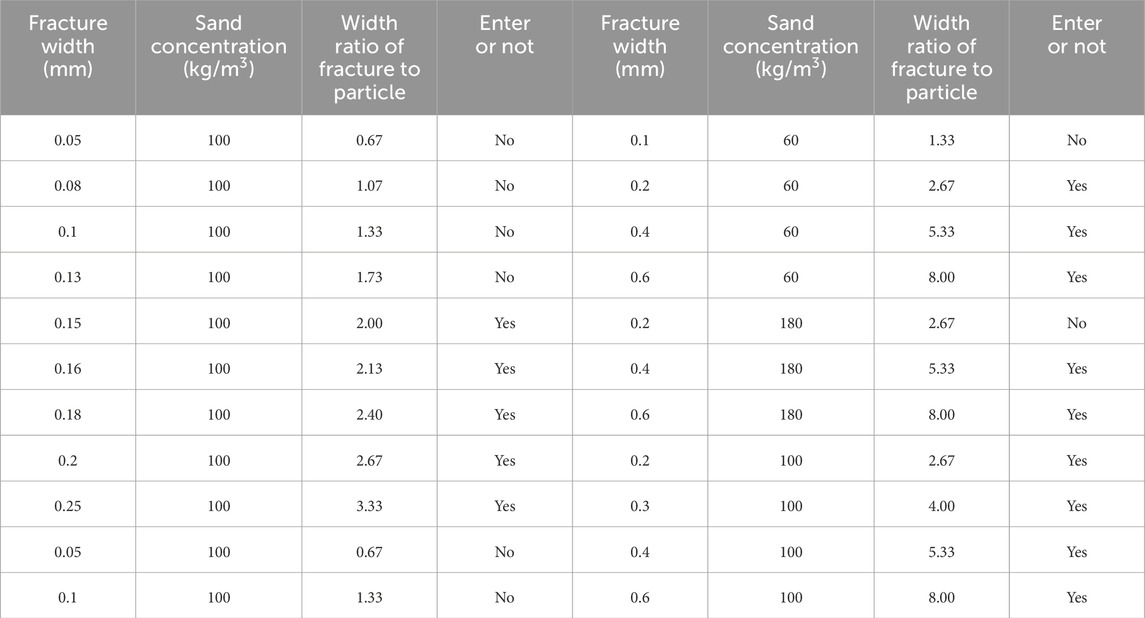
Table 2. Statistical table of experimental results.
According to Table 2, the effective width ratio of all MPs that can enter the fracture is calculated. The minimum effective width ratio is called the width ratio threshold, which reflects whether MPs can enter the fracture and form effective placement. The width ratio threshold in this experiment is 2.
According to the experimental results and the above table, the influence of sand concentration on MPs placement is studied. The higher the sand concentration, the greater the possibility of sand plugging, the proppants may fail to enter the fracture, and the effect of placement in the fracture is not ideal, resulting in the failure width ratio. When the sand concentration is 180kg/m3 under working conditions, the width ratio threshold of MPs is greater than 2.
2.4 Commentary
After hydraulic fracturing, the formation typically exhibits an intricate fracture network, wherein natural fractures fail to establish effective seepage channels under the current placement procedure employing large-particle-sized proppants. In order to select MPs with appropriate particle size to place natural fractures, an experimental study on the particle size threshold of MPs is conducted, and the following conclusions are drawn:
(1) Effective inflow of microparticle proppants requires a size threshold of proppants. For the 200-mesh proppants, the size should be less than half of natural fractures width when microparticle proppants effectively flow into natural fractures.
(2) The sand concentration significantly impacts the size threshold of microparticle proppants. An appropriate increase in the size threshold may be necessary to guarantee the inflow of proppant, taking into account the fracture width, fluid viscosity, and injection parameters.
3 MPs placement experiment in multi-branch fractures
3.1 Materials and methods
At present, the transport of MPs from the main fracture to the multi-branch fracture and the distribution of proppant with different particle sizes are major problems. The law of MPs placement under the condition of multi-branch fracture has not been fully defined. In order to better design the MPs placement process, the visual materials in Section 2.1 are combined with the proppant injection device. MPs injection experiments of multi-branch fractures with different fracture widths are carried out. As shown in Figure 5, the proppant injection device is shunt and two simulated fractures with different fracture widths are connected at the same time to study the effect of multi-branch fractures on the placement of MPs.

Figure 5. Schematic diagram of microparticle proppant placement in multi-branch fractures.
3.2 Experimental scheme
200-mesh and 140-mesh MPs are selected for staged injection. The fracture width should be in the range of 0.3mm–0.6 mm according to Section 2.3; MPs entering the fracture; Sand concentration of 60kg/m3 and 100kg/m3, guar gum content 2%; The flow rate is set to 1m3/min and the temperature is room temperature. 10 groups of MPs placement experiments with different fracture widths are completed. The experimental scheme is shown in Table 3.
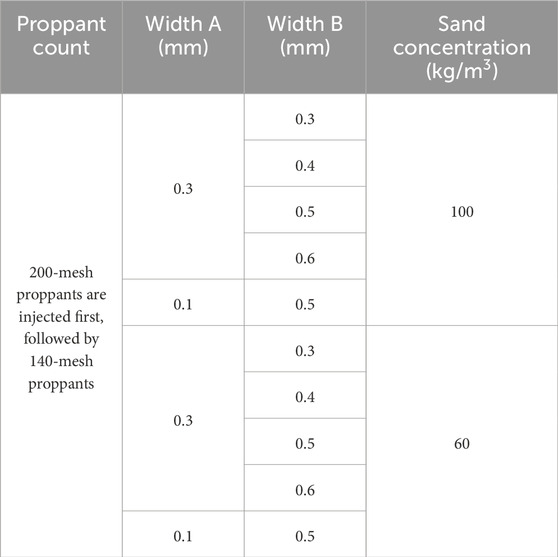
Table 3. Experimental scheme.
3.3 Experimental result
The placement characteristics of MPs injection in multi-branch fractures with different fracture widths are observed in the experiment. It is found that when the fracture widths of the two fractures are different (the difference is greater than or equal to 2 times), as shown in Figure 6, the placement characteristics of cascade injection of MPs are as follows: At this time, 200-mesh proppant is placed in the fracture with larger fracture widths, while effective support could not be formed in the fracture with smaller fracture widths. When the step injection is 140-mesh, it still preferentially enters the fracture with larger fracture width.
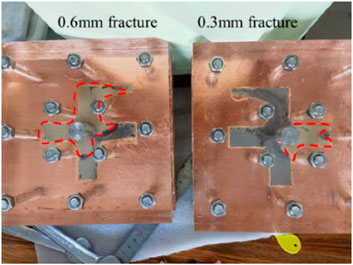
Figure 6. The MPs placement pattern is different when the fracture width is different (red shape represents areas occupied by MPs).
When the fracture width difference is small (less than 2 times), as shown in Figure 7, 200-mesh proppant enters the two fractures more evenly. When 140-mesh proppant is injected successively, it still enters the two fractures more evenly, and effective placing can be formed in both fractures.
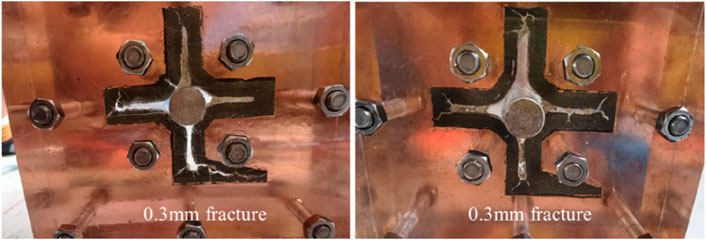
Figure 7. MPs placement with the same fracture width (black shape represents areas occupied by 200-mesh MPs; brown shape represents areas occupied by 140-mesh MPs).
As shown in Figure 8, when the sand concentration is 100kg/m3, the two groups of experiments with A fracture width of 0.3 mm and B fracture width of 0.3mm and 0.8 mm are taken as examples to demonstrate the MPs placement under the condition of multi-branch fractures. In Figure 8A is 200 mesh proppants in black and 140 mesh proppants in yellow, and (b) is 200 mesh proppants in milky white and 140 mesh proppants in yellow. All 200-mesh proppants can enter the fracture, but the time of entering the fracture is different. The greater the difference in width between the two fractures, the greater the time difference of entering the fracture. The placement of 140-mesh proppant is different, and the placement volume or area is also different with the difference of fracture width, and the time to enter the fracture is also different.
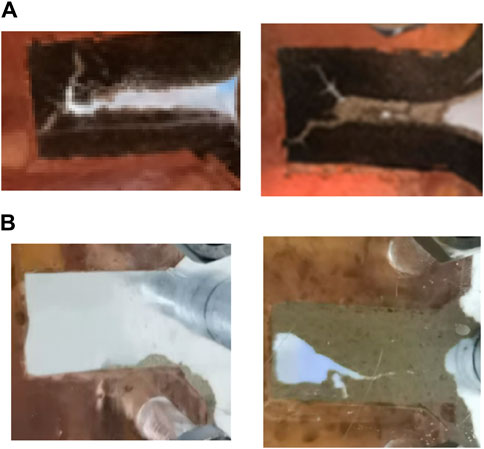
Figure 8. Step placement of MPs in multi-branch fractures (A) equal width (left: width = 0.3 mm; right: width = 0.3 mm) (B) different width (left: width = 0.3 mm; right: width = 0.6 mm).
Table 4 shows the placing characteristics of MPs with different fracture widths. When fracture widths of two fractures are the same or not different, when the ratio of fracture widths is less than or equal to 2, there is little difference in the placement effect of the two fractures, but the proppant with larger fracture widths is preferentially placed. When the two fractures width is very different, and the fracture width ratio between the two fractures is greater than 2, MPs will preferentially inject fractures with larger fracture widths, and only after placing fractures with larger fracture widths will they be flow into small fracture widths.
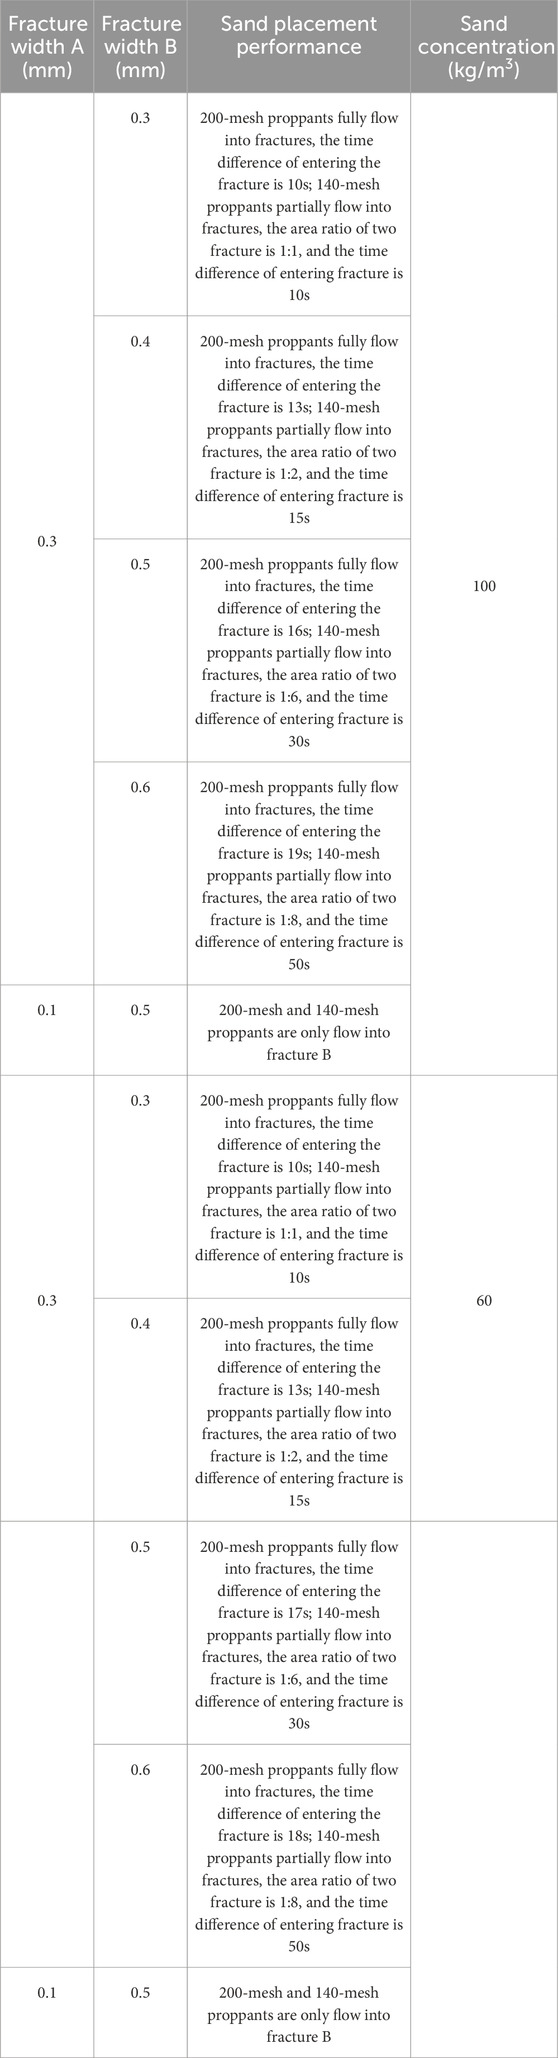
Table 4. Experimental scheme.
3.4 Commentary
Previous studies on the shunt transport of proppant from the main fracture to the multi-branch fractures and the distribution of proppant with different particle sizes in the complex fracture network are insufficient. Experiments are designed to study the placement of MPs in the multi-branch fractures, and the following conclusions are drawn: When the fracture widths of the two fractures in the experiment are very different, the two MPs selected first place fractures with large fracture widths, and the large-particle size to small-particle size pumping procedure can be considered in the field to avoid the large engineering amount of small-particle size proppant filling large fractures. When the width difference between the two fractures is small, MPs enter the multi-branch fractures almost simultaneously, and the small-particle size to large-particle size pumping procedure can be considered to fully support the natural fractures.
4 Numerical simulation of MPs placement
4.1 Modeling
Based on the experimental results of the first two chapters, the real fracture size model is established by numerical simulation to provide reference for the sensitivity analysis of MPs placement and the optimization of pumping scheme. By controlling geological factors, the effects of natural fracture interval and the angle between main and branching fractures on the placement of MPs are studied. By controlling stimulation parameters, the effects of MPs particle size, sand concentration and pumping rate are studied.
According to the characteristics of small particle size and strong suspension of MPs, a reference spread flow two-fluid model is established. The MPs is regarded as a continuous phase mixed with the fracturing fluid. The Volume of Fluid (VOF) multiphase flow model is used for simulation.
Fluid flow must obey the law of conservation of mass, Newton’s second law and the law of conservation of energy, these three basic principles of physics can be derived from the governing equations of fluid flow.
Continuity equation: the increase of fluid cell weight and mass per unit time is equal to the net mass flowing into the cell in the same time interval, derived from the law of conservation of mass, expressed as:
where:
Momentum equation: the rate of change of the momentum of the fluid in the micro body with respect to time is equal to the sum of various external forces acting on the micro body, obtained by Newton’s second law, expressed as:
where:
The VOF model is suitable for solving stratified flows and flow problems that require tracking free surfaces, such as calculating fluid flows where air and water do not fuse with each other. When using the VOF model, different fluid components share a set of momentum equations to calculate the volume fraction of each flow in each grid element. For the
where:
Based on ANSYS SCDM, the numerical model is established, as shown in Figure 9. In the geometric model, the length of the main fracture is 200m, the width is 20 mm and the height is 30m; the length of the branching fractures is 20m, the width is 2 mm and the height is 30 m. The red line indicates the fluid inlet, the rest are no flow boundaries. The fracture is not filled by the pre-fluid at the beginning of the simulation.
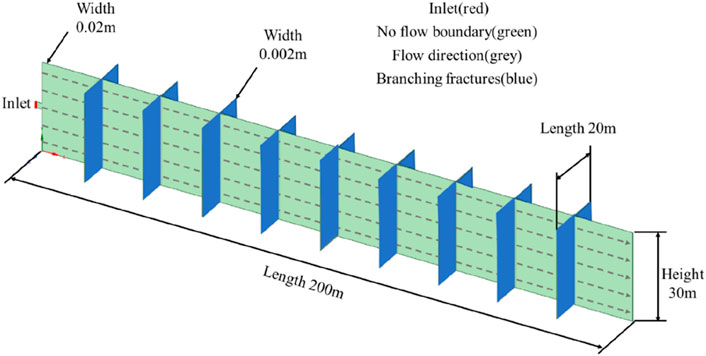
Figure 9. Geometric model.
4.2 Numerical simulation scheme
The numerical simulation considers the influence of two geological factors, natural fracture density and natural fracture angle, and three engineering parameters, such as particle size, pumping rate and sand concentration. The parameter range is set as natural fracture spacing of 5m, 10 m and 20m, angle of 30°, 60° and 90°, particle size of 200-mesh and 140-mesh, sand concentration of 60 kg/m3, 100 kg/m3 and 180kg/m3, and pumping rate of 0.5∼4m3/min. Each group is injected with the same proppant quality. As shown in Table 5, Dahl et al., 2015b groups of numerical simulation are performed.
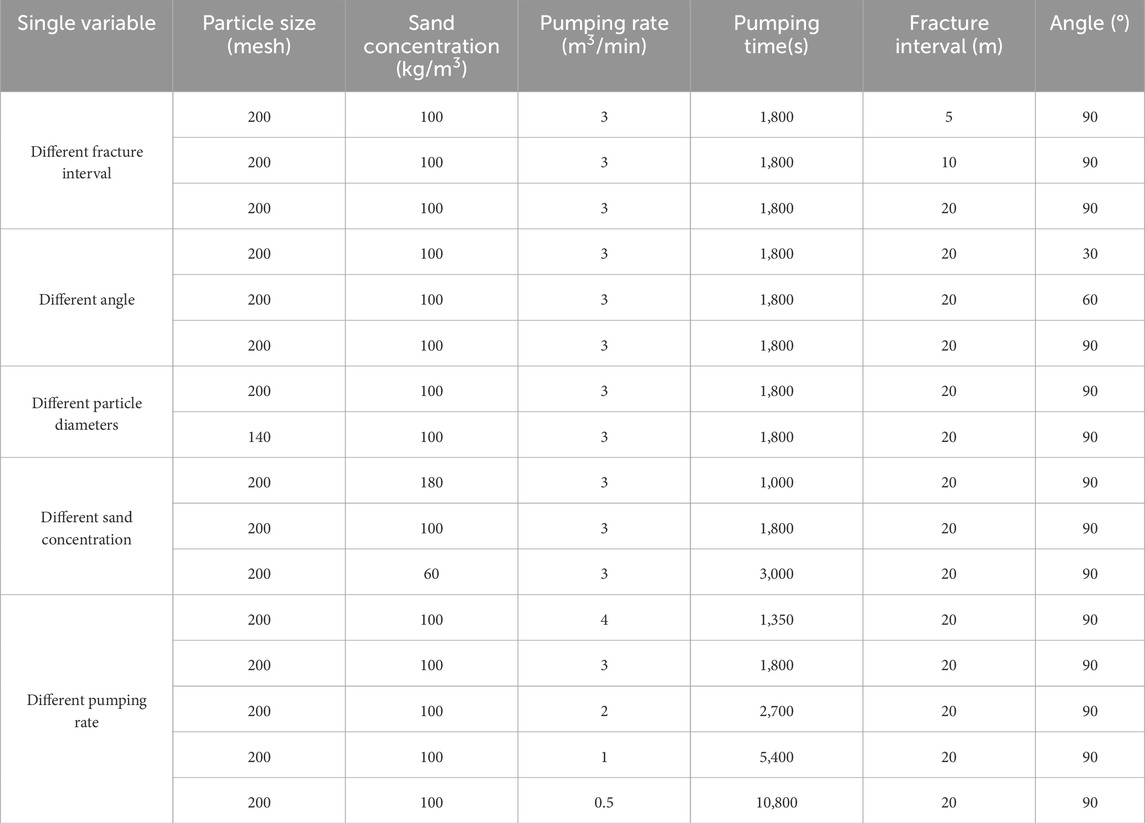
Table 5. Simulation scheme.
4.3 Numerical simulation result
In this section, MPs placement is numerically simulated under the various cases. The dynamic effectiveness of the proppant placement is evaluated according to the volume ratio of proppant to natural fractures and the coefficient of variation. The coefficient of variation represents the uniformity of MPs in natural fractures and its formation is shown as Eq. 4. In probability theory and statistics, the coefficient of variation is a normalized measure of the dispersion of a probability distribution, defined as the ratio of standard deviation to the mean:
where,
Using the first set of simulations in Table 5 as an example, the distribution of proppant in the fracture at different times is studied. Proppant placement in the branching fractures is analyzed every 20 m from the inlet to study the influence of geological factors and engineering parameters on proppant placement. Figure 10 shows the volume fraction of proppant in the natural fracture and hydraulic fractures at 100s, 500s, 1000s, and 1500s, with the red part representing proppants. The right side of Figure 10 shows proppant placement in hydraulic fractures at different distances. The uniformity of proppant placement is analyzed according to coefficient of variation formula.
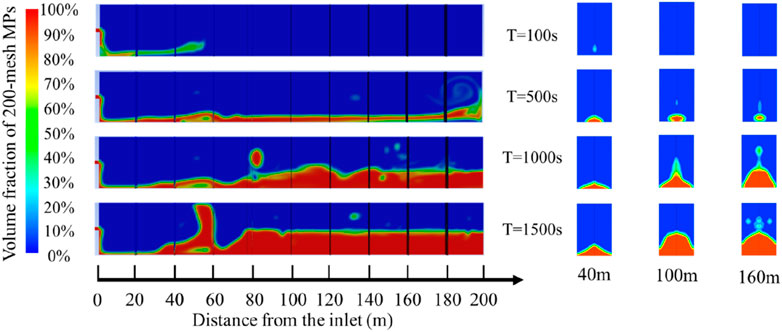
Figure 10. Volume fraction diagram of proppant placement in natural fractures.
4.3.1 Influence of geological factors
(1) The influence of natural fracture interval
The placing regularity of proppant at natural fracture interval of 5m, 10m and 20 m is studied by numerical simulation. Fracture interval refers to the distance between simulated natural fractures in the extension direction of the main fracture. Other parameters remained unchanged during the simulation. The comparison between the placement data of each branching fracture and the total placement data of proppant is shown in Figure 11. The proppant volume is obtained by integrating the volume fraction of proppant in natural fractures as shown in Figure 10. The volume ratio of proppant to natural fractures can be calculated and its alternation behaviors of all natural fractures is shown in Figure 11. The dynamic effectiveness of the proppant placement is evaluated according to the volume ratio of proppant to natural fractures and the coefficient of variation (cv). The coefficient of variation represents the uniformity of MPs in natural fractures.
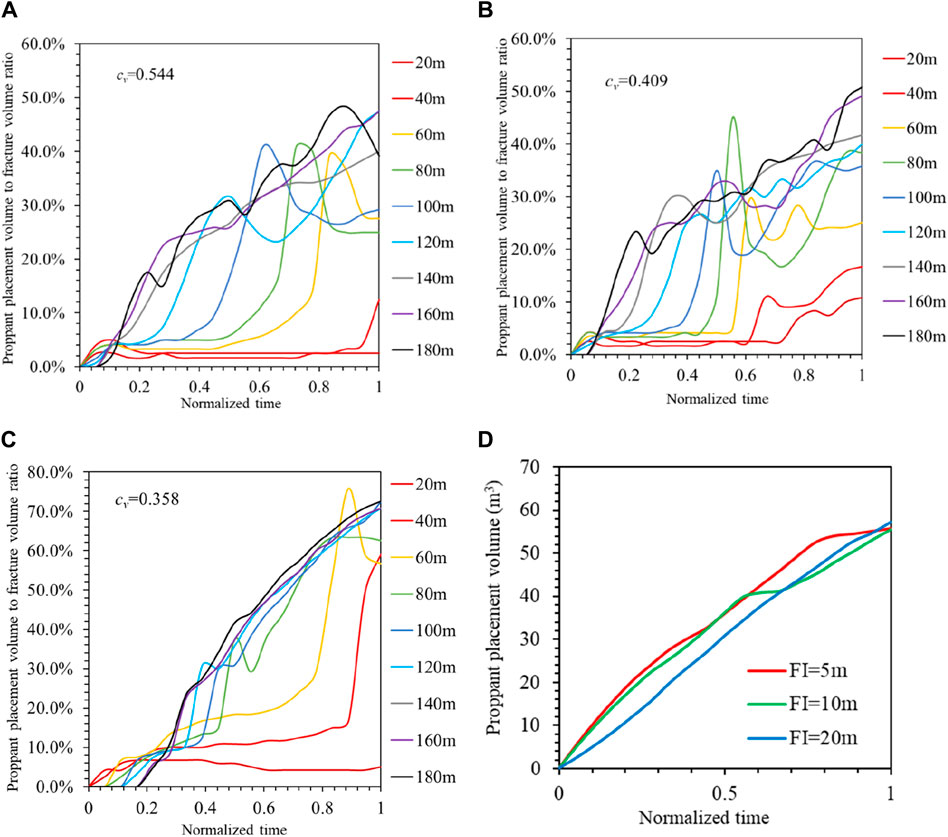
Figure 11. The placement in each branching fracture and the total placement of proppant at different fracture intervals (A) Fracture interval = 5 m (B) Fracture interval = 10 m (C) Fracture interval = 20 m (D) Different fracture interval situation.
In this paper, MPs of the same quality are injected at the fracture interval of 5m, 10m and 20 m respectively. Starting from the inlet, the placement of branching fracture is analyzed every 20 m to research the uniformity of MPs placement. As shown in Figures 11A–C, the placement of the distal fracture is better than that of the proximal fracture when the fracture interval is 5m, 10 m and 20m, and the coefficient of variation is 0.544, 0.409 and 0.358, respectively. When the fracture interval is 5m, 10 m and 20m, the branching fractures are placed 29.64%, 32.89% and 60.09% on average. Proppant placement with 20 m fracture interval is the most uniform in the three conditions. According to Figure 11D, the total placement of proppant in the three fracture interval conditions have little difference, but the maximum amount is 57.19m3 when the fracture interval is 20 m.
(2) The influence of the angle between the main fracture and the branching fracture
The proppant placement rule is studied when the angle between branching fracture and main fracture is 30°, 60° and 90°, and other parameters remained unchanged during the simulation. The Angle between the green main fracture and the blue branching fracture shown in Figure 9. The comparison between the placement data of each branching fracture and the total placement data of proppant is shown in Figure 12.
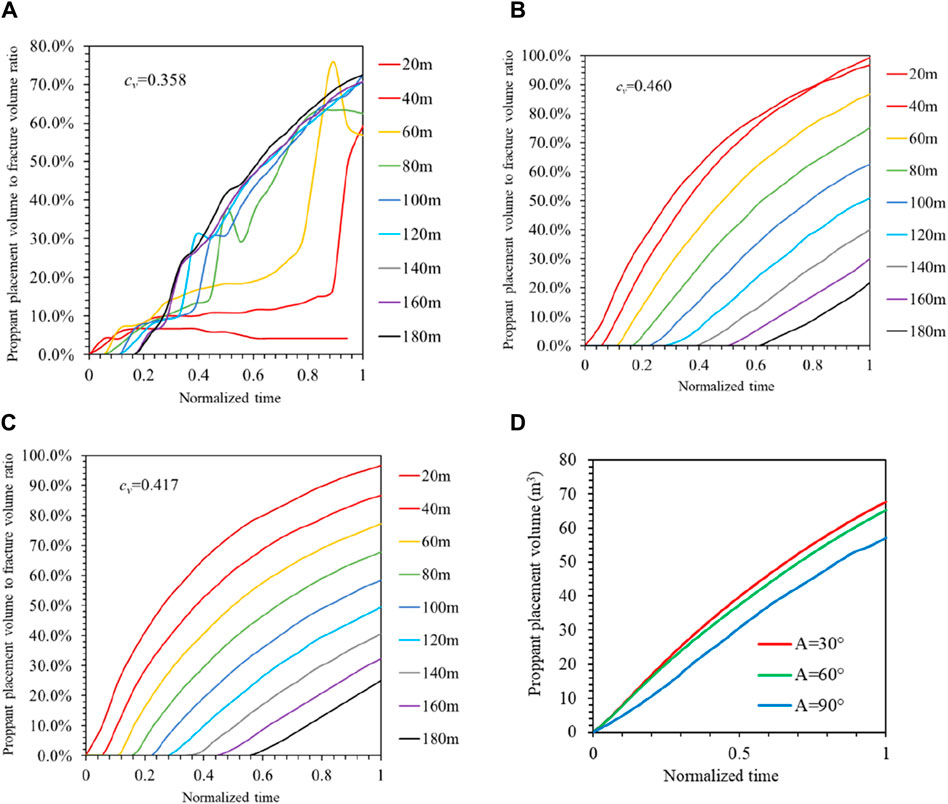
Figure 12. The placement in each branching fracture and the total placement of proppant at different angles (A) Angle = 90° (B) Angle = 60° (C) Angle = 30° (D) Different angles situation.
As shown in Figures 12A–C, when the angles are 90°, 60° and 30°, the coefficient of variation is 0.358, 0.460 and 0.417, the branching fractures are placed 60.09%, 62.50% and 59.32% on average. The most uniform proppant placement is at 90°, but the most branching fracture proppant placement is at 60°. As shown as in Figure 12D, the total placement of proppant in the three angle conditions have little difference, but the maximum amount is 67.72m3 when the angle is 30°.
4.3.2 Influence of engineering parameters
(1) The influence of particle size
The placement rule of proppant with particle size of 200-mesh and 140-mesh is studied by numerical simulation, and other parameters remained unchanged during simulation. The comparison between the placement data of each branching fracture and the total placement data of proppant is shown in Figure 13.
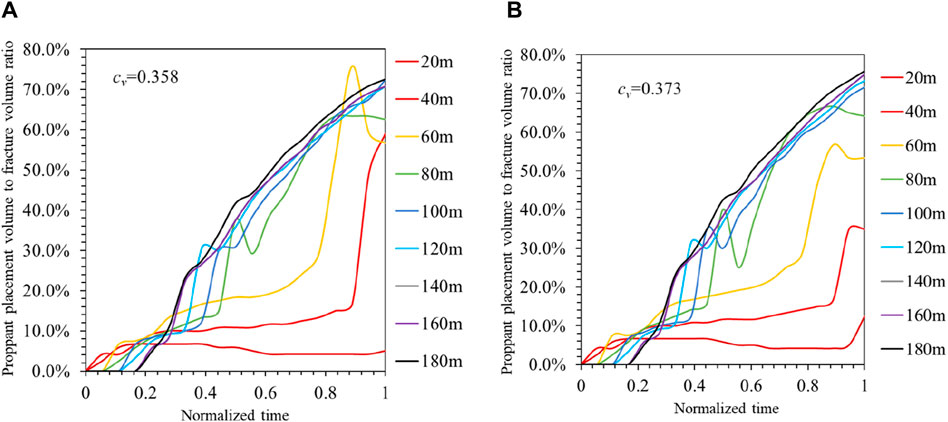
Figure 13. The placement in each branching fracture and the total placement of proppant at different particle sizes (A) Particle size = 200-mesh (B) Particle size = 140-mesh.
As shown in Figures 13A, B, when the particle sizes are 200-mesh and 140-mesh, the coefficient of variation is 0.358 and 0.373, the branching fractures are placed 60.09% and 59.53% on average. There is little difference between the placement of 200-mesh and 140-mesh proppants, but 200-mesh proppants are better in terms of uniformity and total volume.
(2) Influence of sand concentration
The placement rule of proppant with sand concentration of 60kg/m3, 100kg/m3 and 180kg/m3 is studied by numerical simulation, and other parameters remained unchanged during simulation. The comparison between the placement data of each branching fracture and the total placement data of proppant is shown in Figure 14.
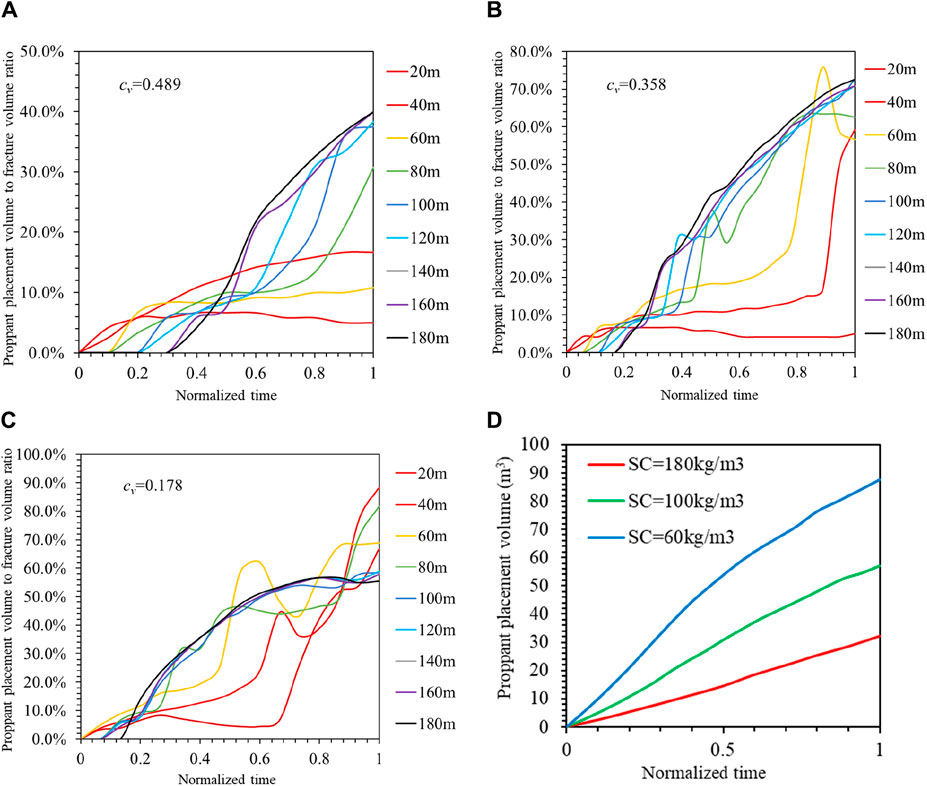
Figure 14. The placement in each branching fracture and the total placement of proppant at different sand concentrations (A) Sand concentration = 180kg/m3 (B) Sand concentration = 100kg/m3 (C) Sand concentration = 60kg/m3 (D) Different sand concentrations situation.
As shown in Figures 14A–C, when the sand concentrations are 180kg/m3, 100kg/m3 and 60kg/m3, the coefficient of variation is 0.489, 0.358 and 0.178, the branching fractures are placed 28.80%, 60.09% and 98.98% on average. The most uniform proppant placement is at 60kg/m3, and the most branching fracture proppant placement is at 60kg/m3. As shown as in Figure 14D, the total placement of proppant in the three sand concentration conditions have large difference, and the maximum amount is 87.52m3 when the sand concentration is 60kg/m3.
(3) Influence of pumping rate
The placements of proppant with pumping rate of 0.5m3/min, 1m3/min, 2m3/min, 3m3/min and 4m3/min are studied by numerical simulation, and other parameters remained unchanged during simulation. The comparison between the placement data of each branching fracture and the total placement data of proppant is shown in Figure 15.
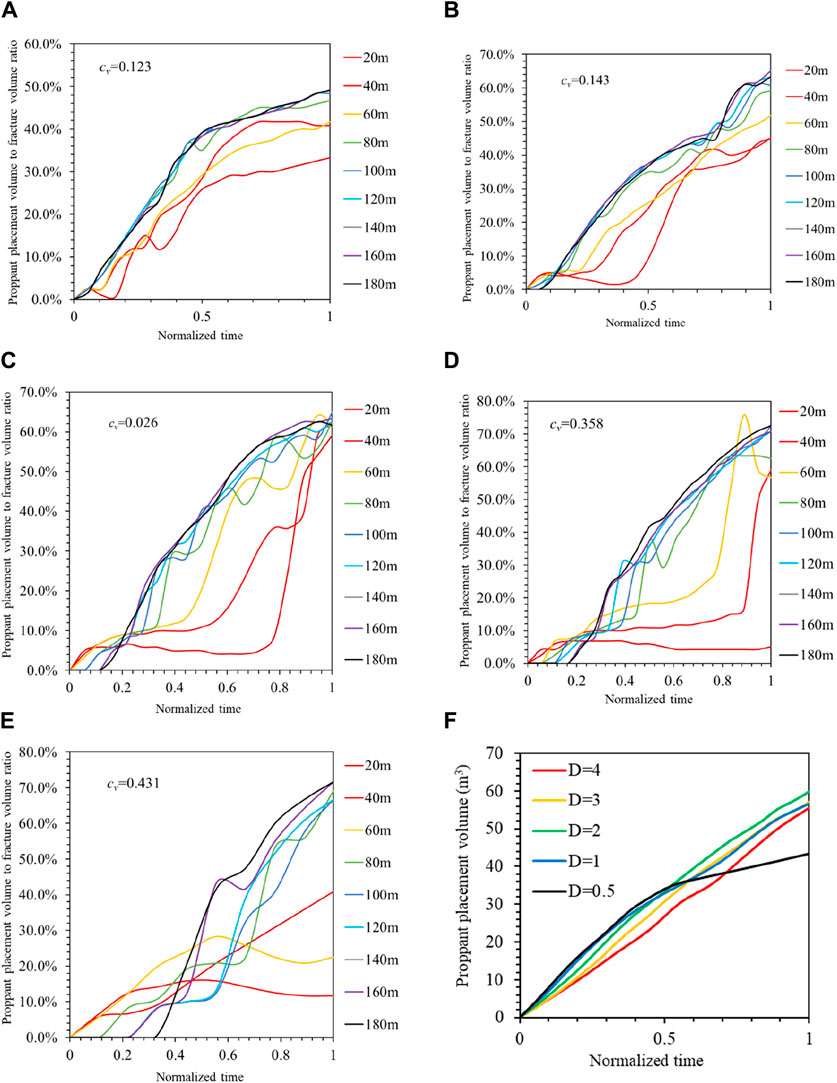
Figure 15. The placement in each branching fracture and the total placement of proppant at different pumping rates (A) Pumping rate = 0.5 m3/min (B) Pumping rate = 1 m3/min (C) Pumping rate = 2 m3/min (D) Pumping rate = 3 m3/min (E) Pumping rate = 4 m3/min (f) Different pumping rates situation.
As shown in Figures 15A–E, when the pumping rates are 0.5m3/min, 1m3/min, 2m3/min, 3m3/min and 4m3/min, the coefficient of variation is 0.123, 0.143, 0.026, 0.358 and 0.431, the branching fractures are placed 45.27%, 57.59%, 62.31%, 60.09% and 54.72% on average. The most uniform proppant placement is at 2m3/min, and the most branching fracture proppant placement is at 2m3/min. As shown as in Figure 15F, the total placement of proppant in the five pumping rate conditions have little difference besides 0.5m3/min, and the maximum amount is 59.86m3 when the sand concentration is 2m3/min.
4.4 Commentary
Through numerical simulation, the real fracture size model is established to provide a reference for the sensitivity analysis of MPs in-fracture placement and the optimization of pumping scheme. By controlling the engineering parameters, the influence of MPs particle size, sand concentration and pumping rate is studied, and the parameters are optimized according to the numerical simulation results. There are the following commentaries: (1) when the fracture interval is 20m, the injection and placement of MPs is better. (2) The effect of the angle on proppant placement is complex. The most uniform proppant placement is at 90°, but the most branching fracture proppant placement is at 60°. The total placement of proppant in the three angle conditions have little difference, but the maximum amount is 67.72m3 when the angle is 30°. (3) Particle size has little effect on proppant placement, 200-mesh placement is more uniform, 140-mesh placement is more. (4) Sand concentration significantly affects proppant placement, with the best placement at 60kg/m3. (5) The converted pumping rate of a single cluster fracture should not be too small, should be greater than 0.5 m3/min, 2 m3/min is the best.
4 Conclusion
The formation after hydraulic fracturing often has a complex fracture network, in which micro-fractures do not form effective seepage channels under the existing large-particle proppant placement technology. In order to select the appropriate particle size MPs for micro-fracture placement, the particle size threshold of MPs placement is experimentally studied. Previous studies on the shunt transport of proppant from the main fracture to the multi-branch fracture and the distribution of proppant with different particle sizes in the complex fracture network are insufficient. The MPs placement experiments under different fracture widths are designed to study the placement of MPs in the multi-branch fracture. By means of numerical simulation, the influence of MPs particle size and sand concentration on fracture placement is studied under the real fracture size. In this paper, the placement process and influencing factors of microparticle proppant are studied, and the important role of selecting suitable proppant to support hydraulic fracturing fractures in field construction is clarified. The following conclusions are drawn:
(1) Effective inflow of microparticle proppants requires a size threshold of proppants. For the 200-mesh proppants, the size should be less than half of natural fractures width when microparticle proppants effectively flow into natural fractures.
(2) Sand concentration affects the size threshold of microparticle proppants. The size threshold should appropriately increase to ensure the inflow of proppant.
(3) Difference of multi-branch fracture width has a significant effect on volume of microparticle proppants inside fractures. When the width ratio of multi-branch fractures exceeds 2, this effect becomes obvious. When the fracture widths of the two fractures in the experiment are very different, the two MPs select first place fractures with large fracture widths. The large-particle size to small-particle size pumping procedure can be considered in the field to avoid the large engineering amount of small-particle size proppant placing large fractures and wide fractures. When the fracture width difference between the two fractures is small, MPs enter the multi-branch fractures almost simultaneously, and the small-particle size to large-particle size pumping procedure can be considered to fully support the natural fractures.
(4) Particle size has an effect on proppant placement. 200-mesh proppants can obtain uniform distribution of proppants among natural fractures. 140-mesh proppants can obtain maximum proppant volume among natural fractures. Sand concentration significantly affects proppant placement performance. The optimal sand concentration is 60kg/m3. Pumping rate of a single cluster fracture should not be too small. The pumping rate should be larger than 0.5m3/min and the optimal pumping rate 2m3/min.
Data availability statement
The raw data supporting the conclusion of this article will be made available by the authors, without undue reservation.
Author contributions
HL: Writing–original draft, Writing–review and editing, Conceptualization, Data curation, Formal Analysis, Funding acquisition, Investigation, Methodology, Project administration, Resources, Software, Supervision, Validation, Visualization. XW: Writing–original draft, Conceptualization, Data curation, Investigation, Methodology, Software, Visualization. NX: Writing–review and editing, Data curation, Formal Analysis, Funding acquisition, Project administration, Resources, Supervision, Validation. ZC: Writing–review and editing, Conceptualization, Data curation, Formal Analysis, Funding acquisition, Investigation, Methodology, Project administration, Resources, Software, Supervision, Validation, Visualization. YP: Conceptualization, Data curation, Formal Analysis, Funding acquisition, Investigation, Methodology, Project administration, Resources, Software, Supervision, Validation, Visualization, Writing–original draft, Writing–review and editing.
Funding
The author(s) declare that financial support was received for the research, authorship, and/or publication of this article. This work was supported by CNPC Scientific Research and Technology Development Project “Integration and industrialization of Improved Waterflooding Development Technologies for Thin Carbonate Reservoirs in Ahdab and Oman Block 5” (No. 2023ZZ19-08), which is gratefully acknowledged.
Conflict of interest
Authors HL and NX were employed by China CNPC R&D (DIFC) Company Limited.
The remaining authors declare that the research was conducted in the absence of any commercial or financial relationships that could be construed as a potential conflict of interest.
The reviewer WW declared a shared affiliation with the author(s) XW and YP to the handling editor at the time of review.
Publisher’s note
All claims expressed in this article are solely those of the authors and do not necessarily represent those of their affiliated organizations, or those of the publisher, the editors and the reviewers. Any product that may be evaluated in this article, or claim that may be made by its manufacturer, is not guaranteed or endorsed by the publisher.
References
Al-Fatlawi, O., Hossain, M. M., and Saeedi, A. (2017a). “A new practical method for predicting equivalent drainage area of well in tight gas reservoirs,” in SPE-185854. Presented at the SPE Europec featured at 79th EAGE Conference and Exhibition, Paris, France, 12-15 June (SPE).
Al-Fatlawi, O., Roy, V., Aswin, R., Hossain, M. M., and Kabir, A. H., (2017b). Optimization of infill drilling in whicher range field in Australia. In: SPE-188085. Presented at the SPE Kingdom of Saudi Arabia Annual Technical Symposium and Exhibition, Dammam, Saudi Arabia, 24-27 April.IEEE,
Anders, M. H., Laubach, S. E., and Scholz, C. H. (2014). Microfractures: a review. J. Struct. Geol. 69, 377–394. doi:10.1016/j.jsg.2014.05.011
Apaydin, O. G., Ozkan, E., and Raghavan, R. (2012). Effect of discontinuous microfractures on ultratight matrix permeability of a dual-porosity medium. SPE Reserv. Eval. Eng. 15 (04), 473–485. doi:10.2118/147391-pa
Awan, F. U. R., Keshavarz, A., Akhondzadeh, H., Al-Anssari, S., Al-Yaseri, A., Nosrati, A., et al. (2020a). Stable dispersion of coal fines during hydraulic fracturing flowback in coal seam gas reservoirs—an experimental study. Energy fuels. 34 (5), 5566–5577. doi:10.1021/acs.energyfuels.0c00045
Awan, F. U. R., Keshavarz, A., Akhondzadeh, H., Al-Anssari, S., and Iglauer, S. (2020b). A novel approach for using silica nanoparticles in a proppant pack to fixate coal fines. APPEA J. 60 (1), 88–96. doi:10.1071/aj19031
Babcock, R. E., Prokop, C. L., and Kehle, R. O. (1967). “Distribution of propping agents in vertical fractures,” in API production division mid-continent district meeting (Oklahoma City: API).
Bagher Asadi, M., Dejam, M., and Zendehboudi, S. (2019). Semi-Analytical solution for productivity evaluation of a multi-fractured horizontal well in a bounded dual-porosity reservoir. J. Hydrology 581, 124288. doi:10.1016/j.jhydrol.2019.124288
Bedrikovetsky, P., Keshavarz, A., Khanna, A., Kenzie, K. M., and Kotousov, A. (2012). Stimulation of natural cleats for gas production from coal beds by graded proppant injection. SPE 158761.
Bose, C. C., et al. (2015). “Nano-proppants for fracture conductivity improvement and fluid loss reduction,” in SPE western regional meeting (USA: Society of Petroleum Engineers).
Brannon, H. D., Wood, W. D., and Wheeler, R. S. (2006). Improved understanding of proppant transport yields new insight to the design and placement of fracturing treatments, SPE 102758. SPE Annual Technical Conference and Exhibition, San Antonio, Texas, 24-27 September.(SPE).
Calvin, J., Grieser, B., and Bachman, T. (2017). “Enhancement of well production in the SCOOP woodford shale through the application of microproppant,” in SPE Hydraulic Fracturing Technology Conference and Exhibition, USA, 4–6 February 2025 (Society of Petroleum Engineers).
Cipolla, C., Lolon, E., and Mayerhofer, M. (2009). The effect of proppant distribution and un-propped fracture con-ductivity on well performance in unconventional gas reservoirs. Spe 119368.
Dahl, J., et al. (2015b). “Application of micro-proppant in liquids-rich, unconventional reservoirs to improve well production: laboratory results, field results, and numerical simulations,” in Abu Dhabi International Petroleum Exhibition and Conference, Germany, 3 November 2022 (Society of Petroleum Engineers).
Dahl, J., Nguyen, P., Dusterhoft, R., Calvin, J., and Siddiqui, S. (2015a). Application of micro-proppant to enhance well production in unconventional reservoirs: laboratory and field results Presented at SPE western regional meeting, garden grove, California. California, SPE.
Dayan, A., Stracener, S. M., and Clark, P. E. (2009). “Proppant transport in slickwater fracturing of shale gas formations,” in SPE 125068. Presented at the SPE Annual Technical Conference and Exhibition, New Orleans, Louisiana, 4-7 October (IEEE).
Dharmendra, K., Ruben, A., and Ahmad, G. (2019). “The role of micro-proppants in conductive fracture network development,” in Presented at the SPE Hydraulic Fracturing Technology Conference and Exhibition held in The Woodlands, Texas, USA, 5-7 February (SPE).
Gale, J. F. W., Laubach, S. E., Olson, J. E., Eichhubi, P., and Fall, A. (2014). Natural fractures in shale: a review and new observations. AAPG Bull. 98 (11), 2165–2216. doi:10.1306/08121413151
Kern, L. R., Perkins, T. K., and Wyant, R. E. (1959). The mechanics of sand movement in fracturing. J. Petrol. Technol. 11, 55–57. doi:10.2118/1108-g
Keshavarz, A., Badalyan, A., Carageorgos, T., Bedrikovetsky, P., and Johnson, R. (2015a). Graded proppant injection into coal fracture gas and shale gas reservoirs for well stimulation. SPE 174200.
Keshavarz, A., Badalyan, A., Carageorgos, T., Bedrikovetsky, P., and Johnson, R. (2015b). Stimulation of coal seam permeability by micro-sized graded proppant placement using selective fluid properties. Fuel 144, 228–236. doi:10.1016/j.fuel.2014.12.054
Keshavarz, A., Badalyan, A., Johnson, R., and Bedrikovetsky, P. (2016). Productivity enhancement by stimulation of natural fractures around a hydraulic fracture using micro-sized proppant placement. J. Nat. Gas Sci. Eng. 33, 1010–1024. doi:10.1016/j.jngse.2016.03.065
Khanna, A., Keshavarz, A., Mobbs, K., Davis, M., and Bedrikovetsky, P. (2013). Stimulation of the natural fracture system by graded proppant injection. J. Petrol. Sci. Eng. 111, 71–77. doi:10.1016/j.petrol.2013.07.004
Kim, B. Y., Akkutlu, I. Y., Martysevich, V., and Dusterhoft, R. (2018). “Laboratory measurement of microppant placement quality using split core plug permeability under stress,” in Presented at the SPE Hydraulic Fracturing Technology Conference and Exhibition, The Woodlands, Texas, USA, 23-25 January (SPE).
Li, J. (2016). The research and development and experimental law of the proppant placement device with visual variable angle slit net (USA: Southwest Petroleum University). Mater Thesis.
Li, J. B., Bai, J. W., Zhu, L. A., Jia, J. P., Zu, K., and Han, H. X. (2013). Volume fracturing and its practices in Sulige tight sandstone gas reservoirs, Ordos Basin (in Chinese). Nat. Gas. Ind. 33 (9), 65–69. doi:10.3787/j.issn.1000-0976.2013.09.011
Liu, Y., Ma, T., Chen, P., Wu, B., Zhang, X., and Wu, B. (2020). Effects of permeable plugs on wellbore strengthening. Int. J. Rock Mech. Min. Sci. 132, 104416. doi:10.1016/j.ijrmms.2020.104416
Mayerhofer, M. J., Lolon, E., Warpinski, N. R., Cipolla, C. L., Walser, D. W., and Rightmire, C. M. (2008). “What is stimulated rock volume?,” in SPE-119890. Presented at the SPE Shale Gas Production Conference, Fort Worth, Texas, 16-18 November-2008 (IEEE).
Meyer, B., Bazan, L., Jacot, R., and Lattibeaudiere, M. (2010). “Optimization of multiple transverse hydraulic fractures in horizontal wellbores,” in SPE-131732. Presented at the SPE Unconventional Gas Conference, Pittsburgh, USA, 23-25 February-2010. doi:10.2523/131732-ms
Morteza, D., Hassan, H., and Zhangxin, C. (2018). Semi-analytical solution for pressure transient analysis of a hydraulically fractured vertical well in a bounded dual-porosity reservoir. J. Hydrology 565, 289–301. doi:10.1016/j.jhydrol.2018.08.020
Nagel, N., and Sanchez-Nagel, M. (2015). “On the importance and impact of keygeomechanical parameters in unconventional play developments,” in 49th US rock mechanics/geomechanics symposium (American: American Rock Mechanics Association).
Nguyen, P. D., et al. (2013). “Evaluating treatment methods for enhancing microfracture conductivity in tight formations,” in SPE Unconventional Resources Conference and Exhibition-Asia Pacific, USA, 16-18 November 2021 (Society of Petroleum Engineers).
Schols, R. S., and Visser, W. (1974). “Proppant bank build up in a vertical fracture without fluid loss,” in SPE 4834. SPE European spring meeting (Amsterdam, Netherlands: Springer), 29–30.
Shah, S. N., Mahmoud, A., and Lord, D. L. (2001). Proppant transport characterization of hydraulic fracturing fluids using a high-pressure simulator integrated with a fiberoptic/light-emitting-diode (LED) vision system. SPE J. 16 (1), 42–49. doi:10.2118/69210-pa
Shokir, E. M. E.-M. B., and Al-Quraishi, A. A. (2007). “Experimental and numerical investigation of proppant placement in hydraulic fractures,” in SPE 107927. Presented at the Latin American and Caribbean Petroleum Engineering Conference, Buenos Aires, Argentina, 15-18 April (IEEE).
Sievert, J. A., Wahl, H. A., and Clark, P. E. (1981). “Prop transport in a large vertical model,” in SPE 9865. Presented at the SPE/DOE Low Permeability Gas Reservoirs Symposium, Denver, Colorado, 27-29 May (IEEE).
Wang, R. (2015). Analysis on influential factors for volumetric fracturing effects in horizontal well in tight reservoir. Spec. Oil Gas. Reserv. 22 (2), 126–128+157. doi:10.3969/j.issn.1006-6535.2015.02.032
Wei, M., Duan, Y., Dong, M., Fang, Q., and Dejam, M. (2019). Transient production decline behavior analysis for a multi-fractured horizontal well with discrete fracture networks in shale gas reservoirs. J. Porous Media 22 (3), 343–361. doi:10.1615/jpormedia.2019028982
Woodworth, T. R., and Miskimins, J. L. (2007). “Extrapolation of laboratory proppant placement behavior to the field in slickwater fracturing applications,” in SPE 106089. Presented at the SPE Hydraulic Fracturing Technology Conference, College Station, Texas, 29-31 January (IEEE).
Wu, K., Li, X., Wang, C., Chen, Z., and Yu, W. (2015). A model for gas transport in microfractures of shale and tight gas reservoirs. AIChE J. 61 (6), 2079–2088. doi:10.1002/aic.14791
Wu, K., and Olson, J. E. (2016). Numerical investigation of complex hydraulic-fracture development in naturally fractured reservoirs. Soc. Petrol. Eng. J. 31, 1–10. doi:10.2118/173326-PA
Yu, W. C., Ding, F., and Wu, J. (2015). Evaluation system for slick-water fracturing fluid used in shale gas well. Drill. Fluid Complet. Fluid 32 (3), 90–92+109-110. doi:10.3969/j.issn.1001-5620.2015.03.025
Zhai, H. L. (2012). Experimental study on optimizing proppant displacement in hydraulic fracturing (China: China University of Petroleum). PhD thesis.
Zhang, B., Pathegama Gamage, R., Zhang, C., and Ma, T. (2023). On the correlation between proppant addition strategy and distribution. Gas Sci. Eng. 117, 205060. doi:10.1016/j.jgsce.2023.205060
Zhou, Z., Abass, H., Li, X., and Teklu, T. (2016). Experimental investigation of the effect of imbibition onshale permeability during hydraulic fracturing. J. Nat. Gas. Sci. Eng. 29, 413–430. doi:10.1016/j.jngse.2016.01.023
Keywords: microparticle proppants, proppant placement, transport behavior, natural fractures, fracture conductivity
Citation: Liu H, Wang X, Xu N, Chen Z and Peng Y (2024) Research on the transport behavior of microparticle proppants inside natural fractures. Front. Earth Sci. 12:1418783. doi: 10.3389/feart.2024.1418783
Received: 17 April 2024; Accepted: 27 May 2024;
Published: 13 June 2024.
Edited by:
Soroush Abolfathi, University of Warwick, United KingdomReviewed by:
Shiyuan Zhan, Chengdu University of Technology, ChinaWendong Wang, China University of Petroleum (East China), China
Tianshou Ma, Southwest Petroleum University, China
Copyright © 2024 Liu, Wang, Xu, Chen and Peng. This is an open-access article distributed under the terms of the Creative Commons Attribution License (CC BY). The use, distribution or reproduction in other forums is permitted, provided the original author(s) and the copyright owner(s) are credited and that the original publication in this journal is cited, in accordance with accepted academic practice. No use, distribution or reproduction is permitted which does not comply with these terms.
*Correspondence: Huifeng Liu, bGl1aHVpZmVuZzEyM0AxMjYuY29t