 Yingjie Xia
 Xuan Xue1,2
 Qi Zhang
95% of researchers rate our articles as excellent or good
Learn more about the work of our research integrity team to safeguard the quality of each article we publish.
Find out more
ORIGINAL RESEARCH article
Front. Earth Sci. , 25 July 2024
Sec. Petrology
Volume 12 - 2024 | https://doi.org/10.3389/feart.2024.1418562
Stratified rock masses comprise various rocks with different thicknesses, lithologies, and compositions. They exhibit unique cracking morphology and failure modes when subjected to external loads. Understanding and mastering the fracture morphology and failure laws of stratified rock masses under three-dimensional mechanical conditions is crucial for researching disasters in underground engineering geology. This paper presents a three-dimensional double-layer rock mass model established using the numerical calculation method based on mesoscopic statistical damage mechanics. The model simulates the cracking mode of the rock surface under biaxial tensile conditions. The simulation results are quantified using PCAS software. Crack indexes, such as the number of cracked blocks, average cracked block area, and surface crack rate, are used to evaluate the degree of influence of different factors on the cracking of the rock surface layer. The results indicate that the degree of surface crack development varies linearly with the degree of homogeneity (m). Additionally, the layer thickness ratio (η) is positively correlated with the average fragmentation area, and the two are logarithmic. Regardless of the model scale, the average circumference of each block is approximately equal to the model side length. The model exhibits the highest degree of crack development when the loads in the x and y directions are equal. Moreover, the degree of crack development in the model is also influenced by the loading per step, and the two are proportional.
Sedimentary rocks with layered structures make up two-thirds of the Earth’s surface, and many metamorphic rocks also exhibit layering (Li, 1992). The most easily observable phenomenon of cracking in stratified rock masses is surface fractures. The causes of their formation are varied, and their development mechanism is complex. The fracture and instability of layered rock masses can cause numerous engineering problems. For instance, the coal seam floor of Luotuoshan’s layered structure is fractured, causing water bursts. Similarly, the roof instability of the layered coal pillar group in Majiliang mine, Datong, leads to earthquakes and surface collapse. Additionally, the cracking of the layered rock mass can induce fractures and instability in the surrounding rock of roadways, tunnels, and chambers. For example, in Zhigushan Tunnel in Sichuan province, the vertical layered rock mass tunnel underwent large deformation due to high ground stress (Meng et al., 2013). Similarly, in Gonghe Tunnel of Sichuan-Chongqing Expressway, the bedding of layered rock mass resulted in the formation of vertical deformation and failure zone (Li et al., 2010). In terms of cultural relics protection, surface cracking has a more direct impact on mural cracks and soil site cracking. Using the example of Dunhuang mural painting, changes in air humidity can cause dry shrinkage tensile stress in the ground pillar layer, leading to cracking of the surface mural painting layer (Cordero et al., 2021). This indicates a correlation between mural cracking and the cracking of layered materials. Therefore, studying the phenomenon of cracking on layered rock surfaces and gaining a deep understanding of its characteristics is of great significance for preventing and controlling underground engineering geological disasters and protecting cultural relics.
Currently, scholars both domestically and internationally have conducted extensive theoretical research and laboratory tests on the issue of cracking in layered rock masses. One of the earliest theories on surface cracks of layered materials is the stress shadow theory (Lachenbruch, 1961). The theory suggests that the horizontal stress σx in the layer causes the crack, and the crack spacing should be slightly greater than or equal to the crack height. Hobbs (Hobbs, 1967) proposed a three-layer model of ‘two hard and one soft’ to analyze the crack saturation phenomenon of stratified rock mass for the first time. This stress transfer model enables the study and analysis of the equally spaced fracture phenomena of layered materials. The energy balance theory (Thouless et al., 1992) is a common approach for studying crack spacing in layered materials. According to this theory, crack development requires energy, which is provided by the external load. The theory typically provides a lower limit on the fracture spacing. Nahta R. and Moran B. (Nahta and Moran, 1995). used energy release rate theory and fracture mechanics to calculate planar and axisymmetric surface cracks in a finite domain. It is found that the initiation and spacing of new cracks are affected by external load, geometrical properties of layered materials, elastic modulus of layered materials, and surface fracture toughness of the surface layer. The research results can be considered fundamental to the theoretical basis of surface crack research. Jiang et al. (2011) investigated the two-dimensional surface periodic cracking phenomenon of solids by applying the minimum energy principle and conducting water quenching experiments on high-temperature ceramics. They found that the system’s energy always approaches the minimum to achieve a stable state, resulting in surface cracking. Regarding experimental research, Thouless (1990); Thouless et al. (1992) discovered the phenomenon of parallel, equally spaced cracks in brittle films under tensile force. Rives et al. (1994) simulated the formation of fractures in layered rocks by generating edge cracks in the brittle coating on the base layer. They identified three possible sources of stress for the second group of joints and noted that the combination mode of the two groups of joints would be affected by the initial joint shear strength. Wu and Pollard. (1995) conducted four-point bending experiments on PMMA substrates using brittle coating materials. They described and compared two methods for measuring crack spacing and proposed the concept of crack saturation phenomenon. This phenomenon refers to the tendency of crack spacing to remain constant as the applied strain increases. Zhang and Zhao (2002) conducted experiments to study the tensile residual stress of double-layer materials. They concluded that cracks propagate from the surface layer to the interface of the two-layer materials and terminate at the interface. These studies aim to investigate the regularity of cracking in layered materials and to understand the morphology of cracking in such materials by describing the cracking morphology of solid models. The experiments are often a summary of the crack morphology of a specific solid model due to the complexity of actual model building. The singleness of the model in these studies makes it difficult to study the differences in the cracking of the layered materials with different factors.
The use of numerical simulation technology allows for the study of the impact of various factors on the fracture mode of layered rock by adjusting different parameters. In recent years, numerical simulation methods have been used to study the fracture problem of layered rock mass based on the discontinuous medium theory (Hornig et al., 1996; Jing, 2003; Federl and Prusinkiewicz, 2004; Tang et al., 2017) due to the characteristics of discontinuity and anisotropy of composite rock mass. T. Bai (Bai et al., 2000a) used the finite element program FRANC to simulate the influence of factors such as elastic modulus and prefabricated defect depth on crack growth. They proposed a function for the ratio of crack spacing to the thickness of the cracked layer. Li (Li and Yang, 2007) analyzed the stress between rock layers with ANSYS finite element and found that cracks first formed at the interface of rock layers. Tang (Tang et al., 2008) used the Realistic Failure Process Analysis (RFPA) system to study the phenomenon of equal interval fractures in rock strata. They proposed that the interval fracture phenomenon can be divided into three types: strip interval fractures, network interval fractures, and ring interval fractures. Schopfer (Schopfer et al., 2011) simulated the interval fracture process and analyzed the stress in the fracture process using a two-dimensional discontinuous mechanical model suitable for layered rocks. Chang (Chang et al., 2016) investigated the fracture failure process of cracks in layered rock mass by creating a numerical model of double-layer rock and introducing a cohesive zone model (CZM) between the two layers of rock. The use of numerical simulation has become a crucial tool for comprehending the interaction mechanism between rocks and structures in the fields of rock mechanics and structural mechanics.
So far, although the research on the fracture phenomenon of stratified rock mass has been carried out for several decades, most of it has focused on the homogeneous model. Due to limitations in the stress state analysis method, it has been difficult to analyze the entire process of crack propagation. Furthermore, the majority of existing studies have primarily focused on the phenomenon of crack saturation and have concentrated on the analysis of fracture stress in the weak layer of two-dimensional three-layer materials (Lee and Freund, 1990; Zheng et al., 2014; Jiao et al., 2015; Cong et al., 2021; Cong et al., 2022). Few studies have investigated the development law of surface cracks in double-layer rock mass and the factors influencing surface crack generation and expansion from a three-dimensional perspective. There is a lack of discussion on the crack development state of the physical properties of layered rock itself.
Based on the above description, this paper utilizes numerical simulation based on mesoscopic statistical damage mechanics to investigate the factors influencing rock cracking under three-dimensional conditions. The simulation examines the surface crack morphology of a double-layer rock mass under varying layer thickness, scale, homogeneous degree, loading methods, and single step loading. Quantitative statistics were conducted on the simulated fracture network using PCAS software, based on the number and area of cracks, crack spacing, and other evaluation indexes. The analysis examined the impact of various factors on the development form and degree of surface cracks in layered rock masses. The aim is to provide optimization suggestions for preventing cracks in practical engineering and to establish a theoretical basis for studying the cracking and peeling of cultural heritage such as murals and ancient sites.
This study utilized the three-dimensional Realistic Failure Process Analysis system, RFPA3D. RFPA3D is a system for analyzing real damage processes based on the finite element method and elastic damage theory (Tang, 1997). By introducing the concepts of mathematical continuity and physical discontinuity, the numerical method is simplified in discontinuous mechanics and fracture mechanics to fully consider the influence of non-uniformity and nonlinear factors. At the micro level, the text adopts the unit elastic brittle fracture criterion and considers material heterogeneity through statistical methods. This transforms the complex nonlinear mechanical problem at the macro level into a simple elastic brittle force problem at the micro level (Zhang et al., 2005). RFPA3D also considers material non-uniformity through statistical methods, with material properties following a Weibull distribution in space (as shown in Figure 1A). The equation of Weibull statistics is as Eq. 1:
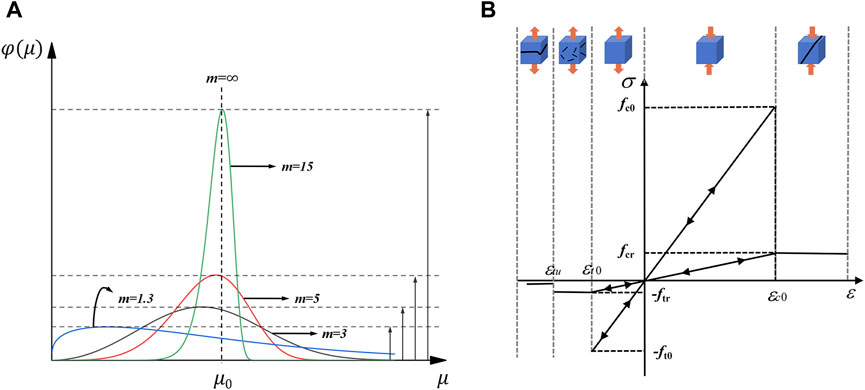
Figure 1. Weibull distribution curves and mesoscopic unit constitutive model: (A) Weibull probability distribution curves with same μ0 but different m; (B) Damage constitutive relation of mesoscopic unit.
Where
Figure 1A shows that the distribution of the elastic modulus of each element becomes more uniform as the m value increases according to the Weibull function distribution. Conversely, the smaller the m value, the more uneven the distribution of the element’s elastic modulus. The shape parameter m of the Weibull distribution function represents the homogeneous degree coefficient of the material, and its size reflects the uniformity of the rock medium (Tang, 1997).
Another important feature of RFPA3D is the analysis of the 3D real fracture process. The failure of rock is primarily caused by crack initiation and expansion due to stress damage to its internal structure (Murti and Valliappan, 1986; Song and Paulino, 2006; Zhang and Wong, 2012; Toolabi et al., 2013; Gao and Ghassemi, 2020). The use of microscopic damage mechanics is an effective approach to studying the weakening of rock’s internal structure. At the microscopic level, rocks are subject to elastic brittleness failure (Chang et al., 2015). The numerical model in Figure 1B uses the elastic damage constitutive relation under uniaxial stress to explain the deformation and failure of mesoscopic elements.
Based on the principles of rock mechanics, elements are defined with positive values for compression and negative values for tension. Initially, the meso-element displays elastic behavior. As the strain (stress) of the element reaches the elastic critical value that the element can withstand, damage begins to accumulate. The maximum tensile strain criterion and Mohr-Coulomb criterion are commonly used to determine the critical value of damage. From a damage mechanics perspective, the constitutive relationship of the damaged material is obtained by considering the damage process and applying the strain equivalence principle, for the maximum tensile strain criteria, based on Eq. 2:
Where E0 is the initial elastic modulus of the material; D is the damage variable. D = 0 represents the state of the material is not damaged, and D = 1 represents the state of the material is completely damaged.
When the tensile stress of the mesoscopic element exceeds the maximum tensile strength of the element, the damage variable is expressed as Eq. 3:
Where
In the three-dimensional state, the equivalent strain
Among them,
In addition to determining tensile failure, it is also necessary to assess whether the unit has experienced shear failure. It is assumed that the shear damage evolution is only related to the maximum compressive principal strain for the meso-element in the three-dimensional stress state. The damage threshold can be calculated using the Mohr-Coulomb criterion. When the stress value of the element meets the compression-shear criterion of Eq. 6, the element can be considered to have experienced compression-shear failure.
The corresponding damage variable D can be expressed as Eq. 7:
Where
For brittle materials, such as rocks, macroscopic tensile failure is more likely to occur than compressive failure. This is also true at the meso scale, so the tensile failure criterion is preferred for the unit failure (Telles and Guimaraes et al., 2000). Therefore, RFPA3D can simulate the progressive failure process of heterogeneous elastic-brittle materials, such as rocks.
Tang C. S. et al. (2008) researched the process of soil shrinkage cracking and identified key control factors by measuring the cracks. Fracture measurements can be obtained through PCAS analysis of pore and particle digital processing system, which can be used to evaluate the influencing factors of rock surface cracking. PCAS is an efficient and feasible system for quantitative analysis of digital images of rock microstructure based on digital image segmentation and recognition of pores and particles, geometric measurement, and statistical methods (Tang et al., 2011a; Tang et al., 2011b). The system distinguishes pores and particles by different colors, and extracts and analyzes cracks in images after binarization (Liu et al., 2011). The classical seed algorithm (Yu et al., 2010) can be used to identify independent pores and clutter in the image. That is, when there is a block area that is less than the set minimum pore value, the block will be removed as a clutter. After processing by the above digital image recognition technology, geometric parameters such as fragment area and circumference, as well as quantitative statistical parameters such as the fractal dimension of the pore particle system, can be obtained through matrix calculation (Liu et al., 2011; Liu et al., 2013).
The processing diagram of the PCAS system is presented in Figure 2. The system begins by importing surface crack images (Figure 2A). Next, it distinguishes the crack matrix from the crack by using color binarization processing of the imported images and constructs the crack network (Figure 2B). Finally, the system identifies different cracks based on the structure of the fracture network and uses different colors to distinguish them (Figure 2C). Finally, statistical analysis produces crack evolution indices, such as surface crack rate, crack node number, and fractal dimension. These cracking statistics can be used to select appropriate and regular cracking indices to analyze the impact of different factors.
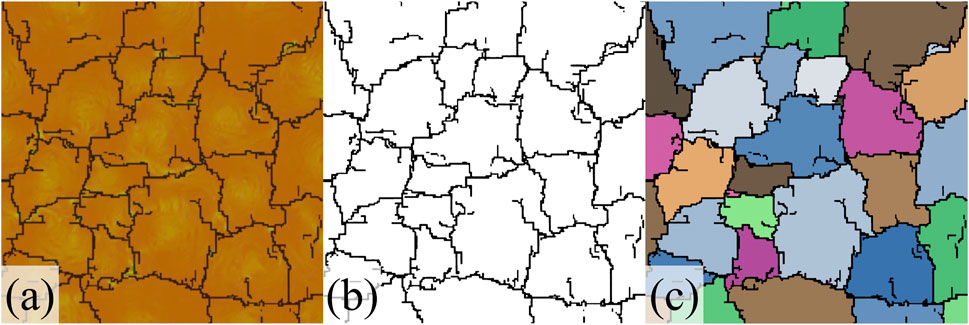
Figure 2. Schematic diagram of crack image processing by PCAS system: (A) Crack image import; (B) Binarization processing; (C) Crack identification and fracture block division and statistics.
The surface fracture patterns of layered materials are primarily parallel cracks and network cracks, as demonstrated by natural phenomena and experimental observations. For instance, rocks in Earth’s crust exhibit evenly spaced cracking (Gross, 1993), while soil displays mesh cracking (Sherard, 1975; Bronswijk et al., 1995). To reduce the influence of the interlayer, and approach reality more closely, a double-layer composite plate model was selected (Helgeson and Aydin, 1991). The top layer represents the fracture layer, while the bottom layer represents the base layer. This approach is based on the theory of composite materials mechanics (Hobbiebrunken et al., 2006; Koyanagi et al., 2014; Mortell et al., 2014). When the surface crack is reproduced in 3D in RFPA3D (Ding et al., 2014), it is important to control the occurrence of cracks in the surface layer and limit them in the base layer. To achieve this, the surface layer has a lower homogeneity degree compared to the bottom layer, while the strength and Young’s modulus of the base layer are several times higher than those of the bottom layer. Under the same load conditions, the surface layer will experience greater tensile stress, causing it to break preferentially. The material parameters for each layer are listed in Table 1.
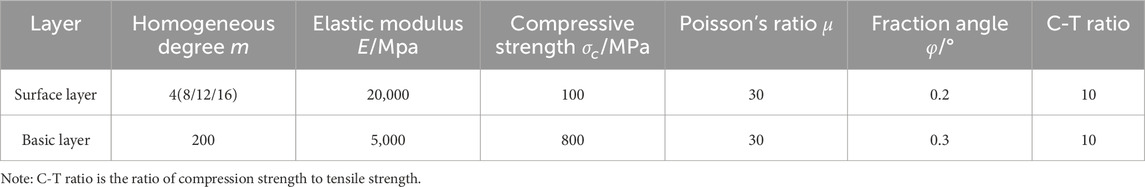
Table 1. Material mechanics model parameters.
The base model has a basic thickness (T) of 15 mm and a surface thickness (t) of 5 mm. To ensure accurate calculations, the plate model’s side length is selected as 200 mm, matching the number of software elements with the length. The model is divided into 800,000 (200×200×20) 8-nodal hexahedral elements, each composed of small cubes of 1 mm. Simulations are carried out under quasi-static loading conditions with constant displacement increment, where λ is defined as the loading ratio of displacement increment in the y direction to that in the x direction (λ = Δy/Δx). In addition to the influence of loading ratio of direction on surface cracks, the loading ratio λ = 1 is used in the basic models. According to the previous simulation results, when the displacement increment of loading per step is set to Δx = Δy = 0.003mm/step and the total loading step is 40, the mesh crack development pattern is the best, and the above loading values are used for simulation. The model’s structure and boundary conditions are illustrated in Figure 3.
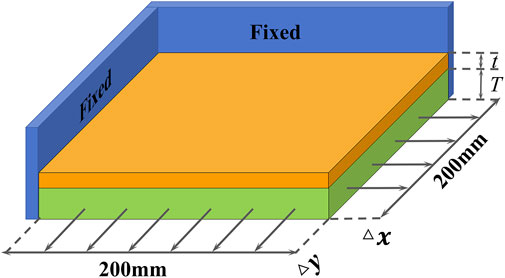
Figure 3. Dimensions and boundary conditions of a double-layer plate model.
The results suggest that several factors influence the development of surface fractures in stratified rock masses, including the homogeneous degree, thickness of fracture layers, model scale, loading ratio of direction, and loading per step. Among them, the homogeneous degree, fracture layer thickness and model scale are the parameters of rock mass itself. The homogeneous degree m represents the disorder of the primitive distribution. Due to the varying elastic modulus of each microelement, their deformation sequence differs. The microelement with the lowest elastic threshold undergoes phase transition first, causing a decrease in the elastic modulus of the corresponding element. This, in turn, leads to the surrounding elements sharing the external load, resulting in a secondary stress distribution. The homogeneous degree of rock influences the development of rock damage, especially for stratified rock with differences between the upper and lower layers. Therefore, homogeneity is selected as a factor and m = 4, m = 8, m = 12 and m = 16 are taken.
Several studies indicated a functional relationship between the ratio of fracture spacing and fracture layer thickness (Bai et al., 2000b). The crack spacing is defined as the vertical distance between two adjacent cracks within the same cluster of cracks and serves as a fundamental physical parameter for characterizing cracking. The data from over 4,000 fracture spacing measurements in 11 outcrop profiles of layered sedimentary rocks in the western Sichuan foreland basin, Ordos basin, and Kuqa foreland basin indicate that fracture spacing is proportional to the thickness of fractured rocks, with a ratio mainly distributed between 0.1 and 10. This suggests that the impact of fracture layer thickness on surface cracking cannot be disregarded. Based on the basic model, the thickness of the base layer T = 15 mm is kept unchanged. Four different fracture layer thickness models of t = 5 mm, t = 10 mm, t = 15 mm, and t = 30 mm are established to investigate the impact of the fracture layer thickness.
When studying the strength of materials, it is important to consider the size effect. This effect refers to the fact that smaller materials have a lower probability of defects, resulting in higher strength. It is crucial to acknowledge the size effect, especially for heterogeneous materials. The rock mass contains micro-cracks, voids, and joints, and its material organization is non-uniform and non-continuous. Considering the existence of the size effect, it is evident that the model size also affects the fracture of layered rock. To study the comprehensive deformation of layered composite rock mass, it is necessary to increase the loading size (Zhou et al., 2004). Therefore, a minimum side length of w = 80 mm was selected. The maximum side length is set at w = 300 mm due to numerical calculation limitations. The transition is set at w = 150 mm. Table 2 shows the model parameters considering these influencing factors.
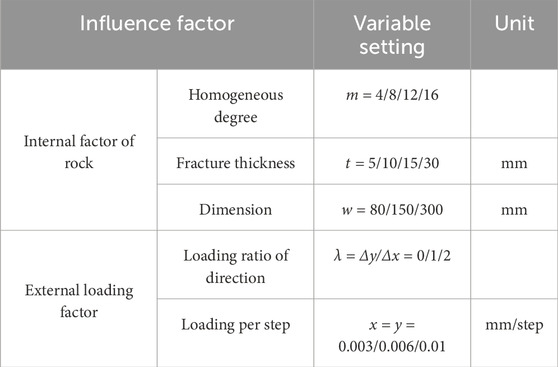
Table 2. Adjustment of influence factors.
Loading ratio of direction and loading per step are external factors influencing the loading conditions. Changes in the loading mode can result in various complex alterations in the force distribution, based on previous research (Olson, 2004; Li and Wong, 2012), continuous transformation of crack morphology primarily depends on variations in principal stress ratio (λ = σ2/σ1), which is manifested through changes in loading loads applied from different directions within rock masses during practical engineering applications. Sometimes crack propagation in a particular direction needs to be controlled in some engineering. Therefore, this study investigates how rock cracking is influenced by the loading ratio of direction or rather by the ratio of total displacement increments along y and x directions (λ = Δy/Δx). During simulation, a constant total displacement Δx of 0.012 mm is maintained for all steps while Δy varies as follows: 0 mm, 0.012 mm, and 0.024 mm respectively. The loading per step represents the speed of loading in engineering. In the actual construction process, some parts of the rock mass will inevitably be subjected to tensile action, such as the top rock mass bottom and eccentric compression to support the tensile side of the coal pillar during tunnel excavation. Too fast excavation of rock mass, or too fast change of overlying load, will affect rock mass cracking. Therefore, we choose the loading per step as an external loading factor in the study of rock cracking. Based on the basic model, the total loading capacity is guaranteed to remain unchanged. The loading per step is set as Δx = Δy = 0.003mm/step (40 steps), Δx = Δy = 0.006mm/step (20 steps) and Δx = Δy = 0.01mm/step (12 steps) respectively. The specific loading scheme is shown in Table 3.
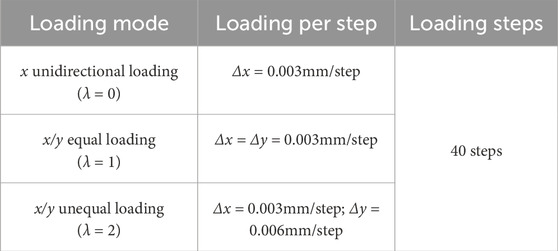
Table 3. Numerical simulation scheme for different loading ratios of direction.
RFPA3D simulated the crack phenomenon of the three-dimensional double-layer flat plate model under bidirectional tension. PCAS quantized the results and produced a fracture comparison diagram for the model with four different homogeneous degrees m, as shown in Figure 4.
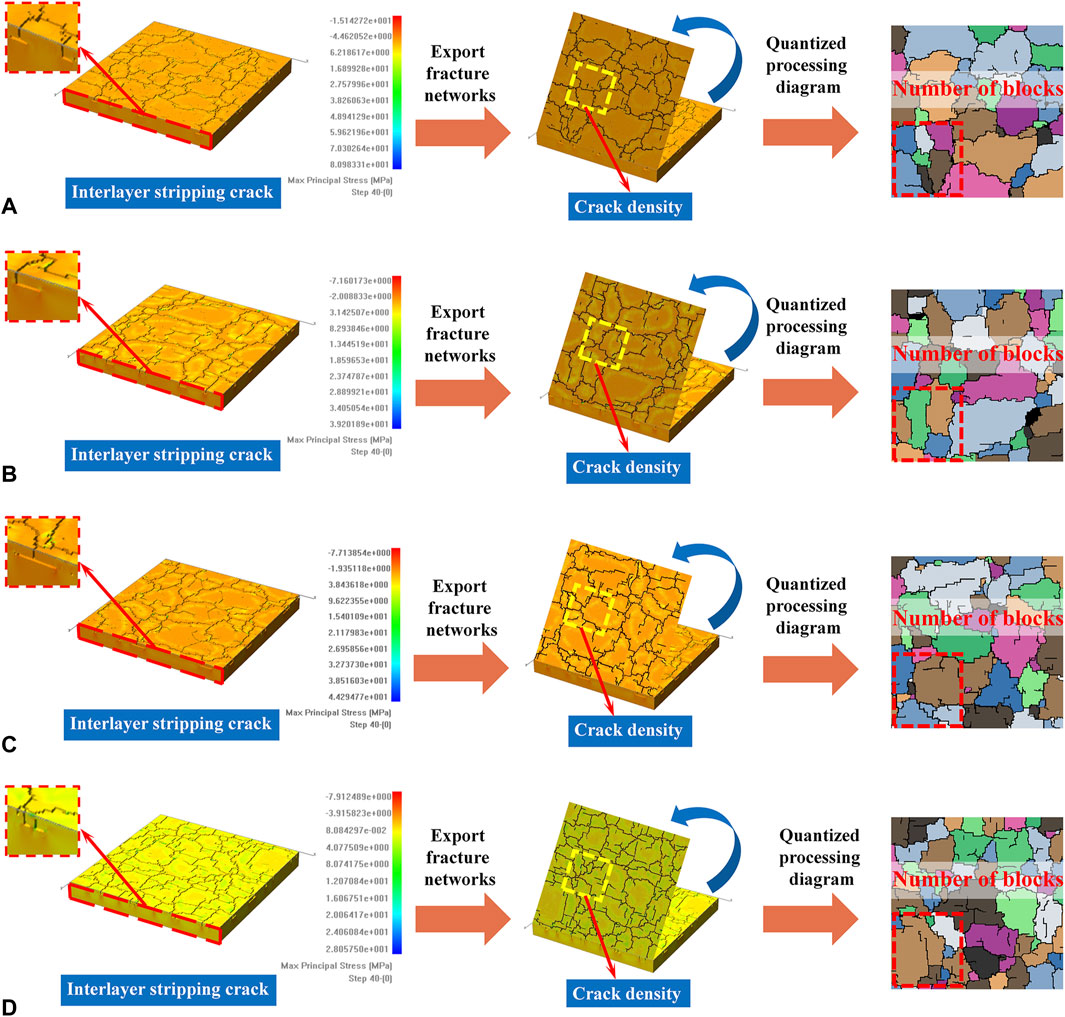
Figure 4. Simulation results and quantization processing diagram of different fracture layer homogeneous degree m models: (A) m = 4; (B) m = 8; (C) m = 12; (D) m = 16.
Figure 4 shows that mesh cracks are generated in all four models under bidirectional equal incremental tensile loads, regardless of the homogeneous degree. As the homogeneous degree increases, the shape of the mesh crack becomes closer to a regular polygon. The number of polygon cracks and the fracture degree of the model surface layer increase with the homogeneous degree of the layer rock. Furthermore, as the homogeneous degree increases, the crack area of the model decreases, while the areas of different crack sizes become more equal and the spacing between cracks decreases. This indicates that higher homogeneity results in more uniform surface cracking, denser crack distribution, and more severe cracking.
Simulation results were obtained by varying the thickness of the model’s surface fracture layer under a specific total loading condition. The results are presented in Figure 5.
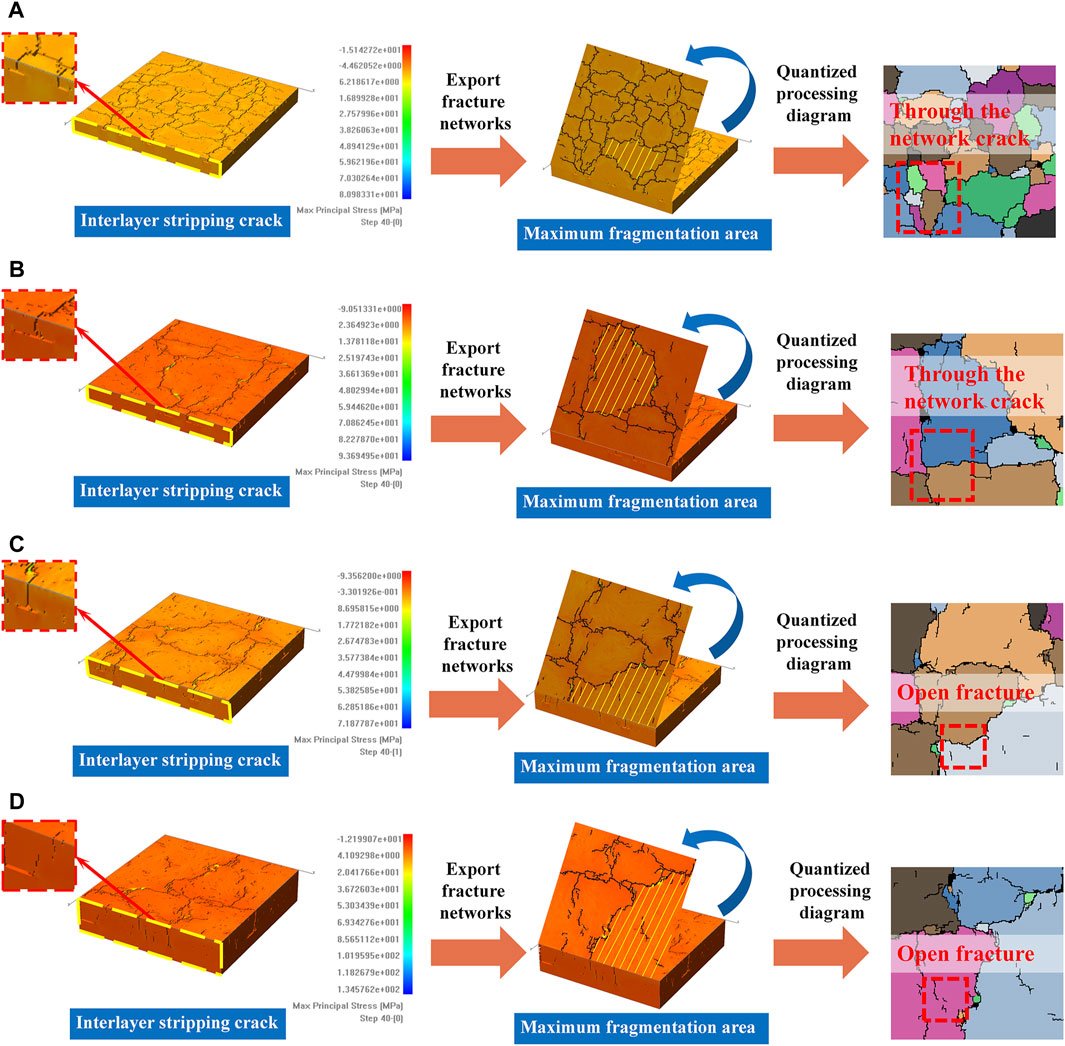
Figure 5. Simulation results and quantization processing diagram of different fracture layer thickness t plane models: (A) t = 5mm; (B) t = 10mm; (C) t = 15mm; (D) t = 30 mm.
Figure 5 shows a significant change in the development of surface cracks with the thickness of the broken layer. As the thickness of the fracture layer increases, the number of surface cracks decreases and the spacing of cracks increases. This is in line with the understanding that the spacing of cracks in layered materials is typically positively correlated with the thickness of the broken layer (Mandal et al., 1994). Furthermore, it was observed that the number of surface cracks and fractures decreased significantly when the thickness of the fracture layer increased from t = 5 mm to t = 10 mm. As the layer thickness decreased, the impact of layer thickness on crack growth stabilized. Section 4.2 details the critical layer thickness ratio that affects cracking.
Three-dimensional double-layer flat models of varying sizes were simulated based on Table 2. The surface crack morphology and treatment results for each model are presented in Figure 6.
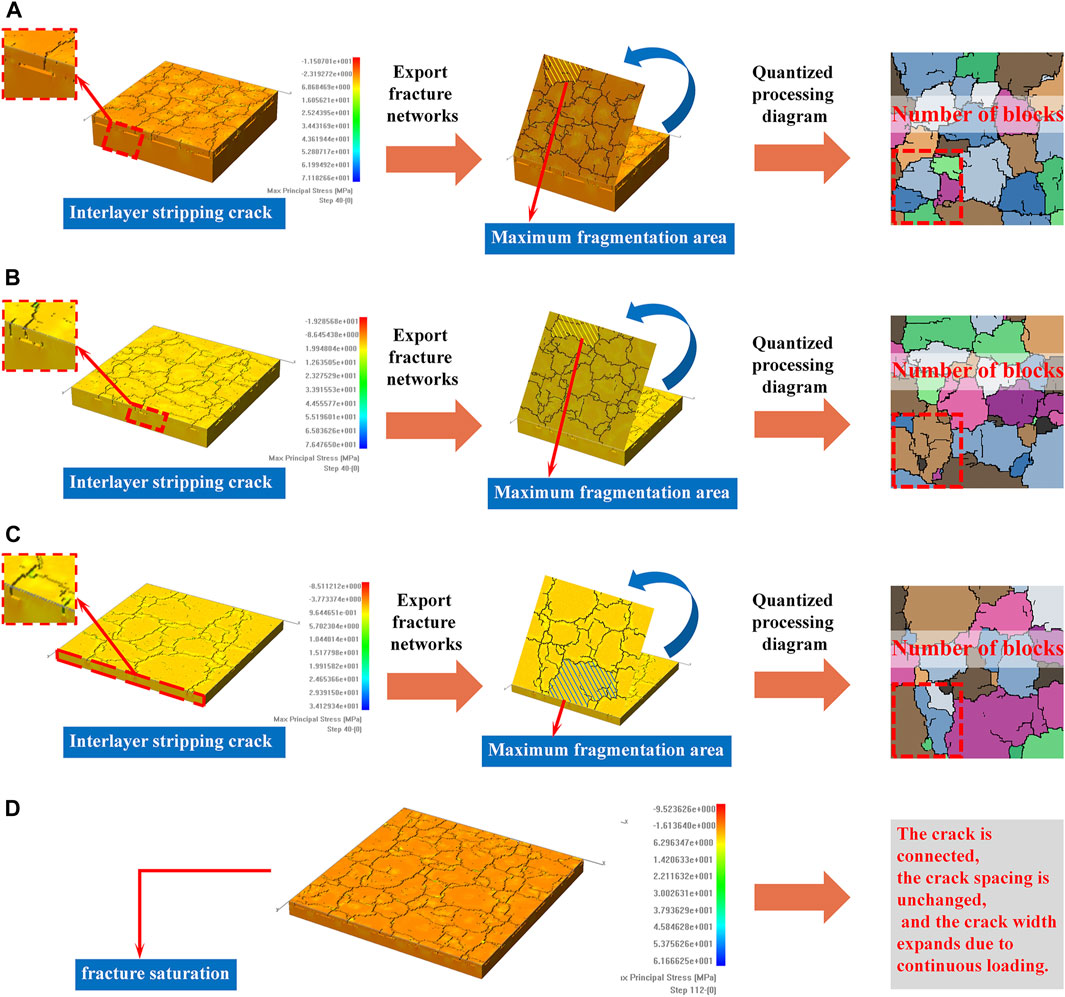
Figure 6. Simulation results and quantization processing diagram of different sizes w models: (A) w = 80 mm; (B) w = 150 mm; (C) w = 300 mm; (D) w = 300 mm model is broken when it reaches crack saturation.
Observing the simulated crack network, it is evident that the interior of all three models, despite their different sizes, contain network cracks. However, due to the influence of the plane finite boundary, the crack development is limited by four boundaries and cannot form a complete region. Furthermore, the fracture layer’s lack of homogeneity results in not all models exhibiting crack saturation, and the cracks are not entirely connected. When the plate model w = 300 mm is stretched further, it is difficult to form a new crack under continuous loading when the opening crack is through. At this time, the model reaches the crack saturation state, as shown in Figure 6D. Based on Figure 6, the maximum crack area of models with different sizes tends to increase, while the minimum crack area enclosed by surface cracks of each size model remains nearly equal within the allowable error range. As the size w of the plate model decreases, the crack growth rate accelerates, leading to more instances of crack initiation, propagation, penetration, and interlayer stripping. In the plate model with a width of w = 300 mm, there is almost no interlayer cracking. However, in the simulation results with a width of w = 80 mm, interlayer peeling cracks can be observed. The simulation results show that the degree of crack development decreases as the size of the plate model increases.
The simulation results of the plate model with different loading ratios of direction in Figure 7 show that parallel equally spaced cracks occur in the model under x-unidirectional loading, and network cracks occur in the model under λ = Δy/Δx = 1 and λ = Δy/Δ x = 2 tensile conditions.
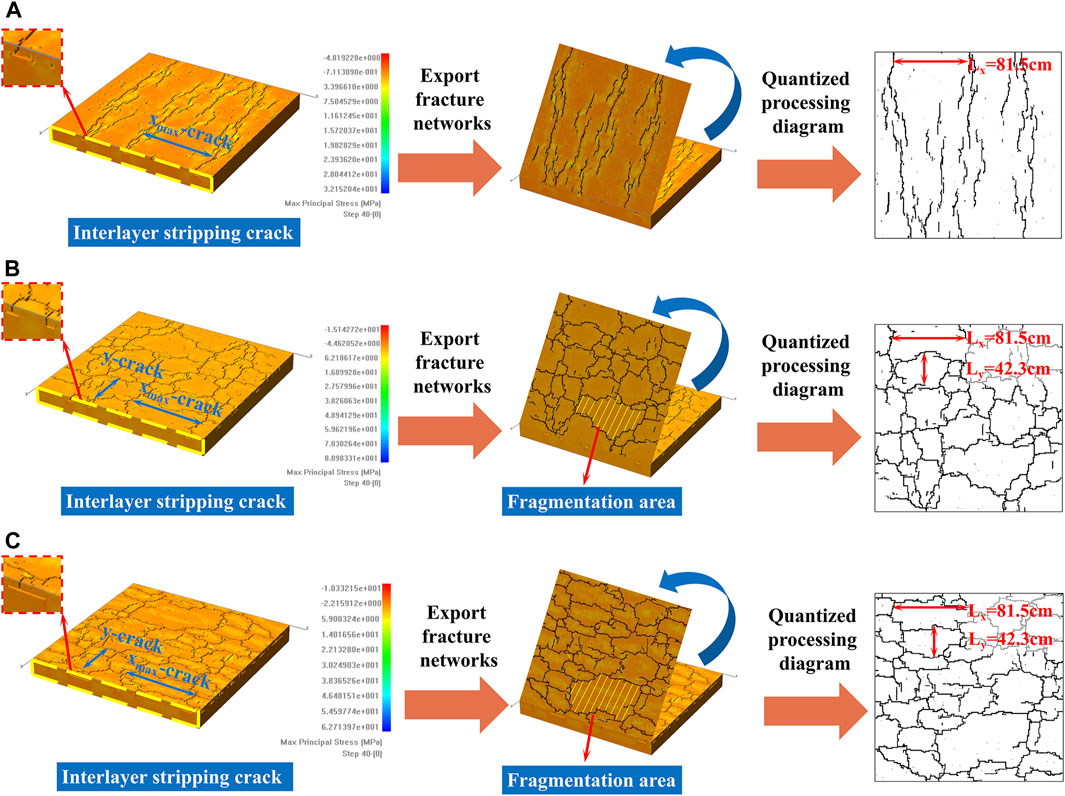
Figure 7. Simulation results and quantitative processing diagram of different loading ratios of direction models: (A) x unidirectional loading; (B) x/y bidirectional equal loading; (C) x/y bidirectional unequal loading.
Upon comparing the simulation results of λ = 1 and λ = 2 models, it is evident that the crack development pattern and crack block size distribution are similar. In λ = 2, the total loading in y direction is doubled compared with that in λ = 1, so the number of x-direction cracks in the vertical y direction is significantly increased. The number of cracks loaded along y direction is basically the same as the simulation result of λ = 1. It is worth noting that no matter how the loading load changes in the y loading ratio of direction because the loading load in the x direction remains unchanged, the maximum crack spacing in the x direction remains unchanged in the simulation results of the three models, all of which are 81.5 cm. Additionally, the vertical cracks in the x direction appear in the same position and are not affected by changes in the loading load in the y direction.
RFPA3D simulated the cracking state of a three-dimensional double-layer flat model using three different increments per step, as shown in Table 2. The simulation results are presented in Figures 8A–C, with increments ranging from small to large. The Figure 8 shows that, in the case of final equal stretching, the cracks on the surface of the model become denser as the increment at each step increases. As each step is incremented, the number of split blocks increases and the area decreases. Additionally, small split blocks appear in both models with large and small increments. The increase in the number of cracks is caused by the further penetration of cracks in large cracks due to the increase in increments per step. The study indicates that the minimum fracture spacing does not always appear simultaneously with fracture saturation, the minimum fracture spacing can occur before the fracture saturation. Therefore, the increment of each step does not affect the minimum crack spacing, but only accelerates the crack expansion speed.
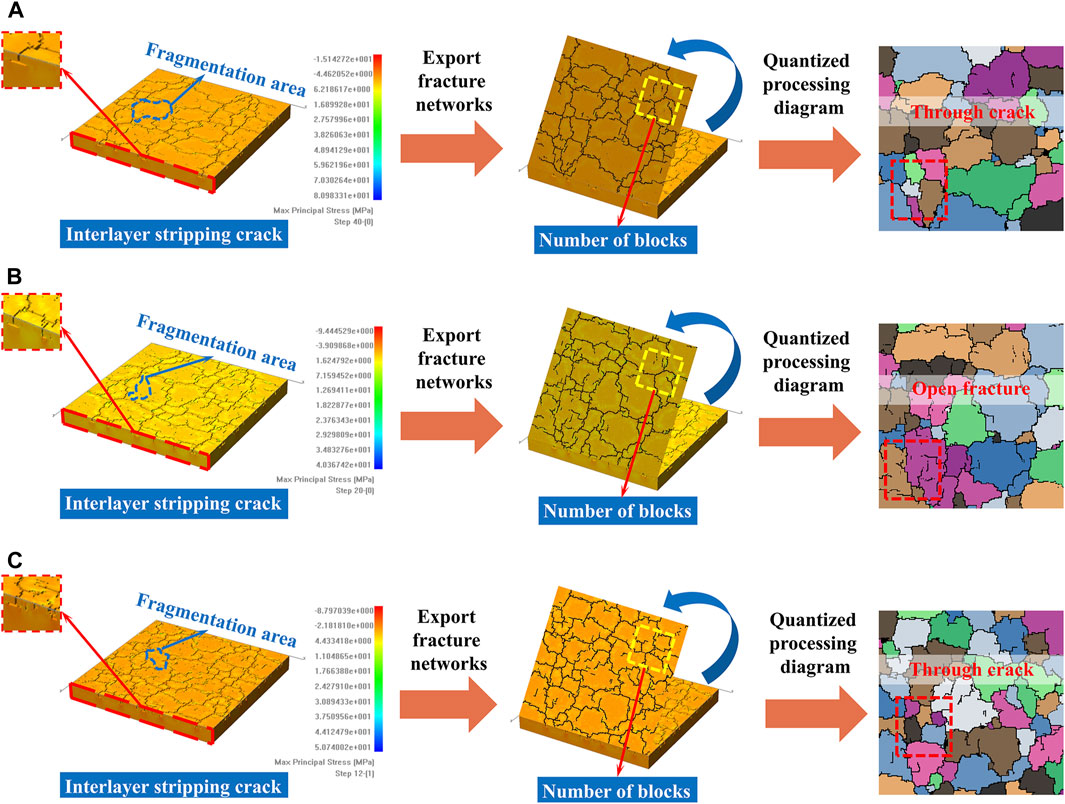
Figure 8. Simulation results and quantization processing diagram of different loading per step models: (A) Δx = Δy = 0.003 mm/step, 40steps; (B) Δx = Δy = 0.006 mm/step, 20steps; (C) Δx = Δy = 0.01 mm/step, 12steps.
To calculate the number of polygonal cracks and their average area while eliminating the influence of model scale, we divided the obtained average crack area by the model surface area. This resulted in the standardized average polygonal crack area, a dimensionless parameter ranging from 0 to 1, which we denote as the normalized average crack area (Ma et al., 2021). Figure 9A displays the changes in two crack evaluation indices: the number of cracked blocks and the normalized average cracked block area, as a function of the mean degree m of the fractured layer.
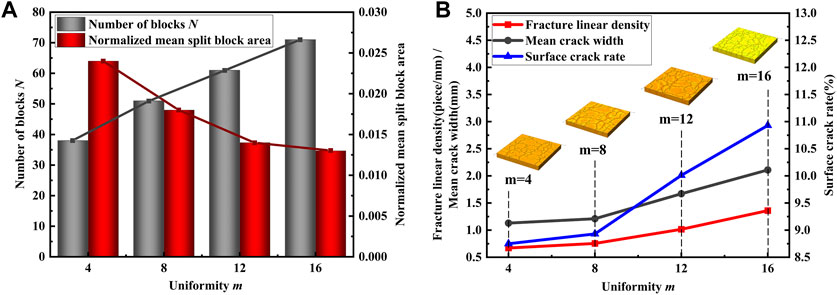
Figure 9. Effect of fracture layer homogeneous degree m: (A) Effect on the number and normalized mean fracture area; (B) Effect on fracture development degree under bidirectional tensile conditions.
Figure 9A shows a linear increase in the number of cracks with an increase in the homogeneous degree of the fracture layer. Thus, a good linear relationship exists between the number of cracks and the homogeneous degree 'm' of the double slab rock mass under the condition of bidirectional equal stretching and a total increment of 0.120 mm. The statistical analysis yielded the following linear fitting function relationship, specific function expressions such as Eq. 8:
Where
The sum of squares for the linear fitting residuals is 2.7, the coefficient of determination (R2) is 0.99548, and the adjusted R2 is 0.99321. These values indicate that the model is not overfitting. The linear relationship between the uniformity of the rock mass and the number of fractures is nearly complete positive correlation, which lends support to the conclusion that the two changes are proportional. When the homogeneous degree m = 0, the number of cracked blocks is 28. This suggests that even if the surface rock mass is very uneven, it will still crack due to stress. Currently, the number of cracked blocks has a minimum value based on the homogeneous degree, which is influenced by other factors such as loading amount. Additionally, the number of cracks increases significantly with the mean degree, suggesting that higher homogeneous degree tend to connect cracks to form a network rather than expanding the width or forming open cracks. From a stress transfer perspective, there exists a transition region between different phases. Within this region, mechanical properties differ, and the strength and distribution of components change. As the homogeneous degree increases, the properties of the primitive become closer and stress transfer becomes more uniform, reducing the likelihood of stress concentration caused by frequent conversion and transfer of strong and weak primitives. However, the development of surface cracks increases with the homogeneous degree, while interlayer cracks do not progress further.
The presence of cracks indicates that the rock mass has undergone cracking. Relevant statistics, such as the number of cracks, average crack width, and surface crack rate, should be considered as evaluation indexes for cracks. Figure 9B illustrates the variation of these indexes with the homogeneous degree. Fracture density and surface fracture rate are indicators of fracture development, both of which increase with the homogeneous degree (m). This suggests that higher homogeneity leads to greater fracture development. The linear density of fractures and the average fracture width are approximately parallel, indicating that the effect of the homogeneous degree on crack width expansion is similar to its effect on crack number increase. As the homogeneous degree increases to 8, the linear density and average crack width of surface cracks increase linearly with the increase of the homogeneous degree m. Specifically, the linear density of fractures and the average fracture width double with every increase of 4 degrees of homogeneity. It was observed that the proportion coefficient between them and the homogeneous degree is approximately k = 0.065.
For fractal dimension of fracture (Lung and Wang, 2000; Huang et al., 2022), there is no clear limit that m = 8. The relationship between the fractal dimension of fracture and the homogeneous degree m is significant. The fractal dimension increases with an increase in m, indicating a positive correlation between spatial complexity and the homogeneous degree of the crack structure. The complexity of surface cracking in layered rock mass is directly determined by the degree of homogeneity, regardless of loading and other factors.
To assess the impact of surface failure layer thickness on surface crack development, we calculated the number of polygonal crack blocks (N) and the corresponding normalized average crack block area (Sf) for various layer thickness models under tensile load.
Figure 10A illustrates the relationship between the ratio of surface layer to base layer, referred to as the layer thickness ratio (η), the number of cracks (N), and the area of cracks (Sf). The results indicate that when η is 2, the normalized average fragmentation area (Sf) is 10 times greater than when η is 0.33. The relationship between Sf and the layer thickness ratio is logarithmic. As the layer thickness ratio increases, the number of cracks also increases. Consequently, the average area enclosed by the cracks decreases. With the increase of layer thickness ratio η, the number of polygonal cracks decreases gradually, and the crack spacing increases. This is consistent with the phenomenon of crack saturation. With the increase of layer thickness, the fracture spacing increases and the number of cracks decreases. In particular, when η increases from 0.33 to 0.67, the number of polygon cracks decreases most obviously. Correspondingly, the mean fragmentation area increases with the increase of η. It is observed that the critical value of layer thickness influence is about η = 0.67. When η is less than 0.67, the layer thickness ratio has a significant effect on the surface fragmentation density. When η is greater than 0.67, the curve tends to be smooth, and the influence of layer thickness decreases continuously.
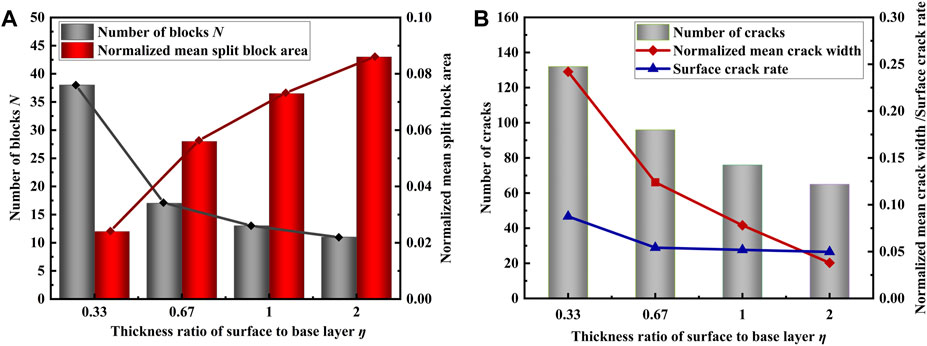
Figure 10. Effect of fracture layer thickness: (A) Effect on the number and average area of polygon cracks; (B) Effect on fracture number and normalized mean fracture width.
Figure 10B shows the statistical results of physical quantities related to cracks in layered rock mass under tensile load. The pattern is similar to that of reticular fissures; as the layer thickness ratio η increases, the number of cracks gradually decreases. Additionally, the crack width and surface crack rate decrease with the increase of layer thickness ratio η. When the layer thickness ratio η is less than 0.67, the surface crack rate decreases significantly with an increase in layer thickness ratio. The layer thickness ratio also has a great influence on the number of fractures and the normalized average fracture width. However, when η is greater than 0.67, the surface crack rate remains unchanged with a change in layer thickness. The correlation between the number of cracks and the normalized crack width and layer thickness is roughly linear, but the slope is lower than before η = 0.67. It is reasonable to assume that there is a critical value of layer thickness ratio that affects fracture development, and this critical value is close to η = 0.67.
To avoid the fixed cracking index difference caused by the size itself, the number of cracked blocks can be divided by the corresponding model area to obtain the number of cracked blocks in the unit area N, in units/mm2. Use N as an index to compare the variation of cracked blocks in different scales and summarize the trend of cracked blocks per unit area. For the independent variable of the model’s side length, we can divide the side length (w) by the surface failure layer thickness (t) to obtain the failure layer thickness ratio (W). This eliminates the unit effect and allows for a more accurate analysis. The values of W and w change proportionally, so subsequent analysis is not affected. The model’s side lengths of w = 80 mm, w = 150 mm, and w = 300 mm correspond to W values of W = 16, W = 30, and W = 60, respectively. Figure 11A illustrates the relationship between the number of cracked blocks (N), the average area per unit area (Sf), and the plane size, as well as the ratio of the cracked layer thickness to W.
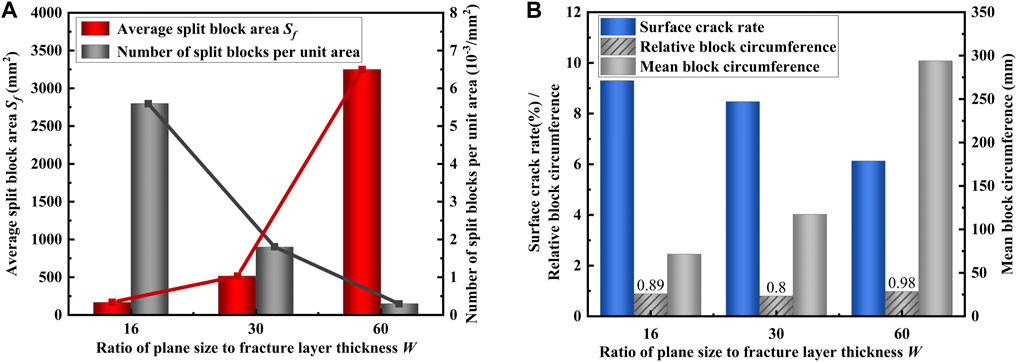
Figure 11. Effect of different plane size and failure layer thickness ratio W on cracking: (A) Effect on cracking block; (B) Effect on fractures.
Figure 11A shows that as the plane scale increases, the number of cracked blocks per unit area (N) decreases, and the average area of the cracked blocks increases accordingly. To determine the plane size (W), double the different dimensions in turn starting from the minimum model size of W = 16. The middle plane size should be doubled to W = 32. However, due to the excessive number of units in the modeling process, it is not feasible to perform calculations. Therefore, the second model, W, is set to 30. Based on this observation, it is found that the average number of cracked blocks decreases by about half as the size increases. When W is increased from 30 to 60, the plane size is doubled, the number of cracks is also doubled, and the corresponding average crack area increases in a functional relationship. The trend of average fragmentation area becomes more apparent with the increase of W, and the degree of increase is also greater.
Figure 11B illustrates the correlation between the ratio W of various plane dimensions to the thickness of the failure layer and the corresponding surface crack rate and average crack block circumference. It has been observed that the rate of surface cracking decreases as the plane size and the ratio of fracture layer thickness to W increase. This indicates that, under equal stretching conditions, larger rock scales result in slower fracture development and a decrease in the degree of fracture development as the rock scale expands. Figure 11A concludes that as the number of polygonal cracks decreases, the corresponding crack block area and average crack block circumference increase. This speculation is confirmed by the growth trend of the average crack block circumference in Figure 11B. As shown in Figure 11A, the number of cracked blocks decreases as the scale increases. Therefore, the growth trend of the circumference should slow down. However, in Figure 11B, the change in circumference increases despite the decrease in the number of cracked blocks. The influence of scale cannot be ignored. Therefore, we introduce the concept of relative mean fragment circumference. This dimensionless parameter is obtained by dividing the mean fragment circumference by the model side length. When the ratio W of model side length to fracture layer thickness is equal to 16, 30, and 60, the relative fracture block circumference is 0.89, 0.8, 0.98. It is observed to have a constant value and the magnitude equal to 1.
When rock is subjected to stress, it can develop internal micro-cracks that cause the reflection of elastic waves, known as Acoustic Emission (AE). The frequency of AE events can indicate rock fracture. Figure 12 illustrates the relationship between bidirectional tensile displacement (ux and uy) for various plane sizes and the number of AE events or broken units. Figure 12 shows that as the surface cracks do not reach saturation state, the load of the peak acoustic emission quantity increases as the plane size increases relative to the thickness W of the fracture layer. This indicates that the larger the surface size, the more difficult it is to crack. Further observation reveals that when subjected to bidirectional equal incremental stretching, the peaks of AE quantity reached by different sized models are approximately doubled with the ratio W of plane size to fracture layer thickness. As W increases from 16 to 30 by less than one time, the degree of reduction of the peak number of acoustic emission increases. It has been observed that there is a linear positive relationship between the size of the model and the energy released during rupture. Additionally, the loading ux and uy corresponding to the peak value are distributed approximately in the x and y directions of 0.02 mm, 0.04 mm, and 0.08 mm, and the double expansion is consistent with the scale expansion. The results indicate that the relationship between the load and the peak of acoustic emission quantity is not affected by the size of the model. In other words, cracking will occur when the loading amount reaches a certain value, regardless of the model’s size. The only difference lies in the degree of cracking.
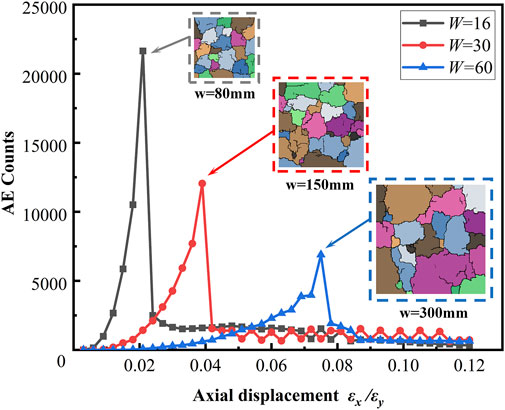
Figure 12. Acoustic emission maps corresponding to different plane sizes.
To discuss the distribution of cracks on models with different loading ratios of direction, we can use fractal dimension to calculate the mesh crack network. This paper selects the box-counting method (Baer et al., 2009; Lomeling et al., 2016) to calculate polygonal mesh cracks. The method is as Eqs 9, 10:
Where r is the side length of the grid divided by the box method, N is the number of networks needed to cover cracks, and d is the fractal dimension. The double-log graph of logN-logr was created by fitting the values of the mesh side length r and the required mesh number N of the surface mesh crack network simulated by the PCAS system statistical model with different loading ratios of direction (Figure 13). The fractal dimension value of the model with different loading ratios of direction can be found in the fitting curve expression in the Figure 13, which is determined by the absolute value of the slope of the fitted line.
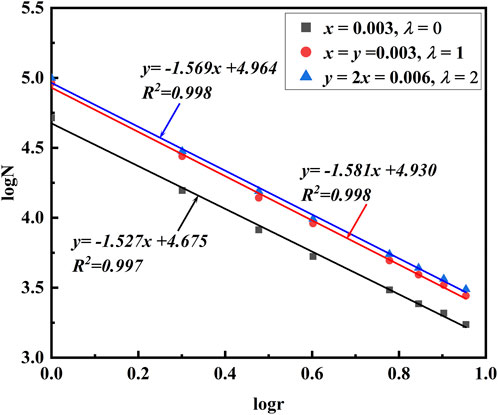
Figure 13. Fractal dimension of crack mesh corresponding to different loading ratios of direction.
Based on the results presented in Figure 14, it can be observed that surface crack networks obtained by plane models with different loading ratios of direction exhibit clear fractal characteristics. The fractal dimension (d) for the three loading modes, namely, λ = 0, λ = 1, and λ = 2, are 1.527, 1.569, and 1.581, respectively. The fractal dimension is affected by the loading ratio of direction, whether it is unidirectional or bidirectional. The fractal dimension remains consistent regardless of bidirectional equal variable loading or bidirectional unequal variable loading. The results indicate that the distribution of surface mesh cracks is statistically similar between the two models. This suggests that the distribution of polygonal blocks surrounded by cracks is also similar.
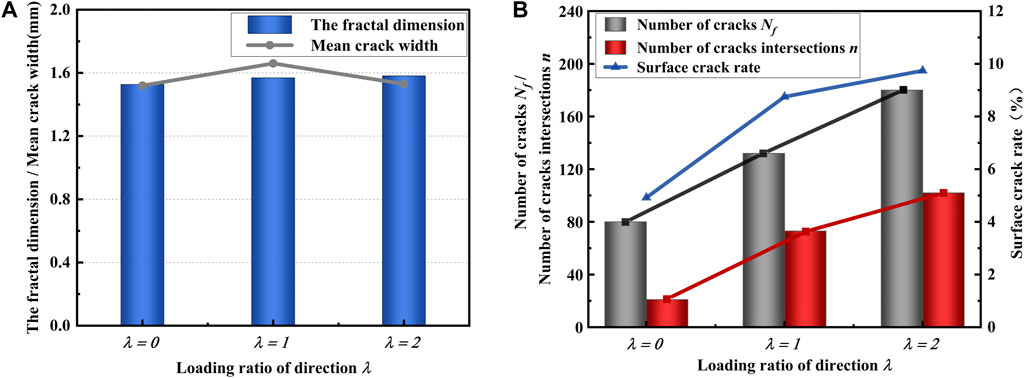
Figure 14. Effect of loading ratio of direction on fracture development is as follows: (A) fractal dimension of fracture mesh and average fracture width; (B) Crack related quantity statistics.
Figure 14A illustrates the impact of loading ratio of direction on the fractal dimension and average crack width of the fracture grid. The results indicate that when the loading ratio of direction is not equal to zero, the crack width remains relatively constant. The mean crack width is observed to be larger under λ = Δy/Δx = 1 than under λ = 0 and λ = 2. Although λ = 2 results in a doubling of the total tensile amount in the y direction compared with λ = 1, it only affects the increase in the number of cracks in the vertical y direction and has little effect on the width of cracks. This indicates that the expansion of crack width is not significantly correlated with the loading amount prior to crack saturation. In contrast, the directional loading ratio exerts a primary influence. The mean crack width of bidirectional loading is greater than that of non-uniform loading. When the loading in the x and y directions is λ = 1, the fracture width expands more readily, and the fracture layer reaches saturation more rapidly.
Figure 14B illustrates the correlation between fracture number Nf, fracture crossover node number n, and surface fracture rate under varying directional loading ratios. The number of cracks increases in proportion to the loading ratio in the corresponding direction. Nevertheless, the gradual increase in the number of fracture crossover nodes indicates that the development of fractures is not well connected to form a network. When a constant load is maintained in a single direction, the number of cracks increases only in the direction of increasing vertical load, while the other direction remains relatively unchanged. When unidirectional loading is transformed into bidirectional loading, the surface crack rate undergoes a profound alteration. Moreover, the impact of augmenting a specific load on the surface crack rate is not discernible.
The statistical analysis quantified the results, including the number of cracks, average crack area, number of cracks, and surface crack rate, which are presented in Figure 15. Figures 15A, B show the changes in crack block-related statistics and crack-related statistics with the change in loading per step.
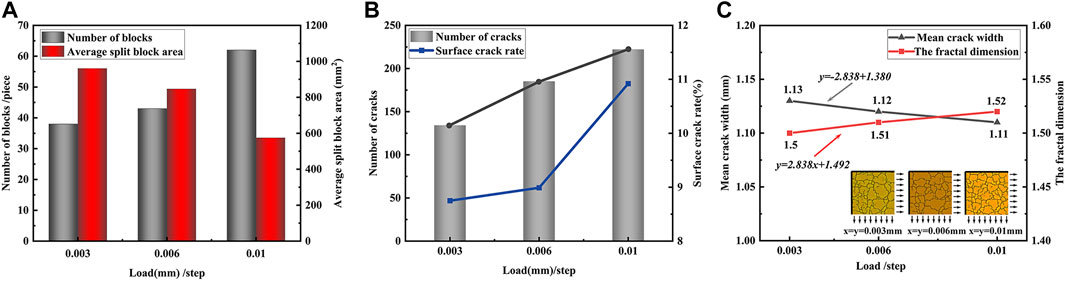
Figure 15. Effect of loading per step on cracking: (A) Effect on cracking development; (B) Effect on fracture development; (C) Effect on average crack width and fractal dimension.
Upon observation of Figure 15A, it is evident that the number of cracked blocks gradually increases with each step, while the corresponding average cracked block area decreases. This is due to the relationship between the elastic modulus of an object and the rate of deformation (Bao et al., 2005). The molecular structure of the stretched region undergoes changes as the tensile deformation of the object increases, resulting in a decrease in Young’s modulus. When the total tensile amount is constant, a lower Young’s modulus requires less stress for the rock mass to experience the same strain. This leads to faster transformation between the elementary elements and makes the rock mass more susceptible to cracking. Furthermore, it is evident from Figure 15A that the impact of each incremental step on the surface crack intensifies as the step size increases. Specifically, when comparing 0.006mm/step to 0.01mm/step with 0.003mm/step to 0.006mm/step, there is a noticeable increase in the degree of variation of the relevant fragmentation statistics.
Figure 15B presents statistical information on fracture-related evaluation indicators. The number of cracks increases linearly with loading per step increase, and the surface crack rate is more sensitive to load changes. Specifically, when the loading per step increases from 0.006mm/step to 0.01mm/step, the surface crack rate increment is about eight times greater than when the loading per step increases from 0.003mm/step to 0.006mm/step. The surface crack rate is a valuable indicator for assessing the extent of fracture development. It suggests that larger increments in each step facilitate the expansion of cracks. In other words, longer stretching intervals increase the probability of surface cracks.
Based on Figure 15C, the surface-saturated crack network of the plane model exhibits clear fractal characteristics under different loading conditions. The fractal dimension increases continuously with loading per step. This suggests that the complexity of the crack network increases with higher loading per step, even under the same total bidirectional tensile increment. Compared to the small incremental per step model, the large incremental per step model is more likely to cause the rock surface to reach a state of fracture saturation. Additionally, when the crack spacing reaches its limit value, the number of cracks will no longer increase with the monotonically decreasing thickness of the fracture layer. Instead, the strain increases by expanding the crack width. However, according to Figure 15C, the expansion of the average crack width does not occur solely after the crack reaches saturation. Instead, the average fracture width increases as loading per step decreases during fracture development. The relationship between the average crack width and fractal dimension of the model and the loading per step is noteworthy. The two exhibit a good linear relationship, but their change laws are opposite. Additionally, the slope of the linear fitting is inverse to each other.
At present, research on layered rock cracking primarily focuses on interpreting and analyzing field observations of cracks, as well as analyzing the characteristics and formation rules of these cracks. Some researchers have also conducted numerical simulations of crack propagation, but these simulations are mostly based on uniform materials, which differ greatly from actual rock masses. Physical properties of layered rock are rarely considered in these simulations. Currently, there is limited research on the complete process of crack propagation and its influencing factors in the construction of non-uniform layered rock masses through numerical simulation. Additionally, research on the impact of physical properties of rock masses on the cracking phenomenon of layered rock masses is not comprehensive.
The results show that the physical properties of the rock, such as the homogeneous degree, fracture layer thickness, and rock size, all affect the cracking of the layer surface. There is a close relationship between homogeneous degree and fracture mode, whether from the perspective of microscopic damage or macroscopic cracking. The common rock homogeneous degree is between two and 8. In order to facilitate the study of fracture development based on close engineering practice, the initial fracture layer homogeneous degree is 4. It is found that with the increase of homogeneous degree, the number of cracks increases, and the cracks tend to connect to form a network, but high homogeneous degree does not affect the development of interlayer cracks. Therefore, the layered rock with low homogeneous degree should be selected as much as possible for engineering with appearance requirements. Further observation of fracture-related evaluation indices shows that the linear density and average fracture width of fractures double with each increase of four of homogeneous degree, indicating that there is a linear relationship between fracture development and homogeneity degree. Statistical calculation shows that the proportional coefficients of fracture linear density, average fracture width and homogeneous degree are all k = 0.065. It can be concluded that the degree of homogeneity directly determines the complexity of surface cracking of stratified rock without considering the factors such as loading.
The influence of layer thickness on cracking has always been a focus of rock cracking research. In practical engineering, layered rock is often encountered, and the thickness of each layer is often different. Therefore, the concept of layer thickness ratio η (η = t/T) is considered to make the study more practical. The results show that the layer thickness not only has a significant control effect on the fracture spacing, but also the normalized mean fracture block area Sf has a logarithmic relationship with the layer thickness ratio. When η is larger than the critical value, the surface crack rate is no longer affected by the fracture layer thickness when the surface crack is saturated, which means that the fracture saturation phenomenon does not change with the increase or decrease of the fracture layer thickness. The threshold value is about 0.67. Therefore, when the layer thickness is relatively large, the fracture layer thickness can be considered as a secondary factor in the control of engineering cracking.
In order to compare the model with the actual engineering size, the effect of the model size on the cracking of the layered rock surface is studied. The simulation results show that as the size of the model increases, the area of the mesh fragment increases accordingly. On the contrary, when the size of the slab model is reduced, the area of the polygonal crack block area is also reduced, and there is no constant crack area, the cracks are difficult to develop completely in the small-sized slab model, and the polygonal crack block cannot be enclosed. This shows that the area size of the cracked block is adjusted in a certain proportion according to the law of size change. In particular, it is observed that the average block perimeter does not change with the change in the plane size. This shows that within a certain error range, the mean partition perimeter is equal to the model side length, and this equality relationship does not change with the change in scale. In engineering practice, this equality relationship can be considered to achieve the optimal crack state of the rock to control crack development.
External loading is another important factor affecting rock cracking. The direction of loading has an important effect on the crack morphology. Under unidirectional loading, equally spaced strip cracks will appear, while under bidirectional loading, network cracks will appear. Further study of the influence of different loading ratios of direction on cracks can help us to better design the structural loading scheme. It is observed that when the total tensile amount of λ = 2 along the y-direction is doubled, the number of cracks in the vertical y-direction increases but has little effect on the crack width. This indicates that before crack saturation, the crack width expansion has little relationship with the load amount and is mainly influenced by the loading ratio of direction. It is shown that the average crack width under bidirectional symmetrical load is larger than that under unsymmetrical load. Therefore, symmetrical loading should be avoided in practical engineering.
For loading per step, we can consider its influence on the surface cracking of layered rock from the tensile velocity point of view. The simulation results show that the increment of loading per step affects the penetration of surface cracks in layered rock. This is because the Young’s modulus is affected by the tensile velocity. The faster the tensile deformation of the object, the more changes will occur in the molecular structure of the stretched region, thereby reducing Young’s modulus. If the total tensile amount is the same, the lower the Young’s modulus, the lower the stress required for the rock to change to the same strain, the faster the transformation between elementary elements, and the rock is more prone to cracking. Therefore, in practical engineering, excessive loads due to the accumulation of different materials should be avoided. In addition, there is no significant change in the degree of increase in the surface fracture rate after the load in the y direction is doubled compared to the load in the xy direction. This shows that although the number of cracks increases, the width of cracks does not begin to expand, which is in accordance with the law obtained in previous studies when the development of cracks does not reach saturation: the number of cracks is first increased, and then the width of cracks will expand in proportion to the thickness of the fracture layer.
The cracking causes and influencing factors of the surface fracture of layered rock are very complicated, but the surface fracture morphology is easy to observe, so the cracking failure morphology has a certain regularity. The development of surface cracks seems to be random, but it is actually caused by various internal factors. The numerical simulation method is used to simulate the whole process of layered rock cracking under three-dimensional conditions, which is easier to achieve accurate control of influencing factors and obtain quantified universal results than physical tests. In addition, the linear relationship between fracture evaluation indices and influencing factors provides an important research direction, and various influencing factors and fracture evaluation indices are matched by mathematical methods. By establishing a mathematical model of fracture statistical index based on various influencing factors, it can not only help engineers to better understand the mechanism of rock cracking, but also provide effective methods and strategies for design to prevent or reduce engineering risks caused by rock cracking.
It should be noted that this study is not without limitations. For instance, the study considers only tensile load, yet the actual fracture development on the stratified rock surface is affected by multiple factors, including temperature and humidity. This single external factor renders the study insufficiently comprehensive. Secondly, the impact of homogeneity as a material property on rock cracking is solely considered, while the influence of alterations to other material parameters, such as elastic modulus and Poisson’s ratio of the cracked layer, is not fully accounted for. Additionally, the model is relatively simplistic. In light of these considerations, the author proposes that future research directions should include the setting of parameters for layered materials, with the aim of simulating cracking in different lithologies of rock mass within the same layer. This would entail setting the material strength of rock mass in each layer to different values. In addition, physical testing represents a crucial element of subsequent research. A comparison of the results of physical testing and numerical simulation can provide a more practical reference value for the conclusions drawn.
In this paper, a three-dimensional two-layer slab model of layered rock mass is established by using the numerical simulation method based on mesoscopic statistical damage mechanics. The influence of surface fracture layer thickness, model side length of different dimensions and fracture layer uniformity on the surface crack morphology of two-layer rock mass is analyzed. Through the quantitative analysis of surface cracks by the obtained crack evaluation indices, the main conclusions are as follows:
(1) The surface crack development is affected by the homogeneous degree of the fracture layer. Under the same tensile conditions, the higher homogeneous degree, the more cracks tend to connect with each other to form a network, and the surface layer of the model is more fractured. Before the surface cracks reach saturation, increasing the homogeneous degree greatly accelerates the development speed and complexity of the surface cracks. In particular, there is a good proportional relationship between the homogeneous degree of rock mass and the quantitative fracture indices. The number of crack blocks is approximately proportional to the homogeneous degree m, and the linear density and mean crack width vary linearly with the mean m.
(2) Based on RFPA3D finite element simulation, the double-layer three-dimensional plate model with different fracture thicknesses will affect the surface crack development under the action of stretching and radial expansion along the plane. The degree of crack development decreases with the increase of the layer thickness ratio η, and the normalized mean crack area is approximately logarithmic with the layer thickness ratio. It is observed that η = 0.67 is the critical value of the film thickness that affects the surface crack development. When η < 0.67, the film thickness ratio has a significant effect on the value of the crack-related index. When η > 0.67, the degree of influence curve tends to be smooth, and the degree of influence of the coating thickness decreases continuously.
(3) Surface crack propagation is affected by model scale. The larger the fracture layer thickness (the larger the t value), the more difficult it is for the surface crack to propagate, but this size effect gradually decreases with increasing size. The average value of the fracture area approximately doubles with a doubling of the plane size relative to the fracture layer thickness (the doubling of the w value). It is worth noting that within a certain error range, the average crack perimeter is equal to the length of the model side, and this equality does not change with the change in scale.
(4) The development of surface cracks is influenced by the different loading ratios of direction. Before the phenomenon of fracture saturation, the number of cracks increases directly with the loading ratio. At the same time, the variation of loading in one direction has little effect on the development of tensile cracks in the other direction. The surface saturated crack network under different loading ratios of direction has obvious fractal characteristics, and the fractal dimension is mainly affected by the loading ratio. When the loading ratio is λ = 1, the crack width is easier to expand and the fracture layer is easier to reach fracture saturation.
(5) The surface crack development is affected by the loading per step. With the increase of each step, the number of cleaved blocks increases and the average cleaved block area decreases. It is speculated that this is related to the effect of loading rate on Young’s modulus. The average crack width and fractal dimension are approximately proportional to the loading per step. Before fracture saturation, the average fracture width is not only controlled by the thickness of the fracture layer, and the increment of each step is one of the influencing factors. The smaller the increment of each step, the more completely the crack width expands and the larger the average crack width.
The original contributions presented in the study are included in the article/Supplementary Material, further inquiries can be directed to the corresponding author.
YX: Methodology, Writing–original draft. XX: Data curation, Validation, Writing–review and editing. QZ: Writing–review and editing. JC: Supervision, Writing–review and editing. HY: Resources, Writing–review and editing.
The author(s) declare that financial support was received for the research, authorship, and/or publication of this article. This research was funded by the National Natural Science Foundation of China # 42377156, # 42077251.
Authors JC and HY were employed by CNPC Chuanqing Drilling Engineering Company Limited.
The remaining authors declare that the research was conducted in the absence of any commercial or financial relationships that could be construed as a potential conflict of interest.
All claims expressed in this article are solely those of the authors and do not necessarily represent those of their affiliated organizations, or those of the publisher, the editors and the reviewers. Any product that may be evaluated in this article, or claim that may be made by its manufacturer, is not guaranteed or endorsed by the publisher.
Baer, J. U., Kent, T. F., and Anderson, S. H. (2009). Image analysis and fractal geometry to characterize soil desiccation cracks. Geoderma 154 (1), 153–163. doi:10.1016/j.geoderma.2009.10.008
Bai, T., Pollard, D. D., and Gao, H. (2000a). Explanation for fracture spacing in layered materials. Nat. Int. Wkly. J. Sci. 403 (6771), 753–756. doi:10.1038/35001550
Bai, T., Pollard, D. D., and Gao, H. (2000b). Spacing of edge fractures in layered materials. Int. J. Fract. 103 (4), 373–395. doi:10.1023/A:1007659406011
Bao, X. Y., Shi, X. J., Wen, D., and Li, C. B. (2005). Experiment study and interpretation on relation between modulus of rocks and strain amplitudes. Earthq. Res. China 21 (4), 508–518. (in Chinese). doi:10.3969/j.issn.1001-4683.2005.04.007
Bronswijk, J. J. B., Hamminga, W., and Oostindie, K. (1995). Field-scale solute transport in a heavy clay soil. Water Resour. Res. 31 (3), 517–526. doi:10.1029/94WR02534
Chang, X., Shan, Y. F., Zhang, Z. H., Tang, C. A., and Ru, Z. L. (2015). Behavior of propagating fracture at bedding interface in layered rocks. Eng. Geol. 197, 33–41. doi:10.1016/j.enggeo.2015.08.010
Chang, X., Wang, J., Tang, C. A., and Ru, Z. L. (2016). Effects of interface behavior on fracture spacing in layered rock. Rock Mech. Rock Eng. 49 (5), 1733–1746. doi:10.1007/s00603-015-0852-5
Cong, Z. Y., Li, Y. W., Liu, Y., and Xiao, Y. H. (2021). A new method for calculating the direction of fracture propagation by stress numerical search based on the displacement discontinuity method. Comput. Geotech. 140, 104482. doi:10.1016/j.compgeo.2021.104482
Cong, Z. Y., Li, Y. W., Pan, Y. S., Liu, B., Shi, Y., Wei, J. G., et al. (2022). Study on CO2 foam fracturing model and fracture propagation simulation. Energy (Oxford) 238, 121778. doi:10.1016/j.energy.2021.121778
Cordero, J. A., Prat, P. C., and Ledesma, A. (2021). Experimental analysis of desiccation cracks on a clayey silt from a large-scale test in natural conditions. Eng. Geol. 292, 106256. doi:10.1016/j.enggeo.2021.106256
Ding, X., Zhang, L., Zhu, H., and Zhang, Q. (2014). Effect of model scale and particle size distribution on PFC3D simulation results. Rock Mech. Rock Eng. 47 (6), 2139–2156. doi:10.1007/s00603-013-0533-1
Federl, P., and Prusinkiewicz, P. (2004) “Finite element model of fracture formation on growing surfaces,” in Computational science - ICCS. Berlin, Heidelberg: Springer Berlin Heidelberg. doi:10.1007/978-3-540-24687-9_18
Gao, Q., and Ghassemi, A. (2020). Three dimensional finite element simulations of hydraulic fracture height growth in layered formations using a coupled hydro-mechanical model. Int. J. Rock Mech. Min. Sci. 125, 104137. doi:10.1016/j.ijrmms.2019.104137
Gross, M. R. (1993). The origin and spacing of cross joints: examples from the Monterey Formation, Santa Barbara Coastline, California. J. Struct. Geol. 15 (6), 737–751. doi:10.1016/0191-8141(93)90059-J
Helgeson, D. E., and Aydin, A. (1991). Characteristics of joint propagation across layer interfaces in sedimentary rocks. J. Struct. Geol. 13 (8), 897–911. doi:10.1016/0191-8141(91)90085-W
Hobbiebrunken, T., Hojo, M., Adachi, T., De, J. C., and Fiedler, B. (2006). Evaluation of interfacial strength in CF/epoxies using FEM and in-situ experiments. Appl. Sci. Manuf. 37 (12), 2248–2256. doi:10.1016/j.compositesa.2005.12.021
Hobbs, D. W. (1967). The Formation of tension joints in sedimentary rocks: an explanation. Geol. Mag. 104 (06), 550–556. doi:10.1017/S0016756800050226
Hornig, T., Sokolov, I. M., and Blumen, A. (1996). Patterns and scaling in surface fragmentation processes. Phys. Rev. E-Statistical Phys. Plasmas, Fluids, Relat. Interdiscip. Top. 54 (4), 4293–4298. doi:10.1103/PhysRevE.54.4293
Huang, L., Sheng, G., Chen, Y., Zhao, H., Luo, B., and Ren, T. (2022). A new calculation approach of heterogeneous fractal dimensions in complex hydraulic fractures and its application. J. Petroleum Sci. Eng. 219, 111106. doi:10.1016/j.petrol.2022.111106
Jiang, C. P., Hou, H. L., Wu, X. F., and Wang, P. (2011). Periodic patterns of cracks on solid surfaces: I. Phenomena and Principles. Mech. Pract. 22 (3), 94–97. (in Chinese). doi:10.6052/1000-0879-lxysj2010-423
Jiao, Y. Y., Zhang, X. L., Zhang, H. Q., Li, H. B., Yang, S. Q., and Li, J. C. (2015). A coupled thermo-mechanical discontinuum model for simulating rock cracking induced by temperature stresses. Comput. Geotech. 67, 142–149. doi:10.1016/j.compgeo.2015.03.009
Jing, L. (2003). A review of techniques, advances and outstanding issues in numerical modelling for rock mechanics and rock engineering. Int. J. Rock Mech. Min. Sci. 40 (3), 283–353. doi:10.1016/S1365-1609(03)00013-3
Koyanagi, J., Ogihara, S., Nakatani, H., Okabe, T., and Yoneyama, S. (2014). Mechanical properties of fiber/matrix interface in polymer matrix composites. Adv. Compos. Mater. 23 (5-6), 551–570. doi:10.1080/09243046.2014.915125
Lachenbruch, A. H. (1961). Depth and spacing of tension cracks. J. Geophys. Res. 66 (12), 4273–4292. doi:10.1029/JZ066i012p04273
Lee, Y. J., and Freund, L. B. (1990). Fracture initiation due to asymmetric impact loading of an edge cracked plate. J. Appl. Mech. 57 (1), 104–111. doi:10.1115/1.2888289
Li, H. Q., and Wong, L. N. Y. (2012). Influence of flaw inclination angle and loading condition on crack initiation and propagation. Int. J. Solids Struct. 49 (18), 2482–2499. doi:10.1016/j.ijsolstr.2012.05.012
Li, X. H., Xia, B. W., Li, D., and Han, C. R. (2010). Deformation characteristics analysis of layered rockmass in deep buried tunnel. Rock soil Mech. 31 (4), 1163–1167. (in Chinese). doi:10.3969/j.issn.1000-7598.2010.04.028
Li, Y., and Yang, C. (2007). On fracture saturation in layered rocks. Int. J. Rock Mech. Min. Sci. 44 (6), 936–941. doi:10.1016/j.ijrmms.2006.11.009
Liu, C., Shi, B., Zhou, J., and Tang, C. (2011). Quantification and characterization of microporosity by image processing, geometric measurement and statistical methods: application on SEM images of clay materials. Appl. Clay Sci. 54 (1), 97–106. doi:10.1016/j.clay.2011.07.022
Liu, C., Tang, C., Shi, B., and Suo, W. (2013). Automatic quantification of crack patterns by image processing. Comput. Geosciences 57, 77–80. doi:10.1016/j.cageo.2013.04.008
Lomeling, D., Kenyi, M. C., Lodiong, M. A., Kenyi, M. S., Silvestro, G. M., and Yieb, J. L. L. (2016). Characterizing dessication cracking of a remolded clay (<i&gt;Eutric vertisol&lt;/i&gt;) using the fractal dimension approach. Open J. Soil Sci. 6 (4), 68–80. doi:10.4236/ojss.2016.64008
Lung, C., and Wang, S. (2000). Universality and specificity of fractal dimension of fractured surfaces in materials. J. Mater. Sci. Technol. 16 (1), 1–4. doi:10.3321/j.issn:1005-0302.2000.01.001
Ma, T. H., Zhu, X., Tang, C. A., and Li, W. R. (2021). Formation and evolution of fracture spacing on various geometric surfaces in layered materials. Int. J. Solids Struct. 233, 111192. doi:10.1016/j.ijsolstr.2021.111192
Mandal, N., Deb, S. K., and Khan, D. (1994). Evidence for a non-linear relationship between fracture spacing and layer thickness. J. Struct. Geol. 16 (9), 1275–1281. doi:10.1016/0191-8141(94)90069-8
Meng, L. B., Li, T. B., Jiang, Y., Wang, R., and Li, Y. R. (2013). Characteristics and mechanisms of large deformation in the Zhegu mountain tunnel on the Sichuan–Tibet highway. Tunn. Undergr. Space Technol. 37, 157–164. doi:10.1016/j.tust.2013.03.009
Mortell, D., Tanner, D. A., and McCarthy, C. T. (2014). In-situ SEM study of transverse cracking and delamination in laminated composite materials. Compos. Sci. Technol. 105, 118–126. doi:10.1016/j.compscitech.2014.10.012
Murti, V., and Valliappan, S. (1986). The use of quarter point element in dynamic crack analysis. Eng. Fract. Mech. 23 (3), 585–614. doi:10.1016/0013-7944(86)90164-5
Nahta, R., and Moran, B. (1995). Crack spacing in brittle films on dissimilar planar and axisymmetric elastic substrates. Eng. Fract. Mech. 52 (3), 513–524. doi:10.1016/0013-7944(94)00283-N
Olson, J. E. (2004). Predicting fracture swarms — the influence of subcritical crack growth and the crack-tip process zone on joint spacing in rock, Geological Society. London: Special Publication. doi:10.1144/GSL.SP.2004.231.01.05
Rives, T., Rawnsley, K. D., and Petit, J. P. (1994). Analogue simulation of natural orthogonal joint set formation in brittle varnish. J. Struct. Geol. 16 (3), 419–429. doi:10.1016/0191-8141(94)90045-0
Schöpfer, M. P. J., Arslan, A., Walsh, J. J., Childs, C., and Elsevier, L. (2011). Reconciliation of contrasting theories for fracture spacing in layered rocks. J. Struct. Geol. 33 (4), 551–565. doi:10.1016/j.jsg.2011.01.008
Sherard, J. L. (1975). Embankment dam cracking. Int. J. Rock Mech. Min. Sci. Geomechanics Abstr. 12 (4), 62. doi:10.1016/0148-9062(75)90094-7
Song, S. H., and Paulino, G. H. (2006). Dynamic stress intensity factors for homogeneous and smoothly heterogeneous materials using the interaction integral method. Int. J. Solids Struct. 43, 4830–4866. doi:10.1016/j.ijsolstr.2005.06.102
Tang, C. A. (1997). Numerical simulation of progressive rock failure and associated seismicity. Int. J. Rock Mech. Min. Sci. 34 (2), 249–261. doi:10.1016/S0148-9062(96)00039-3
Tang, C. A., Liang, Z. Z., Zhang, Y. B., Chang, X., Tao, X., Wang, D. G., et al. (2008a). Fracture spacing in layered materials: a new explanation based on two-dimensional failure process modeling. Am. J. Sci. 308 (1), 49–72. doi:10.2475/01.2008.02
Tang, C. S., Shi, B., Liu, C., Gao, L., and Inyang, H. I. (2011a). Experimental investigation of the desiccation cracking behavior of soil layers during drying. J. Mater. Civ. Eng. 23 (6), 873–878. doi:10.1061/(ASCE)MT.1943-5533.0000242
Tang, C. S., Shi, B., Liu, C., Suo, W. B., and Gao, L. (2011b). Experimental characterization of shrinkage and desiccation cracking in thin clay layer. Appl. Clay Sci. 52 (1), 69–77. doi:10.1016/j.clay.2011.01.032
Tang, C. S., Shi, B., Liu, C., Zhao, L. Z., and Wang, B. J. (2008b). Influencing factors of geometrical structure of surface shrinkage cracks in clayey soils. Eng. Geol. 101 (3), 204–217. doi:10.1016/j.enggeo.2008.05.005
Tang, S. B., Tang, C. A., Liang, Z. Z., Luo, J., and Wang, Q. (2017). The development of polygonal fractures due to contraction: a disorder to order transition. Eng. Fract. Mech. 178, 93–108. doi:10.1016/j.engfracmech.2017.04.008
Telles, J. C. F., and Guimaraes, S. (2000). Green’s function: a numerical generation for fracture mechanics problems via boundary elements. Comput. Methods Appl. Mech. Eng. 188 (4), 847–858. doi:10.1016/S0045-7825(99)00366-7
Thouless, M. D. (1990). Crack spacing in brittle films on elastic substrates. J. Am. Ceram. Soc. 73 (7), 2144–2146. doi:10.1111/j.1151-2916.1990.tb05290.x
Thouless, M. D., Olsson, E., and Gupta, A. (1992). Cracking of brittle films on elastic substrates. Acta Metallurgica Materialia 40 (6), 1287–1292. doi:10.1016/0956-7151(92)90429-I
Toolabi, M., Fallah, A. S., Baiz, P. M., and Louca, L. A. (2013). Dynamic analysis of a viscoelastic orthotropic cracked body using the extended finite element method. Eng. Fract. Mech. 109, 17–32. doi:10.1016/j.engfracmech.2013.06.003
Wu, H., and Pollard, D. D. (1995). An experimental study of the relationship between joint spacing and layer thickness. J. Struct. Geol. 17 (6), 887–905. doi:10.1016/0191-8141(94)00099-L
Yu, W. W., He, F., and Xi, P. (2010). A rapid 3D seed-filling algorithm based on scan slice. Comput. Graph. 34 (4), 449–459. doi:10.1016/j.cag.2010.05.005
Zhang, T. Y., and Zhao, M. H. (2002). Equilibrium depth and spacing of cracks in a tensile residual stressed thin film deposited on a brittle substrate. Eng. Fract. Mech. 69 (5), 589–596. doi:10.1016/S0013-7944(01)00098-4
Zhang, X. P., and Wong, L. N. Y. (2012). Cracking processes in rock-like material containing a single flaw under uniaxial compression: a numerical study based on parallel bonded-particle model approach. Rock Mech. Rock Eng. 45 (5), 711–737. doi:10.1007/s00603-011-0176-z
Zhang, Y. B., Tang, C. A., Liang, Z. Z., and Xu, T. (2005). Three-dimensional material failure process analysis. Key Eng. Mater. 297-300, 1196–1201. doi:10.4028/scientific.net/KEM.297-300.1196
Zheng, H., Liu, F., and Li, C. (2014). The MLS-based numerical manifold method with applications to crack analysis. Int. J. Fract. 190 (1-2), 147–166. doi:10.1007/s10704-014-9980-2
Keywords: stratified rock mass, surface crack, influencing factor, numerical simulation, quantitative analysiskey
Citation: Xia Y, Xue X, Zhang Q, Chen J and Yang H (2024) Three-dimensional numerical simulation of factors affecting surface cracking in double-layer rock mass. Front. Earth Sci. 12:1418562. doi: 10.3389/feart.2024.1418562
Received: 16 April 2024; Accepted: 10 July 2024;
Published: 25 July 2024.
Edited by:
Chun Zhu, Hohai University, ChinaReviewed by:
Xige Liu, Northeastern University, ChinaCopyright © 2024 Xia, Xue, Zhang, Chen and Yang. This is an open-access article distributed under the terms of the Creative Commons Attribution License (CC BY). The use, distribution or reproduction in other forums is permitted, provided the original author(s) and the copyright owner(s) are credited and that the original publication in this journal is cited, in accordance with accepted academic practice. No use, distribution or reproduction is permitted which does not comply with these terms.
*Correspondence: Qi Zhang, emhhbmdxQG1haWwuZGx1dC5lZHUuY24=
Disclaimer: All claims expressed in this article are solely those of the authors and do not necessarily represent those of their affiliated organizations, or those of the publisher, the editors and the reviewers. Any product that may be evaluated in this article or claim that may be made by its manufacturer is not guaranteed or endorsed by the publisher.
Research integrity at Frontiers
Learn more about the work of our research integrity team to safeguard the quality of each article we publish.