 Shijiang Li
 Yi Le
Yi Le
94% of researchers rate our articles as excellent or good
Learn more about the work of our research integrity team to safeguard the quality of each article we publish.
Find out more
ORIGINAL RESEARCH article
Front. Earth Sci., 12 July 2024
Sec. Geohazards and Georisks
Volume 12 - 2024 | https://doi.org/10.3389/feart.2024.1416957
This study delves into the design and deformation patterns of support structures in urban deep excavation projects, aiming to optimize the design of these structures to ensure their safety and stability. Initially, experimental research on steel-cement soil composite beams reveals their bending resistance and ductility under various loading conditions, confirming the effectiveness of the Soil Mixing Wall method in enhancing the stability of support structures. Subsequently, theoretical calculations using the method of elastic support points were conducted and validated through a deep excavation project in Xi’an, demonstrating that this method accurately calculates the trends of horizontal displacement in support structures. Additionally, FLAC3D numerical simulations are utilized to analyze the patterns of horizontal and vertical displacement during the excavation process. The simulation results generally align with the actual measured data, showing that the support structures optimized by the elastic support points method effectively control horizontal displacement (maximum displacement of 47.8 mm) and vertical displacement (maximum heave of 67.3 mm), validating the effectiveness of the numerical simulation methods. This research not only provides theoretical and practical guidance for deep excavation projects but also holds significant reference value for the design and construction of similar engineering projects.
In the process of urbanization, the need for high-rise buildings and underground facilities is increasing (Budkowska et al., 2020; Feng et al., 2022; Hou et al., 2022; Eilat et al., 2024). Consequently, deep excavation projects have become an essential component of these structures (Hong et al., 2022; Yang et al., 2022; Lei et al., 2023). The safety and stability of these excavations are of paramount importance. Issues surrounding the design and deformation control of deep excavation support structures are critical in underground engineering. Improper design or substandard construction of support structures can lead to severe safety incidents (Li, 2021; Lin et al., 2021a). These structures are vital for the safety of a building’s underground sections. In practice, combining different types of supports can lead to significant variations in earth pressure calculations (Wu et al., 2024; Wang et al., 2024). Recently, researchers worldwide have addressed these complex issues. For instance, Wu et al. (Wu et al., 2024) used a deep foundation pit project in Nanjing as a case study. They optimized the iterative calculation of the m value through the concept of elastic support points. By comparing theoretical calculations with actual measurements, they demonstrated that this method provides closer approximations to reality. It can predict the displacement of support structures, significantly aiding theories focused on deformation control. Roscoe (Roscoe, 1970) concluded from extensive research that the magnitude and direction of deformations in support structures significantly influence the passive earth pressure behind them and its distribution.
Currently, the primary methods for theoretical analysis of internal forces and deformations in pit support structures include the limit equilibrium method (Zhao et al., 2023), the soil resistance method (Peng H. et al., 2022), and numerical analysis (Chen et al., 2023). The limit equilibrium method, widely applied in practical engineering, assumes no displacement in the support structure before and after support installation, and neglects the impact of forces induced by displacement. The soil resistance method is also known as the subgrade reaction method or elastic foundation reaction method when the soil body is assumed to be elastic. It does not fully consider the interaction between the pit support structure and the supports (Sun and Li, 2022; Shi et al., 2023). Additionally, it fails to capture the changes over time and space during excavation. These limitations highlight the need for further research and refinement. Numerical analysis methods have recently become a popular tool for pit analysis. These methods address the deficiencies in traditional analytical approaches that simplify calculations by ignoring certain factors. (Gao et al., 2020), using FLAC3D software, explored the main factors affecting the pit corner effect in underground continuous wall support structures. They identified the pit corner influence coefficient and its impact zone. From this research, they proposed a method for calculating wall displacement that takes these factors into account. This method has been successfully applied in practical engineering. (Liu et al., 2020), through numerical calculations, investigated the mechanical characteristics of steel supports in diaphragm walls. Their practical engineering studies validated support schemes from various angles. They concluded that pre-stressed axial forces can effectively control the deformation of support structures within acceptable limits.
With the continuous progress of urbanization, a massive influx of people into cities has made construction land increasingly scarce. This has significantly promoted the extensive development and utilization of underground space. In pit support engineering, the use of retaining piles and anchor cable systems is common. However, if these components are not removable, they can interfere with future underground development, becoming urban construction waste. Identifying environmentally friendly and cost-effective support methods has become a research focus. The Soil Mixing Wall (SMW) method uses piles as temporary enclosures in underground construction. This allows for the recycling and reuse of section steel, providing significant economic and environmental benefits compared to other methods. Tu et al. (Tu et al., 2023) conducted dynamic monitoring of a pit project using the SMW method. This ensured safety and order throughout the construction process by adjusting design and construction plans based on real-time monitoring data. Chen et al. (Chen and Cui, 2018) analyzed on-site monitoring data from an SMW-enclosed pit project. They discussed the impacts of temporal and spatial effects on the support structure during construction. Their findings concluded that various factors, such as construction sequence, cushion layer design, and floor type choices, significantly influence pit deformation and stability. Gu Shitan et al. (Gu and Shi, 2008) conducted indoor model experiments to simulate actual pile stress in the field. They compared the SMW method and section steel enclosures, exploring the use characteristics of SMW method piles and the interaction of composite structures.
Current research and applications of the SMW (Soil Mixing Wall) method are primarily focused on soft soil regions where the technology is mature. However, applying this method in loess regions for pit support involves unique design and construction challenges. Currently, the use of the SMW method as a water-stop curtain in subway pit construction is limited. This study is based on a deep foundation pit project for a subway in Xi’an. It combines theoretical analysis, laboratory experiments, and numerical simulations to investigate the working characteristics of steel-cement soil composite beams. The study also employs the elastic support point method to calculate displacement and internal forces in pit support structures. Using FLAC3D, it simulates deformation patterns. The aim is to provide theoretical and practical guidance for similar deep foundation pit projects.
This article takes a foundation pit project in Xi’an as an example. The project is located in a new district, with a relatively complex surrounding environment. The southeast side of the pit is approximately 7 m away from the existing Renmin Road, which has a planned subway route beneath it, housing numerous municipal pipelines. To the northwest of the pit is a school, with three 2-story office buildings (without basements) with pile foundations, situated at the closest distance of about 8.0 m from the edge of the pit. Preliminary investigations indicate uneven settlement in these buildings, necessitating focused protection. The proposed site’s north, east, and west sides are planned to have an excavation depth of about 19m, while the south side is to be excavated to a depth of about 23.5 m (before excavation on the south side, soil is to be offloaded at the top of the slope with a depth of 4.5 m and a width of 7 m). According to the geological survey report, the distribution of the main soil layers is as shown in Table 1.
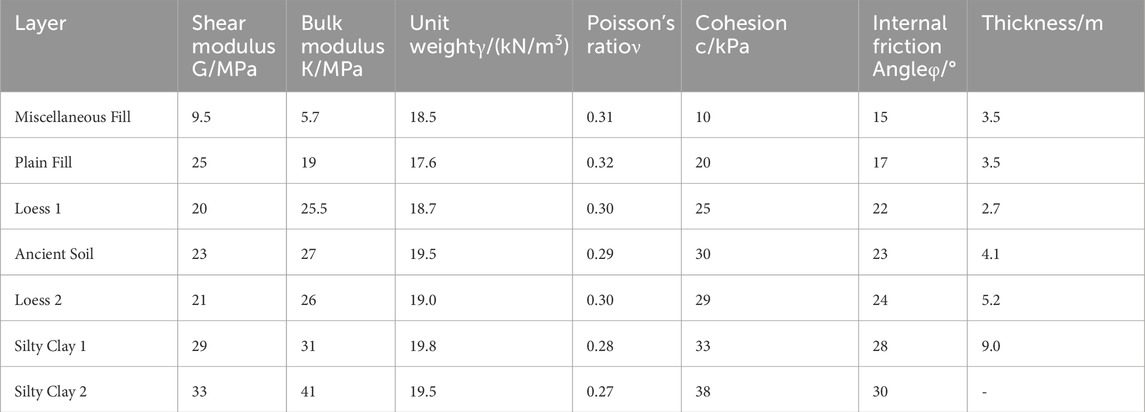
Table 1. Physical and mechanical parameters of soil layers.
With the emergence of large and deep foundation pits in urban underground engineering, numerous mature pit support methods have been developed through extensive practice. In this study, the support structure utilized is the SMW (Soil Mixing Wall with stiffeners) retaining wall. This structure incorporates core materials, commonly H-shaped steel, into cement-soil mixing walls, creating a composite support structure (Gu and Shi, 2008).
As illustrated in Figure 1, in practical engineering, SMW method piles consist of overlapping circular section cement-soil mixing piles. For the purpose of specimen preparation and loading ease, the specimens are crafted with a rectangular cross-section. Two types of composite beams, differing in cross-sections, simulate the “dense-insertion” and “skip-insertion” arrangements of steel profiles within the cement-soil mixing piles.

Figure 1. Cement-soil mixing pile with H-shaped steel arrangement.
To provide a baseline for comparison, tests were also conducted on standalone steel beams using the same loading method. The experiment is organized into three groups, each featuring two beams. The dimensions of the specimens are depicted in Figure 2. The materials used, along with relevant parameters, are detailed in Table 2. The curing age, parameters, and loading methods of the test beams are provided in Table 3.
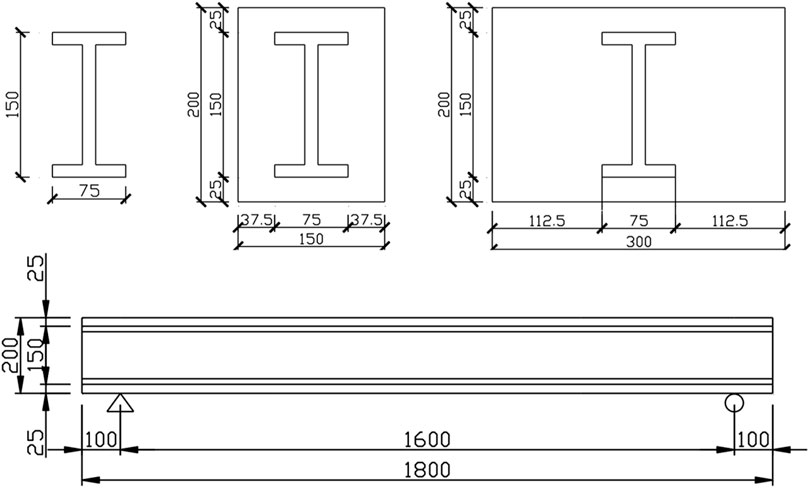
Figure 2. Schematic of the specimen cross-section.

Table 2. Properties of materials for pit retaining structures.
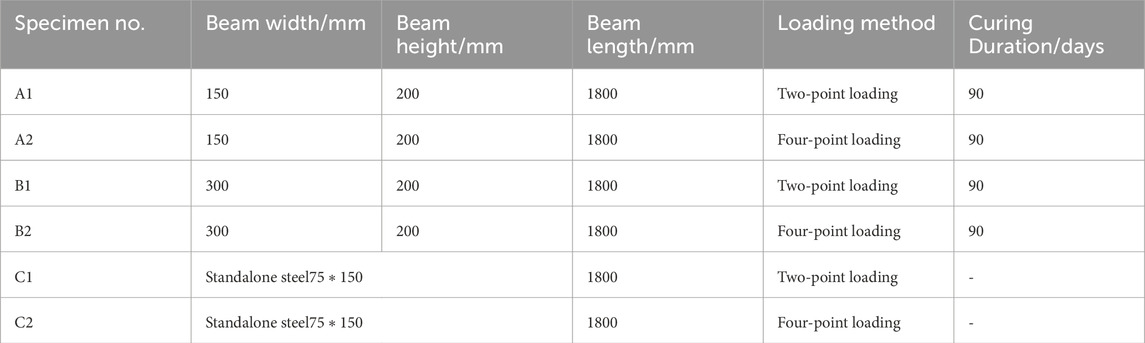
Table 3. Characteristics of support materials.
1. Specimen Preparation
(a) Select the required steel profiles for the experiment and install strain gauges on them. Waterproof the surface of the strain gauges with epoxy resin to ensure they function correctly.
(b) Construct molds needed for specimen preparation, then prepare the cement according to the design specified in Table 2. It is important to thoroughly mix the cement, soil, and water to ensure the homogeneity of the cement-soil mixture. When casting specimens, use a layering and compaction method to ensure the density of the cement-soil in the specimens.
(c) To obtain certain parameters of the cement-soil, reserve test blocks for each group of beams as required. The dimensions of the test blocks should follow the regulations related to construction mortar, with compression strength test blocks using 100 mm×100 mm×100 mm cubes and elastic modulus and compression strength measurements using 70.7 mm×70.7 mm×(210–230) mm prisms.
(d) To prevent rapid moisture evaporation which could affect the strength development of the cement-soil, cover the test beams and reserved test blocks tightly with plastic film and cure in a constant temperature and humidity environment for 90 days.
2. Experimental Loading Scheme
Since retaining wall structures in actual engineering primarily withstand bending and shear forces, this experiment investigates the mechanical behavior of composite beams under pure bending and combined bending-shear forces, using two-point and four-point loading methods, as shown in Figure 3. During the experiment, record the strain values of the steel and the deflection of the beam, and monitor the development of cracks in the composite beam during loading.
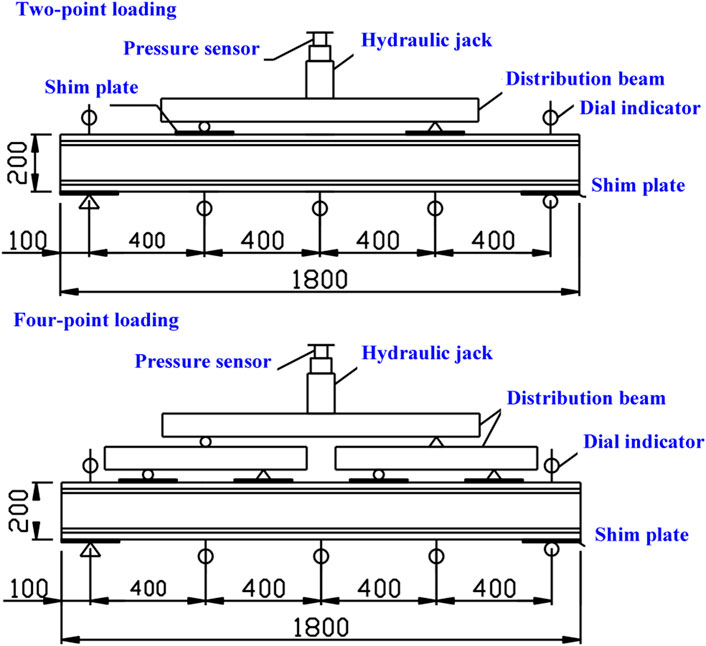
Figure 3. Schematic of composite beam loading.
(a) Loading Equipment and Measuring Instruments
The loading and measuring equipment includes a hydraulic universal material testing machine, a 20T jack, pressure sensors, a DH3818 static strain gauge, dial indicators, a magnifying glass, crack observation slides, a steel tape measure, and strain gauges.
(b) Specimen Installation and Loading
Avoid damaging the specimens with vibrations during transportation and installation. To prevent premature failure of the cement-soil due to stress concentration, use steel plates at the supports and loading points, as shown in Figure 3. Since there are no specific experimental protocols for steel-cement soil beams, this experiment refers to the “Standard for Test Method of Concrete Structures (GB50152—2012)“ and uses step loading, with real-time recording of beam deflection and steel strain using the static strain gauge and electromechanical dial indicators. After each loading step, observe the initiation and development of cracks, with Figure 4 showing the loading diagrams for individual steel beams and composite beams during testing.
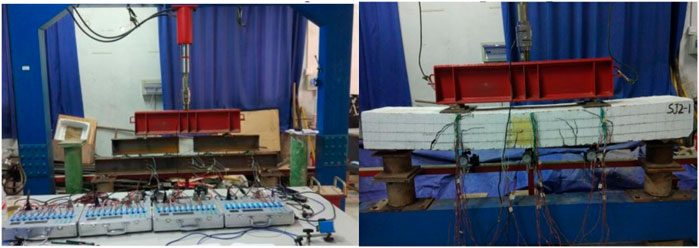
Figure 4. Experimental loading diagram for test beams.
(c) Selection and Arrangement of Measurement Points
To capture the strain variation in steel during loading, place resistive strain gauges on the surfaces of the steel in both the tension and compression zones, as illustrated in Figure 5.
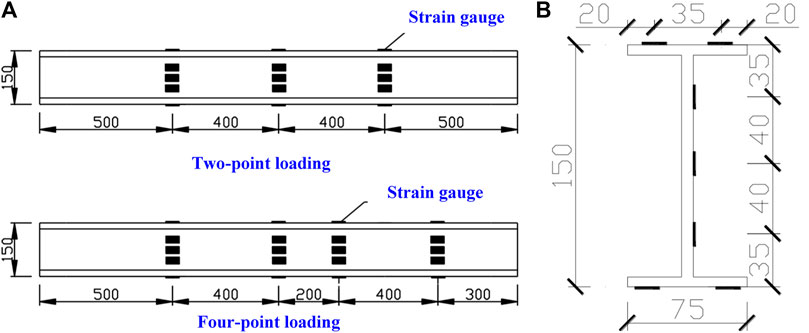
Figure 5. Schematic of Strain Gauge Application. (A) Longitudinal cross-section strain gauge arrangement. (B) Transverse cross-section strain gauge arrangement.
To ascertain the relationship between beam deflection and applied load during testing, dial indicators are positioned at the mid-span and quarter-span of the beam to measure its deflection. Additionally, dial indicators are placed at the supports to record any displacement of the supports throughout the test.
Figure 6 shows the experimentally measured load-deflection (P-f) curves at the mid-span of different cross-sectional test beams under the same loading conditions.
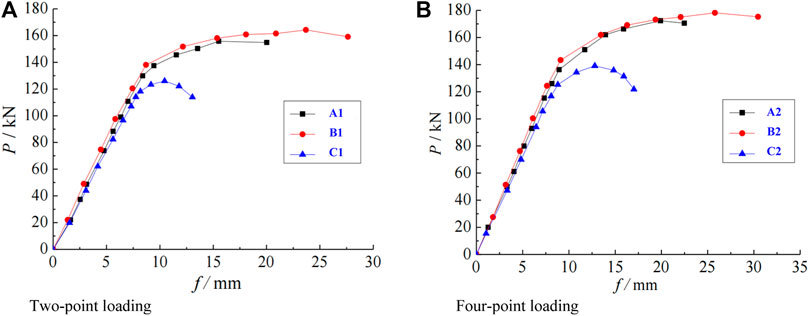
Figure 6. Load-Deflection Curves for Test Beams with Different Cross Sections. (A) Two-point loading. (B) Four-point loading.
The load-deflection curves show that standalone steel beams reach their ultimate load-bearing capacity with minimal deformation and then rapidly undergo brittle failure. In contrast, composite beams display larger deformations at their ultimate load-bearing capacities. Additionally, Figure 6 shows that the load-deflection curves for composite beams feature an extended near-horizontal section. This is particularly noticeable in beams with larger cross sections, highlighting the ductile characteristics of the steel-cement soil composite structure (Teli et al., 2020; Wu et al., 2024).
When comparing the final mid-span deflections of composite beams with different cross-sectional widths, it is clear that beams B1 and B2 have greater deformation capabilities. This indicates better ductility compared to A1 and A2. This behavior can be attributed to the restraining effect of cement soil on the steel. A larger cross-sectional width results in greater confinement by the cement soil, which enhances the steel’s strength and ductility. This confirms that materials with superior strength and ductility, such as steel, can compensate for the weaknesses of cement soil. It leverages the advantages of impermeability, water resistance, and cost-effectiveness of the cement soil.
Furthermore, the ultimate loads of composite beams with different cross-sectional widths, under the same loading method, are similar but significantly improved compared to standalone steel beams. This indicates that the ultimate load of a composite beam increases with the sectional ratio of cement soil within a certain range. However, beyond a certain value, the cement soil no longer enhances the beam’s load-bearing capacity.
After recording the mid-span deflections of test beams under various loads, the beam’s stiffness values can be calculated using relevant structural mechanics formulas. A pre-loading was conducted before the official loading to ensure the proper functioning of the instruments. Therefore, the starting point of the obtained stiffness-load variation curve does not begin at zero. Figure 8 displays the stiffness variation curve of the test beams with the load.
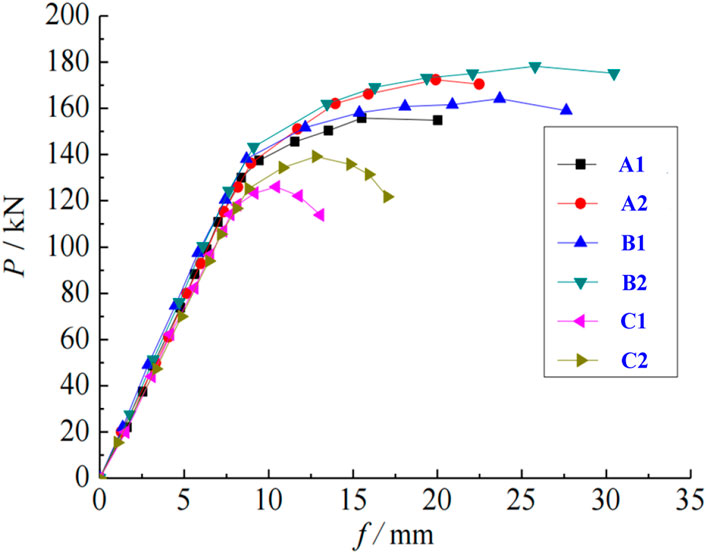
Figure 7. Load-deflection relationship curve for test beams.
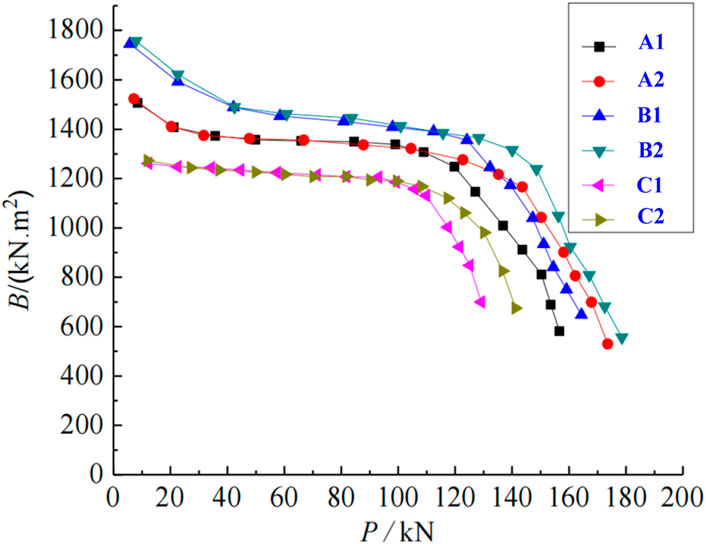
Figure 8. Stiffness variation curve of test beams with load.
Combining Figures 7, 8, the working process of the composite beams can be divided into two stages:
(1) Joint Action Stage(Joint Action Stage is now defined as the initial phase of the loading process where the steel and cement soil act together in a synergistic manner, with a nearly linear load-deflection response, indicating cohesive structural behavior).
As shown in Figure 7, at lower loads, the relationship between load and deflection for the composite beams is almost linear. When the load increases beyond the yield strength of the steel, a turning point appears in the relationship curve, and a smaller increment in load causes a much larger increase in mid-span deflection. Initially, there’s a sharp drop in the load-stiffness curve of the composite beams due to surface micro-cracking in the cement soil, leading to a reduction in beam stiffness. During the mid-loading phase, the stiffness variation is minor, and the curve flattens, but the composite beam stiffness remains higher than that of standalone steel beams. The stage before steel yielding and when the composite stiffness stabilizes is considered the joint action stage of the composite beam.
In this experiment, the mid-span of the specimen under two-point loading experiences pure bending, while the remainder undergoes combined bending and shear. Four-point loading increases the combined bending and shear section, aiding in analyzing the beam’s performance under different force types. The load-deflection curve during this stage appears almost linear. The maximum deflections during this stage for composite beams range between 8 and 9 mm, with larger cross-section beams showing slightly greater load capacity and smaller mid-span deflections under the same loading method. Table 4 lists the maximum loads and deflections during this stage.
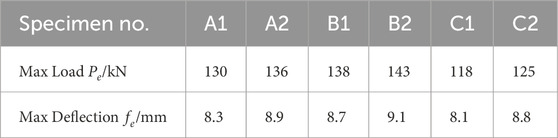
Table 4. Maximum load and deflection during the joint action stage.
(2) Independent Action Stage of Steel (Independent Action Stage is characterized by the phase where the steel begins to act more independently due to the onset of micro-cracks in the cement soil, leading to a non-linear load-deflection response, reflecting the steel’s capacity to sustain further loads despite the reduced contribution from the cement soil).
After the turning point in the load-deflection curve, as analyzed from Figure 7, the slope of the curve decreases, and the deflection rate increases compared to the first stage. Initially, the load-deflection curve still shows an upward trend but becomes almost horizontal as the load approaches the composite beam’s ultimate load, without showing the decline typical for standalone steel beams. Despite continuous deformation, the beam can still support a substantial load, displaying steel’s ductility. Figure 8 shows a significant drop in stiffness during this stage, indicating the independent action phase of steel. Analyzing this stage alongside the development of cracks in the composite beam shows that many cracks have appeared in the cement soil, which rapidly widen with continued loading, reducing the composite stiffness contribution.
Comparing beams A1, B1 with A2, B2 under the same loading method shows that larger cross-section beams exhibit better ductility, demonstrating the enhanced performance of steel when adequately confined by cement soil. In contrast, standalone steel beams C1, C2 have lower load capacity and smaller deformations, lacking steel’s ductility. Table 5 presents the maximum loads and deflections at failure for each beam.
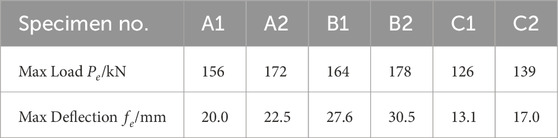
Table 5. Maximum load and deflection during the independent action stage.
Analysis from Table 5 shows that under the same loading method, the ultimate load for larger cross-section beams at failure is about 30% higher than that for standalone steel beams, and about 24% higher for smaller cross-section beams. Furthermore, the maximum deflection values at failure for composite beams are significantly higher than those for standalone steel beams. Comparing the relationship between maximum load and deflection for each beam group indicates that higher ultimate loads correspond to larger deflections. Under identical conditions, larger cross-section beams have higher ultimate loads and slightly larger final deflections than smaller cross-section beams, highlighting the strong restraining effect of cement soil on steel, enhancing both load-bearing capacity and deformability.
When applying the elastic support method to calculate the pit support structure, the structure is often simplified as a vertical elastic foundation beam. The earth pressure behind the wall is then treated as a load applied on the side of the beam. Classical earth pressure theories, such as Rankine and Coulomb theories, are commonly used to calculate the earth pressure behind the wall (Hu et al., 2023).
In this calculation process, the supports set above the excavation face on the support structure are treated as elastic support points. The soil body below the excavation face is simulated using a series of springs. For instance, this paper calculates a pit excavation depth of 19 m with a surface overload q=20 KPa. The excavation profile and the physical and mechanical parameters of each soil layer are illustrated in Figure 9.
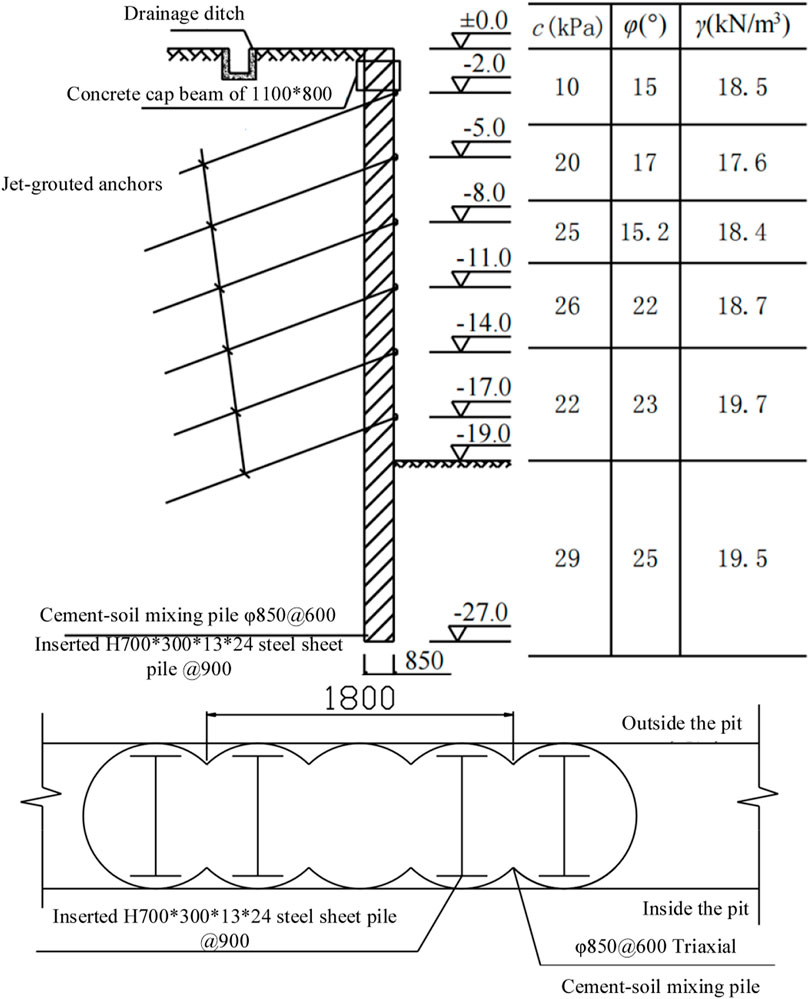
Figure 9. Schematic of the calculation section H-steel and mixing pile layout.
The retaining wall in this study is a triaxial cement-soil mixing continuous wall. It has a pile diameter of 850 mm, a spacing of 600 mm, and neighboring piles overlap by 250 mm. The pile body utilizes P.C32.5 grade composite Portland cement with a cement content of 20% and an additional 1.5‰ early-strength agent. H700×300×13×24 steel is inserted internally, and the steel waist beam employs double-spliced 18# I-steel. The horizontal spacing of the anchors is 1.8 m, as depicted in Figure 9.
(1) Earth Pressure Calculation
Since the pit is dewatered to about 14 m before construction, and the groundwater level is 0.5 m below the pit floor after dewatering, water pressure is not considered in the earth pressure calculation. According to the regulations of pit engineering, the active earth pressure coefficient and active earth pressure are calculated using the following formulas:
The earth pressure obtained from formulas (1) and (2) is organized as shown in Figure 10A. For simplicity in calculation, the earth pressure is simplified into a distributed form as shown in Figure 10B.
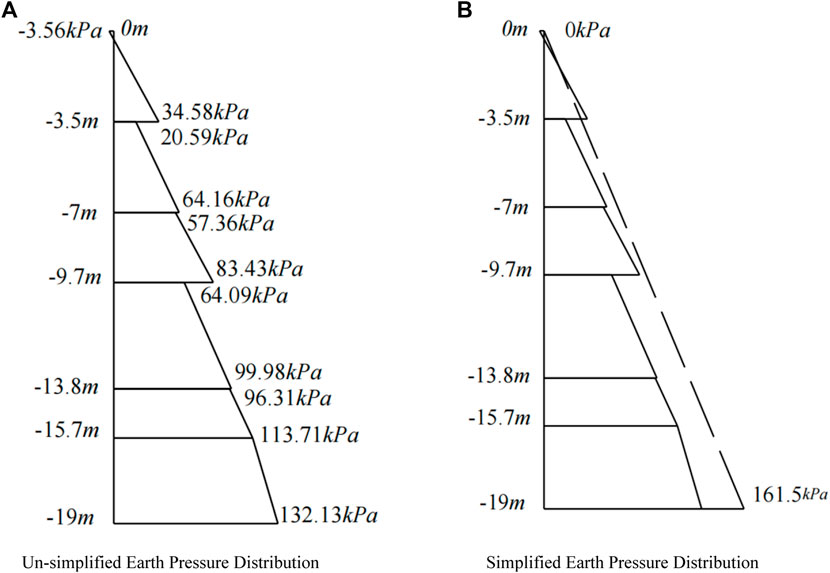
Figure 10. Schematic diagram of earth pressure distribution. (A) Un-simplified earth pressure distribution. (B) Simplified earth pressure distribution.
Considering the contributions of cement soil and steel to the stiffness of the composite beam, the wall stiffness is calculated using the combined stiffness formula (3):
In the formula,
The combined stiffness of the wall per unit calculation width is then calculated as seen in formula (6):
Let the horizontal modulus of subgrade reaction for the foundation soil be
For the construction process, the most unfavorable situations are divided and listed in Table 6.

Table 6. Construction conditions.
For Condition 1, the calculation of the structure’s horizontal displacement is as formulas (8) and (9):
Therefore, the calculation can be conducted as for an elastic long pile, and by using coefficient
The earth pressure on the retaining wall and the support for Condition one are illustrated in Figure 11.
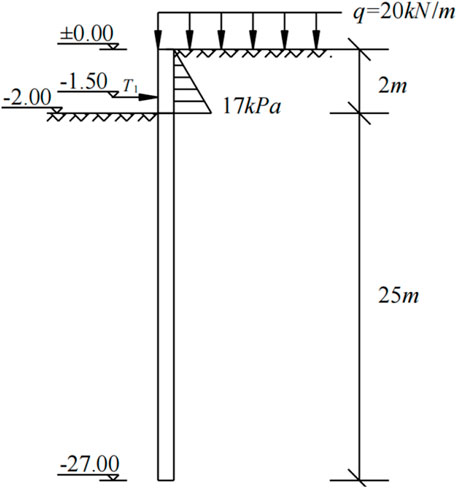
Figure 11. Schematic of retaining wall earth pressure and support under condition 1.
Displacement and rotation under unit force are calculated as formula (11):
To find the wall displacement during the first stage of excavation, the following calculation is performed. Calculate according to formulas (12)–(15):
The total horizontal displacement at the first support under any earth pressure is given by formulas (16) and (17):
Substituting
To:
For
The displacement at the first support under the action of support force T1 can be determined using formulas (22)–(24):
The total horizontal displacement at the first support under the action of support force is given by formula (25):
After applying the support force T1, the displacement at the first support is given by formula (26):
By repeating the above calculation process, the displacements of the support structure and the forces at each support point for various excavation conditions can be determined. After obtaining the support forces, the bending moments and shear forces of the support structure above the excavation face can be calculated, followed by the displacement, bending moments, and shear forces of the structure below the excavation face. The results for each condition are compiled in Figure 12. The measured displacements of the support structure are shown in Figure 13.
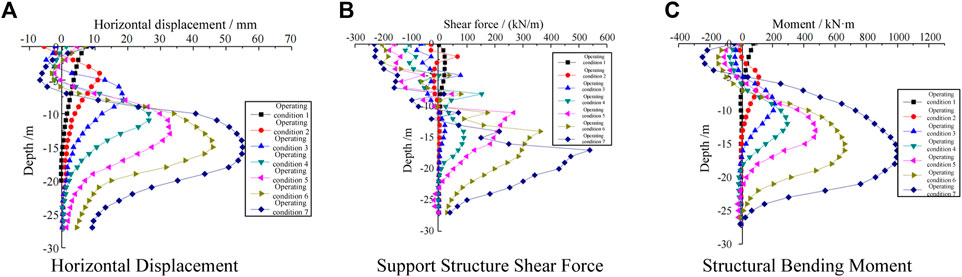
Figure 12. Calculation results of support structure horizontal displacement/shear force/bending moment under various conditions. (A) Horizontal displacement. (B) Support structure shear force. (C) Structural bending moment.
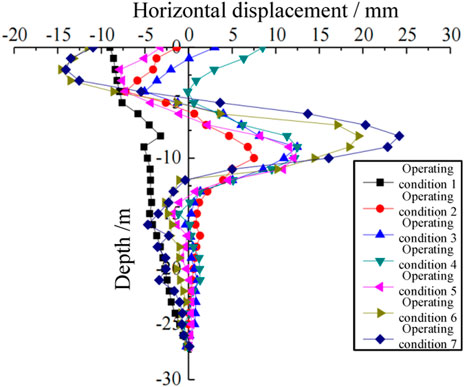
Figure 13. Measured horizontal displacement of the support structure.
Analysis of Figure 12A and Figure 13 indicates that the horizontal displacement of the support structure increases with the depth of excavation. The maximum horizontal displacement position also moves downward with the depth of excavation, approaching the bottom of the pit. The maximum horizontal displacements under various excavation conditions are 7.4 mm, 11.4 mm, 18.7 mm, 26.3 mm, 32.9 mm, 46.1 mm, and 54.9 mm, with significant displacement observed in the later stages of excavation. Comparing Figure 12A with Figure 13, the trend in horizontal displacement of the support structure is similar, and due to the effect of anchors, it develops an “S shape. The calculation results of the method used in this paper can provide a reference for actual engineering design.
According to Figure 12B, the maximum shear force in the pile body throughout the excavation process is 522.8 kN/m, and as per Figure 12C, the maximum bending moment in the pile body during excavation is 991.7 kNm. The maximum bending moments for each condition shift downwards with excavation depth, located near the excavation face, aligning with the overall trend in horizontal displacement.
This section uses FLAC3D numerical simulation software, taking a deep foundation pit project near a subway in Xi’an as an example. On one hand, it validates the use of numerical simulation to predict the deformation and internal force changes of the support structure at various construction stages, providing references for the design, construction, and on-site monitoring of actual projects. On the other hand, it analyzes the deformation patterns of SMW method piles under different stress conditions during the construction process (Zhao et al., 2022; Xu and Yan, 2023).
Before the excavation of the pit, the groundwater inside the pit has been lowered below the excavation area, so the simulation process does not consider the impact of groundwater on the pit. Currently, there are many methods to determine the elastic modulus of soil. Here, a brief introduction is provided for the empirical formula method used in this article to calculate the elastic modulus (Lin et al., 2021b; Peng CX. et al., 2022). Calculate according to formula (27):
In the formula:
After determining the elastic modulus, the bulk modulus
In Eqs (28) and (29) where
The size of the computational boundary significantly impacts the accuracy of numerical calculation results. In this study, a section of the pit measuring 150 m × 60 m is selected for establishing the computational model using tetrahedral elements, generating 9,000 elements and 8,600 nodes, as shown in Figure 14.
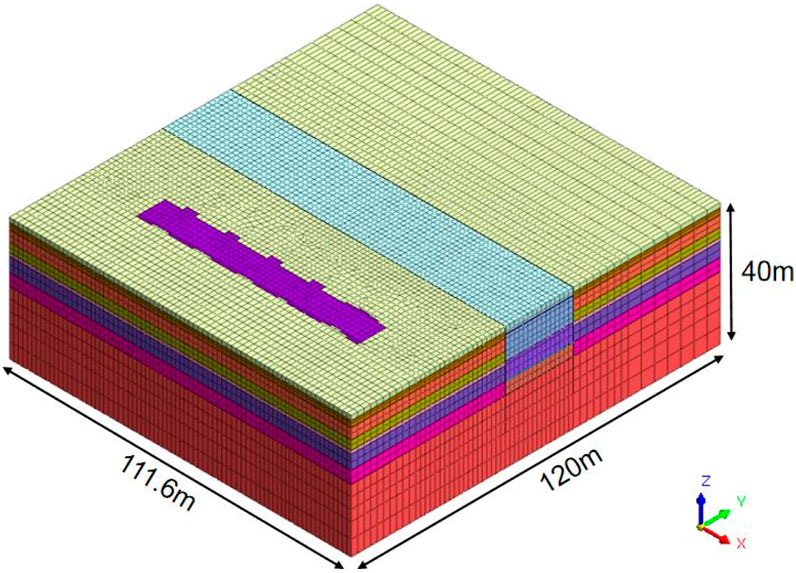
Figure 14. Schematic of the computational model.
The model boundary conditions are set as displacement constraints, i.e., the bottom boundary of the model constrains its z-direction displacement, the outer boundary corresponding to the long side of the pit constrains its y-direction displacement, and the boundary corresponding to the short side constrains its x-direction displacement (Wang et al., 2021; Gang, 2022; Zhou et al., 2022). The method used in this paper to solve for self-weight stress is as follows: first, apply a certain body stress to the soil, with the magnitude of the body stress calculated using the following formula (30):
In the formula,
The support structures are simulated as diaphragm walls with an equivalent thickness of 0.72 m based on the pile spacing and diameter; the SMW method is modeled as a diaphragm wall with an effective thickness of 0.5 m based on the elastic modulus of the section steel, the spacing, and a flange width of 300 mm. It is important to note that in order to ensure node coupling, the support structures cannot be defined through a mesh division command but must be assigned properties through a separation command to enable coupling with the surrounding soil nodes. Anchor rods are implemented as implanted truss elements to facilitate convergence of calculations, with prestress applied to the free segments. Material parameters are as listed in Table 7.
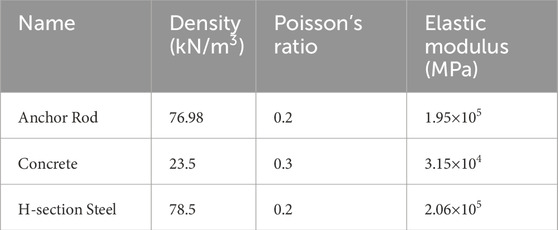
Table 7. Material parameters.
Typically, in simulating the construction process of a pit, all support elements are completed when the model is established. The elements are activated by changing their properties when the simulation step reaches the required component setup. The support structures are activated when the excavation reaches their set positions and are assigned the corresponding parameters. In this paper, the excavation of the pit is achieved using the model null command, with the specific excavation calculation conditions shown in Table 8.
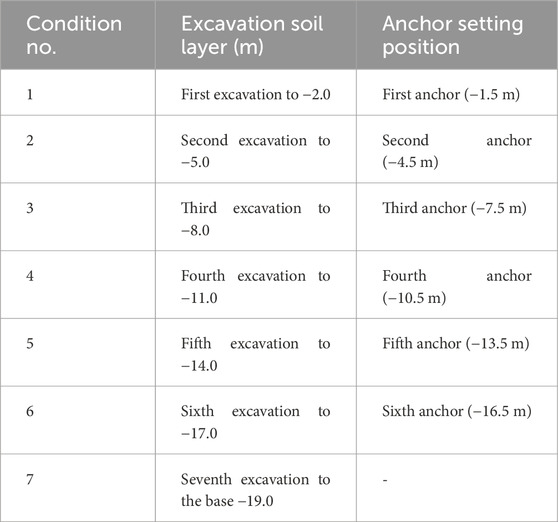
Table 8. Excavation calculation conditions.
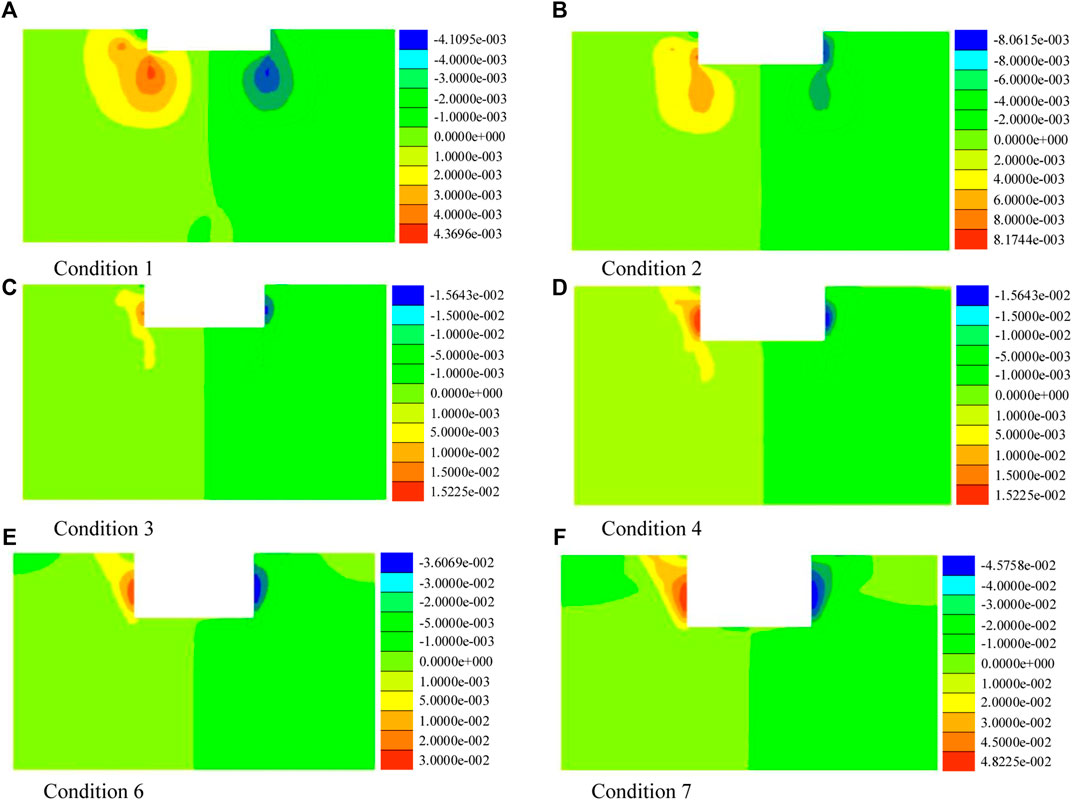
Figure 15. Horizontal displacement nephogram for various conditions. (A) Condition 1. (B) Condition 2. (C) Condition 3. (D) Condition 4. (E) Condition 6. (F) Condition 7.
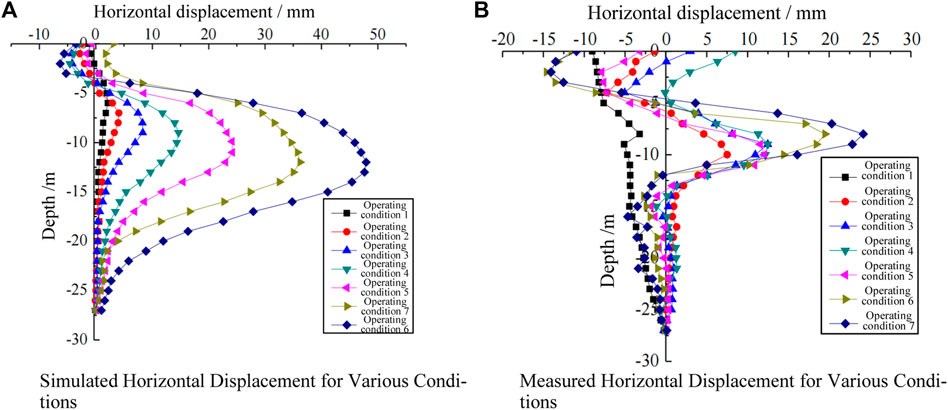
Figure 16. Horizontal displacement nephogram for various conditions. (A) Simulated horizontal displacement for various conditions. (B) Measured horizontal displacement for various conditions.
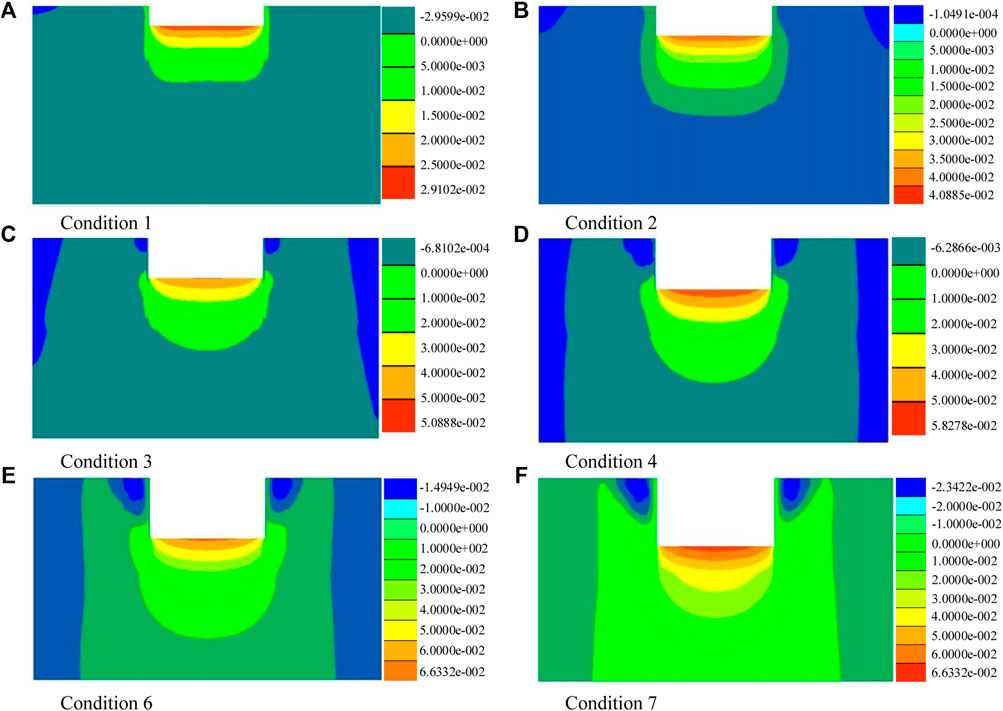
Figure 17. Vertical displacement nephogram for various conditions. (A) Condition 1. (B) Condition 2. (C) Condition 3. (D) Condition 4. (E) Condition 6. (F) Condition 7.
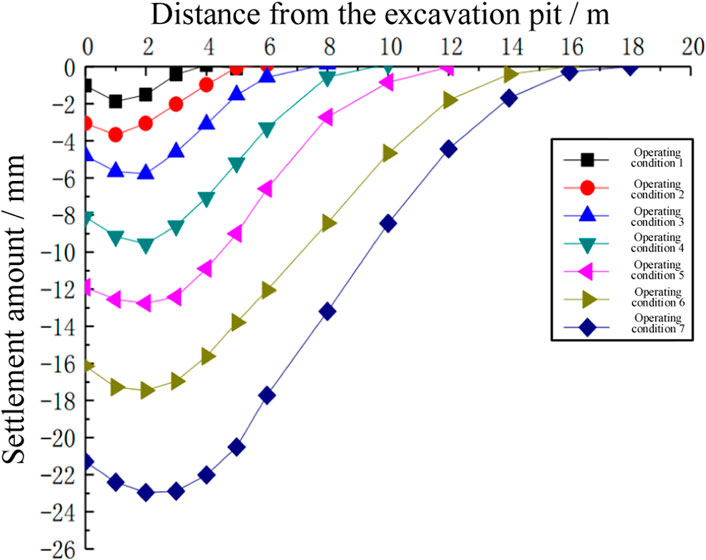
Figure 18. Settlement values around the pit for various conditions.
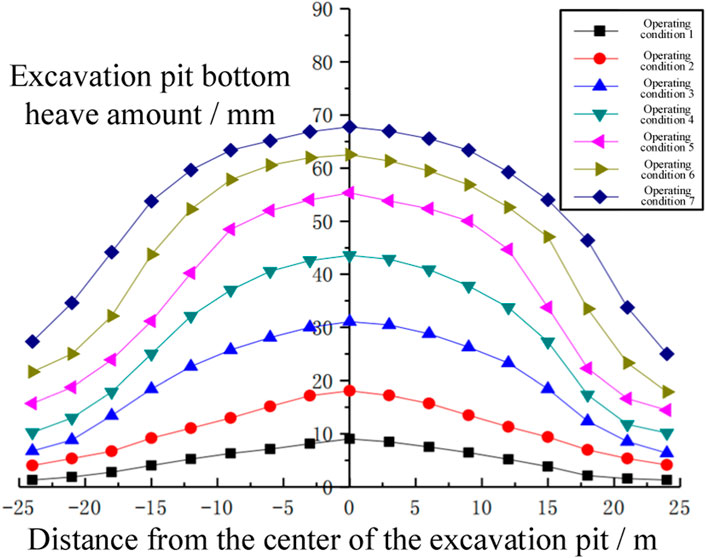
Figure 19. Uplift at the base for various conditions.
The excavation of the pit significantly affects the soil within a certain vicinity. Excavation is akin to unloading after a prolonged loading process, causing previously balanced soil to experience unbalanced forces, leading to subsidence near the excavation area. Due to the free surface formed by the excavation, horizontal movement in the surrounding soil is inevitable. Figure 15 shows the horizontal displacement nephogram at the base of the pit when excavation is complete, and Figure 16 presents the numerical calculation curves for horizontal displacement and the actual monitored displacement curves for various conditions.
(1) Figures 15, 16A illustrate that horizontal displacement of the pit increases with the depth of excavation. The installation of anchors somewhat limits the horizontal displacement of the pit. During the first and second conditions, the horizontal displacement of the pile body is minimal. During subsequent excavation phases, the horizontal displacement of the pile body increases rapidly, with maximum values for each condition being 3.14 mm, 5.1 mm, 9.3 mm, 14.6 mm, 24.2 mm, 36.2 mm, and 47.8 mm. The initial conditions show a gradual increase in pile body horizontal displacement, whereas later excavation stages cause a significant rise due to greater cumulative excavation depth, increased forces on the pile body, and the absence of anchors at the base after the final excavation, leading to a quicker increase in horizontal displacement and significant deformation.
(2) As indicated in Figure 16B, the maximum horizontal displacement in the first four excavation steps occurs near the excavation face, increasing as the excavation progresses. In the final three steps, the maximum displacement location shifts downward slightly, with minimal change in the displacement range.
(3) Comparing Figures 16A,B, both numerical and actual measurements of horizontal displacement show an “S shape, though there are some differences. The numerical calculations suggest a consistent downward shift in the maximum horizontal displacement throughout the excavation process, showing larger values compared to actual measurements, which indicate horizontal displacement around 9–11 m, not changing with excavation depth. Moreover, actual measurements show horizontal displacement moving away from the pit in the soil behind the retaining piles, a trend not observed in the numerical results. This discrepancy might be due to differences in the modeled anchor elements and actual anchor behavior, as well as differences in pile modeling. Nevertheless, the numerical results closely approximate actual measurements, with maximum deformations exceeding measured values, offering a valuable reference for predicting pit deformation and informing engineering design.
After the excavation of the pit, unloading of the soil inside the pit and the self-weight and surface overload on both sides of the support will cause the pit bottom to bulge and the surrounding soil to settle. As the excavation depth increases, the unloading value increases, and the bulging caused by stress release also increases, causing upward plastic deformation of the soil. As the deformation increases, a plastic zone forms around the pit, ultimately causing the base of the pit to bulge. Figure 17 shows the vertical displacement nephogram at the base of the pit after excavation, and Figures 18, 19 respectively show the settlement curves around the pit and the uplift curves at the base for various conditions.
(1) Analysis of Figures 17, 18 indicates that as the excavation depth increases, the unloading value and the surrounding settlement also increase, expanding the affected range of the pit excavation. The surrounding settlement shows a “bowl-shaped” distribution, with the maximum settlement occurring about 1–4 m from the pit edge. This is because the support piles limit the settlement of the soil adjacent to them, preventing the maximum settlement from occurring at the edge of the pit. Additionally, the impact range is within one times the excavation depth. The maximum settlement during the entire excavation process is 23.4 mm, within the allowable range, indicating minimal impact on the surrounding environment due to the pit excavation.
(2) As shown in Figure 19, the uplift deformation of the pit bottom soil gradually increases with the excavation. The maximum uplift occurs at the center of the pit bottom and decreases gradually towards the sides; the closer to the edge of the pit, the faster the decrease in uplift. The uplift values for each excavation condition are 9.3 mm, 18.1 mm, 30.8 mm, 43.8 mm, 54.2 mm, 62.7 mm, and 67.3 mm, respectively. The uplift is relatively minor, indicating that the retaining piles effectively limit the deformation of the soil behind them.
The experimental study in this paper demonstrates that steel-cement composite beams exhibit good flexural performance and ductility under two different loading conditions, validating the effectiveness of the SMW method in enhancing the stability of retaining structures. This finding provides experimental support for using the SMW method in deep foundation pit engineering and directs future research. By comparing with measured data from a pit project in Xi’an, the elastic support method has shown high accuracy in predicting the horizontal displacement of retaining structures, confirming its practical value in engineering applications and serving as a robust computational tool for precise displacement prediction in similar projects. While the FLAC3D simulation results generally align with measured data, deviations in maximum deformation values likely stem from differences between the modeled anchor elements and actual anchors, suggesting that future studies using FLAC3D simulations should refine model parameters to enhance accuracy.
Despite providing valuable insights, this research has limitations, such as the potential impact of parameter settings in numerical simulations on result accuracy. Future studies could optimize model parameters with more measured data. Additionally, this paper primarily focuses on horizontal and vertical displacements, with limited investigation into the internal forces of the support structure, warranting further exploration in future research.
This research employs experimental studies of steel-cement soil composite beams, theoretical calculations using the elastic support point method, and FLAC3D numerical simulations to conduct a comprehensive analysis of the design and deformation patterns of SMW support structures for subway deep foundation pits in the loess areas of Xi’an. Not only does this study enhance the scientific and precision aspects of pit design, but it also provides innovative design methods and practical guidelines for deep foundation pits in loess regions.
1) The experimental study of the steel-cement soil composite beams reveals that the operational process can be divided into a joint action phase and an independent steel action phase, clarifying the mechanisms of interaction between the steel and cement soil at different stages and their impact on the flexural performance of the composite beam. The beams show significant differences in crack development, steel strain changes, and composite stiffness during the two phases. The encasement of the steel by the cement soil contributes positively to the stability and load-bearing performance of the steel within the composite beam. Due to the strong constraining effect of the cement soil on the steel in the composite beam, its failure mode is characterized by bending failure within the loading plane; in contrast, the pure steel beam, lacking such constraints, exhibits out-of-plane buckling failure.
2) Theoretical calculations based on the elastic support point method, compared with actual measurement data from a Xi’an pit project, demonstrate that the proposed method can accurately predict the horizontal displacement trends of the support structures, showcasing its effectiveness and practical utility.
3) FLAC3D simulation results show that the horizontal displacement during pit excavation exhibits an “S-shaped” change, consistent with measured data. However, due to differences between modeled anchor elements and actual anchors, as well as the equivalent treatment of the pile body, the maximum simulated deformation is slightly larger than the measured values, indicating details to be mindful of in simulations.
4) Studies on the subsidence around the pit and the uplift at the base reveal a “bowl-shaped” distribution of subsidence around the pit, with the maximum subsidence not occurring at the pit edge, indicating that the support structure effectively controls the displacement of the surrounding soil. The minimal uplift at the pit base demonstrates the significant restrictive effect of the support structure on deformations in the base soil of the pit.
The original contributions presented in the study are included in the article/Supplementary material, further inquiries can be directed to the corresponding author.
SL: Formal Analysis, Project administration, Writing–original draft. FW: Formal Analysis, Investigation, Resources, Writing–review and editing. YL: Funding acquisition, Methodology, Software, Writing–original draft, Writing–review and editing. YS: Project administration, Resources, Supervision, Writing–review and editing. HL: Methodology, Project administration, Resources, Writing–review and editing. QQ: Methodology, Software, Supervision, Writing–original draft.
The author(s) declare that no financial support was received for the research, authorship, and/or publication of this article.
Authors SL, FW, YL, QQ, YS, and HL were employed by Xiamen CCCC Investment Company Limited.
All claims expressed in this article are solely those of the authors and do not necessarily represent those of their affiliated organizations, or those of the publisher, the editors and the reviewers. Any product that may be evaluated in this article, or claim that may be made by its manufacturer, is not guaranteed or endorsed by the publisher.
Budkowska, B. B., Sekulovic, D., and Branicki, C. J. (2020). Identification of modulus of subgrade reaction for a pile foundation[M]//Numerical Models in Geomechanics. CRC Press, 457–462.
Chen, G., Zhang, X., Zhang, S., Huang, F., Xiao, H., Ma, H., et al. (2023). Response monitoring and analysis in deep foundation pit excavation: a case study in soft soil at subway tunnel intersections. Buildings 13 (5), 1286. doi:10.3390/buildings13051286
Chen, W., and Cui, W. (2018). Study on monitoring of deep foundation pit with SMW engineering method plus anchor cable retaining structure[C]. AIP Conf. Proc. AIP Publ. 1944 (1). doi:10.1063/1.5029730
Eilat, T., Mitelman, A., McQuillan, A., and Elmo, D. (2024). A comparative study of embedded wall displacements using small-strain hardening soil model. Geotechnics 4 (1), 309–321. doi:10.3390/geotechnics4010016
Feng, Z., Xu, Q., Xu, X., Tang, Q., Li, X., and Liao, X. (2022). Deformation characteristics of soil layers and diaphragm walls during deep foundation pit excavation: simulation verification and parameter analysis. Symmetry 14 (2), 254. doi:10.3390/sym14020254
Gang, Z. (2022). Method and application of deformation control of excavations in soft ground. Chin. J. Geotechnical Eng. 44 (1), 1–36. doi:10.11779/CJGE202201001
Gao, X., Tian, W., and Zhang, Z. (2020). Analysis of deformation characteristics of foundation-pit excavation and circular wall. Sustainability 12 (8), 3164. doi:10.3390/su12083164
Gu, S., and Shi, J. (2008). Experimental study and working mechanism analysis of SMW method in deep foundation pits. Rock Soil Mech. 29 (4), 1121–1126.
Hong, C., Zhang, J., and Chen, W. (2022). An integrated intelligent approach for monitoring and management of a deep foundation pit in a subway station. Sensors 22 (22), 8737. doi:10.3390/s22228737
Hou, G., Xu, K., and Lian, J. (2022). A review on recent risk assessment methodologies of offshore wind turbine foundations. Ocean. Eng. 264, 112469. doi:10.1016/j.oceaneng.2022.112469
Hu, B., Xiao, M., Fu, X., Yang, J., Xu, C., Wu, J., et al. (2023). FDEM numerical study of the influence law of geostress on state and pressure of tunnel surrounding rock. Front. Ecol. Evol. 11, 1237250. doi:10.3389/fevo.2023.1237250
Lei, X., Chu, Z., Li, W., et al. (2023). Construction technology of deep foundation pit around existing subway project. Jour-nal Civ. Eng. Urban Plan. 5 (8), 40–47. doi:10.23977/jceup.2023.050806
Li, Z. (2021). Displacement monitoring during the excavation and support of deep foundation pit in complex environment. Adv. Civ. Eng. 2021, 1–7. doi:10.1155/2021/5715306
Lin, P., Liu, P., Ankit, G., and Singh, Y. J. (2021a). Deformation monitoring analysis and numerical simulation in a deep foundation pit. Soil Mech. Found. Eng. 58, 56–62. doi:10.1007/s11204-021-09706-2
Lin, P., Liu, P., Ankit, G., and Singh, Y. J. (2021b). Deformation monitoring analysis and numerical simulation in a deep foundation pit. Soil Mech. Found. Eng. 58, 56–62. doi:10.1007/s11204-021-09706-2
Liu, T., Lu, J., and Liu, H. (2020). Experimental and numerical studies on the mechanical performance of a wall-beam-strut joint with mechanical couplers for prefabricated underground construction. Int. J. Concr. Struct. Mater. 14, 36–23. doi:10.1186/s40069-020-00412-1
Peng, C. X., Liu, N. W., Li, M. G., Zhen, L., and Chen, J. J. (2022b). Hydro-mechanical coupled analyses on wall deformations caused by deep excavations and dewatering in a confined aquifer. Acta Geotech. 17, 2465–2479. doi:10.1007/s11440-021-01408-1
Peng, H., Tang, Q., Zhu, L., Li, Z., Li, H., and Wang, G. (2022a). Deformation control of subway stations under the influence of the construction of deep and large foundation pits with composite support systems. Appl. Sci. 12 (6), 3026. doi:10.3390/app12063026
Roscoe, K. H. (1970). The influence of strains in soil mechanics. Geotechnique 20, 129–170. doi:10.1680/geot.1970.20.2.129
Shi, H., Wang, Z., Huang, C., et al. (2023). A practical method for calculating soil mixing wall retaining structure by means of a “simple beam method”. Math. Problems Eng., 2023. doi:10.1155/2023/2067258
Sun, Y., and Li, Z. (2022). Analysis of deep foundation pit pile-anchor supporting system based on FLAC3D. Geofluids, 2022. doi:10.1155/2022/1699292
Teli, S., Kundhani, P., Choksi, V., et al. (2020). Analytical study on the influence of rigidity of foundation and modulus of subgrade reaction on behaviour of raft foundation[C]//Advances in computer methods and geomechanics: IACMAG symposium 2019 volume 2. Singapore: Springer, 181–194.
Tu, B., Zheng, J., Ye, S., and Shen, M. (2023). Study on excavation response of deep foundation pit supported by SMW piles combined with internal support in soft soil area. Water 15 (19), 3430. doi:10.3390/w15193430
Wang, S., Li, Q., Dong, J., Wang, J., and Wang, M. (2021). Comparative investigation on deformation monitoring and numerical simulation of the deepest excavation in Beijing. Bull. Eng. Geol. Environ. 80, 1233–1247. doi:10.1007/s10064-020-02019-y
Wang, Z., Li, F., and Mei, G. (2024). OpenMP parallel finite-discrete element method for modeling excavation support with rockbolt and grouting. Rock Mech. Rock Eng. 57, 3635–3657. doi:10.1007/s00603-023-03746-w
Wu, W., Lu, H., Chen, S., and Zhang, D. (2024). Effect and control of foundation pit excavation on existing tunnels: a state-of-the-art review. Tunn. Undergr. Space Technol. 147, 105704. doi:10.1016/j.tust.2024.105704
Wu, L., Li, M., Bai, H., Yun, F., Li, H., and Feng, Y. (2024). An iterative calculation method for internal forces and deformation of curved tunnel lining. KSCE J. Civil Eng. 1–12. doi:10.1007/s12205-024-0302-6
Xu, Z., and Yan, S. (2023). Progressive-collapse mechanism of suspended-dome structures subjected to sudden cable rupture. Buildings 13 (6), 1533. doi:10.3390/buildings13061533
Yang, T., Xiong, S., Liu, S., Liu, Y., Zhao, H., and Li, Y. (2022). Numerical analysis of the influence of deep foundation pit construction on adjacent subway stations in soft soil areas. Adv. Civ. Eng. 2022, 1–14. doi:10.1155/2022/6071868
Zhao, J., Tan, Z., Yu, R., Li, Z., Zhang, X., and Zhu, P. (2022). Deformation responses of the foundation pit construction of the urban metro station: a case study in Xiamen. Tunn. Undergr. Space Technol. 128, 104662. doi:10.1016/j.tust.2022.104662
Zhao, Y., Chen, X., Hu, B., Huang, L., Lu, G., and Yao, H. (2023). Automatic monitoring and control of excavation disturbance of an ultra-deep foundation pit extremely adjacent to metro tunnels. Tunn. Undergr. Space Technol. 142, 105445. doi:10.1016/j.tust.2023.105445
Keywords: deep foundation pit, supporting structure, deformation pattern, soil mixing wall (SMW) method, simulation
Citation: Li S, Wang F, Le Y, Que Q, Su Y and Lin H (2024) Design and deformation pattern simulation of deep excavation support structures. Front. Earth Sci. 12:1416957. doi: 10.3389/feart.2024.1416957
Received: 13 April 2024; Accepted: 13 May 2024;
Published: 12 July 2024.
Edited by:
Tianshou Ma, Southwest Petroleum University, ChinaReviewed by:
Aradhana Mishra, Indian Institute of Technology Roorkee, IndiaCopyright © 2024 Li, Wang, Le, Que, Su and Lin. This is an open-access article distributed under the terms of the Creative Commons Attribution License (CC BY). The use, distribution or reproduction in other forums is permitted, provided the original author(s) and the copyright owner(s) are credited and that the original publication in this journal is cited, in accordance with accepted academic practice. No use, distribution or reproduction is permitted which does not comply with these terms.
*Correspondence: Yi Le, MTU4MDA2NTg3MDhAMTYzLmNvbQ==
Disclaimer: All claims expressed in this article are solely those of the authors and do not necessarily represent those of their affiliated organizations, or those of the publisher, the editors and the reviewers. Any product that may be evaluated in this article or claim that may be made by its manufacturer is not guaranteed or endorsed by the publisher.
Research integrity at Frontiers
Learn more about the work of our research integrity team to safeguard the quality of each article we publish.