 Chuan Luo
 Shanshan Pu
- College of Resources and Environment, Xichang University, Xichang, China
Understanding the impact of climate and land use change on soil erosion is particularly important to the development and management of ecosystems. The purpose of this research was to differentiate the impacts of climate and land use alterations on soil erosion by using the InVEST model in the Anning River basin. The findings indicated a rise in average soil erosion from 42.78 t ha−1·a−1 to 49.84 t ha−1·a−1 over the decade from 2010 to 2020, with climate change accounting for 99.71% of the increase and land use change contributing 0.28%. The findings also indicated that the process of urbanization and the implementation of the Returning Grain to Forestry and Grass (RGFG) strategy were effective in decreasing soil erosion by 1.29 t ha−1·a−1 and 6.60 t ha−1·a−1, respectively. Four management measures were developed based on our results. The results of this study are not only of great significance for the environmental protection of a specific region, but also provide references for the mitigation of soil erosion in other regions of the world.
1 Introduction
Understanding the impact of climate and land use change on soil erosion is crucial for ecosystem development and management. Soil erosion, a frequent occurrence in nature, has been identified as a primary factor contributing to soil degradation in arid and semiarid regions (Panagos et al., 2017). There may be a substantial loss of soil fertility, ultimately, a decrease in the productivity of terrestrial ecosystems due to increased soil erosion (Borrelli et al., 2020; Li et al., 2021). Hence, comprehending the spatial patterns and causes of soil erosion is crucial for upholding regional stability and promoting sustainable growth.
Soil erosion has been widely acknowledged to be influenced by climate and land use factors. Climate tends to affect soil erosion through precipitation (Marcinkowski et al., 2022). Increased precipitation intensity and frequency caused by climate change increase soil erosion risks (Li and Fang, 2016). Chen et al. (2018) found that heavy and brief rain showers led to higher erosion rates in the Loess Plateau. Peng et al. (2022) concluded that extreme precipitation accelerated soil erosion in the Qilian Mountains. Additionally, previous studies also predict the future development of regional soil erosion by integrating various climate change scenarios released by the Intergovernmental Panel on Climate Change (IPCC). Marcinkowski et al. (2022) stated that increased precipitation projected in the RCP4.5 and RCP8.5 scenarios could lead to a 7.0%–18.0% increase in soil erosion in Poland. Raj et al. (2022) noted that rainfall would increase under Special Report Emission Scenarios A2 and B2, as well as under the RCP 4.5 and 8.5 scenarios, and that soil losses would be significantly increased under these scenarios.
Soil erosion can be influenced by both climate change and changes in land use. Land use changes can influence land use type and spatial patterns, thus altering the physical properties of the land surface and affecting soil erosion (Sourn et al., 2022). Getachew et al. (2022) concluded that government policies and action plans for conserving the natural environment depend on an understanding of how land use changes affect soil erosion potential. Chen et al. (2024) concluded that conversion from cropland to forest contributes the most to cropland erosion reduction, while conversion from grassland to cropland contributes 56.18% of the increase in soil erosion in the Yunnan Plateau. Golijanin et al. (2022) inferred that soil erosion increased as a result of deforestation in the ski area of Pale Municipality in Bosnia and Herzegovina. Sourn et al. (2022) summarized that soil losses were directly related to the expansion of cropland and the reduction of forest land.
The above studies demonstrate a strong connection between soil erosion and both climate and land use, regardless of which factor is being considered. Shahid et al. (2018) also indicated that climate change and land use change are the two main factors that can alter the catchment hydrological process. Therefore, it may be more meaningful to consider soil erosion drove by climate and land use simultaneously. Using meteorological data and remote sensing data, researchers have assessed soil erosion at various times (Getachew et al., 2022; Li J et al., 2022; Manojlovic et al., 2022), analyzed its characteristics (Dai, et al., 2022), or identified the main driving factors (Li J et al., 2022; Matomela et al., 2022). Efforts have also been made to predict soil erosion characteristics under future scenarios (Borrelli et al., 2020; Eekhout and de Vente, 2022; Senanayake and Pradhan, 2022). Soil erosion has been influenced by both climate change and land use change separately, yet there is a lack of research exploring these connections. In order to formulate effective land use management policies to cope with future climate change, efforts should be carried out to differentiate these factors’ impacts on soil erosion.
The calculation of soil erosion is mostly through mathematical models, such as empirical statistical models: USLE (Wischmeier W. H., 1965) (Universal soil loss equation) and RUSLE (Renard et al., 1991) (Revised Universal soil loss equation), and physical genetic models: SWAT(White et al., 2022) (Soil and Water Assessment Tool), WEEP (Lane et al., 1988) (Water Erosion Prediction Project), etc. Compared with the empirical statistical model, the mechanism models based on physical process have more powerful functions and can describe every process of soil erosion. However, the cost of physical model is high, the data requirements are more stringent, and the calculation processes are complex.
The Anning River watershed is located in the southwestern of China, it shoulders food and drinking water security of the Panxi area. As this region’s economy and population grow rapidly, as well as the Returning Grain to Forestry and Grass (RGFG) project (converting cropland back to forest or grassland) carried out by government, land use types have changed significantly, primarily manifesting as urbanization and afforestation. This region has also experienced significant climate fluctuations, with more frequent extreme weather, resulting in a remarkable impact on soil erosion. Nevertheless, there is insufficient proof to determine whether climate or land use is the primary cause affecting soil erosion in the Anning River watershed, and the extent of their individual impacts remains uncertain. In addition, Identifying the characteristics and spatial distribution of soil erosion is essential for the development of soil conservation policies. It is necessary to study soil erosion in the Anning River basin. Consequently, the objectives of this research were to reveal relative contributions of climate and land use changes to soil erosion, and examine impacts of urbanization and RGFG on soil erosion.
2 Materials and methods
2.1 Study area
The Anning River watershed is located between 101°54′and 102°43′E and between 26°59′and 28°55′N in southwestern of the Sichuan Province, spanning approximately 8,861 km2. The surface elevation of this watershed is between 1,161 and 5,160 m. The landforms are dominated by mountainous and plain regions (Figure 1). The watershed belongs to subtropical monsoon climate, with annual average temperature and precipitation ranged from 12.71°C to 13.11°C, and 827.12 mm–1,210.93 mm, respectively (2010–2020). Precipitation is primarily characterized by short duration of heavy rainfall events, and mainly concentrates during the rainy season from June to September. Potential evapotranspiration increases from 522.54 mm in the north to 1,288.42 mm in the south. The soil structure of the mountain area is poor, the sand content is high, result in poor retention ability for water and fertilizer, and the water source in the valley plain area is sufficient and the soil is fertile. The agricultural area is mainly based on economy and food crops, such as grapes, mangoes, vegetables, rice etc. The predominate land use categories are forest land as well as cropland, cropland is principally concentrated on both sides of the Anning River, and forest land is more evenly distributed outside the plains. land use between 2010 and 2020 changed dramatically, a large amount of cropland was converted into forest land and built-up land. Due to the natural environmental characteristics of the region, such as obvious elevation difference, large relief difference and complex geological conditions, the soil and water loss in the Anning watershed is relatively serious.
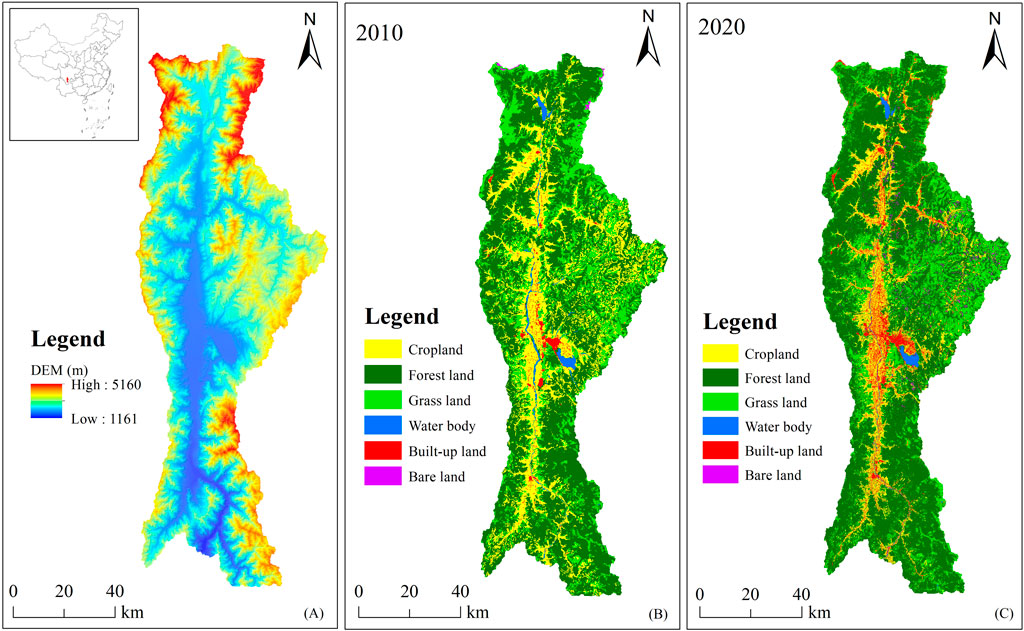
Figure 1. (A) Elevation map of the Anning river watershed. (B) land use types in 2010 of the study area. (C) land use types in 2020 of the study area.
2.2 Data collection and processing
The data required in this work mainly included land use datasets, digital elevation model (DEM), monthly precipitation data, and soil datasets, as listed in Table 1. The downloaded land use datasets were reclassified into six categories, including cropland, forest land, grass land, water body, built-up land and bare land. Kappa value for land use in 2010 and 2020 was 0.88 and 0.89, respectively (Figure 1). The downloaded DEM data was firstly used to determine the boundary of the Anning river watershed, and other datasets were extracted based on the obtained boundary document to establish the Anning river watershed InVEST model database. A 30 m × 30 m spatial resolution was used for all data, with the following coordinate projection system: Krasovsky_1940_Albers.
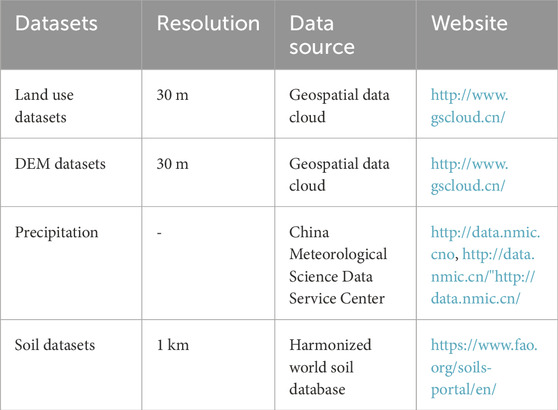
Table 1. The description and source of required data.
2.3 Soil erosion assessment
The sediment delivery ratio (SDR) model available in the InVEST (Integrated Valuation of Ecosystem Services and Trade-offs) model (Tallis et al., 2015) was employed to compute soil erosion. The SDR model was established based on the revised universal soil loss equation (RUSLE) (Renard et al., 1997). As Equation 1 listed:
where SE is the estimated soil erosion (t·ha−1·a−1); R is the rainfall erosivity factor (MJ∙mm·ha-1∙h−1·a−1), to reflect the driving force of soil erosion; K is the soil erodibility factor (t∙ha∙h·ha−1∙MJ−1∙mm−1), accounting for the sensitivity of soil to erosion, higher K value represents the soil type is more vulnerable to erosion; L and S are the slope length and slope gradient factor, respectively; C is the vegetation cover and management factor, higher C value indicates low vegetation cover and more soil erosion; Factor P is usually the ratio of the total amount of soil loss when soil and water conservation measures are taken to that when no measures are taken. 0 indicates that there is almost no soil erosion and the effect of soil and water conservation measures is obvious, 1 indicates that no measures are implemented and the situation is natural erosion. Detailed calculation procedures for the above factors are presented below.
2.3.1 R factor
The rainfall erosivity factor (R) represents the potential damage capacity of soil erosion events caused by rainfall. It is related to rainfall characteristics, and in general, R factor’s influence on soil erosion increases as its value rises. The R factor was calculated by the monthly rainfall erosivity model (Equation 2) (Wischmeier, 1965), the calculation formula was presented below. The result of R was interpolated by the Kriging method to the study area with a spatial resolution of 30 m × 30 m, and obtained R factor for 2010 and 2020 were showed in Figure 2.

Figure 2. Rainfall erosivity factor in 2010 (A) and 2020 (B) for the Anning river watershed.
Where P is the annual average precipitation, Pj is the monthly average precipitation.
2.3.2 K factor
Soil erodibility factor K is a widely used parameter to characterize the sensitivity of soil to erosion in a specific area, this factor was calculated basing on the EPIC model (Williams and Arnold, 1997), higher k value represents the soil is more vulnerable (Equation 3) to erosion. The calculation formula for K was presented below, and the result of K was shown in Figure 3.
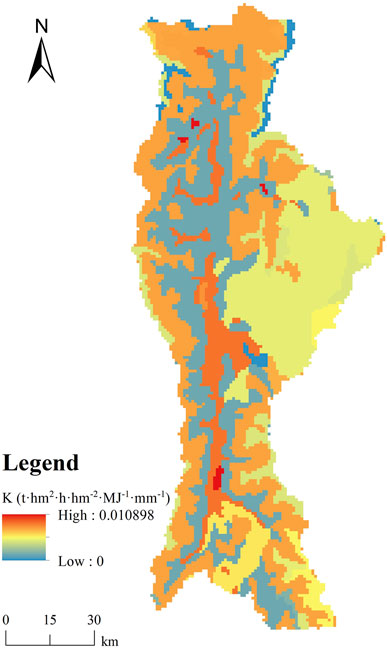
Figure 3. K factor of the Anning river watershed.
Where SAN is the fraction rate of sand, SIL is the fraction of silt, CLA is the fraction of clay, and C is the fraction of organic matter. SN = 1-SAN/100.
2.3.3 L and S factors
L and S is the topographic factor representing the impact of slope length and gradient on soil erosion, which were derived automatically from the DEM by the InVEST model.
2.3.4 C and P factors
C is the vegetation cover factor describing the impact of vegetation on soil erosion, and P denotes land management factor. C and P were computed based on the recent literature (Hu Yunhua et al., 2016; Yao Kun et al., 2021). The results of C and P factors were shown in Table 2.

Table 2. C and P factors for different land use types in Anning river watershed.
2.4 Scenario setting
According to the study objectives, this study developed five scenarios as described below. Soil erosion in 2010 was regarded as the base scenario, and soil erosion in 2020 was called the climate and land use changes scenario, named scenario 1. In scenario 2, Land use was the same with that in 2010 and the climate was the same with that in 2020, i.e., the climate change scenario. Scenario 3 was defined as climate consistent with 2010 and land use consistent with 2020, i.e., the land use change scenario. In scenario 4, from 2010 to 2020, only croplands converted to forests or grasslands was allowed, and the climate was consistent with that in 2010. This scenario represents the Returning Grain to Forest and Grass project in the study area (Figure 4), named RGFG. In scenario 5, land use types only converted to built-up land was allowed between 2010 and 2020, and the climate was consistent with that in 2010 (Figure 4), i.e., the urbanization scenario.
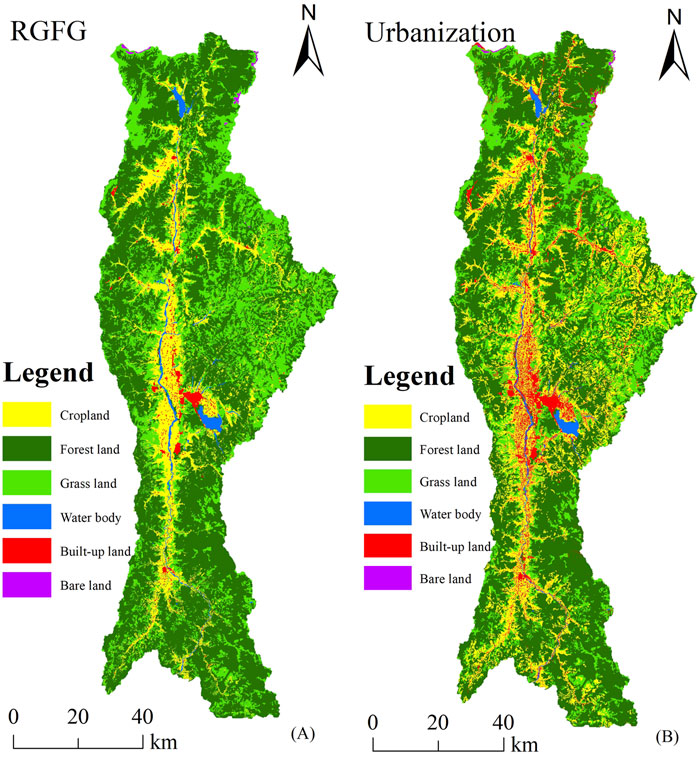
Figure 4. Returning Grain to Forest and Grass (RGFG) (A) and urbanization (B) scenarios in the Anning River watershed.
The relative contribution of scenarios on soil erosion was assumed to the ratio of difference in soil erosion between scenarios 2-5 and the base scenario to that in soil erosion between scenario 1 and base scenario (Equations 4–8) (Ma et al., 2022), and the equations was presented below:
where
3 Results
3.1 Changes in climate and land use
The precipitation changed obviously during the study period in the Anning river watershed. The precipitation in 2010 varied between 1,058.53 mm and 1,211.62 mm, averaging at 1,108.30 mm (Figure 5A). In 2020, the precipitation ranged from 954.92 mm to 1,182.81 mm, with an average of 1,075.23 mm (Figure 5B). Precipitation distribution changed significantly in 2020, showing decreased amounts in the northern regions and increased amounts in the southern regions, contrasting with that observed in 2010. During the study period in the Anning river watershed, it is noteworthy that precipitation exhibited declining trends in 48.0% of the study area and increasing trends in 52.0% of the study area.
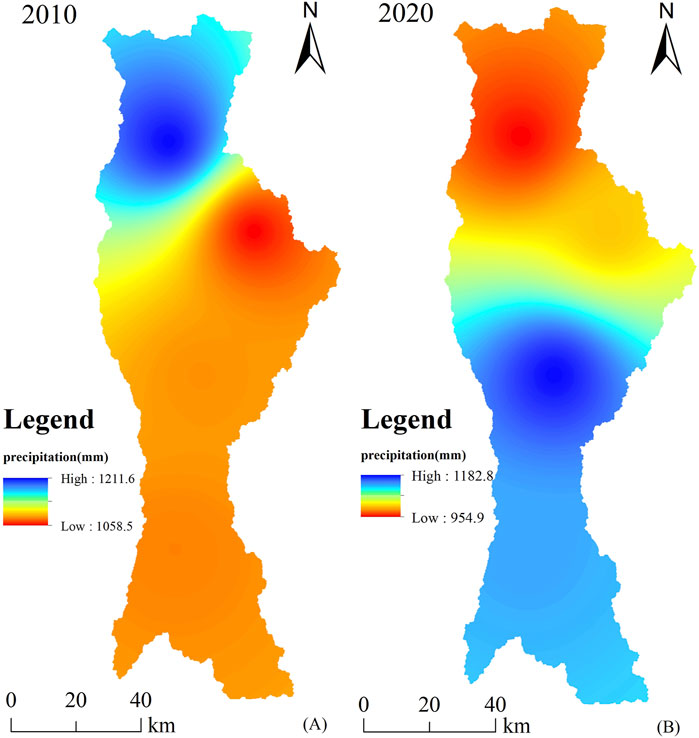
Figure 5. Spatial distribution of precipitation between 2010 (A) and 2020 (B) in the Anning river watershed.
In Table 3, the distribution of different land use categories in the Anning river basin is detailed for the years 2010 and 2020. Land use was both dominated by forestland in 2010 and 2020, accounting for more than 50% of the area, followed by cropland in 2010 and grassland in 2020. During the study period, the most drastic changes of land use categories were cropland and built-up land, and followed by forest land. The areas of croplands and water bodies decreased by 995.66 km2 and 44.46 km2, respectively. By comparison, forestland areas increased by 508.19 km2, built-up areas increased by 390.75 km2, bare land increased by 112.62 km2, and grassland increased slightly, by only 28.53 km2. Based on the land use transfer matrix, cropland principally transformed to forestland, grass land and built-up land, covering 400.81, 548.42, and 292.91 km2, respectively. Increased forestland was mainly transformed form cropland and grass land. Increased built-up land was principally transformed form cropland and grass land.
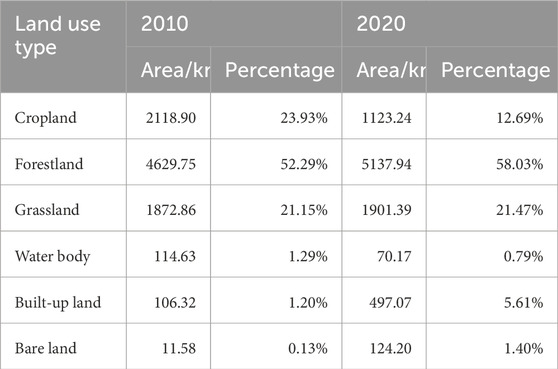
Table 3. The area and percentage for different land use types between 2010 and 2020 in the Anning river watershed.
3.2 Changes in soil erosion
From 2010 to 2020, there was a rise in soil erosion within the Anning river basin, with an average of 42.78 t·ha−1·a−1 and 49.84 t·ha−1·a−1, respectively, and the increased area was mainly concentrated downstream (Figure 6C). The spatial distribution characteristics of soil erosion changed little, both showed the trend of decreasing from the periphery to the middle during the study period in the Anning River watershed (Figures 6A, B). According to the Standards for the Classification and Gradation of Soil Erosion (Ministry of Water Resources of the People’s Republic of China, 2008), soil erosion in the Anning river watershed was dominated by the moderate and relatively low levels, covering over 70% of the entire area. Between 2010 and 2020, the proportion of soil erosion above the “moderate” level increased to 40.6%, with an increment of 4.3% (Table 4), indicating a trend of worsening soil erosion.
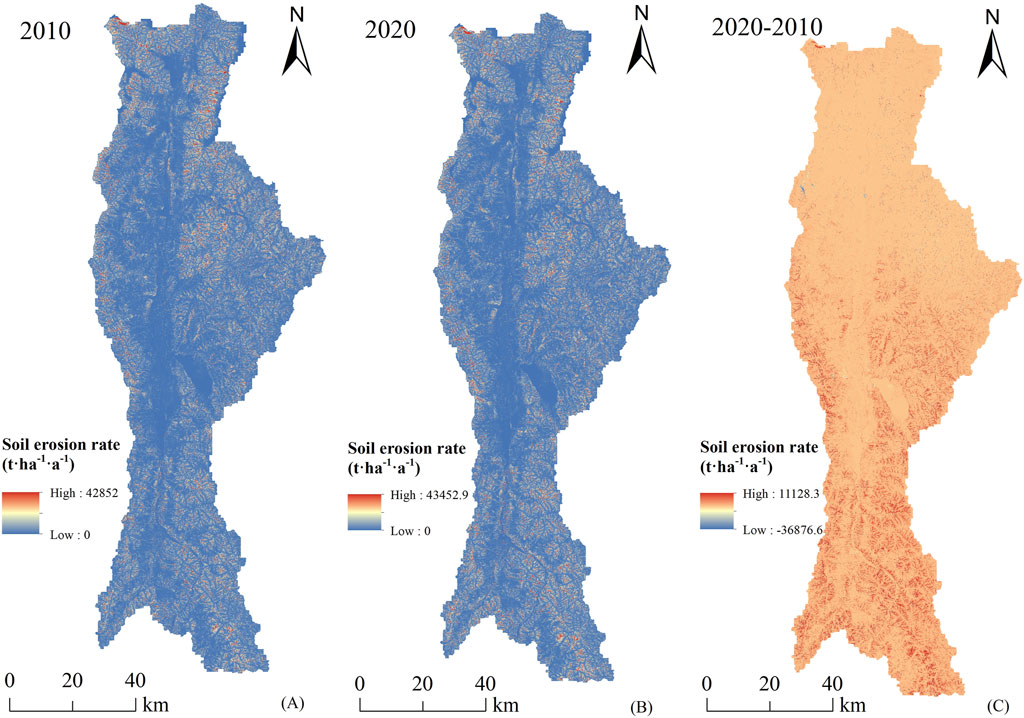
Figure 6. Spatiotemporal distribution of soil erosion between 2010 (A) and 2020 (B). (C) Difference of soil erosion between 2010 and 2020 in Anning river watershed.
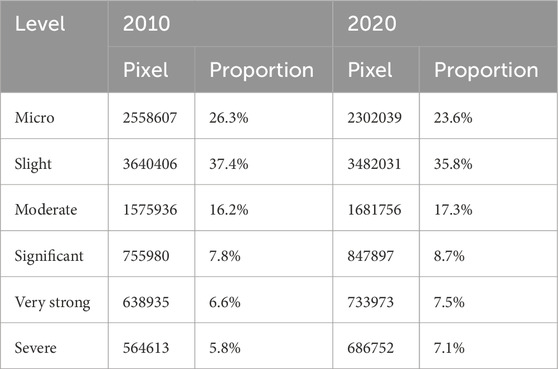
Table 4. Distribution proportion of soil erosion at different levels between 2010 and 2020 in the Anning river watershed.
3.3 Effects of climate and land use changes on soil erosion
Climate change and land use change increased soil erosion by 7.03 t·ha−1·a−1 and 0.02 t·ha−1·a−1, respectively. Because the Anning River basin experienced complex land use changes, such as the Returning Grain to Forest and Grass (RGFG) project and urbanization, impacts of RGFG and urbanization on soil erosion were also carried out. The RGFG project and urbanization resulted in a decrease of 6.60 t·ha−1·a−1 and 1.29 t·ha−1·a−1 in soil erosion, respectively.
Figure 7 shows the relative contributions of climate and land use changes to soil erosion in the Anning river watershed. The region where the effect of climate change on soil erosion over 80% accounted for 95.00% of the watershed (Figure 7A). The effect of land use change on soil erosion was lower than that of climate change, with this factor contributing less than 20% to soil erosion in 96.82% of the affected areas (Figure 7B). According to the analyses of set scenarios, soil erosion was dominated by climate change in 90.63% of the study area, contrasting land use change in 5.04% (Figure 7C).
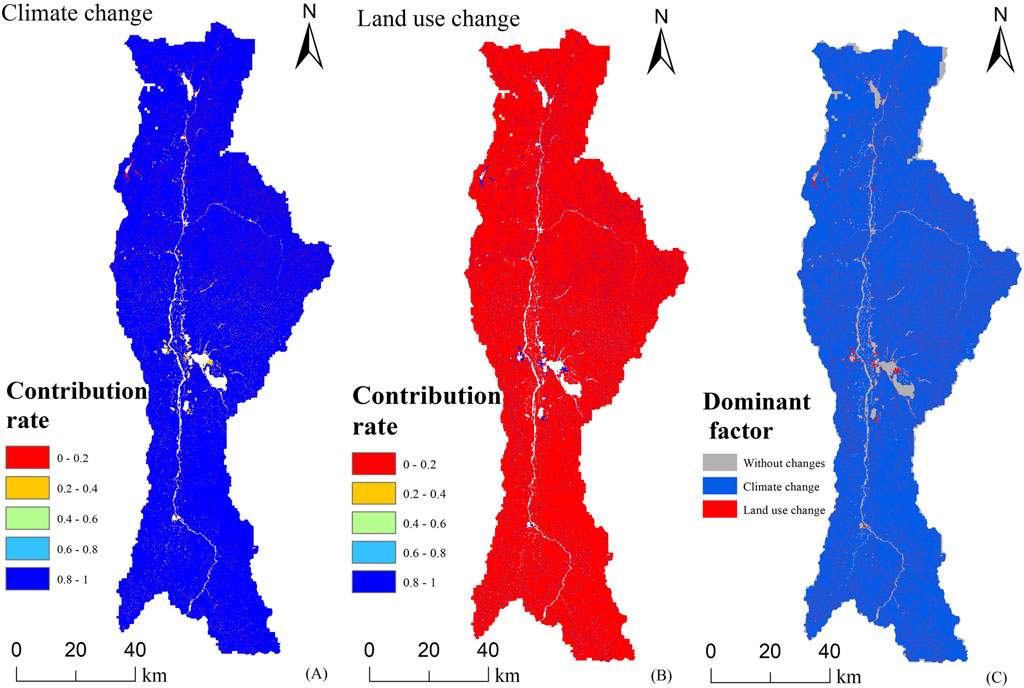
Figure 7. Contributions of climate (A) and land use (B) changes on soil erosion (C) Dominant factor of soil erosion in the Anning river watershed.
4 Discussion
4.1 Impact of climate change on soil erosion
The results of designed scenarios indicated that soil erosion was more drove by climate than that by land use, with a contribution rate of 99.71%. There exist several studies have proved that changes in land use have been the primary factor driving soil erosion. Li P et al. (2022) Indicated that soil erosion was dominated by land use from 1901 to 2010 as a result of extensive deforestation and farming in the Loess Plateau. Additionally, it was verified that changes in land use, particularly the encroachment of cropland on forest and grassland, are the primary factors influencing soil erosion (Yaswanth et al., 2022). In this study, extreme rainfall events increased significantly (4 times in 2010, 9 times in 2020) which may lead to the result that soil erosion was dominated by climate change. Similar findings have also been claimed by previous studies (Bing and Lei, 2022; Ma et al., 2022).
Climate change caused soil erosion showed an increasing trend between 2010 and 2020 in the Anning river watershed, while average precipitation showed a decreasing trend during this period. In comparison with the study conducted by Ma et al. (2022), who summarized that more precipitation would result in more soil erosion, this result was incongruous. The R factor in the RUSLE model was determined based on precipitation, and intense rainfall processes significantly increased the value of R factor. As Figure 2 shows, the average precipitation decreased, however, the R factor increased from 2010 to 2020. In addition, rainfall increased in 52% of the regions, which may have also resulted in additional soil erosion than that measured in the regions with decreased rainfall. As shown in Figures 5, 6, the temporal dynamics and spatial distribution characteristics of soil erosion were similar with those of precipitation. An increment was confirmed for soil erosion in areas experiencing higher levels of rainfall, and the opposite was true as well.
4.2 Effect of land use change on soil erosion
In addition to climate change, soil erosion is also impacted by changes in land use, which makes modifications in the composition and arrangement of land use. Croplands are considered to be the main areas experiencing soil losses due to the intensive agricultural activities, while forests and grasslands are thought to stabilize the soil and reduce soil losses (Getachew et al., 2022; Tien Chinh et al., 2022). According to the findings of the RGFG scenario, there was a 6.60 t·ha−1·a−1 reduction in soil erosion, with a significant contribution rate of 93.65%. This suggests that converting croplands back to forests and grasslands is an effective approach in mitigating soil erosion. Busico et al. (2023) also indicated that soil erosion from forest land was obviously lower than that from farmland. The findings of urban expansion scenario indicate a decrease in soil erosion of 1.29 t·ha−1·a−1 in the Anning river watershed between 2010 and 2020, with a contribution rate of 18.37%, suggesting that urban expansion has the potential to mitigate soil erosion. The discoveries aligned with earlier researches achieved by Gong et al. (2022) and Sourn et al. (2022). Land use alterations accounted for only 0.28% of contribution to soil erosion in the scenario analysis, a significantly lower percentage compared to the impacts of RGFG and urban development. Between 2010 and 2020, influenced by the RGFG and urban expansion, the cropland area was greatly reduced, and the areas of forests, grasslands and built-up lands expanded, all of which would reduce the amount of soil erosion. Yet, analyses of changes in land use scenarios revealed an increase in soil erosion of 0.02 t·ha−1·a−1. In the context of the soil erosion equation, soil erosion in a specific area is primarily influenced by the C and P factors when the R factor remains constant. A P value of 0 for water signifies the absence of soil erosion in aquatic regions. Therefore, it could be inferred that the increased bare land area was an important factor leading to the increase in soil erosion in the Anning river watershed. Attentions should be given to the formation of bare lands in the processes of urbanization. Furthermore, the RGFG project can potentially reduce soil erosion by 6.60 t·ha−1·a−1, whereas soil erosion increases by 0.02 t·ha−1·a−1 under land use change scenario, indicating that the effects of the RGFG policy were weakened. In other words, forestland or grassland may be transformed into cropland, and this result was also confirmed in the land use transfer matrix. Therefore, when implementing the RGFG plan, the current forested areas should be protected and avoid their transformation into different types of land use.
4.3 Uncertainties
Our modelling results are subject to uncertainties, which comes from model input data. High-precision input data can undoubtedly improve the calculation accuracy of the model, but it often costs a lot. As for the RUSLE model used in this work, the R factor is calculated by using the monthly rainfall erosivity model, and the rainfall erosivity of the whole study area is obtained by using spatial interpolation technology. Therefore, the more rainfall stations there are, the more accurately the spatial distribution of rainfall erosivity can be described. In this study, the four rainfall stations used are evenly distributed in the study area, which can characterize the spatial distribution of rainfall erosivity. Consequently, these rainfall stations are representativeness. K factor is calculated by EPIC model using soil datasets. The spatial resolution of soil datasets obtained from the Harmonized world soil database is 1 km. In spite of its resolution is relatively low, it is the most convenient data source available for soil erosion research at present (Ma et al., 2022; Peng et al., 2022). The DEM and land use datasets with a resolution of 30 m were used. Although higher resolution of DEM and land use datasets can be obtained, they are relatively expensive and result in relatively low operating efficiency of the model. At present, DEM and land use datasets with 30 m resolution are generally used in the research of soil erosion (Gong et al., 2022; Li P et al., 2022; Ma et al., 2022).
It is difficult to verify the results of soil erosion in this work, and consequently increase modelling uncertainty. On the one hand, the study period is 2010 and 2020, the model parameters can not be determined by plot runoff experiment, and there is a lack of soil erosion observation data. On the other hand, researches of soil erosion are insufficient in this region at present. The existing research in the Anning river watershed only discussed the classification of soil erosion without describing the amount of soil erosion (Yao Kun et al., 2021). From the perspective of soil erosion grading results, our results are consistent with existing study.
4.4 Development of management measures
This study disclosed the effect of land use and climate change on soil erosion, as well as their relative contributions in the Anning river watershed. The obtained results can be used to propose ecological management measures for the study area. Therefore, four suggestions are developed to cope with soil erosion in the Anning river watershed for decision makers. Firstly, since climate is the dominant factor of soil erosion in this region and extreme weather is becoming more frequent (Eekhout and de Vente, 2022), climate monitoring should be strengthened, and soil erosion characteristics under future changing environments should be predicted in order to formulate effective management measures in advance. Secondly, although the implementation of the RGFG project can significantly reduce soil erosion, the final effect is not very satisfactory. According to the above analyses, it is concluded that part of forest land is converted into cropland during the RGFG process. In fact, farmers have the potential to increase their income by destroying forests (Xiong et al., 2020). Thus, more strict forest protection measures should be formulated to prevent forest land from being destroyed. Thirdly, exclusive of the cropland that was converted into forest land during the implementation of the RGFG project, some cropland was also converted into construction land. Therefore, the monitoring of cropland should be strengthened. In addition, since farmers usually expand cropland area through reclamation, farmers’ income can be increased through the development of high-standard farmland and organic ecological agriculture to prevent the formation of inappropriate cropland (Akpoti et al., 2021). Finally, In the process of urbanization, the increased areas mainly come from cropland and grassland. The occupation of cropland should be reduced to ensure the ecological red line of cultivated land released by the Chinese government (Wang et al., 2021). In addition, the bare land formed in the process of urbanization is one of the main sources of soil erosion, and the management of bare land should be strengthened. Furthermore, the creation of bare land during urbanization is a significant contributor to soil erosion, necessitating enhanced management of such land. These management measures can also provide references for other areas with serious soil erosion in the world, but the main influencing factors of soil erosion need to be identified first.
5 Conclusion
In this study, the InVEST model was employed to distinguish the relative contribution of climate and land use changes to soil erosion in the Anning River watershed between 2010 and 2020. Findings from this study could be summarized by the following points. Climate change is the predominate factor affecting soil erosion in the Anning River watershed, and with a contribution rate of 99.17%. The results of land use change scenario analyses showed that the Returning Grain to Forest and Grass (RGFG) policy is an effective measure to reduce soil erosion, and attentions should be given to the protection of existing forestland when implementing the RGFG policy. Urbanization also has the potential to mitigate soil erosion. In addition, the bare lands formed during the urbanization process greatly impacted soil erosion. We further proposed four management measures based on the findings. Our results can provide reference for other regions that aimed to mitigate soil erosion in the world.
The results from this study provide a perspective of climate change and land use change on soil erosion in the Anning River watershed. Since climate change is the main factor causing soil erosion in this region, and extreme rainfall often plays an important role in the process of soil erosion. Therefore, future studies can use physical models, such as SWAT and AnnAGNPS etc. to more clearly depict soil erosion during heavy rainfall.
Data availability statement
The original contributions presented in the study are included in the article/supplementary material, further inquiries can be directed to the corresponding author.
Author contributions
CL: Conceptualization, Data curation, Formal Analysis, Methodology, Resources, Software, Writing–original draft, Writing–review and editing. SP: Data curation, Methodology, Software, Writing–review and editing. GY: Investigation, Software, Visualization, Writing–review and editing.
Funding
The author(s) declare that no financial support was received for the research, authorship, and/or publication of this article.
Acknowledgments
We give thanks to the research team at the China’s Land-Use/Cover Datasets (CLUDs) and China Meteorological Administration for providing the multisource data, as well as financial support by the PhD Start-up Project of Xichang University (YBZ201801).
Conflict of interest
The authors declare that the research was conducted in the absence of any commercial or financial relationships that could be construed as a potential conflict of interest.
Publisher’s note
All claims expressed in this article are solely those of the authors and do not necessarily represent those of their affiliated organizations, or those of the publisher, the editors and the reviewers. Any product that may be evaluated in this article, or claim that may be made by its manufacturer, is not guaranteed or endorsed by the publisher.
References
Akpoti, K., Dossou-Yovo, E. R., Zwart, S. J., and Kiepe, P. (2021). The potential for expansion of irrigated rice under alternate wetting and drying in Burkina Faso. Agric. Water Manag. 247, 106758. doi:10.1016/j.agwat.2021.106758
Bing, D., and Lei, S. (2022). Remote sensing quantitative research on soil erosion in the upper reaches of the minjiang river. Front. Earth Sci. 10. doi:10.3389/feart.2022.930535
Borrelli, P., Robinson, D. A., Panagos, P., Lugato, E., Yang, J. E., Alewell, C., et al. (2020). Land use and climate change impacts on global soil erosion by water (2015-2070). Proc. Natl. Acad. Sci. U. S. A. 117 (36), 21994–22001. doi:10.1073/pnas.2001403117
Busico, G., Grilli, E., Carvalho, S. C. P., Mastrocicco, M., and Castaldi, S. (2023). Assessing soil erosion susceptibility for past and future scenarios in semiarid mediterranean agroecosystems. Sustainability 15 (17), 12992. doi:10.3390/su151712992
Chen, G., Zhao, J., Duan, X., Tang, B., Zuo, L., Wang, X., et al. (2024). Spatial quantification of cropland soil erosion dynamics in the yunnan plateau based on sampling survey and multi-source LUCC data. Remote Sens. 16 (6), 977. doi:10.3390/rs16060977
Chen, H., Zhang, X., Abla, M., Lu, D., Yan, R., Ren, Q., et al. (2018). Effects of vegetation and rainfall types on surface runoff and soil erosion on steep slopes on the Loess Plateau, China. Catena 170, 141–149. doi:10.1016/j.catena.2018.06.006
Dai, T., Wang, L., Li, T., Qiu, P., and Wang, J. (2022). Study on the characteristics of soil erosion in the black soil area of northeast China under natural rainfall conditions: the case of sunjiagou small watershed. Sustainability 14 (14), 8284. doi:10.3390/su14148284
Eekhout, J. P. C., and de Vente, J. (2022). Global impact of climate change on soil erosion and potential for adaptation through soil conservation. Earth-Science Rev. 226, 103921. doi:10.1016/j.earscirev.2022.103921
Getachew, W., Kim, D., Li, Q., Eu, S., and Im, S. (2022). Assessing the long-term impact of land-use and land-cover changes on soil erosion in Ethiopia's Chemoga Basin using the RUSLE model. Landsc. Ecol. Eng. 18 (4), 461–475. doi:10.1007/s11355-022-00518-6
Golijanin, J., Nikolic, G., Valjarevic, A., Ivanovic, R., Tunguz, V., Bojic, S., et al. (2022). Estimation of potential soil erosion reduction using GIS-based RUSLE under different land cover management models: a case study of Pale Municipality, B and H. Front. Environ. Sci. 10. doi:10.3389/fenvs.2022.945789
Gong, W., Liu, T., Duan, X., Sun, Y., Zhang, Y., Tong, X., et al. (2022). Estimating the soil erosion response to land-use land-cover change using GIS-based RUSLE and remote sensing: a case study of miyun reservoir, north China. Water 14 (5), 742. doi:10.3390/w14050742
Hu Yunhua, L. B., Song, C., and He, X. (2016). Soil erosion estimation in Liangshan mountain areas of Sichuan province based on USLE model. Bull. soil water conservation 36 (4), 232–236. doi:10.13961/j.cnki.stbctb.2016.04.041
Lane, L. J., Gilley, J. E., Nearing, M. A., and Nicks, A. D. (1988). The USDA water erosion prediction project; proceedings of the US Department of Agriculture. Agric. Res. Serv. Lafayeette(USA).
Li, D., Lu, X., Overeem, I., Walling, D. E., Syvitski, J., Kettner, A. J., et al. (2021). Exceptional increases in fluvial sediment fluxes in a warmer and wetter High Mountain Asia. Science 374 (6567), 599–603. doi:10.1126/science.abi9649
Li, Z., and Fang, H. (2016). Impacts of climate change on water erosion: a review. Earth-Science Rev. 163, 94–117. doi:10.1016/j.earscirev.2016.10.004
Li J, J., Zhou, Y., Li, Q., Yi, S., and Peng, L. (2022). Exploring the effects of land use changes on the landscape pattern and soil erosion of western hubei province from 2000 to 2020. Int. J. Environ. Res. Public Health 19 (3), 1571. doi:10.3390/ijerph19031571
Li P, P. F., Chen, J. N., Zhao, G. J., Holden, J., Liu, B. T., Chan, F. K. S., et al. (2022). Determining the drivers and rates of soil erosion on the Loess Plateau since. Sci. Total Environ. 823, 153674. doi:10.1016/j.scitotenv.2022.153674
Ma, S., Li, Y., Zhang, Y., Wang, L.-J., Jiang, J., and Zhang, J. (2022). Distinguishing the relative contributions of climate and land use/cover changes to ecosystem services from a geospatial perspective. Ecol. Indic. 136, 108645. doi:10.1016/j.ecolind.2022.108645
Manojlovic, S., Sibinovic, M., Srejic, T., Novkovic, I., Milosevic, M. V., Gataric, D., et al. (2022). Factors controlling the change of soil erosion intensity in mountain watersheds in Serbia. Front. Environ. Sci. 10. doi:10.3389/fenvs.2022.888901
Marcinkowski, P., Szporak-Wasilewska, S., and Kardel, I. (2022). Assessment of soil erosion under long-term projections of climate change in Poland. J. Hydrology 607, 127468. doi:10.1016/j.jhydrol.2022.127468
Matomela, N., Li, T., Ikhumhen, H. O., Lopes, N. D. R., and Meng, L. (2022). Soil erosion spatio-temporal exploration and Geodetection of driving factors using InVEST-sediment delivery ratio and Geodetector models in Dongsheng, China. Geocarto Int. 37, 13039–13056. doi:10.1080/10106049.2022.2076912
Ministry of Water Resources of the People's Republic of China. (2008). Standards for classification and gradation of soil erosion (SL 190-2007).
Panagos, P., Borrelli, P., Meusburger, K., Yu, B., Klik, A., Lim, K. J., et al. (2017). Global rainfall erosivity assessment based on high-temporal resolution rainfall records. Sci. Rep. 7, 4175. doi:10.1038/s41598-017-04282-8
Peng, Q., Wang, R. H., Jiang, Y. L., Zhang, W. D., Liu, C. W., and Zhou, L. M. (2022). Soil erosion in qilian mountain national park: dynamics and driving mechanisms. J. Hydrology-Regional Stud. 42, 101144. doi:10.1016/j.ejrh.2022.101144
Raj, A. D., Kumar, S., and Sooryamol, K. R. (2022). Modelling climate change impact on soil loss and erosion vulnerability in a watershed of Shiwalik Himalayas. Catena 214, 106279. doi:10.1016/j.catena.2022.106279
Renard, K. G., Foster, G. R., Weesies, G. A., and Porter, J. P. (1991). Revised univesal soil loss equation(RUSLE). J. soil water conservation 46 (1).
Renard, K. G., Foster, G. R., Weesies, G. A., Mccool, D. K., and Yoder, D. C. (1997). Predicting soil erosion by water: a guide to conservation planning with the revised universal soil loss equation(RUSLE). Agriculture Handbook: USDA, 703.
Senanayake, S., and Pradhan, B. (2022). Predicting soil erosion susceptibility associated with climate change scenarios in the Central Highlands of Sri Lanka. J. Environ. Manag. 308, 114589. doi:10.1016/j.jenvman.2022.114589
Shahid, M., Cong, Z. T., and Zhang, D. W. (2018). Understanding the impacts of climate change and human activities on streamflow: a case study of the Soan River basin, Pakistan. Theor. Appl. Climatol. 134 (1-2), 205–219. doi:10.1007/s00704-017-2269-4
Sourn, T., Pok, S., Chou, P., Nut, N., Theng, D., and Prasad, P. V. V. (2022). Assessment of land use and land cover changes on soil erosion using remote sensing, gis and RUSLE model: a case study of battambang province, Cambodia. Sustainability 14 (7), 4066. doi:10.3390/su14074066
Richard, S., Rebecca, C. K., Spencer, W., Anne, G., Heather, T., Taylor, R., et al. (2015). InVEST 3.2 user’s guide. Stanford: The Natural Capital Project.
Tien Chinh, N., Whelan, M., and Nichols, J. D. (2022). Soil erosion response to land use change in a mountainous rural area of Son La Province of Vietnam. Environ. Monit. Assess. 194 (3), 149. doi:10.1007/s10661-022-09844-6
Wang, S. J., Liu, Z. T., Chen, Y. X., and Fang, C. L. (2021). Factors influencing ecosystem services in the Pearl River Delta, China: Spatiotemporal differentiation and varying importance. Resour. Conservation Recycl. 168, 105477. doi:10.1016/j.resconrec.2021.105477
White, M. J., Arnold, J. G., Bieger, K., Allen, P. M., Gao, J. G., Cerkasova, N., et al. (2022). Development of a field scale SWAT+ modeling framework for the contiguous U.S. J. Am. Water Resour. Assoc. 58 (6), 1545–1560. doi:10.1111/1752-1688.13056
Williams, J. R., and Arnold, J. G. (1997). A system of erosion-sediment yield models. Soil Technol. 11 (1), 43–55. doi:10.1016/s0933-3630(96)00114-6
Wischmeier, W. H. S. D. D. (1965). “Predicting ranifall erosion losses from cropland east of the rocky mountains,” in Agricultural handbook. Washington DC:No1282: US Department of Agriculture.
Xiong, B., Chen, R. S., Xia, Z. L., Ye, C., and Anker, Y. (2020). Large-scale deforestation of mountainous areas during the 21st century in zhejiang province. Land Degrad. and Dev. 31 (14), 1761–1774. doi:10.1002/ldr.3563
Yao Kun, Z. C., Yuzhen, Li, Lei, He, and Xiaoju, Li (2021). Sptial-temporal evolution and prediction of soil erosion in Anning river basin, Sichuan province. Yangtze River 53 (7), 65–70. doi:10.16232/j.cnki.1001-4179.2021.07.011
Yaswanth, K., Kona, M., Andra, S. K., and Rathinasamy, M. (2022). Understanding the impact of changes in land-use land-cover and rainfall patterns on soil erosion rates using the RUSLE model and GIS techniques: a study on the Nagavali River basin. J. Water Clim. Change 13, 2648–2670. doi:10.2166/wcc.2022.016
Keywords: soil erosion, climate change, land use change, InVEST, Anning River watershed
Citation: Luo C, Pu S and Yu G (2024) Investigating the impact of climate and land use changes on soil erosion in the Anning River basin in China. Front. Earth Sci. 12:1416387. doi: 10.3389/feart.2024.1416387
Received: 12 April 2024; Accepted: 24 September 2024;
Published: 07 October 2024.
Edited by:
Lazarus Chapungu, University of South Africa, South AfricaReviewed by:
Muhammad Shahid, Brunel University London, United KingdomGianluigi Busico, University of Campania Luigi Vanvitelli, Italy
Copyright © 2024 Luo, Pu and Yu. This is an open-access article distributed under the terms of the Creative Commons Attribution License (CC BY). The use, distribution or reproduction in other forums is permitted, provided the original author(s) and the copyright owner(s) are credited and that the original publication in this journal is cited, in accordance with accepted academic practice. No use, distribution or reproduction is permitted which does not comply with these terms.
*Correspondence: Chuan Luo, bGNfbm90ZWtAMTYzLmNvbQ==