 Fang-Yi Lee
 Eh Tan
 Emmy T. Chang
- 1Institute of Oceanography, National Taiwan University, Taipei, Taiwan
- 2Institute of Earth Sciences, Academia Sinica, Taipei, Taiwan
We employed numerical models to examine the dynamics of fold-and-thrust belts (FTBs), particularly focusing on the spatial and temporal interplay between stress variations and fault development. Our study explores the effects of variables such as layer thickness, basal friction, and surface diffusivity on the FTBs’ structural development, emphasizing the conditions under which frontal thrusts form. We found that fault activities within FTBs exhibit a cyclic behavior characterized by phases of initiation, quiescence, and reactivation. For over 95% of the total cycle duration, the frontal thrusts are the only active structures, and the stress within the FTB predominantly remains in a critical state. During the remaining 5%, the stress becomes over-critical, leading to the formation of a proto-thrust zone and the reactivation of pre-existing thrusts within the FTB. The lateral growth rate of FTBs is directly related to the thickness of the deforming layer, with the progression of the deformation front maintaining a steady pace across the study period. Additionally, our analysis on the progression of FTBs highlights the critical role of zonal failure spacing in determining the structural styles within FTBs. Our results indicate that narrowly spaced zonal failures, which promote the emergence of low-angle forethrusts, are more likely to occur at increased distances from the backstop. This explains the sequential frontal failure in the FTB; however, the stress accumulating at the rear weak zones also play an important role in the evolutionary patterns of the FTB. Our study offers new insights into the complex processes governing the mountain formation.
1 Introduction
Convergent plate boundaries experience intense compressive forces, often leading to collisions or subduction events. Along these boundaries, fold-and-thrust belts (FTBs) are formed, characterized by a series of folds and thrust faults. These thrusts cut through the rocks and create fault-bounded blocks called thrust sheets. With further shortening, these thrust sheets can undergo bending and stacking, which play a major role in mountain building. The uplifted materials from deep within the Earth’s crust make FTBs rich in natural resources such as energy and minerals, rendering them economically significant and attractive for human settlement. However, living on FTBs are not without their challenges. FTBs are often associated with active deformation and frequent seismic activity, posing hazards to society. Therefore, comprehending the evolution of FTBs presents an opportunity to devise strategies for earthquake hazard assessment and mitigation.
The deformation of an FTB is characterized by brittle frictional processes, which can be described by the Mohr-Coulomb failure criterion (Dahlen et al., 1984; Lallemand et al., 1994). Basing on the criterion, the critical wedge theory has been developed to establish the relationship between the geometric attributes and physical properties of FTBs in convergent wedges. According to the critical wedge theory, the taper angle of an FTB, i.e., the sum of the wedge’s surface slope and the basal dip, as known as the “critical taper”, is primarily controlled by the strength parameters, such as the internal friction and basal friction. Throughout the convergence and deformation of the FTB, it strives to maintain its geometry at the critical taper. To sustain the critical taper angle with continuously accumulating material, the FTB must propagate forward and expand. This propagation allows the FTB to accommodate the accretion of new materials while preserving the critical taper angle, thereby ensuring the stability and geometric integrity of the belt.
Erosion plays a key role in the exhumation of materials buried deep within the wedge. The rate of erosion significantly affects both the transport of materials and the exhumation processes within the FTB, acting as a sculpting force that shapes the landscape and influences the geological evolution of the area (Malavieille, 2010; Konstantinovskaya and Malavieille, 2011; Dal Zilio et al., 2020). As erosion reduces the slope of the FTB below the critical taper angle, the material at the base of the slope moves outward and upward. This adjustment enhances the slope, steering it towards equilibrium with the critical angle. This dynamic interaction between erosion and internal deformation is essential for understanding FTB evolution (Davis et al., 1983; Willett, 1999; Bonnet et al., 2007; Erdős et al., 2019).
The FTB is developed above a distinct interface known as the décollement, which separates the actively deformed upper part from the lower, less-deformed materials. Décollements are characterized by their mechanical weakness. Its strength plays a crucial role in controlling the taper angle and dynamically shaping the convergent wedge, as suggested by critical wedge theory (Dahlen and Barr, 1989). In sandbox experiments, high basal friction tends to generate pop-up structures and form a strong backthrust with multiple forethrusts, while low basal friction leads to frontal accretion, causing imbricated thrusts at relatively low angles (Malavieille, 2010).
Numerical modeling has emerged as a valuable tool for reconstructing the evolution of FTBs and investigating orogenic processes. Previous studies have successfully utilized numerical models to probe into the stress cycle during the FTB evolution (Stuart, 1988; Taylor et al., 1996) and to deepen our understanding of FTB development and orogeny. For example, Hu et al. (2001) and Wang et al. (2013) employed 2D map-view models to analyze the spatial variations of velocity fields and relative movements among blocks during lateral convergence. Fuller et al. (2006) and Vernant and Chéry (2006) utilized 2.5D profile-view models to investigate oblique collisions in regions. Burov et al. (2001) and Burov and Yamato (2008) developed models to explain the formation and exposure of ultra-high pressure metamorphic rocks in collision zones. Stockmal et al. (2007) presented numerical simulations capturing the deformation of FTBs with multiple décollements. Yamato et al. (2011) explored the mechanics of the Zagros fold-and-thrust belt, incorporating field data constraints to estimate the friction angle of the crust in the Zagros region. Ruh et al. (2017) formed a 4D model to explain the transgression of the Zagros orogenic belts. These works successfully explained observations of anisotropy and the processes of exhumation.
Building upon the advancements of previous numerical modeling studies, our objective is to enhance our understanding of FTB evolution by scrutinizing its stress evolution with unparalleled spatial and temporal resolution. In this study, we utilize the explicit unstructured finite element solver, DynEarthSol (Choi et al., 2013; Ta et al., 2015), for our models. Through the application of high-resolution numerical models, we intend to dissect the processes of fault localization and the morphological progression of convergent wedges. Our analysis will focus on how these dynamics are influenced by a range of geological variables, including variations in the depth of the décollement, the degree of basal friction, and the rate of surface erosion. This approach not only aims to shed light on the intricate mechanisms driving FTB development but also aspires to provide a refined understanding of the interplay between structural forces and geological processes.
2 Methods and model setting
2.1 Numerical methods
In this study, we use the program DynEarthSol (DES) (Choi et al., 2013; Ta et al., 2015) for modelling. DES is an explicit unstructured finite element solver for tectonic deformation. It solves the momentum equation on Lagrangian meshes. By utilizing an unstructured mesh, DES offers several advantages that enhance our analysis. It allows us to achieve higher spatial resolution in highly deformed areas while maintaining reasonable computational requirements. In shear zones, the adaptive mesh can create local fine mesh to depict complex structures, while maintaining a reasonable amount of mesh number and computation time. This characteristic makes DES a favorable program to simulate surface deformation.
2.2 Model setting
In this study, we adopt a rectangular initial geometry with a lateral length of 450 km (Figure 1). The basement and the surface are horizontal in all experiments. The rectangle is divided into two horizontal zones representing different lithologies of sedimentary rocks. The upper one, i.e., the top strong zone, has a thickness H, which serves as the location where the FTB develops. The lower one has a 1 km thickness, representing the basal weak zone as the décollement.
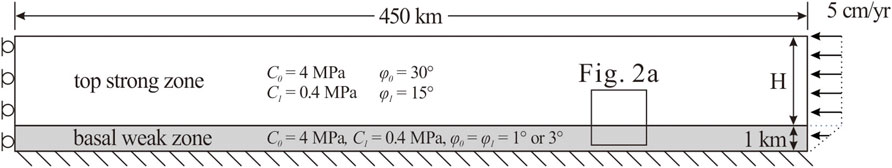
Figure 1. The sketch of model geometry and boundary conditions.
DES solves the equation of motion:

Table 1. Frictional properties.
Each triangular element in our model contains multiple Lagrangian markers tracking materials. Some elements may contain markers of mixed materials, resulting in a mixture of material properties for these elements. The material interface would pass through these elements. Our numerical model incorporates a free surface at the top and a no-slip boundary condition at the bottom. The right boundary moves towards the left at a velocity of 5 cm/yr within the top strong zone, gradually decreasing to 0 velocity at the bottom boundary within the basal weak zone (Figure 1). The left boundary is free-slip and is far from the FTB such that it has no significant effect on the FTB. Therefore, it is not shown in the subsequent figures of the model results.
The models have unstructured triangular mesh. The mesh resolution is 0.4 km initially and locally refines to 0.25 km around faults. All models in this study are conducted over a 2-million-year duration, with a 100-km total shortening by the end of the simulation. Snapshots of the simulation results are outputted every 1,000 years.
The main controlling parameter in the top strong zone thicknesses H (Figure 1), which varies from 3 km, 6 km, 9 km, to15 km. The basal friction of the FTB is controlled by the friction angle (Φb) of the basal weak zone, which is set to 1° or 3° to represent an extremely weak or a weak décollement, respectively.
The hillslope diffusion is applied to the surface topography (Culling, 1960) to model the erosion and re-deposition. It assumes that the rate of topographic change is proportional to the curvature of the surface topography:
With variations in H (4 options), Φb (2 options), and Κe (2 options), this study encompasses a total of 16 models. The naming convention of the models follows these three variables. For example, “Model H3Φ1Κ-6” refers to the model with H = 3 km, Φb = 1°, and Κe = 10–6 m2/s.
2.3 Stress analysis
Stress plays a crucial role in fault behavior and is a vital variable to consider in understanding fault formation. In this study, we will use numerical models to obtain insights into the temporal evolution of stress during fault formation. By analyzing the stress field just above the basal layer, we can identify the location and timing of failures.
Each triangular element in our model contains three Lagrangian markers of the same material initially. After deformation, the mesh may be too distorted and have to be remeshed. Some elements on the new mesh may contain markers of mixed materials, resulting in a mixture of material properties for these elements. The material interface would pass through these elements.
In our stress field analysis, the elements selected for the analysis is a band of less than 1 km thickness, near the base of the top strong zone (Figure 2A). The depth choice excludes shallow elements, which are influenced by transient faults, and elements near the material interface, which might have mixed material properties (Figure 2A). This allows us to focus on non-transient faults cutting through the entire depth and ensures a more accurate assessment of stress distribution within the analyzed zone.
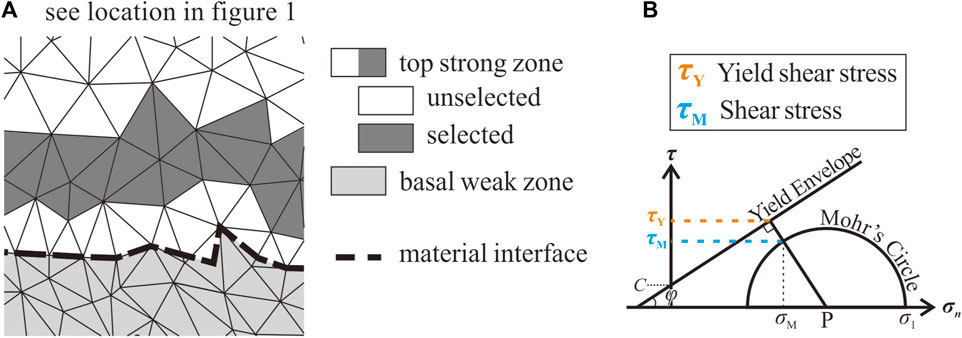
Figure 2. Details of stress analysis. (A) Graphic illustration of the analyzed zone for the stress analysis. (B) Graphic illustration of τM and τY.
The Mohr’s circle of each element is used to compute the normal stress and shear stress on any arbitrarily orientation. By considering the current values of the friction angle (φ) and cohesion (C) of the element, we can establish the yield envelope (Figure 2B). The point (σM, τM) on the Mohr’s circle represents the stress decomposition of the potential failure plane, and it is the closest point to the yield envelope. Additionally, the yield shear stress for that potential failure plane is denoted as τY (Figure 2B). As the analyzed elements are distributed over a depth range of approximately 1 km, both τM and τY exhibit scattering variations with depth. To facilitate interpretation, we will display τY with its lower envelope and τM with its upper envelope. The occurrence of failure is where τM is equal to τY.
When a failure occurs above the basal layer, a new fault may be initiated and cut through the whole layer if the stress condition above is favorable, or, if a fault is already present, the fault may be reactivated. We closely exam the evolution of τM and τY, especially during the initiation and reactivation of faults. A special attention is paid to the position of the leftmost failure, which is termed as the “deformation front” in this study.
The average depth h (∼1 km less than H) of selected elements to the left of deformation front is computed. We define the critical shear stress as
3 Results
The movement of the right boundary in our models leads to the repeatedly development of new frontal thrusts from right to left, resulting in the formation of FTBs (Figure 3). The left bounds of the FTBs are the deformation fronts. We identify two structural styles within the FTBs across various models. Models with a thin initial thickness, low basal friction, and low erosion display closely-spaced forethrusts and less active backthrusts, resulting in imbricated thrust sheets (Figure 3A). In contrast, models with thick initial thickness, high basal friction, and high erosion develop large pop-up structures delineated by pairs of active forethrusts and backthrusts that formed repeatedly (Figure 3B).
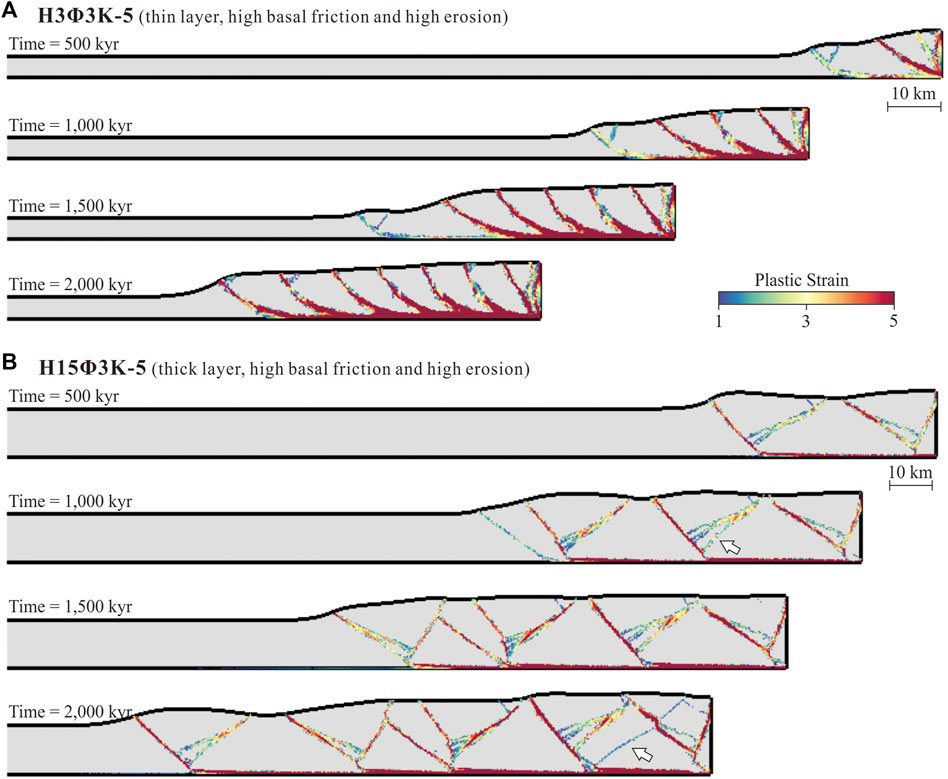
Figure 3. The model evolution along time. The snapshots of plastic strain at 500, 1,000, 1,500 and 2,000 kyr of (A) model H3Φ3Κ-5 and (B) model H15Φ3Κ-5 are displayed. Note that these two models are plotted in difference length scales. The white arrows mark the newly developed backthrusts.
In the model H3Φ3Κ-5, featuring imbricated thrust sheets (Figure 3A), conjugate pairs of frontal thrusts initially form. However, the forethrusts are far more active than the backthrusts, which are displaced along the forethrusts and lifted off the base. Several lifted backthrusts are eventually eroded away, leaving imbricated forethrusts within the FTB.
In the model H15Φ3Κ-5, displaying pop-up structures (Figure 3B), conjugate pairs of frontal thrusts also formed repeatedly. Both forethrusts and backthrusts exhibit similar levels of activity, though some backthrusts are occasionally lifted off the base and become inactive. New backthrusts then emerge at the forethrust hinges (indicated by arrows in Figure 3B), creating a pop-up unit where a forethrust is associated with multiple backthrusts. The plastic strain is usually larger on the forethrust than on each of the corresponding backthrusts.
Additionally, these two model types are further distinguished by variations in fault spacing and the inclination of forethrusts. Specifically, the separation between successive forethrusts is narrower, even after scaled with the layer thickness, in models with imbricated thrust sheets than in those forming pop-up structures. Forethrusts in imbricated sheets are concavely curved with gentler slopes, in contrast to the straight and steeper forethrusts in pop-up structures. Previous studies also highlight the structural variances between imbricated thrust sheets and pop-up structures (Boyer and Elliott, 1982; Mitra, 2002; Graveleau et al., 2012). These disparities stem from the interplay between basal stress conditions and the mechanisms of strain localization, a topic that will receive detailed examination in subsequent sections.
Some models, e.g., H6Φ1Κ-5 (Figure 4C), exhibit a hybrid of the described end-member structural styles. The forethrusts are slightly more active than the backthrusts. Some of the forethrusts are straight. Their associated backthrusts are occasionally lifted off the base, leading to the formation of new backthrusts at the forethrusts’ hinges. Some of the forethrusts are concavely curved. Their associated backthrusts, once lifted off the base, are less prone to reformation. Consequently, these curved forethrusts are similar to thrust sheets.
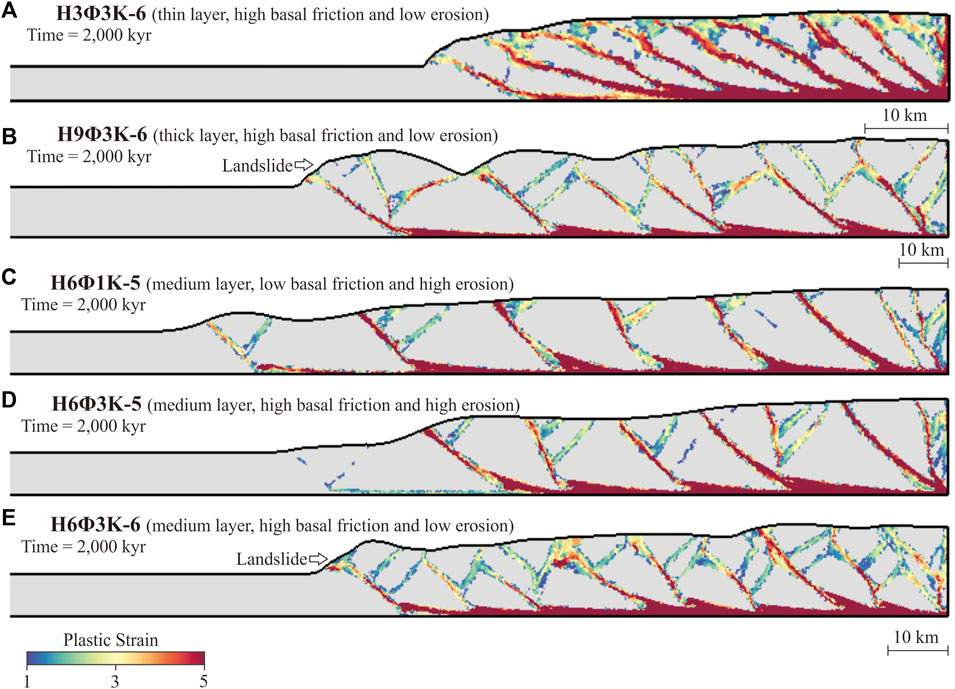
Figure 4. Model results and the effects of the three main variables. The plastic strain at 2,000 kyr of model (A) H3Φ3K-6, (B) H9Φ3K-6, (C) H6Φ1K-5, (D) H6Φ3K-5, and (E) H6Φ3K-6. Note that the length scales in (A,B) are different from that in (C–E). The white arrows indicate the occurrence of landslides in models with low surface processes.
3.1 Effects of parameters
In this section, we investigate the impacts of varying three parameters: layer thickness H, basal friction Φb, and hillslope diffusion constant Κe on our models. These parameters play pivotal roles in determining the scale of fault structures and their development within the simulations (Figure 4). The thickness H significantly influences the faults’ lateral scale and the simulation’s structural styles (Figures 4A, B). In models with reduced thickness, we commonly observe imbricated thrust sheets characterized by evenly spaced forethrusts. In contrast, models with increased thickness often develop extensive pop-up structures featuring multiple backthrusts within each unit. This diversity in backthrust generation within the pop-up units leads to a variety of structures with different active spans, contributing to variable fault propagation rates (to be discussed in Section 4.3).
Increasing basal friction Φb leads to steeper topographic slopes, shorter spatial and temporal intervals between the emergence of forethrusts, as well as a heightened occurrence of backthrusts in the models (Figures 4C, D). This observation is consistent with previous studies (Davis et al., 1983; Dahlen et al., 1984; Malavieille, 2010), suggesting that increased basal friction results in higher compressional stresses in the undeformed regions, therefore fostering more thrust nucleation at the deformation fronts. Additionally, the augmented resistance against sliding in deformed regions promotes the development of additional backthrusts.
The hillslope diffusion constant Κe governs the smoothness of the topography (Figures 4D, E). With an increase in Κe, the topography relief is notably diminished, which requires a longer period for FTBs to attain the critical slope angle (Dahlen et al., 1984; Malavieille, 2010). Models with a high Κe maintain active frontal thrusts over extended periods, and exhibit an increased distance between forethrusts. On the other hand, models with a low Κe are more susceptible to landslides as shown by the arrows in Figures 4A, E) compared to those with higher Κe values (Figure 4D), due to gentle topographic relief and resulting steeper slopes that are vulnerable to landslides.
We calculated the average slope of the topography across all models and found that the slope angle correlates with the basal friction Φb, aligning with predictions from critical wedge theory (Dahlen et al., 1984). This relationship appears robust against variations in layer thickness H and surface diffusivity Κe. Remarkably, the slope angle closely matches the basal friction angle, further validating the critical wedge theory.
3.2 Fault life cycles: initiation–quiescence–reactivation
Upon closer inspection on all models, we found that a common sequence of phases for the faults: an initiation phase followed by cycles of quiescence and reactivation. This pattern is driven by stress interactions between faults and décollements, as evidenced by changes in shear strain rates and basal shear stress (Figure 5).
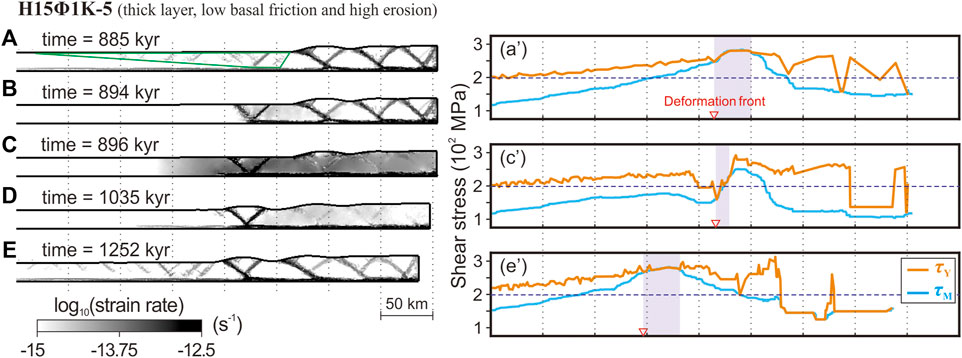
Figure 5. The fault life cycle for model H15Φ1Κ-5. (A) Formation of a triangular-shaped proto-thrust zone (outlined in green) and reactivation of previous thrusts. The new frontal thrusts initiate. (B) New frontal thrusts localize. (C, D) The conjugate frontal thrusts are the most active structures for hundreds of thousands of years. (E) Same as (A), the dominance of activity shifts away from the frontal thrusts. (a’) (c’), and (e’) The stress analysis corresponding to (A, C) and (E) following the method in Section 2.3. The red triangles indicate the positions of deformation fronts. The dashed horizontal line is the critical shear stress τC.
The undeformed region on the model’s left side opposes the advance of the FTB, with a basal shear stress typically lower than the critical shear stress τC. As the right boundary moves towards the left, the basal stress gradually increases. When the basal stress exceeds τC, failures start to occur. During the initiation phase, the deformation propagates forward, creating a triangular proto-thrust zone to the left of the current frontal thrust (Figure 5A). At the same time, all thrusts within the FTB become active, exhibiting high strain rates. The non-faulted regions of the FTB are unbroken and possess a high yield stress τY. Near fault zones, previously failed materials show reduced yield stress. The shear stress τM overlaps with the yield stress τY at the base of active thrusts (Figure 5a’). A few thousand years after the proto-thrust zone formation, deformation concentrates around a pair of proto-thrusts, which evolve into new frontal thrusts, characterized by a forethrust and its conjugate backthrust (Figure 5B). The new frontal thrusts then become the primary active structures for several hundred thousand years (Figures 5C, D), while older thrusts enter a quiescence phase (Figure 5C, c’). During this stage, the basal stress is mostly lower than the critical stress, except near the active frontal thrusts.
Active frontal thrusts elevate topography at the toe of the FTB, increasing gravitational loading on the frontal faults. This increase eventually locks the fault plane, prompting deformation to propagate forward and generate another proto-thrust zone (Figure 5E). The preceding, now older frontal thrusts experience reactivation (Figure 5e’), temporarily diverting deformation activity from the current frontal thrusts. This cycle repeats, sustaining the dynamic evolution of the FTB.
Throughout this cycle (spanning approximately 367 kyr from Figures 5A–E), the dominant strain rate pattern features an active frontal thrust alongside dormant predecessors for most of the cycle (approximately 350 kyr, Figures 5C–E), accounting for over 95% of the cycle’s duration. Although fault reactivation periods (Figures 5A, E) are brief, they are crucial for FTB dynamics, especially in maintaining the critical taper angle. This concept aligns with prior research emphasizing the role of internal deformation within the FTB in preserving its critical taper (Platt, 1986; Morley, 1987; Morley, 1988). In the upcoming sections, we delve into the dynamics occurring during the brief, yet significant, 5% of the cycle when fault initiation takes place.
3.3 Development of frontal thrusts
The emergence of the two principal structural styles observed in our models, namely, imbricated thrust sheets and pop-up structures, is predominantly influenced by the thickness of the layer, a factor extensively discussed in earlier sections. The basal stress in the models is scrutinized carefully to understand on how these two styles develop. Our analysis reveals that the genesis of these structural styles can be traced back to the initial formation of frontal thrusts, which materialize either as a conjugate pair of thrusts or as a singular low-angle forethrust, and this difference is due to the width of the initial failure zone and its distance to the deformation front. This foundational difference in thrust formation guides the development of later structures. We will describe these two types of formation processes in this section.
The development of conjugate frontal thrusts progresses through two distinct stages (Figure 6). Initially, shallow proto-thrusts emerge, delineating a triangular zone (Figure 6A). This zone, largely unfailed previously, possesses a high yield stress τY (orange line). The proto-thrust zone’s rear segment (purple region) extends down to the base, where the basal stress τM (blue line) reaches τY. This region is under zonal failure. The basal shear stress of the proto-thrust zone surpasses the critical shear stress τC (dashed horizontal line), indicating the onset of fault formation.
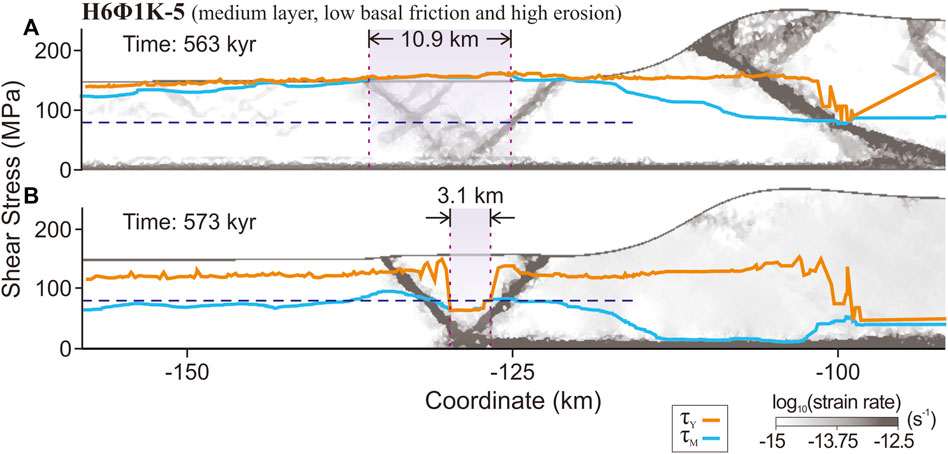
Figure 6. The basal stress evolution with the development of conjugate frontal thrusts in model H6Φ1Κ-5. The purple regions indicate where basal zonal failure occurs. The blue dashed line is the critical shear stress. (A) The strain-rate field and stress analysis during zonal failure. (B) The strain-rate field and stress analysis of a localized frontal thrust.
During the second stage, the strain rate field indicates that deformation becomes focused along a specific pair of conjugate faults within the proto-thrust zone. Concurrently, other proto-thrusts and thrusts located in the rear FTB become quiescent (Figure 6B). The extent of the basal failure zone (purple region) narrows, a clear sign of fault localization. In this phase, the yield stress decreases within the failure zone, while the basal shear stress generally stabilizes at the critical shear stress τC (dashed horizontal line). This stage underlines the shift towards a more stable faulting pattern, where deformation is efficiently localized to the new frontal thrusts, and the system reaches a state of equilibrium, with basal stresses adjusting to critical thresholds.
For the formation of low-angle forethrusts, the zonal failure tends to be broader (Figure 7). The sequence also begins with the formation of a triangular proto-thrust zone that initiates broad zonal failures at the base (Figure 7A). The zonal failure is close to an existing fault zone to the right. This creates conducive conditions for the extension of the forethrust in a lower-right direction. This extension allows the forethrust to connect seamlessly with the basal décollement. Consequently, the progression of forethrusts is expedited, while the formation of backthrusts is diminished, culminating in the emergence of a singular forethrust as the dominant frontal thrust mechanism (Figure 7B).
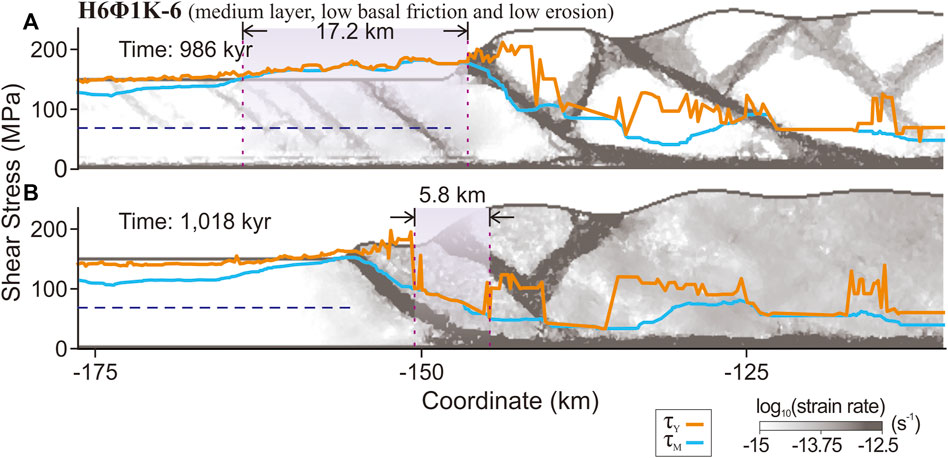
Figure 7. The basal stress evolution with the development of the low-angle forethrust in model H6Φ1Κ-6. The purple regions indicate where basal zonal failure occurs. The blue dashed line is the critical shear stress. (A) The strain-rate field and stress analysis during zonal failure. (B) The strain-rate field and stress analysis of a localized frontal thrust.
The single forethrust features a concave curvature, with its dip decreasing with depth (Figure 7B), whereas conjugate thrusts are straight with uniform dips throughout their depth (Figure 7B). This morphological difference stems from the yield strength of the material under basal zonal failure. The dip angle of a failure zone correlates with the material’s friction angle. Failure zones within materials of lower friction angles tend to have shallower dips. If the whole proto-thrust zone is unfailed before, the material still has a high friction, the resulting fault will have a uniformly large dip. Conversely, if the proto-thrust zone is adjacent to an area that has previously undergone failure, the basal material’s reduced friction results in the development of faults that curve concavely.
The conjugate faults developed at the deformation front will commonly become pop-up structures. But, sometimes, the backthrust is less active than the forethrust and lifted off the base, leading to the hybrid style. On the other hand, the low-angle forethrusts will always evolved into thrust sheets. If the model consistently develops low-angle forethrusts at the deformation front, it will result in the imbricated thrust sheets.
3.4 Propagation of deformation fronts
The deformation front is the furthest point of basal failure within the model. By analyzing the basal stress and identifying the points of failure, we can track the forward propagation of the deformation front and the growth of the FTB (represented by red inverted triangles in Figure 5).
As the fault localization progresses, the failure zone gradually shrinks, and the deformation front may temporarily move backward. To accurately record the propagation of the deformation front, we only collect data that demonstrates forward extension, while excluding the points that indicate backward movement (e.g., Figures 5a’–5c’).
The positions of the deformation fronts over time in all models are plotted in Figure 8 and categorized according to the initial thickness of the model H. In each subplot of Figure 8, models with different basal friction Φb and topographic diffusion constant Κe are closely aligned with each other, indicating these parameters have little impact on the propagation rate of the deformation front, at least within the explored range of values in this study.
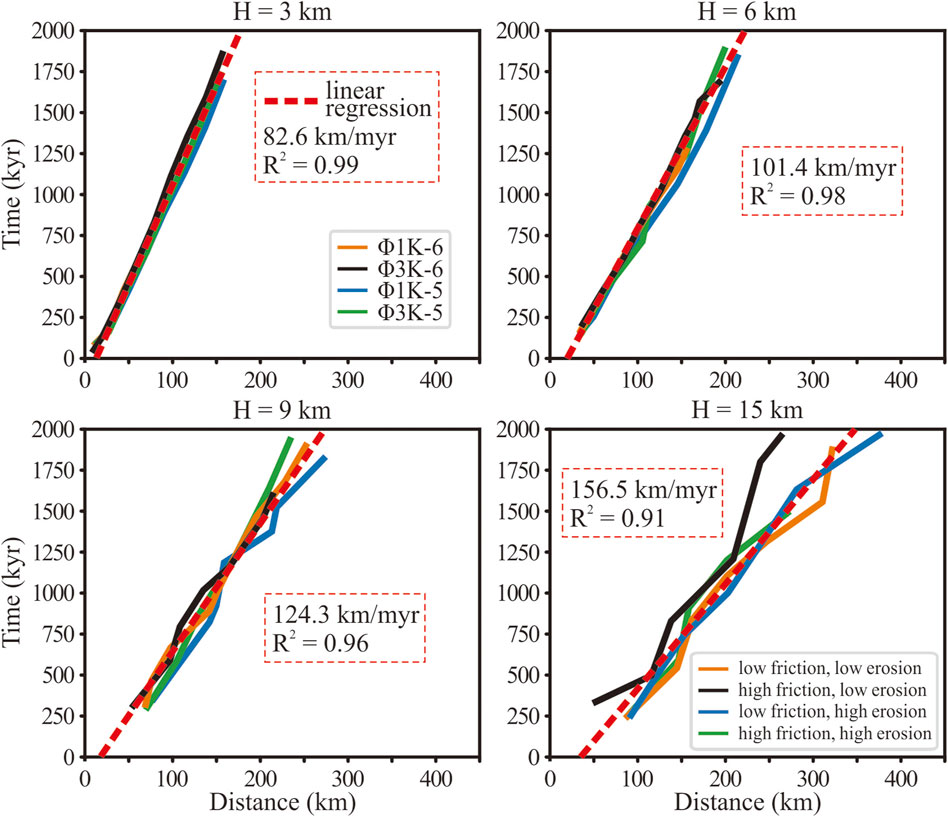
Figure 8. The positions of deformation fronts along time for all models.
We found that the propagation rate of the deformation front for each model is roughly constant in time and does not depend on the ages of the FTBs (Figure 8), with very high coefficients of determination (R2 > 0.9) in all models. Moreover, we observe that the R2 value decreases with H. Thin models (H < 9 km) exhibit a stable and self-replicating propagation rate of the deformation front. In contrast, thick models (H ≥ 9 km) develop large pop-up structures accompanied by multiple backthrusts (Figure 3), resulting in a variety of structures with varying lifespans. Consequently, the propagation rate of the deformation front in thick models deviates from linearity observed in thin models.
The regression analysis also reveals that the propagation rate increases with H. With larger H and a constant convergent rate, the amount of material accreted to the FTB increases. Our results show that the propagation rate is linearly correlated to the undeformed thickness, with an approximate increase of 6.2 km/Myr for every 1-km increase in the undeformed layer.
The propagation rate of the deformation front, regardless of the layer thickness, is always greater than the shortening rate of the backstop (50 km/Myr). As a result, the width of the FTB, defined as the distance between the deformation front and the backstop, will grow with time at a constant rate.
4 Discussion
4.1 Hybrid between pop-up structures and imbricated thrust sheets
Certain models, such as H6Φ1Κ-5 in Figure 4C, show a hybrid structural style between pop-up structures and imbricated thrust sheets, largely determined by the initial development of the frontal thrusts. The development of conjugate thrusts typically results in pop-up or hybrid structural units, whereas low-angle forethrusts lead to imbricated thrust sheets.
The spacing between zonal failures is critical in determining the style of frontal thrusts (Section 3.3). We found that the spacing between successive zonal failures diminishes as the FTB grows (Figure 9). In some cases, the active failure zone almost overlaps with the previous failure zone. Such proximity between proto-thrust zones often encourages the formation of low-angle forethrusts. Therefore, low-angle forethrusts tend occur further away from the backstop.

Figure 9. The width of zonal failure increases with the development of the FTB in model H6Φ1Κ-6.
This expansion in failure zone width is attributed to the increasing fault count within the FTB, which, over time, broadens the FTB. These faults accommodate portions of the shortening velocity. Consequently, shortening velocity at the proto-thrust zone is reduced, resulting in slower stress accumulation. This dynamic fosters a broader zonal failure, particularly distal to the backstop (Figure 9).
The progression from conjugate thrust pairs near the backstop to singular low-angle forethrusts at greater distances is a common observation in both sandbox experiments and seismic profiles. Sandbox experiments have consistently shown the emergence of conjugate faults near the backstop and low-angle forethrusts further afield (Dominguez et al., 2000; Bernard et al., 2007; Malavieille, 2010). Additionally, a thorough examination of seismic profiles of deep-water frontal thrust belts by Morley et al. (2011) corroborates this pattern, indicating that pop-up structures are more frequent under near-field stress conditions. Our findings offer a tangible explanation for this pattern, bridging observations from experimental and seismic studies with the underlying physical mechanisms.
4.2 Thrust initiation
Thrust initiation is a complex process involving material yielding and strain localization, with proto-thrusts or “precursory shear bands” identified as crucial in pinpointing where new thrusts will emerge, based on both field studies and sandbox experiments (Crider and Peacock, 2004; Dotare et al., 2016). These shear bands, which concentrate shear strains, act as the precursors for thrust formation. Over time, they evolve into thrusts that continue to deform, ultimately leading to incipient thrusts in the analog sandbox experiments (Dotare et al., 2016).
The role of these proto-thrust zones in directing the progression of the décollement and subsequent creation of new frontal thrusts is significant (Barnes et al., 2018). They often manifest as closely packed reverse faults with minimal displacements, typically positioned ahead of advancing frontal thrusts (Moore et al., 1995; Moore et al., 2001; Ku and Hsu, 2009; Ghisetti et al., 2016; Barnes et al., 2018). A detailed examination at the central Hikurangi margin illustrated the simultaneous advancement of frontal thrusts and proto-thrusts alongside the reactivation of older, pre-existing thrusts (Ghisetti et al., 2016), a phenomenon that aligns with our model outcomes (Figures 5A, E), reinforcing the pivotal role of proto-thrust zones in initiating thrusts.
Dotare et al. (2016) meticulously documented the fault initiation process in their analog experiments by observing the strain-rate field, delineating three stages of fault initiation: deformation propagation, strain localization, and new frontal thrust formation. Similarly, our numerical models capture this thrust formation process, detailing the stress and strain-rate evolution across the domain with greater precision, as outlined in Section 3.2 (Figure 5A–C). This provides an enhanced understanding of the underlying mechanisms driving thrust initiation and evolution.
4.3 Lateral growth of the FTB
The lateral expansion of the FTB is a result of material accumulation onto the belt (DeCelles and DeCelles, 2001), a process significantly influenced by the tectonic shortening rate and the initial thickness of the undeformed layers. In our analysis, detailed in Section 3.4, we derived the overall propagation rate, representing a combination of FTB lateral growth and the constant shortening rate applied across different models. The difference in propagation rates across models is thus attributable to variations in FTB growth. Our findings demonstrate a linear correlation between the lateral growth rate of the FTB and the thickness of the material layer being deformed. Specifically, we observed that a 1-km increase in layer thickness correlates with a 6.2 km/Myr increase in the growth rate of the FTB.
This linear relationship underscores the significant role of layer thickness in governing the growth pace of the FTB, suggesting that thicker sedimentary layers predispose the FTB to faster lateral expansion due to enhanced rates of mass accretion and more extensive deformation. Such insights into the impact of material thickness on FTB growth rates enrich our comprehension of the dynamic processes governing the development and evolution of fold-and-thrust belts.
4.4 Future works
We have explored the roles of layer thickness, basal friction, and surface diffusivity in influencing the deformation mechanisms and structural evolution of orogenic belts. Future research endeavors will delve into the roles of other factors, such as the dip angle of the décollement and the strength of the top layer. Specifically, the basal angle’s impact on the stress distribution and deformation patterns within the orogenic system warrants thorough investigation, considering its potential to alter the trajectory and intensity of mass transfer processes across the orogen. Additionally, the strength of the top layer, encompassing its rheological properties and resistance to deformation, plays a critical role in shaping surface topography, fault development, and the propagation of deformational fronts. By employing advanced numerical modeling techniques, future studies aim to quantify the effects of these variables on orogeny dynamics.
5 Conclusion
In this study, we have developed numerical models to explore the evolution of FTBs, focusing on how stress variations over time and space influence fault dynamics. We explored the effects of the layer thickness, basal friction, and surface diffusivity on the structural styles of the FTBs, which are controlled by how the frontal thrusts emerge. Imbricated thrust sheets and pop-up structures are well-developed in our modelling, with the thickness of the deforming layer primarily controlling the evolution of deformation over time and space. Off the consideration of syn-tectonic sedimentation, our study concludes that the fault activity within FTBs follows a cyclical pattern of initiation, quiescence, and reactivation, driven by periodic stress fluctuations throughout the convergence process. For over 95% of the total cycle duration, the frontal thrusts are the only active structures, and the stress within the FTB predominantly remains in a critical state. During the remaining 5%, the stress becomes over-critical, leading to the formation of a proto-thrust zone and the reactivation of pre-existing thrusts within the FTB. Prior to initiating the failure cycle, the stress pattern within the frontal zone such as “proto-thrust” is crucial for fault development. Once failure is achieved, the rate at which FTBs expand laterally is solely determined by the thickness of the deforming layer, with the deformation front’s advance exhibiting a constant rate over time. Further exploration of FTB dynamics underscores the interplay between the spacing between successive zonal failures, revealing that narrowly-spaced zonal failures, which facilitate the formation of low-angle forethrusts, tend to occur further from the backstop. This observation underscores the influence of material interactions and the presence of a contiguous weak zone on the structural evolution of FTBs.
Our findings offer new perspectives on the complex mechanisms governing FTB behavior, emphasizing the role of stress cycles, fault propagation, and deformation styles in the evolution of thrust belts. This research not only enriches our understanding of orogenic processes but also lays the groundwork for future studies aimed at unraveling the intricacies of mountain building and thrust belt development.
Data availability statement
The raw data supporting the conclusion of this article will be made available by the authors, without undue reservation.
Author contributions
F-YL: Formal Analysis, Investigation, Methodology, Software, Validation, Visualization, Writing–original draft, Writing–review and editing. ET: Investigation, Methodology, Project administration, Resources, Software, Supervision, Validation, Writing–original draft, Writing–review and editing. EC: Conceptualization, Funding acquisition, Investigation, Project administration, Supervision, Validation, Writing–original draft, Writing–review and editing.
Funding
The author(s) declare that financial support was received for the research, authorship, and/or publication of this article. This project is supported by the National Science and Technology Council, Taiwan, under project number NSTC 112-2116-M-001-035 (ET) and 112-2611-M-002-018 (EC).
Conflict of interest
The authors declare that the research was conducted in the absence of any commercial or financial relationships that could be construed as a potential conflict of interest.
Publisher’s note
All claims expressed in this article are solely those of the authors and do not necessarily represent those of their affiliated organizations, or those of the publisher, the editors and the reviewers. Any product that may be evaluated in this article, or claim that may be made by its manufacturer, is not guaranteed or endorsed by the publisher.
References
Barnes, P. M., Ghisetti, F. C., Ellis, S., and Morgan, J. K. (2018). The role of protothrusts in frontal accretion and accommodation of plate convergence, Hikurangi subduction margin, New Zealand. Geosphere 14, 440–468. doi:10.1130/GES01552.1
Bernard, S., Avouac, J.-P., Dominguez, S., and Simoes, M. (2007). Kinematics of fault-related folding derived from a sandbox experiment. J. Geophys. Res. Solid Earth 112. doi:10.1029/2005JB004149
Bonnet, C., Malavieille, J., and Mosar, J. (2007). Interactions between tectonics, erosion, and sedimentation during the recent evolution of the Alpine orogen: analogue modeling insights. Tectonics 26. doi:10.1029/2006TC002048
Boyer, S. E., and Elliott, D. (1982). Thrust systems. AAPG Bull. 66, 1196–1230. doi:10.1306/03b5a77d-16d1-11d7-8645000102c1865d
Burov, E., Jolivet, L., Le Pourhiet, L., and Poliakov, A. (2001). A thermomechanical model of exhumation of high pressure (HP) and ultra-high pressure (UHP) metamorphic rocks in Alpine-type collision belts. Tectonophysics 342, 113–136. doi:10.1016/S0040-1951(01)00158-5
Burov, E., and Yamato, P. (2008). Continental plate collision, P–T–t–z conditions and unstable vs. stable plate dynamics: insights from thermo-mechanical modelling. Lithos 103, 178–204. doi:10.1016/j.lithos.2007.09.014
Choi, E., Tan, E., Lavier, L. L., and Calo, V. M. (2013). DynEarthSol2D: an efficient unstructured finite element method to study long-term tectonic deformation. J. Geophys. Res. Solid Earth 118, 2429–2444. doi:10.1002/jgrb.50148
Crider, J. G., and Peacock, D. C. P. (2004). Initiation of brittle faults in the upper crust: a review of field observations. J. Struct. Geol. 26, 691–707. doi:10.1016/j.jsg.2003.07.007
Dahlen, F. A., and Barr, T. D. (1989). Brittle frictional mountain building: 1. Deformation and mechanical energy budget. J. Geophys. Res. Solid Earth 94, 3906–3922. doi:10.1029/JB094iB04p03906
Dahlen, F. A., Suppe, J., and Davis, D. (1984). Mechanics of fold-and-thrust belts and accretionary wedges: cohesive Coulomb Theory. J. Geophys. Res. Solid Earth 89, 10087–10101. doi:10.1029/JB089iB12p10087
Dal Zilio, L., Ruh, J., and Avouac, J.-P. (2020). Structural evolution of orogenic wedges: interplay between erosion and weak décollements. Tectonics 39, e2020TC006210. doi:10.1029/2020TC006210
Davis, D., Suppe, J., and Dahlen, F. A. (1983). Mechanics of fold-and-thrust belts and accretionary wedges. J. Geophys. Res. Solid Earth 88, 1153–1172. doi:10.1029/JB088iB02p01153
DeCelles, P. G., and DeCelles, P. C. (2001). Rates of shortening, propagation, underthrusting, and flexural wave migration in continental orogenic systems. Geology 29, 135–138. doi:10.1130/0091-7613(2001)029<0135:ROSPUA>2.0.CO;2
Dominguez, S., Malavieille, J., and Lallemand, S. E. (2000). Deformation of accretionary wedges in response to seamount subduction: insights from sandbox experiments. Tectonics 19, 182–196. doi:10.1029/1999TC900055
Dotare, T., Yamada, Y., Adam, J., Hori, T., and Sakaguchi, H. (2016). Initiation of a thrust fault revealed by analog experiments. Tectonophysics 684, 148–156. doi:10.1016/j.tecto.2015.12.023
Erdős, Z., Huismans, R. S., and van der Beek, P. (2019). Control of increased sedimentation on orogenic fold-and-thrust belt structure – insights into the evolution of the Western Alps. Solid Earth 10, 391–404. doi:10.5194/se-10-391-2019
Fuller, C. W., Willett, S. D., Fisher, D., and Lu, C. Y. (2006). A thermomechanical wedge model of Taiwan constrained by fission-track thermochronometry. Tectonophysics 425, 1–24. doi:10.1016/j.tecto.2006.05.018
Ghisetti, F. C., Barnes, P. M., Ellis, S., Plaza-Faverola, A. A., and Barker, D. H. N. (2016). The last 2 Myr of accretionary wedge construction in the central Hikurangi margin (North Island, New Zealand): insights from structural modeling. Geochem. Geophys. Geosystems 17, 2661–2686. doi:10.1002/2016GC006341
Graveleau, F., Malavieille, J., and Dominguez, S. (2012). Experimental modelling of orogenic wedges: a review. Tectonophysics 538–540, 1–66. doi:10.1016/j.tecto.2012.01.027
Hu, J.-C., Yu, S.-B., Angelier, J., and Chu, H.-T. (2001). Active deformation of Taiwan from GPS measurements and numerical simulations. J. Geophys. Res. Solid Earth 106, 2265–2280. doi:10.1029/2000JB900196
Konstantinovskaya, E., and Malavieille, J. (2011). Thrust wedges with décollement levels and syntectonic erosion: a view from analog models. Tectonophysics 502, 336–350. doi:10.1016/j.tecto.2011.01.020
Ku, C.-Y., and Hsu, S.-K. (2009). Crustal structure and deformation at the northern manila trench between taiwan and luzon islands. Tectonophysics 466, 229–240. doi:10.1016/j.tecto.2007.11.012
Lallemand, S. E., Schnürle, P., and Malavieille, J. (1994). Coulomb theory applied to accretionary and nonaccretionary wedges: possible causes for tectonic erosion and/or frontal accretion. J. Geophys. Res. Solid Earth 99, 12033–12055. doi:10.1029/94JB00124
Malavieille, J. (2010). Impact of erosion, sedimentation, and structural heritage on the structure and kinematics of orogenic wedges: analog models and case studies. GSA Today 20, 4–10. doi:10.1130/GSATG48A.1
Mitra, S. (2002). Structural models of faulted detachment folds. AAPG Bull. 86, 1673–1694. doi:10.1306/61EEDD3C-173E-11D7-8645000102C1865D
Moore, G. F., Taira, A., Klaus, A., Becker, L., Boeckel, B., Cragg, B. A., et al. (2001). New insights into deformation and fluid flow processes in the nankai trough accretionary prism: results of ocean drilling program leg 190. Geochem. Geophys. Geosystems 2. doi:10.1029/2001GC000166
Moore, J. C., Moore, G. F., Cochrane, G. R., and Tobin, H. J. (1995). Negative-polarity seismic reflections along faults of the Oregon accretionary prism: indicators of overpressuring. J. Geophys. Res. Solid Earth 100, 12895–12906. doi:10.1029/94JB02049
Morley, C. K. (1987). A classification of thrust fronts: REPLY. AAPG Bull. 71, 739–741. doi:10.1306/948878ac-1704-11d7-8645000102c1865d
Morley, C. K., King, R., Hillis, R., Tingay, M., and Backe, G. (2011). Deepwater fold and thrust belt classification, tectonics, structure and hydrocarbon prospectivity: a review. Earth-Sci. Rev. 104, 41–91. doi:10.1016/j.earscirev.2010.09.010
Platt, J. P. (1986). Dynamics of orogenic wedges and the uplift of high-pressure metamorphic rocks. GSA Bull. 97, 1037–1053. doi:10.1130/0016-7606(1986)97<1037:DOOWAT>2.0.CO;2
Ruh, J. B., Gerya, T., and Burg, J.-P. (2017). Toward 4D modeling of orogenic belts: example from the transpressive Zagros Fold Belt. Tectonophysics 702, 82–89. doi:10.1016/j.tecto.2015.09.035
Stockmal, G. S., Beaumont, C., Nguyen, M., and Lee, B. (2007). “Mechanics of thin-skinned fold-and-thrust belts: insights from numerical models,” in Whence the mountains? Inquiries into the evolution of orogenic systems: a volume in honor of raymond A. Price. Editors J. W. Sears, T. A. Harms, and C. A. Evenchick (Boulder, Colorado, United States: (Geological Society of America). doi:10.1130/2007.2433(04)
Stuart, W. D. (1988). Forecast model for great earthquakes at the Nankai Trough subduction zone. Pure Appl. Geophys. 126, 619–641. doi:10.1007/BF00879012
Ta, T., Choo, K., Tan, E., Jang, B., and Choi, E. (2015). Accelerating DynEarthSol3D on tightly coupled CPU–GPU heterogeneous processors. Comput. Geosci. 79, 27–37. doi:10.1016/j.cageo.2015.03.003
Taylor, M. A. J., Zheng, G., Rice, J. R., Stuart, W. D., and Dmowska, R. (1996). Cyclic stressing and seismicity at strongly coupled subduction zones. J. Geophys. Res. Solid Earth 101, 8363–8381. doi:10.1029/95JB03561
Vernant, P., and Chéry, J. (2006). Mechanical modelling of oblique convergence in the Zagros, Iran. Geophys. J. Int. 165, 991–1002. doi:10.1111/j.1365-246X.2006.02900.x
Wang, J., Luan, X., and Yu, R. Z. (2013). Modern movement and deformation in the South China Sea shown by GPS measurements and numerical simulation. Chin. J. Oceanol. Limnol. 31, 159–168. doi:10.1007/s00343-013-2065-7
Willett, S. D. (1999). Orogeny and orography: the effects of erosion on the structure of mountain belts. J. Geophys. Res. Solid Earth 104, 28957–28981. doi:10.1029/1999JB900248
Keywords: numerical simulation, critical wedge, critical stress, fold-and-thrust belts and décollement, thrust growth, fault life cycles
Citation: Lee F-Y, Tan E and Chang ET (2024) Stress evolution of fault-and-thrust belts in 2D numerical mechanical models. Front. Earth Sci. 12:1415139. doi: 10.3389/feart.2024.1415139
Received: 10 April 2024; Accepted: 17 May 2024;
Published: 11 June 2024.
Edited by:
Gang Rao, Southwest Petroleum University, ChinaReviewed by:
Stephane Dominguez, UMR5243 Géosciences Montpellier, FranceHongwei Yin, Nanjing University, China
Copyright © 2024 Lee, Tan and Chang. This is an open-access article distributed under the terms of the Creative Commons Attribution License (CC BY). The use, distribution or reproduction in other forums is permitted, provided the original author(s) and the copyright owner(s) are credited and that the original publication in this journal is cited, in accordance with accepted academic practice. No use, distribution or reproduction is permitted which does not comply with these terms.
*Correspondence: Eh Tan, dGFuMkBlYXJ0aC5zaW5pY2EuZWR1LnR3; Emmy T.-Y. Chang, ZXR5Y2hhbmdAbnR1LmVkdS50dw==