 Fang Gu1,2
 Qinqin Zhang
- 1Xinjiang Academy of Surveying and Mapping, Urumqi, China
- 2Central Asia Geographic Information Development and Utilization Engineering Technology Innovation Center, Ministry of Natural Resources, Urumqi, China
- 3College of Ecology and Environment, Xinjiang University, Urumqi, China
The movement of glaciers plays a crucial role in environmental and geological processes, significantly influencing the formation and dynamics of ice bodies. This study leverages feature tracking technology to analyze optical and Synthetic Aperture Radar (SAR) remote sensing imagery, specifically GF-1 optical images and GF-3, Sentinel-1 SAR images, captured during the 2020 to 2021 ablation season in Gongar. The aim was to quantify glacier surface velocities and to evaluate the comparative effectiveness of different remote sensing modalities in capturing these dynamics. Our findings indicate a strong consistency in the spatial distribution of glacier surface velocities derived from diverse remote sensing data sources, with high-precision optical imagery (GF-1) yielding the most accurate velocity measurements, followed by Sentinel-1 SAR data. Notably, large glaciers in Gongar exhibited rapid movements, with an average velocity of 0.16 m/d, primarily at elevations between 4,500 and 6,500 m. The fastest velocities were recorded at approximately 4,500 m elevation. Glaciers with inclines ranging from 10° to 60° displayed the highest velocities within the 20°–30° slope range. It was observed that glaciers on the southeast slope moved faster, exhibiting the highest average surface velocity, in contrast to those on the west slope, which moved more slowly. The surface velocity of the ice tongue region of Krayaylak Glacier that the largest glacier in Pamir, was observed to be lower than 0.6 m/d, indicating a slow movement speed. The study also reveals that the effectiveness of different remote sensing data in detecting glacier velocity in Gongar, with high-resolution data more accurately capturing surface velocities in melting areas or those with slower movement. This study underscores the importance of multi-source remote sensing data in understanding glacier dynamics and contributes valuable insights into the mechanisms driving glacier movements.
1 Introduction
Glaciers play a crucial role in arid regions, serving as one of the primary sources of fresh water in these areas (Jansson et al., 2003). During dry seasons and drought years, glaciers provide a steady flow of water to rivers and lakes through their slow melting process, ensuring the water needs of human societies and wildlife ecosystems are met. Additionally, glacial meltwater supports agricultural irrigation, hydroelectric power generation, and regional water resource management, playing an irreplaceable role in maintaining the ecological balance, economic development, and social wellbeing of arid regions. As global climate change intensifies, the retreat of glaciers poses an increasingly severe challenge to arid areas dependent on their water resources (Huang and Sun, 1982; Shi et al., 1988; Xie and Liu, 2010; Qin et al., 2018; Li, 2019). The movement of glaciers holds paramount importance as a feature primarily because it encapsulates a wide range of environmental, climatic, and geological processes in a single, observable phenomenon The movement patterns of glaciers alter the distribution of mass and the hydrothermal and boundary conditions in different areas of glaciers (Rignot et al., 2006; Li et al., 2007). Being the representative indicator of glacier dynamics, the velocity of glacier is an essential parameter for simulating and predicting changes in glacier mass and geometry. It encapsulates information on glacier changes under the comprehensive influence of internal and external environments (Woo and Hoon, 2023; Liang and Wang, 2024), providing valuable insights for studying glacier evolution and disaster management. This has always been a significant focus for the development and utilization of glacier resources as well as for preventing and mitigating glacier-related disasters (Jing et al., 2010; Bhambri et al., 2019; Zhou J. M. et al., 2021).
Due to its importance, scientists have attempted various methods to obtain the velocity of glaciers. These methods are primarily categorized into three types: pole (stake) measurement, Global Positioning System (GPS) measurement, and remote sensing measurement (Berthier et al., 2004; Paul et al., 2015). The pole measurement method involves the placement of a measuring pole on the glacier, continuous observation of its positional information over time, and recording changes in spatial position to calculate the glacier surface velocity. This method is recognized for its high level of observational accuracy. However, due to the challenging environmental conditions of high elevations and variable weather in mountainous regions where glaciers are predominantly located, the measurement of glacier surface velocity is hindered by limitations in time and space, resulting in only a few glaciers worldwide having their surface velocity measured (Zhou et al., 2009; Liang et al., 2014). The GPS approach attempts to track the movement of glacier with the help of GPS device, which provide precise location data that can be used to calculate the velocity of the glacier (Frezzotti et al., 1998). GPS measurement offers precise and continuous tracking of glacier movement, making it highly accurate and ideal for remote, difficult-to-access locations. However, it incurs higher costs compared to traditional methods and necessitates specialized equipment and expertise, potentially limiting its accessibility (Bisht et al., 2020). As remote sensing technology continues to evolve, its application in measuring glacier velocity has become increasingly prevalent. This method offers extensive spatial coverage, enabling the study of vast and inaccessible glaciers through the use of archival imagery for in-depth historical analysis, all without the necessity of physical access to the glacier itself. Typically, optical and radar remote sensing images are employed to monitor glacier surface movement. For optical remote sensing, Landsat and ASTER images are frequently utilized (Das and Sharma, 2021; Zhou Y. et al., 2021; Huang et al., 2023), whereas for radar remote sensing, Sentinel-1 (Leinss and Bernhard, 2021), and COSMO-SkyMed images are among the preferred choices (Brancato et al., 2020; Strozzi et al., 2020; Zhou Y. et al., 2021; Liang and Wang, 2023). The studies mentioned above have not only succeeded in efficiently and accurately gathering information on glaciers on a large scale but have also underscored their scientific worth by facilitating the monitoring of glacier characteristics and dynamic transformations. This approach has notably contributed to the conservation of both human and material resources (Zhang et al., 2016; Lu et al., 2022; Shen et al., 2022).
Currently, remote sensing methods for measuring the velocity of glaciers leverage a variety of data sources, offering detailed insights into glacier dynamics. These methods are crucial for understanding glacier behavior, monitoring climate change impacts, and predicting future changes in water resources. The primary data sources used in remote sensing for glacier velocity measurement include satellite imagery (Landsat, Sentinel-1, and TerraSAR-X), Synthetic Aperture Radar (SAR), Aerial Photography and UAV (Unmanned Aerial Vehicle) Imagery, Light Detection and Ranging (LiDAR), etc., (Yan et al., 2017; Dematteis et al., 2021; Liu et al., 2022; Kelly et al., 2023). By integrating data from these diverse sources, we can obtain a comprehensive view of glacier dynamics, improving our understanding of glacial processes and their responses to climate change. However, stems from the unique advantages, limitations, and applications of each data sources, as well as the diverse environments and conditions of glaciers worldwide, it is necessary to compare the reliability of different remote sensing methods.
The Pamir Plateau, often referred to as the “Roof of the World,” is a significant mountain system in Central Asia and is home to thousands of glaciers, which are critical source of freshwater for millions of people living in the region. As these glaciers are key indicators of climate change, variations in their velocity can provide insights into global warming effects and glacier dynamics. Additionally, understanding glacier movements helps in assessing the risk of geohazards like glacial lake outburst floods, which pose a significant threat to downstream communities. Therefore, monitoring glacier velocity in the Pamir Plateau is essential for sustainable development, disaster risk reduction, and adapting to climate change impacts in this strategically important region. The Gongar-Muztagh mountain in the Pamir Plateau is drawing attention due to glacier dynamics. Historically, most researchers have focused on studying glacier dynamics by selecting a single glacier with a substantial surface area or an ice tongue region characterized by a gradual slope. In this study, we harnessed multi-source remote sensing imagery, sourced both domestically and internationally, from the same timeframe to explore glaciers in Gongar, a locale distinguished by its expansive tracts of typical Pamir Plateau glaciers. Our objectives were to: (1) assess and compare the reliability of diverse methods tied to various remote sensing data sources in extracting glacier velocity; (2) identify and analyze the movement characteristics of the typical glaciers in this region. This comprehensive approach not only enriches our understanding of glacier dynamics on the Pamir Plateau but also sets a precedent for utilizing multi-source remote sensing data to enhance glacier research globally, underscoring the significance of this study in contributing to the broader field of climatology and environmental monitoring.
2 Materials and methods
2.1 Study area
The Gongar, nestled within the Tashkurgan Tajik Autonomous County of Kashgar Prefecture, Xinjiang, marks its presence on the southeast fringe of the Pamir Plateau. Flanked by the Kungai Mountain to the north and the Muztagar Mountain to the south, this area is enveloped by a majestic assembly of towering mountains, snow-capped peaks, and deep ravines. Its topography descends from the high southwest to the lower northeast, characterized by significant mountainous drops and a complex terrain layout (Jiang et al., 2014; Feng et al., 2020). The climate of the region leans towards aridity and semi-aridity, dominated by dry weather, extended freezing winters, an average annual temperature of 3.6°C, and an average annual precipitation totaling 68.1 mm. This distinctive geographical and climatic setting fosters an abundance of glacier resources. According to surveys of Xinjiang’s glacier resources, the region is home to glaciers covering an area of roughly 520 km2. Among these, the Kayayilak Glacier (5Y663B3) on the northern slope stands out as the largest compound valley glacier, spanning an area of 120.09 km2 and a length of 21.6 km. Meanwhile, the Qimugan Glacier on the eastern slope also features prominently, with an extent of about 81.16 km2 and a length of approximately 20 km, its ice tongue shielded by a layer of surface moraine. For this study, fifty glaciers in Gongar were selected for an analysis of regional velocity and characteristics. Figure 1 illustrates this selection, where black lines delineate glacier areas as of 2020, and blue lines define the scope of this study, based on a GF-1 image with a 2-m resolution taken in September of the same year. The gathered data highlights an average glacier size of 7.8 km2 and an average slope angle of thirty-three degrees. Notably, small glaciers constitute sixty-five percent of the total glacier count but cover only 3.84% of the total glacier area, whereas four large glaciers, each exceeding 20 km2, account for 70% of the total glacier coverage.
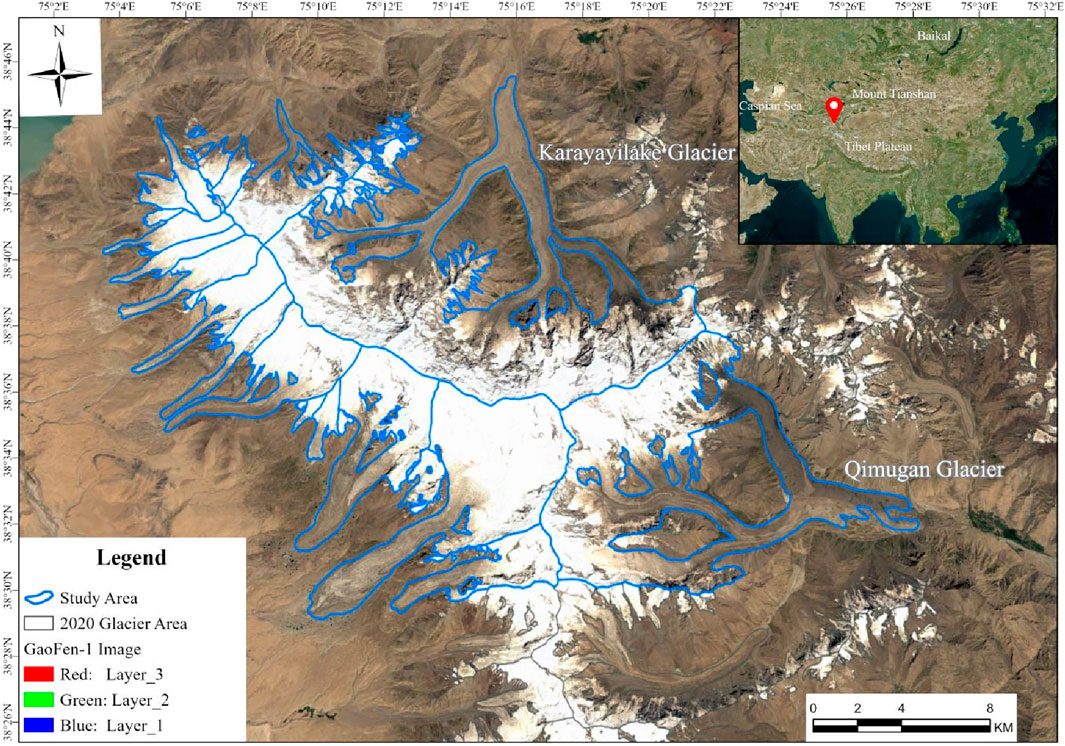
Figure 1. Study area.
2.2 Data sources
2.2.1 GF-1 images
The GF-1 satellite stands as a high-resolution Earth observation satellite under China’s ambit. Images from the GF-1 were courteously provided by the Xinjiang Surveying and Mapping Results Center. The glacier velocities were determined using remote sensing images with a resolution of 2 m, acquired from the surveying and mapping results of the Xinjiang Uygur Autonomous Region Center of Cloud Services Platform (http://121.36.98.111/web/query/image-result-all, accessed on 23 June 2023). The relevant details are presented in Table 1. To mitigate the impact of clouds, snow cover, and other potential distortions, a meticulous selection process was employed. This involved choosing images that offered clear glacier textures, optimal detail contrast, minimal snow cover, and the absence of clouds or terrain shadow interference, specifically during the late stages of glacier ablation. Digital projective images were then crafted, adhering to the stringent requirements of 1:25,000 mapping accuracy. This meticulous process was aimed at ensuring superior correction and registration accuracy between the images, optimizing the quality of the glacier motion analysis (Huang and Li, 2009).
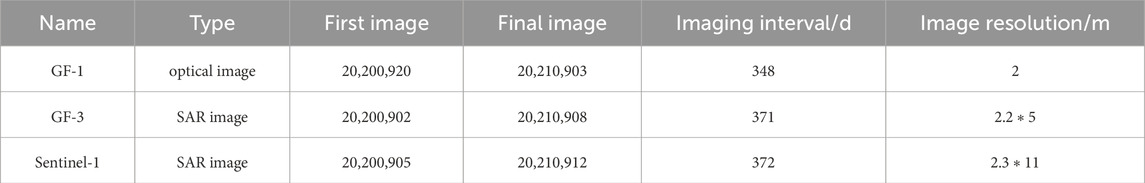
Table 1. Image data.
2.2.2 GF-3 images
The GF-3 satellite represents China’s inaugural foray into C-band synthetic aperture radar (SAR) satellites, boasting an impressive resolution of 1 m. The GF-3 imagery utilized in this research was furnished by the China Center for Marine Satellite Application (https://osdds.nsoas.org.cn/HighResolutionSatellite, accessed on 5 July 2023). For the purposes of this study, the images selected were from the year 2021, specifically chosen for their high-quality synthetic aperture radar capabilities in Fine Strip mode (FSII) with incidence angles ranging from 20° to 50°. They have an imaging bandwidth of 100 km, a distance resolution of 2.2 m, and an azimuth resolution of 5 m.
2.2.3 Sentinel-1 images
The Sentinel-1 satellite, part of the Copernicus program by the European Space Agency, is equipped with a C-band synthetic aperture radar (SAR) that offers four observation modes: wave mode, band mode, ultra-wide scan mode, and interference wide field mode. It operates on a 12-day return period. For this research, we had utilized images captured in interference wide-field mode (IW) between 2020 and 2021. These images have incidence angles ranging from 20° to 45° and an imaging bandwidth of 250 km. The range resolution is set at 2.3 m while the azimuth resolution stands at 11 m. The data used in this research were sourced from Copernicus Open Acess Hub (https://scihub.copernicus.eu, accessed on 15 September 2022). This satellite provides extensive time series data with high revisit frequency service capabilities and finds widespread applications in land monitoring, emergency services, and various other research domains.
2.2.4 Digital elevation model data
TanDEM-X data played a pivotal role in the digital elevation model used in this study. TanDEM-X, an Earth observation radar mission, operates in tandem with the TerraSAR-X satellite, flying in close formation. This unique configuration facilitates the generation of a global digital elevation model through the technique of single-pass synthetic aperture radar (SAR) interferometry. The digital elevation model derived from this process boasts an absolute accuracy of 10 m and a relative accuracy of 2 m. Such precision is instrumental for tasks such as terrain correction, extraction of glacier flow lines, and the analysis of glacier surface velocity features within the context of synthetic aperture radar data processing. This high level of accuracy ensures that the SAR data contributes effectively to the comprehensive understanding of glacier dynamics.
2.2.5 Glacier area in 2020
The 2020 glacier area data was sourced from the Department of Natural Resources of the Xinjiang Uygur Autonomous Region. This dataset was derived from domestic high-resolution remote sensing imagery with a 2-m resolution, captured in 2020. With expert guidance, this data was meticulously compiled and produced by analyzing a combination of factors including image color, texture features, glacier shape characteristics, and digital elevation model (DEM) data. This comprehensive approach ensured the collection and production of the most up-to-date and accurate glacial background data for Xinjiang, providing a solid foundation for further analyses and studies.
2.3 Methods
2.3.1 Image preprocessing
ENVI software was used to perform image precision correction and registration of optical remote sensing images. The registration accuracy was 0.1 pixels. After experimental comparison, the reference window and search window were set to 128 and 32 respectively, and the step size was set to 8. Three results of east-west displacement (E-W), north-south displacement (S-N) and signal-to-noise ratio (SNR) were generated, and the part with a signal-to-noise ratio greater than 0.9 was selected to participate in the calculation. Since the glacier surface velocity was easily affected by image quality, there were different levels of noise in the extraction results. In order to ensure the accuracy of the glacier surface velocity and fully consider the integrity of the glacier edge, the median filtering method was adopted for noise processing (Yan, 2013; Zhen, 2019; Zhang et al., 2021).
2.3.2 SAR offset tracking algorithm
SAR imagery is inherently complex, encapsulating not just phase information from the surface, but also intensity data. Consequently, tracking technologies have evolved along two main lines: those based on phase information and those on intensity information. Research has demonstrated that for mountain glaciers exhibiting rapid movement, leveraging radar image intensity information to calculate glacier displacement is a viable approach (Zhang X. B. et al., 2019; Zhang et al., 2020; Zhang, 2022). Accordingly, this study employs offset tracking technology that capitalizes on image intensity information. We utilized the normalized cross-correlation algorithm (Guan et al., 2020) to identify matching points between two images within a specified window size. This process enables us to determine pixel offsets in both distance and direction, facilitating the extraction of glacier flow velocity independently of the coherence between the two images.
2.3.3 Accuracy evaluation
Due to the challenging climate and sparse human presence in glacier regions, conducting extensive field validations of glacier velocity is impractical. Consequently, the current methodology for assessing the accuracy of glacier velocity extraction relies on a critical assumption: aside from the glacier-covered areas, other non-glacial terrains remain stationary throughout the study period. Building on this premise, non-glacial sections across each geographic unit are systematically chosen as velocity control points. This involves generating random points within both glacial and non-glacial areas, followed by conducting residual analysis to evaluate the accuracy of the glacier velocity outcomes. This approach allows for a pragmatic yet effective assessment of glacier movement analysis accuracy under the constraints imposed by the remote and inhospitable nature of these environments. The calculation formula is as follows by Eq. 1 (Sun et al., 2016; Zhang S. S. et al., 2019):
Where off is the offset of the off-glacier area; MED is the average value of the offset in the off-glacier area. SE is the standard deviation of the offset in the off-glacier area.
A total of 152,491 sample points were randomly generated in the stable area around the glacier, and the error of the residual motion velocity of GF-1, GF-3 and Sentinel-1 in the non-glacier area was statistically analyzed. The statistical results were shown in Figure 2. The results showed that the error of GF-1 image in non-glacier area was small, with an annual average error of 0.013 m/d, followed by Sentinel-1 with an error of 0.0209 m/d, and GF-3 with the largest error of 0.026 m/d. Therefore, GF-1 images had the best extraction effect on glacier surface velocity. Sentinel-1 images were followed by GF-3 images extraction with relatively large deviations.
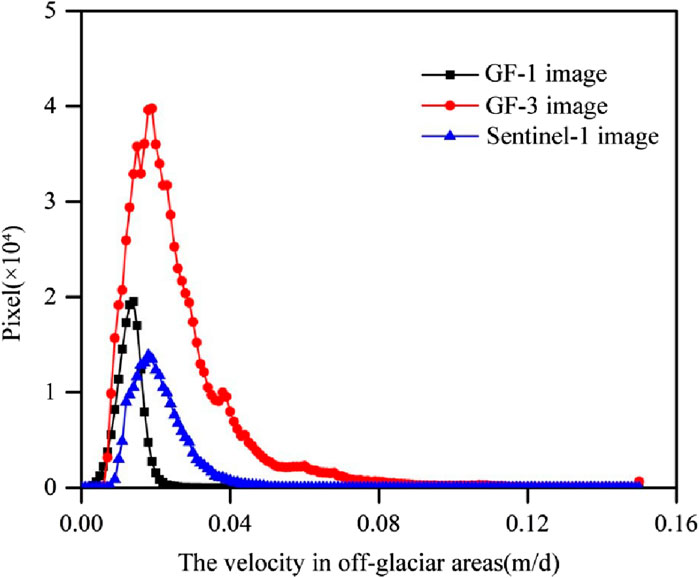
Figure 2. The velocity of residual motion in off-glacier areas.
3 Results
3.1 Surface velocity of glacier
The surface velocity of glacier in Gongar in the middle and upper part of the glacier is faster, and the maximum movement speed is between 0.44 m/d–1.79 m/d. This is primarily attributed to the fact that the glaciers in Gongar are predominantly hanging glaciers, with steep ice surfaces in the accumulation zone and relatively thin glacier thickness, while gradually gentler ice surfaces and thicker glacier bodies occur in the middle zone, resulting in more active glacier movement. The movement of Krayylak glacier and its mugan glacier is comparatively more active when considering the perspective of a single glacier. The western branch of the Kayaylak Glacier and the southern branch of the Qimugan Glacier exhibit relatively high surface velocity, with average glacier surface velocities of 0.24 m/d and 0.28 m/d, respectively, while the remaining glaciers are relatively stable (Figures 3A–C).
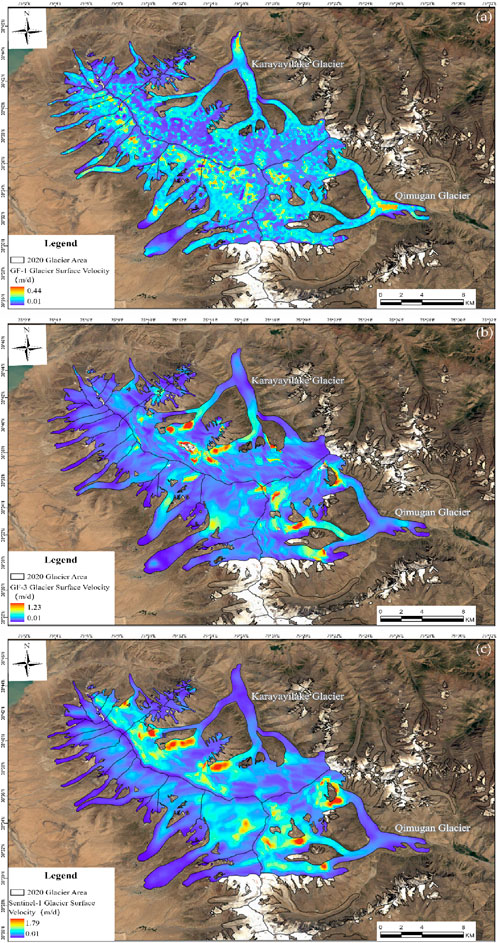
Figure 3. The distribution of glacier surface velocity obtained from various data sources. (A) Results of the GF-1 image extraction. (B) Results of the GF-3 image extraction. (C) Results of the Sentinel-1 image extraction.
Compared to multi-source remote sensing data, it is evident that different resolutions and types of remote sensing images can effectively capture the surface velocity of glaciers. Taking Kraya Ylak Glacier, the largest glacier in Pamir, as an example, we extracted information on surface movement velocity along the flow line of the glacier (as shown in Figure 4). In 2020-2021, the surface velocity of the ice tongue region of Krayaylak Glacier was observed to be lower than 0.6 m/d, indicating a slow movement speed. From the end of the glacier up to approximately 4-5 km where it meets its mouth (point A in Figure 4A), there is significant fluctuation in surface movement velocity. However, beyond this point and towards higher elevations within rest areas of the glacier, there is an increase in surface movement velocity. These findings are consistent with those obtained by Feng Lili et al., who used Landsat images for monitoring changes in Kraya Yilak Glacier. Through analysis, it becomes apparent that motion speeds derived from optical remote sensing images tend to be generally slower with a maximum not exceeding 0.2 m/d; nevertheless, their motion characteristics align well with SAR data extraction results. This discrepancy can primarily be attributed to snow cover present in optical images within accumulation areas of glaciers which affects extraction accuracy; hence seasonal snow cover imagery should be avoided when selecting optical remote sensing images. Spanning from the end of the glacier up to approximately 9 km (point B in Figure 4A) into its ice tongue area, GF-3 and Sentinel-1 images exhibit an average difference in surface motion velocity amounting to only 0.016 m/d; however between distances ranging from 9 km up until around 16 km this average difference increases slightly to about 0.09 m/d (Figure 4B). The results demonstrate a strong consistency between the surface motion velocity and features extracted from multi-source remote sensing data in the ice tongue region, while significant differences are observed in the glacier accumulation region. This discrepancy can be attributed to overlapping and shading of SAR image distribution in the accumulation area, which adversely affects the extraction accuracy of movement velocity. In subsequent sections, we will conduct a detailed analysis on the applicability of extracting glacier surface motion velocity from multi-source remote sensing.
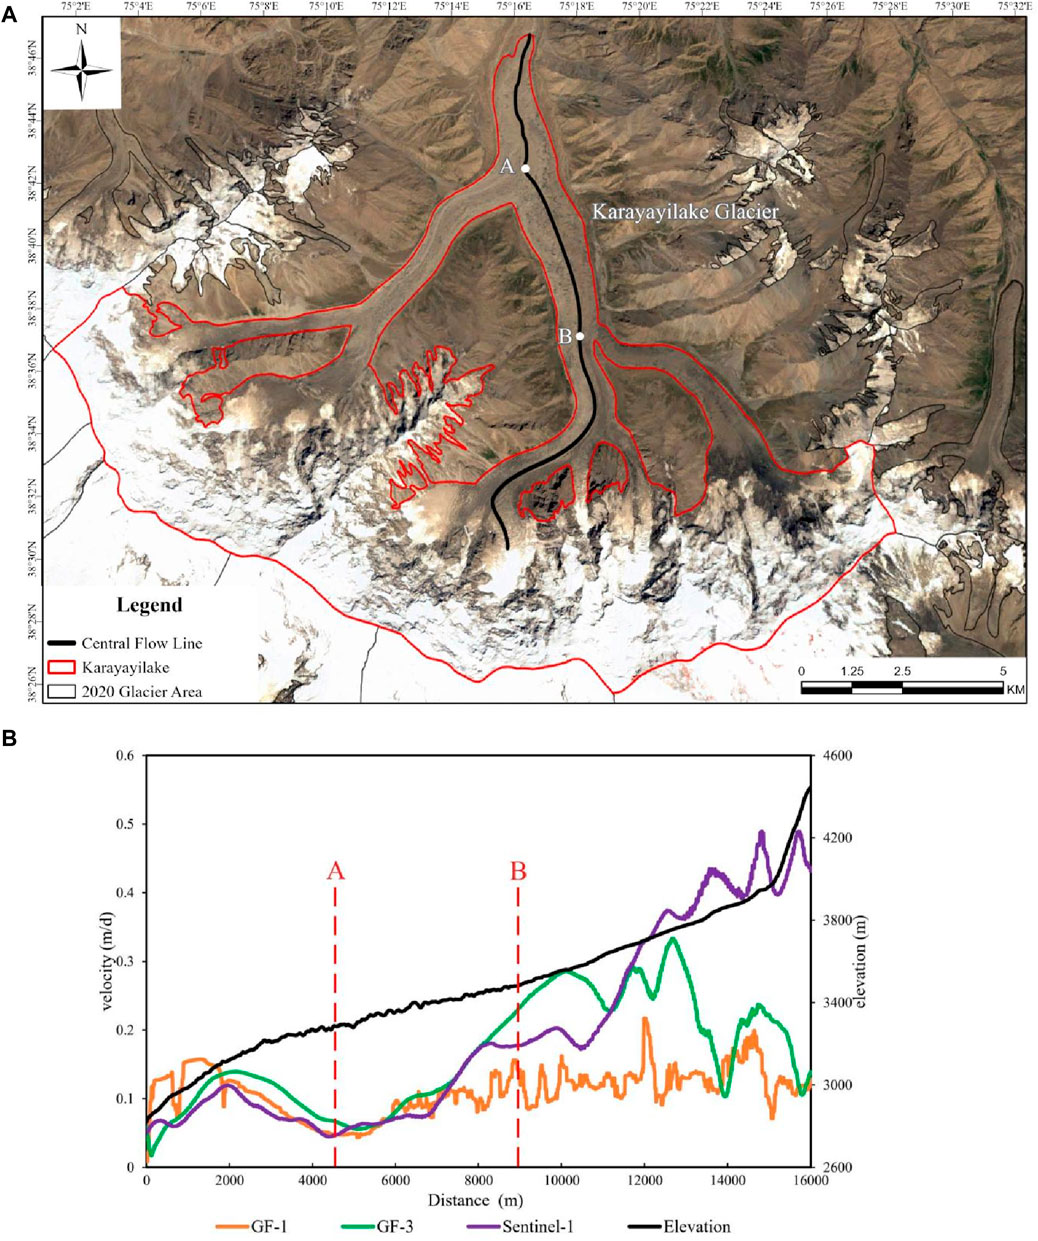
Figure 4. Surface velocity diagram of Krayylak Glacier along the middle flow line. (A) Two feature point positions. (B) Glacier surface velocity analyzed by three kinds of data on middle flow line.
3.2 Surface movement
To investigate the characteristics of glacier surface velocity across varying scales, we categorized the glaciers in Gongar into seven size classes following the World Glacier Monitoring Service (WGMS) classification guidelines. These classes include <2 km2, 2–4 km2, 4–8 km2, 8–16 km2, 16–32 km2, 32–64 km2, and 64–128 km2. The analysis of the relationship between glacier size and surface velocity in Gongar is depicted in Figure 5A. This visualization reveals that the glaciers in Gongar predominantly fall into the smaller size categories, with the majority being less than 2 km2 in area, and a noticeable decline in the number of glaciers as their size increases. When examining glaciers of different sizes, it was observed that smaller glaciers exhibit slower surface velocities, averaging 0.06 m/d. Conversely, as glacier size increases, the surface velocity tends to be faster, with an average velocity of 0.16 m/d, indicating a clear correlation between glacier size and surface velocity dynamics.
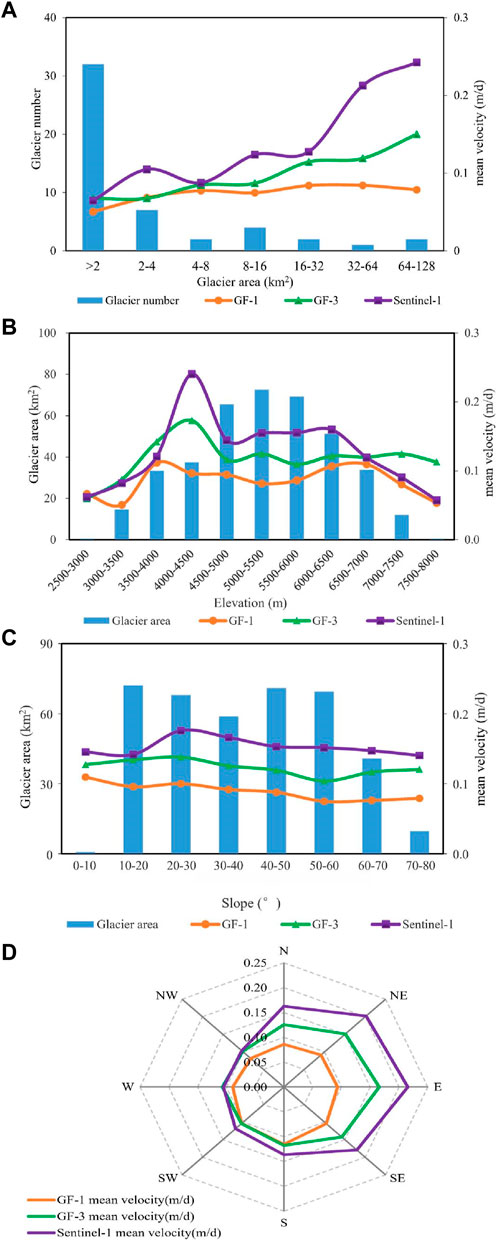
Figure 5. The features of glacier surface velocity. (A) Glacier size and surface velocity. (B) Glacier elevation and surface velocity. (C) Glacier slope and surface velocity. (D) Glacier direction and surface velocity.
The glaciers in Gongar were distributed between 2500 m and 8000 m a.s.l. In order to analyze the features of glacier surface velocity at different elevations, the glaciers in Gongar were divided into 11 elevation zones with intervals of 500 m. The relationship between glacier elevation and surface velocity in Gongar was shown in Figure 5B. The figure illustrates that 76% of the glaciers in Gongar are situated between elevations of 4500 m and 6500 m a.s.l. Notably, the glacier surface velocity exhibits a trend of initially increasing and then decreasing as elevation changes. The peak glacier surface velocity occurs at around 4500 m a.s.l, where the average velocity reaches 0.17 m/d.
The glaciers in Gongar were distributed in slopes ranging from 10° to 80°. In order to analyze the surface velocity features of glaciers at different slopes, the glaciers in Gongar were divided into 8 grades at intervals of 10°. The relationship between glacier slope and surface velocity in Gongar was shown in Figure 5C. It could be seen from the figure that the glaciers in Gongar were concentrated in the range of 10°–60°, and the surface velocity was the fastest in the range of 20°–30°, and the average surface velocity was 0.18 m/d. The surface velocity was slow when the slope was greater than 60°.
Glaciers in Gongar were divided into 8 directions, which were namely north, northeast, east, southeast, south, southwest, west and northwest. The relationship between glacier slope direction and surface velocity was shown in Figure 5D. It could be seen from the figure that when the slope direction of the glaciers in Gongar was northeast, east and southeast, the average surface velocity was fast. The average surface velocity of the glacier on the eastern slope was the fastest (0.16 m/d), and the average surface velocity of the glacier on the western slope was the slowest.
4 Discussion
4.1 The movement of glacier in Gongar region
We found that the western branch of Kayaylak Glacier and the southern branch of Qimugan Glacier exhibited faster velocity, with average speeds of 0.24 m/d and 0.28 m/d, respectively. Other glaciers in the area showed relatively stable velocity patterns. Research indicates that the western branch of Kayayilak Glacier experienced a surge in 2015, resulting in damage to surrounding grasslands and structures (Shangguan et al., 2016). Although the glacier stabilized after 2018, the western branch continued to move at a relatively fast pace, aligning with previous study findings (Peng, 2022). By compare different glacier velocities as reported by distinct studies, we observe a marked variability in the recorded speeds, offering profound insights into the dynamics of glacier movement. Specifically, leveraging Sentinel-1 Synthetic Aperture Radar (SAR) imagery, Li et al. recorded average glacier velocities of 0.25 m per day across the Greenland Ice Sheet region (Li et al., 2023). This contrasts with that of a study conducted at western Himalaya, which utilized optical imagery from the Landsat 8 satellite, documenting slightly lower velocities of 0.10 m/d for the western Himalaya glaciers during 1992–2020 (Das and Sharma, 2021). The difference underscores the influence of temporal and methodological factors on velocity measurements. Further complicating the comparison, Telling et al. employed high-resolution airborne LiDAR data in 2020, reported a substantial decrease in average glacier velocity of 1.75 ± 0.6 m/a. This variation might reflect either actual changes in glacier dynamics or the impact of higher spatial resolution data capturing more detailed movement patterns not discernible in lower resolution datasets (Telling et al., 2017). Additionally, when considering the findings from Transantarctic Mountains (Floricioiu et al., 2012), which analyzed glaciers using a combination of TerraSAR-X and GPS data for 2009–2011, an average velocity of 0.10 m/d was reported. This comparison not only highlights regional differences in glacier velocities but also the potential for satellite radar data to bridge the observational gaps presented by optical imagery, especially in areas prone to cloud cover and during the polar night. These variations in reported glacier velocities accentuate the complexities of glacier monitoring, emphasizing the need for a nuanced understanding of how different remote sensing technologies and their inherent resolutions influence our interpretations of glacier dynamics. The observed discrepancies serve as a reminder of the critical role of methodological consistency and the calibration of different datasets for cross-study comparisons. This analysis underlines the importance of a multi-modal approach to glacier observation, integrating data from various sources to construct a more comprehensive and accurate picture of glacier behavior in response to climate change.
4.2 The influences of glacier velocity measurement reliability
Compared with the spatial resolution of multi-source remote sensing images, it can be seen that the spatial resolution of optical remote sensing image is 2 m, the azimuth-oriented resolution of GF-3 image is 5 m and distance direction is 6 m, and the azimuth-oriented resolution of Sentinel-1 image is 11 m and distance direction is 2.3 m. According to the statistics of the glacier tongue width in Gongar, the average width of the ice tongue area is 362 m. The number of pixels covering the transverse section of the ice tongue in SAR images is about 10, and the number of pixels in optical images is about 181. The number of pixels in optical images is significantly more than that in SAR images, so it is easier for optical image to capture the information of glacier surface velocity in the ice tongue area (Figure 6). The continuity and integrity of the velocity of glacier surface velocity were also good. In contrast, SAR image resolution was low, and it was difficult to distinguish the tiny terrain features of the glacier surface, and the integrity of the captured surface motion of the ice tongue area was poor (Xu et al., 2020; Bai et al., 2022). It could be seen that the high resolution remote sensing images in Gongar had a good recognition effect on the surface velocity of small glaciers, glacier melting areas and ice tongue ends.
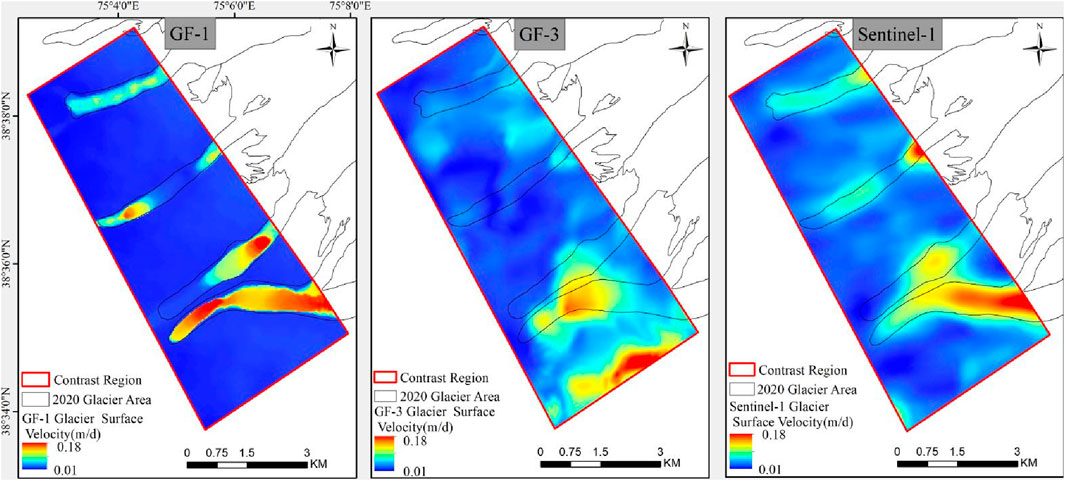
Figure 6. The velocity of glaciers ice tongue area extracted from multi-source remote sensing images.
The types of remote sensing data commonly used in glacier monitoring mainly come from visible/thermal infrared sensors, active microwave sensors, passive microwave sensors and Lidar (Li et al., 2020). Optical remote sensing images record visible light - near infrared band signals reflected by ground objects, and distinguish ground objects according to reflection ability. For example, glaciers and snow cover have high reflectance in visible light band and low reflectance in near-infrared band, and the surface texture of glaciers is clear (Scherler and Strecker, 2012), so ice and snow can be separated from other ground objects. However, it is difficult to distinguish between glaciers and snow, especially in the accumulation area of glaciers, which is easily affected by snow cover, resulting in the loss of glacier surface features in the image texture. Therefore, it is easy to misposition recognition during feature matching, resulting in more anomalies and noise in the accumulation area (Huang et al., 2014). Microwave remote sensing images record the spectral information reflected by ground objects, so as to identify ground objects and extract the required information. Compared with optical remote sensing methods, microwave remote sensing has the ability to penetrate clouds and fog, realize all-weather and all-day monitoring, and has strong observation ability for glacier surface velocity.
Optical imaging typically involves vertical illumination for ground imaging, whereas radar imaging generally employs side-looking techniques with radar waves scanning ground objects at a specific incidence angle. Consequently, SAR images in mountainous regions are susceptible to interference from terrain factors (Liu et al., 2015; Li et al., 2019), leading to the occurrence of shadow and overlying phenomena in areas with significant topographic fluctuations. When using radar imagery to monitor glacier movement, regardless of whether the data is acquired from ascending or descending orbits, the presence of overlying and shadow effects cannot be avoided due to the different orientations of glaciers. This can adversely impact both the quality of radar images and the effectiveness of extraction. The overlay and shadow ranges of GF-3 and Sentinel-1 images were extracted respectively in Gongar, as shown in Figure 7. The green area was the GF-3 overlay and shadow area, and the yellow area was the Sentinel-1 overlay and shadow area. It could be seen from the figure that in the same area, GF-3’s overlapping mask and shadow distribution area were larger than Sentinel-1, and the overlapping mask and shadow area were respectively 287.17 km2 and 135.25 km2. Their area in the glacier area was 85.52 km2 and 45.57 km2, accounting for 21.9% and 11.67% of the regional glacier area. These findings suggested that GF-3 was more susceptible to terrain variations, which in turn impacted the accuracy of extracted glacier surface velocity under similar terrain conditions. The overlay analysis of the two remote sensing data showed that the overlap area of the overlay and shadow was 42.39%, indicating that the spatial distribution area was consistent.
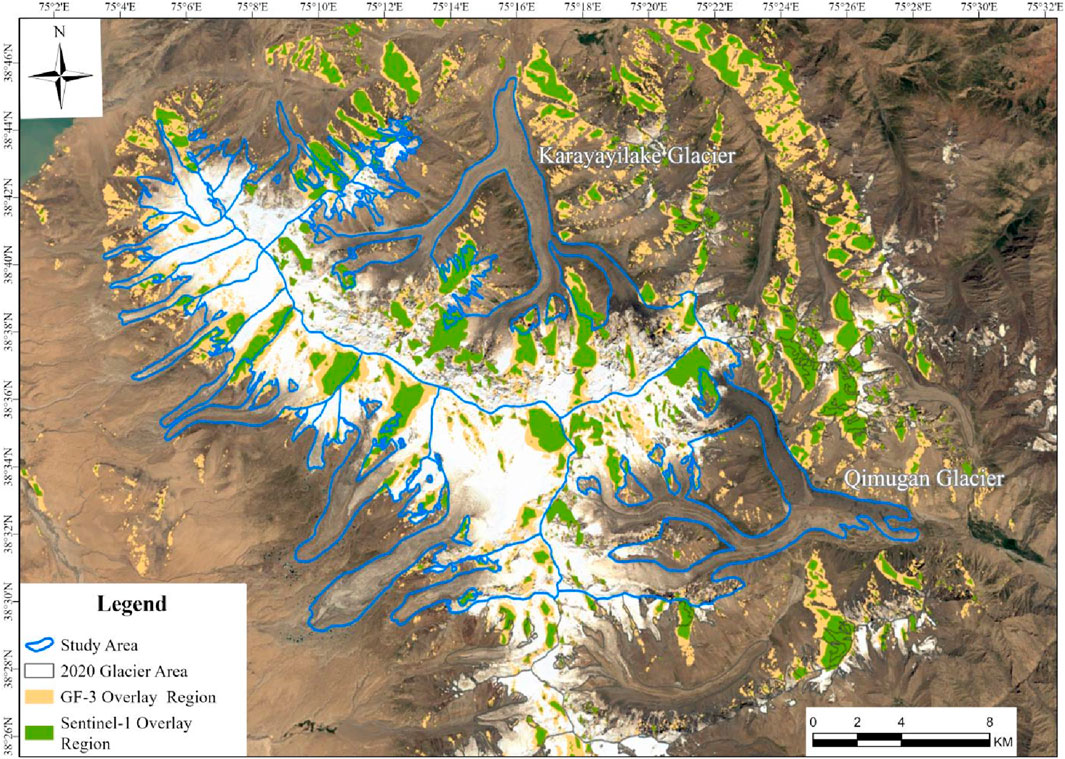
Figure 7. The distribution of overlay and shadow area.
Taking slope as the statistical unit, the area of overlay and shadow area of SAR images was analyzed, as shown in Figure 8A. The results showed that the overlay and shadow area of SAR images were small when the terrain was flat. When the slope was greater than 30°, the overlay and shadow area of GF-3 images and Sentinel-1 images increased rapidly, and the overlay and shadow areas of 40°–50° were the largest, which were respectively 25.74 km2 and 14.93 km2. Subsequently, the affected area gradually decreased with the increase of slope.
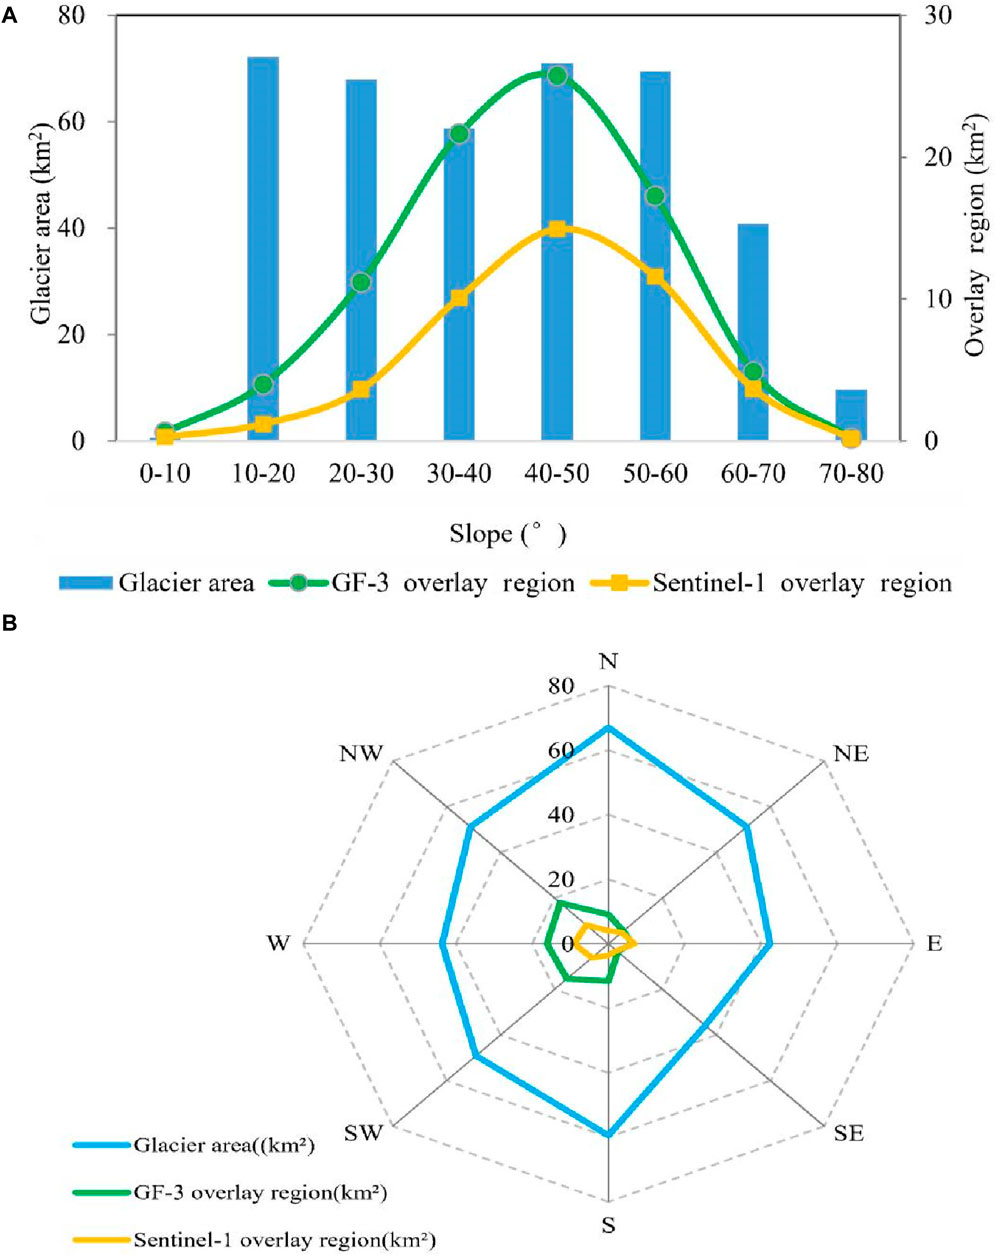
Figure 8. The effect of terrain on overlay and shadow distribution. (A) Glacier slope with overlay and shadow. (B) Glacier direction with overlay and shadow.
With slope aspect as the statistical unit, the area of overlay and shadow affected area of SAR image was statistically analyzed, as shown in Figure 8B. As could be seen from the figure, the overlay and shadow areas of SAR images in Gongar were small when facing north, northeast, east, southeast and south, while the overlay and shadow areas were large when facing southwest, west and northwest, in which the maximum overlay and shadow areas of GF-3 and Sentinel-1 images appear in the northwest direction. They are 17.87 km2 and 8.26 km2. Through the above analysis, it could be seen that SAR images of glacier areas are easily affected by slope and slope direction, and different data sources were affected to different degrees. Therefore, in order to ensure the reliability and accuracy of the extraction results of glacier surface velocity, images applicability analysis should be carried out based on the topographic and geomorphic features of the study area before using SAR images.
5 Conclusion
Our comprehensive study on the glacier dynamics in Gongar, particularly focusing on glacier velocity through multi-source remote sensing data, highlights the intricate relationship between glacier characteristics and environmental factors. Analysis of glacier surface velocities in 2020 revealed that larger glaciers, such as the western branch of the Kayayilak Glacier and the southern branch of the Qimugan Glacier, demonstrated higher movement speeds, emphasizing a positive correlation between glacier size and velocity. This relationship is further nuanced by the influence of topographic features, where glacier velocity exhibited a peak at elevations between 4000 m and 4500 m before declining at higher altitudes due to steeper ice surfaces and thinning ice thickness. Under the context of global warming, the Gongar has experienced a notable increase in temperature and precipitation over the past decade. Specifically, there has been a temperature rise of 0.52°C and a precipitation increase of 17.2 mm. These changes undoubtedly have implications for the overall morphology and dynamics of glaciers in this region. Consequently, future research will focus on enhancing our understanding of glacier movement by investigating its internal mechanisms through time series analysis, while also delving deeper into the intricate relationship between climate change and glacier dynamics.
By comparing glacial velocity extracted from multi-source remote sensing data in the same region with residual velocity in non-glacial areas, the study evaluated the effectiveness of extracting glacial velocity from multi-source remote sensing data. The results demonstrate a strong consistency in spatial distribution and characteristics of surface motion velocity derived from GF1, GF3, and Sentinel-1 images, thereby confirming the feasibility, accuracy, and reliability of integrating multi-source remote sensing data for glacier movement analysis. This approach overcomes the limitations associated with single data source monitoring and fully harnesses the advantages and value of utilizing multiple sources to obtain comprehensive, reliable, and abundant information on glacier movement. From the perspective of selecting remote sensing data sources for monitoring glacier movement, domestic high-resolution optical images possess the advantages of frequent updates and high spatial resolution, making them particularly suitable for monitoring small glaciers. They can continuously and comprehensively extract surface movement information from glaciers smaller than 2 km2. However, due to susceptibility to cloud cover, snowfall, and other factors, it is recommended to select optical images captured during the ablation season when studying glacier movement in order to avoid abnormal feature matching caused by long time intervals or seasonal snow disturbances. Additionally, SAR data offers unique advantages that cannot be replaced by optical images in glacier movement monitoring. A comparison between velocities extracted from GF-3 and Sentinel-1 demonstrates that GF-3 images provide clear and detailed velocity information while accurately reflecting surface velocity characteristics in areas where glaciers converge. This finding supports further research on glacier movement. Therefore, the future trend in glacier movement studies will inevitably involve the combined application of multi-source data.
Data availability statement
The original contributions presented in the study are included in the article/Supplementary Material, further inquiries can be directed to the corresponding author.
Author contributions
FG: Conceptualization, Formal Analysis, Investigation, Methodology, Resources, Software, Visualization, Writing–original draft, Writing–review and editing. SZ: Formal Analysis, Investigation, Software, Visualization, Writing–original draft. QZ: Conceptualization, Data curation, Formal Analysis, Funding acquisition, Methodology, Project administration, Visualization, Writing–original draft, Writing–review and editing. DL: Writing–original draft. YF: Writing–original draft. XC: Supervision, Visualization, Writing–original draft.
Funding
The author(s) declare financial support was received for the research, authorship, and/or publication of this article. This research was funded by technical research on the survey and monitoring of natural resources and the second batch of pilot technical systems, Natural Resources Investigation No. 2022-38.
Acknowledgments
We thank the Department of Natural Resources of Xinjiang Uygur Autonomous Region for providing the 2020 glacier area data, and the Xinjiang Geographic Information Public Service Platform and Geospatial Data Cloud for providing GF-3 images. We are also thankful to the European Space Agency (ESA) for Sentinel-1 images and German Space Agency (DLR) for TanDEM.
Conflict of interest
The authors declare that the research was conducted in the absence of any commercial or financial relationships that could be construed as a potential conflict of interest.
Publisher’s note
All claims expressed in this article are solely those of the authors and do not necessarily represent those of their affiliated organizations, or those of the publisher, the editors and the reviewers. Any product that may be evaluated in this article, or claim that may be made by its manufacturer, is not guaranteed or endorsed by the publisher.
References
Bai, C., Wang, F., Wang, L., Xu, C., Yue, X., Yang, S., et al. (2022). Dynamic monitoring of debris-covered glacier surface velocity and ice thickness of Mt.tomur, tian Shan, China. Remote Sens. 15, 150. doi:10.3390/rs15010150
Berthier, E., Vadon, H., Baratoux, D., Arnaud, Y., Vincent, C., Feigl, K., et al. (2004). Surface motion of mountain glaciers derived from satellite optical imagery. Environ 95, 14–28. doi:10.1016/j.rse.2004.11.005
Bhambri, R., Hewitt, K., Kawishwar, P., Kumar, A., Verma, A., Tiwari, S., et al. (2019). Ice-dams, outburst floods, and movement heterogeneity of glaciers, Karakoram. Change 180, 100–116. doi:10.1016/j.gloplacha.2019.05.004
Bisht, H., Kotlia, B. S., Kumar, K., Joshi, L. M., Sah, S. K., and Kukreti, M. (2020). Estimation of the recession rate of gangotri glacier, garhwal himalaya (India) through kinematic gps survey and satellite data. Environ. Earth Sci. 79, 1–14. doi:10.1007/s12665-020-09078-0
Brancato, V., Rignot, E., Milillo, P., Morlighem, M., Mouginot, J., An, L., et al. (2020). Grounding line retreat of denman glacier, east Antarctica, measured with cosmo-skymed radar interferometry data. Geophys. Res. Lett. 47, e2019GL086291. doi:10.1029/2019GL086291
Das, S., and Sharma, M. C. (2021). Glacier surface velocities in the jankar chhu watershed, western himalaya, India: study using landsat time series data. Remote Sens. Appl. Soc. Environ. 24 (100615), 100615. doi:10.1016/J.RSASE.2021.100615
Dematteis, N., Giordan, D., Troilo, F., Wrzesniak, A., and Godone, D. (2021). Ten-year monitoring of the grandes jorasses glaciers kinematics. Limits, potentialities, and possible applications of different monitoring systems. Remote Sens. 13, 3005. doi:10.3390/RS13153005
Feng, L. L., Jiang, L. M., Liu, L., and Sun, Y. F. (2020). Karayaylak glacier changes in the Kongur Mountain of eastern Pamir between 1973 and 2016 based on active and passive remote sensing technologies. Remote Sens. Land Resour. 32, 162–169. doi:10.6046/gtzyyg.2020.02.21
Floricioiu, D., Jezek, K., Baessler, M., and Jaber, W. A. (2012). “Geophysical parameters estimation with terrasar-x of outlet glaciers in the transantarctic mountains,” in 2012 IEEE Int. Geosci. Remote Sens. Sym, 1565–1568.
Frezzotti, M., Capra, A., and Vittuari, L. (1998). Comparison between glacier ice velocities inferred from gps and sequential satellite images. Ann. Glaciol. 27, 54–60. doi:10.3189/1998aog27-1-54-60
Guan, W. J., Cao, B., and Pan, B. T. (2020). Research of glacier flow velocity:current situation and prospects. J. Glaciol. Geocryol. 42, 1101–1114. doi:10.7522/j.issn.1000-0240.2020.0094
Huang, D., Zhang, Z., Jiang, L., Zhang, R., Lu, Y., Shahtahmassebi, A., et al. (2023). Variability of glacier velocity and the influencing factors in the muztag-kongur mountains, eastern pamir plateau. Remote Sens. 15, 620. doi:10.3390/RS15030620
Huang, L., and Li, Z. (2009). Mountain glacier flow velocities analyzed from satellite optical images. J. Glaciol. Geocryol. 31, 935–940. doi:10.7522/j.issn.1000-0240.2009.0128
Huang, L., Li, Z., Zhou, J. M., and Tian, B. S. (2014). Glacier change monitoring using SAR: an overview. Adv. Earth Sci. 29, 985–994. doi:10.11867/j.issn.1001-8166.2014.09.0985
Huang, M. H., and Sun, Z. Z. (1982). Some flow characteristics of continental-type Glaciers in China. J. Glaciol. Geocryol. 4, 35–45. doi:10.7522/j.issn.1000-0240.1982.0020
Jansson, P., Hock, R., and Schneider, T. (2003). The concept of glacier storage: a review. J. Hydrol. 282, 116–129. doi:10.1016/s0022-1694(03)00258-0
Jiang, Z. L., Liu, S. Y., Long, S. C., Lin, J., Wang, X., Li, J., et al. (2014). Analysis of the glacier dynamics features in Kongur Mountain based on SAR technology and DEMs. J. Glaciol. Geocryol. 36, 286–295. doi:10.7522/j.issn.1000-0240.2014.0035
Jing, Z. F., Zhou, Z. M., and Liu, L. (2010). Progress of the research on glacier velocity in China. J. Glaciol. Geocryol. 32, 750–754. doi:10.7522/j.issn.1000-0240.2010.0099
Kelly, J. T., Hehlen, M., and McGee, S. (2023). Uncertainty of satellite-derived glacier flow velocities in a temperate alpine setting (juneau icefield, Alaska). Remote Sens. 15, 3828. doi:10.3390/RS15153828
Leinss, S., and Bernhard, P. (2021). Tandem-x: deriving insar height changes and velocity dynamics of great aletsch glacier. IEEE J. Sel. Top. Appl. Earth Obs. Remote Sens. 2021 (14), 4798–4815. doi:10.1109/JSTARS.2021.30780134
Li, G., Mao, Y., Feng, X., Chen, Z., Yang, Z., and Cheng, X. (2023). Monitoring ice flow velocity of petermann glacier combined with sentinel-1 and− 2 imagery. Int. J. Appl. Earth Obs. 121, 103374. doi:10.1016/J.JAG.2023.103374
Li, H. L., Li, Z. Q., Shen, Y. P., Wang, F. T., and Wang, W. B. (2007). Glacier dynamic models and their applicability for the glaciers in China. J. Glaciol. Geocryol. 29, 201–208.doi:10.3969/j.issn.1000-0240.2007.02.006
Li, X., Che, T., Li, X. W., Dai, L. Y., Fu, W. X., Huang, C. L., et al. (2020). Remote sensing of cryosphere. Beijing, China: Science Press, 10–42.
Li, Z. H., Song, C., Yu, C., Xiao, R. Y., Chen, L. F., Luo, H., et al. (2019). Application of satellite radar remote sensing to landslide detection and monitoring:challenges and solutions. Geomat. Inf. Sci. Wuhan. Univ. 44, 967–979. doi:10.13203/j.whugis20190098
Li, Z. Q. (2019). Simulation of mass balance and dynamic processes of mountain glaciers. Beijing, China: Science Press, 1–10.
Liang, Q., and Wang, N. (2023). Mountain glacier flow velocity retrieval from ascending and descending sentinel-1 data using the offset tracking and msbas technique: a case study of the siachen glacier in karakoram from 2017 to 2021. Remote Sens. 15, 2594. doi:10.3390/RS15102594
Liang, Q., and Wang, N. L. (2024). The characteristics of glacier surface velocity in the West Kunlun Mountains derived from ITS_LIVE data during 2000-2018. J. Glaciol. Geocryol. 46, 367–378. doi:10.7522/j.issn.1000-0240.2024.0031
Liang, S. S., and Yan, S. Y. (2014). Glacier surface flow velocity field estimation using SAR images of muztag ata. Sci. Technol. Eng. 14, 140–145.doi:10.3969/j.issn.1671-1815.2014.23.026
Liu, T., Wang, Z., Shokr, M., Lei, R., and Zhang, Z. (2022). An assessment of sea ice motion products in the robeson channel using daily sentinel-1 images. Remote Sens. 14, 329. doi:10.3390/RS14020329
Liu, Y., Fu, Z. Y., and Zheng, F. B. (2015). Review on high resolution remote sensing image classification and recognition. J. Geo-Inf. Sci. 17, 1080–1091. doi:10.3724/SP.J.1047.2015.01080
Lu, X., Jiang, L., Xiao, C., and Li, D. (2022). Analyzing spatial-temporal variability of ice motion in northeast Greenland from 1985 to 2018. Front. Earth Sci. 10. doi:10.3389/FEART.2022.972291
Paul, F., Bolch, T., Kääb, A., Nagler, T., Nuth, C., Scharrer, K., et al. (2015). The glaciers climate change initiative: methods for creating glacier area, elevation change and velocity products. Environ 162, 408–426. doi:10.1016/j.rse.2013.07.043
Peng, Y. F. (2022). Research on variation of glacier movement and surge event in kongur-muztagh mountain. LanZhou, China: Northwest Normal University.
Qin, D. H., Yao, T. D., Ding, Y. J., Ren, J. W., He, Y. Q., Kang, S. C., et al. (2018). Introductionto cryospheric science. Beijing, China: Science Press.
Rignot, E., and Kanagaratnam, P. (2006). Changes in the velocity structure of the Greenland ice Sheet. Greenl. Ice Sheet. Sci. 311, 986–990. doi:10.1126/science.1121381
Scherler, D., and Strecker, M. R. (2012). Large surface velocity fluctuations of biafo glacier, central karakoram, at high spatial and temporal resolution from optical satellite images. J. Glaciol. 58, 569–580. doi:10.3189/2012JoG11J096
Shangguan, D., Liu, S., Ding, Y., Guo, W., Xu, B., Xu, J., et al. (2016). Characterizing the may 2015 karayaylak glacier surge in the eastern Pamir Plateau using remote sensing. J. Glaciol. 2016 (62), 944–953. doi:10.1017/jog.2016.81
Shen, H. F., Zhou, S. D., Li, F., and Yang, J. (2022). Glacier motion monitoring using a novel deep matching network with SAR intensity images. Remote Sens. 14, 5128. doi:10.3390/RS14205128
Shi, Y. F., Huang, M. H., and Ren, B. H. (1988). The overview of glaciers in China. Beijing, China: Science Press.
Strozzi, T., Caduff, R., Jones, N., Barboux, C., Delaloye, R., Bodin, X., et al. (2020). Monitoring rock glacier kinematics with satellite synthetic aperture radar. Remote Sens. 12, 559. doi:10.3390/rs12030559
Sun, Y. L., Jiang, L. M., Liu, L., and Wang, H. S. (2016). Extraction and assessment of mountain glacier velocity based on Landsat-7 ETM+SLC-OFF images: a case study of Siachen Glacier in Karakoram. J. Glaciol. Geocryol. 38, 596–603. doi:10.7522/j.issn.1000-0240.2016.0066
Telling, J. W., Glennie, C., Fountain, A. G., and Finnegan, D. C. (2017). Analyzing glacier surface motion using lidar data. Remote Sens. 9, 283. doi:10.3390/rs9030283
Woo, S. J., and Hoon, S. H. (2023). Seven-year variation in glacier surface velocity at Narsap Sermia in Southwest Greenland. GISci. Remote Sens. 60. doi:10.1080/15481603.2023.2207301
Xie, Z. C., and Liu, C. H. (2010). Introduction to glaciology. Shanghai, China: Shanghai Popular Science Press.
Xu, J. H., Feng, M., Wang, J. B., Ran, Y. H., Qi, Y., Yang, L. A., et al. (2020). Automatically identifying rock glacier based on gaofen satellite image and deep learning. Remote sens. Technol. Appl. 35, 1329–1336. doi:10.11873/j.issn.1004-0323.2020.6.1329
Yan, S. Y. (2013). Research on extraction of alpine glacier surface movement by SAR remote sensing, Ph.D. Thesis. BeiJing, China: University of Chinese Academy of Sciences.
Yan, X. G., He, Y. Q., Zhang, S. L., Niu, H. W., Zhu, G. F., Wang, S. J., et al. (2017). Analysis of surface flow velocity on the Baishui Glacier No. 1 during ablation period in the Yulong Mountain. J. Glaciol. Geocryol. 39, 1212–1220. doi:10.7522/j.issn.1000-0240.2017.0326
Zhang, Q. M. (2022). Temporal and spatial variation of the typical glaciers activity analysis with multi-source spaceborne imagery in qinghai-tibet plateau. Xuzhou, China: China University of Mining and Technology.
Zhang, Q. M., Lv, M. Y., and Yan, S. Y. (2021). A GF-3 imagery-based dataset of glacier surface motion distribution in High Mountain Asia during 2019–2020. Chin. Sci. Data 6, 153–164. doi:10.11922/csdata.2021.0028.zh
Zhang, Q. M., Zheng, Y. T., Zhang, L., Li, Z. G., and Yan, S. Y. (2020). South inylchek glacier surface motion extraction and analysis based on time-series pixel tracking algorithm. Remote Sens. Technol. Appl. 35, 1273–1282. doi:10.11873/j.issn.1004-0323.2020.6.1273
Zhang, S. S., Zhang, Z., Liu, S. Y., Li, X., Huang, D. N., and Xue, N. T. (2019b). Terrain dependence characteristics of glacier flow velocity in northwest of the Karakoram Mountains. J. Glaciol. Geocryol. 41, 1015–1025. doi:10.7522/j.issn.1000-0240.2019.1150
Zhang, X. B., Zhao, X. S., Ge, D. Q., and Liu, B. (2019a). Motion characteristics of the south inilchek glacier derived from new C-band SAR satellite. Geomat. Inf. Sci. Wuhan. Univ. 44, 429–435. doi:10.13203/j.whugis20160538
Zhang, Z., Liu, S. Y., Wei, J. F., Jiang, Z. L., Xu, J. L., and Guo, W. Q. (2016). Monitoring recent surging of the Karayaylak Glacier in Pamir by remote sensing. J. Glaciol. Geocryol. 38, 11–20. doi:10.7522/j.isnn.1000-0240.2016.0002
Zhen, Y. T. (2019). “Design and implementation of SAR,” in Pixel tracking parallel algorithms for mountain glacier motion monitoring. Xuzhou, China: China University of Mining and Technology.
Zhou, J. M., Zhang, X., Liu, Z. P., and Li, Z. (2021a). Extraction and analysis of mountain glacier movement from GF-1 satellite data. Natl. Remote Sens. Bull. 25, 530–538. doi:10.11834/jrs.20219080
Zhou, Y., Chen, J., and Cheng, X. (2021b). Glacier velocity changes in the himalayas in relation to ice mass balance. Remote Sens. 13, 3825. doi:10.3390/RS13193825
Keywords: Gongar region, multi-source remote sensing, image cross-correlation algorithm, offset tracking algorithm, glacier surface velocity
Citation: Gu F, Zhang S, Zhang Q, Li D, Fu Y and Chen X (2024) The velocity extraction and feature analysis of glacier surface motion in the Gongar region based on multi-source remote sensing data. Front. Earth Sci. 12:1413531. doi: 10.3389/feart.2024.1413531
Received: 07 April 2024; Accepted: 12 June 2024;
Published: 09 July 2024.
Edited by:
Dongliang Luo, Chinese Academy of Sciences (CAS), ChinaReviewed by:
Guofei Zhang, Lanzhou University, ChinaDongqi Zhang, Chinese Academy of Meteorological Sciences, China
Copyright © 2024 Gu, Zhang, Zhang, Li, Fu and Chen. This is an open-access article distributed under the terms of the Creative Commons Attribution License (CC BY). The use, distribution or reproduction in other forums is permitted, provided the original author(s) and the copyright owner(s) are credited and that the original publication in this journal is cited, in accordance with accepted academic practice. No use, distribution or reproduction is permitted which does not comply with these terms.
*Correspondence: Qinqin Zhang, aGFvenFxaGFvQDE2My5jb20=