 Qiang Xu1,2
 Ruyue Wang3*
 Zebin Wang4Yue Zhao1,2Quanyun Miao1,2
 Zhengguang Zhang1,2*Xiujia Bai1,2Feng Xinxin5
- 1General Prospecting and Research Institute of China National Administration of Coal Geology, Beijing, China
- 2Key Laboratory of Transparent Mine Geology and Digital Twin Technology, National Mine Safety Administration, Beijing, China
- 3Sinopec Petroleum Exploration and Production Research Institute, Beijing, China
- 4PetroChina Coalbed Methane Company Limited, Beijing, China
- 5Shaanxi Tiancheng Petroleum Technology Company Limited, Xi’an, China
Although significant amounts of methane are present in anthracite coal seams, coalbed methane resources cannot be extracted effectively and quickly. This study mainly focused on investigating the pore system and methane adsorption capacity to clarify the storage of coalbed methane. Anthracite coal samples from the Anzenan coalbed methane block in China were collected, and pore characterization methods (low-pressure N2 adsorption, mercury injection experiments, and scanning electron microscopy (SEM) observations) and methane isothermal adsorption experiments were conducted. The results showed that few mesopores and nanoscale macropores were present in the anthracite coal samples. The volume of the 2–300 nm pores in these coal samples obtained from the N2 adsorption experiment was lower than 0.01 cm3/g. SEM observations also revealed that only a small number of mesopores and nanoscale macropores could be seen, and most of these pores were isolated. In terms of the methane isothermal adsorption data, it was found these anthracite coals have a large methane adsorption capacity, and the Langmuir volume ranges from 19.5 to 28.4 cm3/g, with an average of 22.2 cm3/g. With increasing ash yield, the Langmuir volume decreased linearly, indicating that methane molecules were mainly adsorbed in the organic matter of coal. As methane is mainly adsorbed in the micropores of coal organic matter and there are few mesopores and nanoscale macropores in the organic pores in coal, there are not enough tunnels to transport the adsorbed methane molecules to the outside. Thus, it is difficult to extract coalbed methane from anthracite. This study reveals the impact of pore system limitations on the storage and extraction of coalbed methane in anthracite coal. The findings can be applied to the extraction of coalbed methane from anthracite coal seams worldwide.
1 Introduction
There are huge amounts of coalbed methane resources in the underground coal seams (Moore, 2012; Qin et al., 2018; Hou et al., 2020; Joshi et al., 2023). However, most of these natural gas resources have not been effectively exploited. In addition, coalbed methane is a key factor threatening the safety of coal mining (Cheng and Pan, 2020; Tu et al., 2022; Wang and Cheng, 2023). Although many studies have been conducted on coalbed methane over the past 40 years, researchers have not found many ways to exploit it (Bustin et al., 2016; Akhondzadeh et al., 2021). Global coalbed methane production has decreased in recent years. The exploration and exploitation of coalbed methane help reduce the use of coal and mitigate greenhouse effects and climate warming (Cho et al., 2019; Fan et al., 2019). Thus, more efforts are needed to study coalbed methane.
Unlike conventional gas, coalbed methane is primarily stored in coal as an absorbed gas (Chattaraj et al., 2016; Hou et al., 2020; Mohamed and Mehana, 2020; Liu et al., 2021). Thus, the evaluation of the methane adsorption capacity of coal is very important for understanding the reservoir mechanism of coalbed methane (Song et al., 2012; Liu et al., 2021). Isothermal adsorption experiments (volumetric and gravimetric methods) are often used to test the methane adsorption capacity of coal samples (Bustin and Clarkson, 1998; Lorenz and Wessling, 2013). Previous studies found that most methane adsorption data for coal conform to the Langmuir equation (Moore, 2012; Perera et al., 2012). With increasing pressure, the amount of methane adsorption first increases significantly and then approaches a constant value (Langmuir volume) (Moore, 2012). When the experimental temperature increased, the amount of methane adsorbed decreased, indicating that temperature had a negative effect on methane adsorption in coal (Zhang et al., 2011; Li et al., 2022). In addition, the methane adsorption capacity of coal is affected by many factors, such as maturity, ash yield, and moisture (Crosdale et al., 1998; Chalmers and Marc Bustin, 2007). During the coalification process, the coalification of coal changes in stages: it first increases (Ro < 1.4%), then decreases (Ro = 1.4–3.7%), and finally decreases again (Ro > 3.7%) (Zhong and Zhang, 1990; Zhong, 2004; Liu et al., 2021). In addition, large amounts of methane have been generated from these anthracite coals during past geological times, and the gas content in anthracite coal seams is usually very high (Su et al., 2005; Cai et al., 2011; Meng et al., 2017).
Previous studies have shown that the pore systems of coal samples are complex, with most pores in coal being nanoscale (Mastalerz et al., 2012; Wang et al., 2014; Nie et al., 2015; Yan et al., 2020; Yu et al., 2020). Coalbed methane researchers usually use CO2 adsorption experiments to study micropores (<2 nm) (Nie et al., 2015; Zhao et al., 2016; Hu et al., 2020), and they use mercury injection experiments and N2 adsorption experiments to characterize the mesopores (2–50 nm) and macropores (>50 nm) in coal (Cai et al., 2013). In addition, scanning electron microscopy (SEM) has been used to observe pores in coal. However, the SEM technique can only observe pores larger than 30 nm (Li et al., 2020; Zou et al., 2020). Although many techniques have been applied in studies of coal pores, some key issues regarding coal pores remain unclear. For example, we do not know how differently sized pores connect or the generation mechanism of different types of pores. Pores are not only storage spaces but also transport channels of coalbed methane. Thus, the lack of clarity in the pore system limits the effective exploration and exploitation of coalbed methane.
Laboratory studies and exploration data have shown that the coalbed methane content of anthracite coal reservoirs is very high (Qin et al., 2018; Wang et al., 2020). However, the reason for the difficulty in extracting these coalbed methane molecules remains unclear (Wang Ruyue et al., 2018a; 2021). Therefore, this study aims to determine the key factors affecting methane storage and transport tunnels. Eight anthracite coal samples were collected from Anzenan coalbed methane blocks in the Qinshui Basin, China. Low-pressure N2 adsorption experiments, mercury injection experiments, and SEM were performed to study the pore systems in anthracite coal. In addition, methane isothermal adsorption experiments were conducted to investigate the methane storage in coal.
2 Samples and methods
2.1 Samples
Samples were collected from coalbed methane drilling cores in the Anzenan coalbed methane block. The Anzenan coalbed methane block is located in the Qinshui Basin, the most successful coalbed methane basin in China (Qin et al., 2018). Four of the eight coal samples belong to the 10# coal seam, and the other four belong to the 11# coal seam. Sampling was conducted from top to bottom without channel sampling. All the samples were anthracite coal, and the vitrinite reflectance (VRo) was approximately 2.1%. The ash yield of the coal samples ranged from 9.49% to 30.45%, with an average of 22.57%. The ash yields of the samples from the 10# coal seam were usually higher than those of the 11# coal sample. In terms of the maceral composition, vitrinite comprised more than 80% of the total organic matter in coal samples. Inertinite content ranged from 5.89% to 19.21%, with an average of 14.23%.
2.2 Experiments
2.2.1 High-pressure mercury injection experiments
High-pressure mercury injection experiments have proven to be one of the most effective methods for testing pores >10 nm in size (Okolo et al., 2015; Guan et al., 2020). This method has advantages, including a wide pore-testing range (Okolo et al., 2015). Before testing, the coal samples were crushed into small pieces (approximately 1 cm3). During the experiment, the test pressure was set to approximately 1–40,000 psi, and the corresponding pore diameters ranged from approximately 200,000 to 5 nm.
2.2.2 N2 adsorption experiment
Low-temperature N2 adsorption experiments are commonly used to test the nanopores in porous materials (Zhao et al., 2016; Wang et al., 2017; Wang et al., 2018b). The size of the pores tested by N2 adsorption experiments usually ranges from 2 to 300 nm (Clarkson et al., 2013). The testing instrument used in this study was ASAP 2420 (Micromeritics). The experimental temperature was 77 K. Approximately 2–3 g of the powder sample was used in the experiment. As some air molecules can be adsorbed in the pores of coal and occupy pore space, automatic degassing was performed before the experiment. The degassing process would reduce the effect of adsorbed air in the pores of the coal samples. Considering that high degassing temperatures may cause changes in the pore structure of the coal, as coal will undergo further coalification at elevated temperatures, the degassing temperature should not be set too high. In addition, based on the previous study by Adesida et al. (2011), when the degassing temperature does not exceed 100°C, it does not significantly affect the experimental results. During the experiment, the equilibration interval was set to 10 s.
2.2.3 Methane isothermal experiment
Methane isothermal experiments were performed according to the Chinese standard GB/T 19560-2008. Before the experiment, the samples were crushed to 60–80 mesh. During the experiment, the temperature was set to 30°C. Approximately 30 g of the coal powder sample was used during the experiment. Moisture was added to the coal samples before they were placed in the sample cell. Helium was used to measure the sample volume and vacuum space.
2.2.4 SEM
SEM was performed using the ZEISS Scanning Electron Microscope. The coal samples used in the SEM experiment were blocks rather than power samples. Pores in the coal samples were examined during the experiment. Some typical minerals were also observed.
3 Results
3.1 Experimental data of high-pressure mercury injection
The mercury injection and extraction curves of the five coal samples are shown in Figure 1. It can be seen that the hysteresis loops of the mercury injection and extraction curves are narrow. This indicated that most of the mercury injected into the coal sample was extracted when the pressure decreased, and the pores in the coal samples were mainly open. Based on Figure 1, it can be seen that the amount of intruded mercury in sample N13-10-1 was much larger than that of the other coal samples. The main growth in the intruded mercury volume is mainly located at 5–20 psi. In addition, a slight increase can also be observed in the high-pressure stage (pressure is greater than 10,000 psi). It should also be noted that at high-pressure stages, small nanopores generally tend to be overestimated due to the compression effect of the coal matrix (Peng et al., 2017; Li et al., 2021). However, in the samples discussed in this study, these compression effects are not apparent. For example, the experimental data of N13-11-6 showed that with the mercury injection pressure increasing from 2,081.311 psi to 27,866.113 psi, the cumulative intruded mercury volume remained unchanged at 0.0105 mL/g.
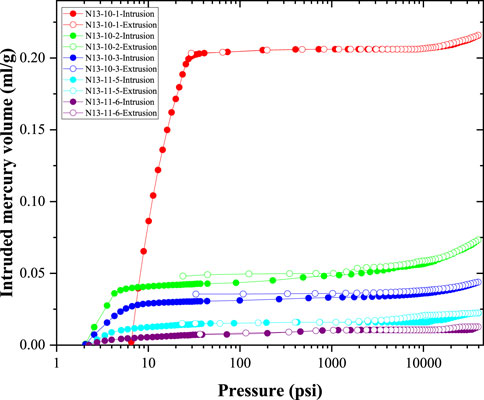
Figure 1. Mercury injection and mercury extraction curves of the coal samples.
Figure 2 illustrates the pore size distribution data of the coal sample obtained from the high-pressure mercury experiment. The pores in the coal were mainly macropores (larger than 50 nm). The peaks of the incremental pore volume curve were mainly located at 10,000 nm to 100,000 nm. The incremental pore volume with a pore size smaller than 1,000 nm was low, indicating that a few nanopores were formed in the coal samples. In addition, the peak of the incremental volume in the N13-10-1 sample was mainly located at 10,000–30,000 nm, and comparably, the peaks of the incremental volume of the other four coal samples were mainly located between 40,000 nm and 100,000 nm. These large pores are mainly cracks and cleats in the coal sample, which can form during both the coalification and sample preparation processes. In summary, the most important result of the mercury injection experiment (Figures 1, 2) is that a few nanopores (<1,000 nm) were found.
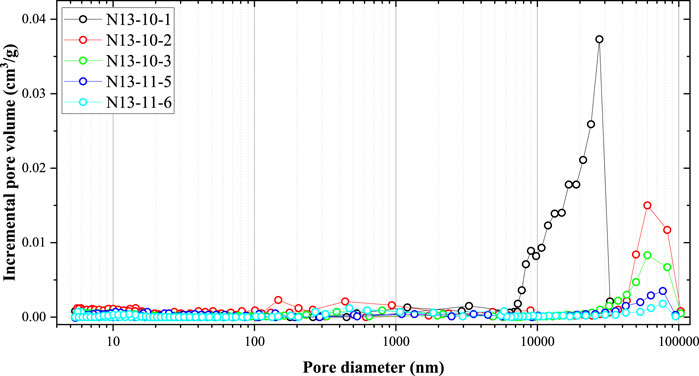
Figure 2. Pore size distribution of the coal sample obtained from the high-pressure mercury injection experiment.
3.2 Experimental data of the low-pressure N2 adsorption experiment
The N2 adsorption and desorption curves of the eight coal samples obtained in the N2 adsorption experiments are shown in Figures 3A, B. The N2 adsorption and desorption curves of the coal samples from the 10# coal seam differed slightly from those of the 11# coal seam. First, the N2 adsorption amounts of the coal samples from the 10# coal seam were smaller than those from the 11# coal seam. Second, the hysteresis loops of the coal samples from the 10# coal seam were larger than those from the 11# coal seam. In addition, for all eight coal samples, the N2 adsorption amount increased significantly when the relative pressure exceeded 0.8. In addition, the desorption curves decreased at a P/P0 ratio of approximately 0.5.
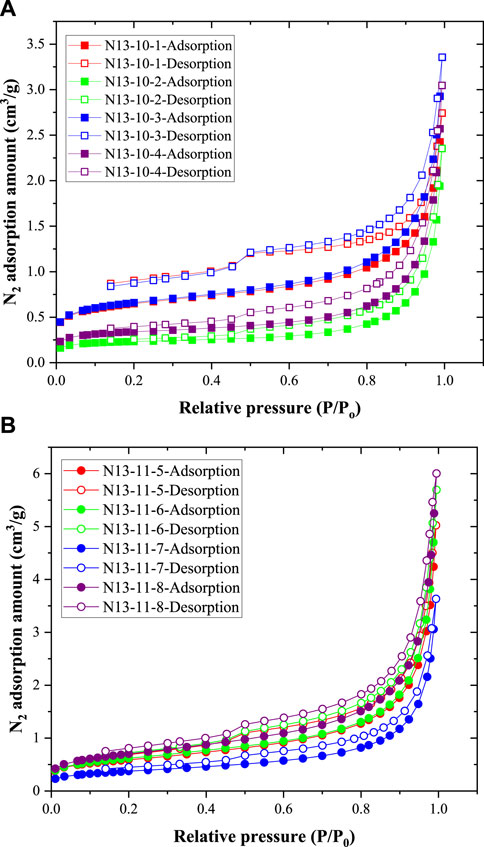
Figure 3. N2 adsorption and desorption curves of coal samples: (A) data of four coal samples from the 10# coal seam; (B) data of the other four coal samples from the 11# coal seam.
Based on the N2 adsorption data and BJH model, the pore size distribution data were calculated, as shown in Figure 4. Generally, the incremental pore volume increased with increasing pore size. This indicates that larger nanopores contribute significantly more pore volume than smaller nanopores. Among the eight coal samples, the incremental pore volumes of the four coal samples (N13-10-1, N13-10-2, N13-10-3, and N13-10-4) from the 10# coal seam were smaller than those from the 11# coal seam (N13-11-5, N13-11-6, N13-11-7, and N13-11-8).
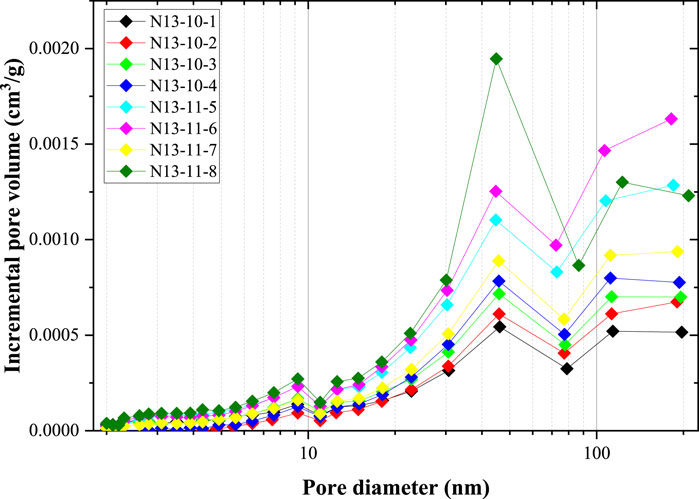
Figure 4. Pore size distribution of the eight coal samples obtained from the N2 adsorption experiment.
The pore surface area distribution is illustrated in Figure 5. These data were calculated using the BJH model and N2 adsorption data. Comparing Figures 4, 5, the pore surface area distribution curves significantly differed from the pore volume size distribution. Because the pore surface area of smaller nanopores is much larger than that of larger nanopores of the same volume, pores smaller than 10 nm contributed to a large proportion of the total pore surface area. In addition, there were peaks in the pore surface area curves located at 30–50 nm, indicating that the large nanopores contributed significantly to the pore surface area. Similar to the pore volume size distribution, the pore surface area at each pore size of the coal samples from the 11# coal seam was larger than that of the 10# coal seam.
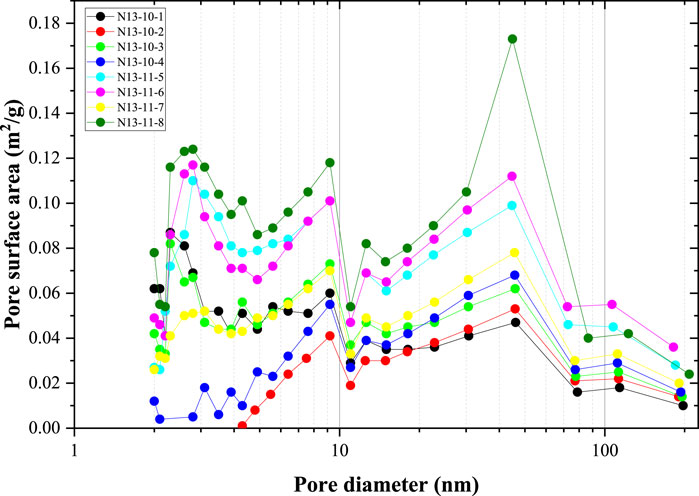
Figure 5. Pore surface area distribution of the coal samples.
3.3 Experimental data of high-pressure methane adsorption
Methane adsorption data are shown in Figure 6. The lines in Figure 6 show the fitting lines for the Langmuir adsorption equation. The fitting coefficient (R2) values were all approximately 0.99, indicating that the methane adsorption behavior of these coal samples agreed with the Langmuir adsorption model. Generally, the incremental amount in methane adsorption capacity increased with increasing pressure. In the low-pressure stage (<3 MPa), methane adsorption increased quickly. However, in the high-pressure stage, the amount of methane adsorbed increases slightly with increasing pressure. The coal sample N13-10-1 exhibited the largest amount of methane adsorption at each pressure. The methane adsorption capacity of sample N13-11-6 was the lowest.
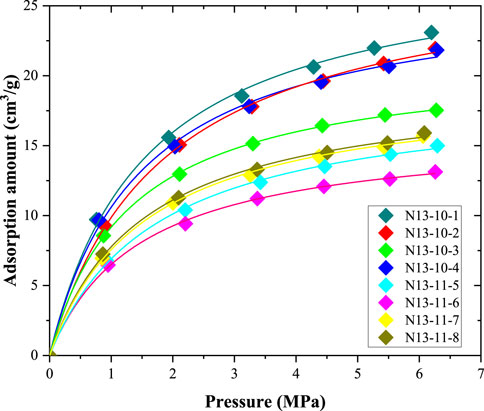
Figure 6. Methane isothermal data of the coal samples (30°C).
4 Discussion
4.1 Nanopore and micro-scale pores in coal
Previous studies identified different types of pores in coal (Laubach et al., 1998; Mastalerz et al., 2012; Okolo et al., 2015; Liu et al., 2017). In terms of pore size, coal pores can be divided into micropores (<2 nm), mesopores (2–50 nm), macropores (>50 nm), fractures, and cleats (Okolo et al., 2015; Zou et al., 2016). Pores in coal can be divided into organic and inorganic pores (clay pores, pyrite pores, etc.) (Liu et al., 2017). Mesopores and nanopores were rare, as illustrated in Figure 4. The pore volume of the 2–300 nm pores in the coal samples, as obtained from the N2 adsorption experiment, was less than 0.01 cm3/g, which is relatively low (Wang et al., 2022). A previous study found that organic matter can provide many micropores, which are the primary sites for methane adsorption (Liu et al., 2021). Thus, the methane adsorption capacity increased with increasing organic matter content in coal.
Figure 7 shows the correlation between the pore volume obtained from the N2 adsorption experiment and ash yield. With increasing ash yield, the pore volume (2–300 nm pores) of the coal samples increased linearly. This means that minerals have a positive effect on the generation of 2–300 nm pores. SEM observations revealed small amounts of organic pores in the coal samples. Although some organic pores were observed, they appeared to be isolated. In the N2 adsorption experiments, the tested pores were connected to the outside environment. In addition, although some methane molecules may be present in the isolated pores, they are not transported to the coalbed methane wells because there are no transport tunnels for these molecules. Some inorganic pores were observed in the SEM images. As shown in Figure 8, some organic pores were formed by pyrites, and some inorganic pores were formed between the inorganic particles.
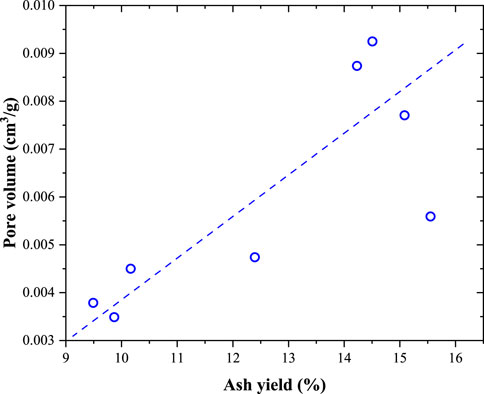
Figure 7. Correlation between pore volume obtained by the N2 adsorption experiment and ash yield.
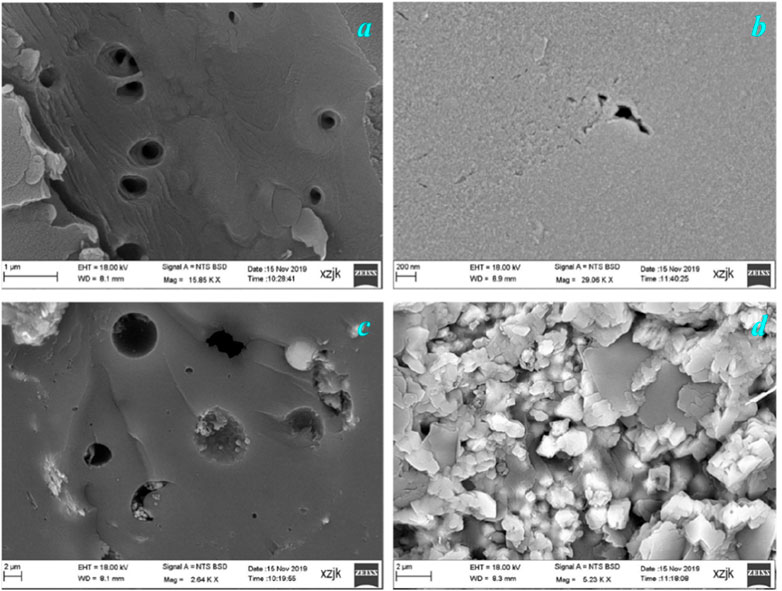
Figure 8. Pores in coal sample imaged by the SEM experiment. (A) Organic pores (N13-10-1 coal sample), (B) organic pores (N13-10-4 coal sample), (C) organic and inorganic pores formed by pyrite minerals (N13-10-1 coal sample), and (D) inorganic pores (N13-10-3 coal sample).
4.2 Key factors controlling the methane adsorption capacity of coal
The methane adsorption capacity of coal is controlled by different factors, as suggested in previous studies (Bustin and Clarkson, 1998; Laxminarayana and Crosdale, 1999; Laxminarayana and Crosdale, 2002). During coalification, the methane adsorption capacities of coal samples first increase and then decrease (moisture-equipped coal samples) (Zhong, 2004). In addition, the ash yield, maceral composition, and pore structure are important factors affecting the methane adsorption capacity (Bustin and Clarkson, 1998; Laxminarayana and Crosdale, 1999; Laxminarayana and Crosdale, 2002). In this study, because the coal samples were collected from the drilling core, the maturity of all the samples was similar (Table 1). Thus, it is necessary to investigate other factors that control the methane adsorption capacity. Figure 9 shows the correlation between the Langmuir volume and ash yield. With increasing ash yield, the Langmuir volume decreased linearly. This indicates that the methane adsorption capacity of the minerals in the coal was very low. These minerals contributed little to the total methane adsorption. Previous studies found that clay minerals in coal have methane adsorption capacities. In most previous studies, the minerals in coal decreased the methane adsorption amount (Laxminarayana and Crosdale, 1999).
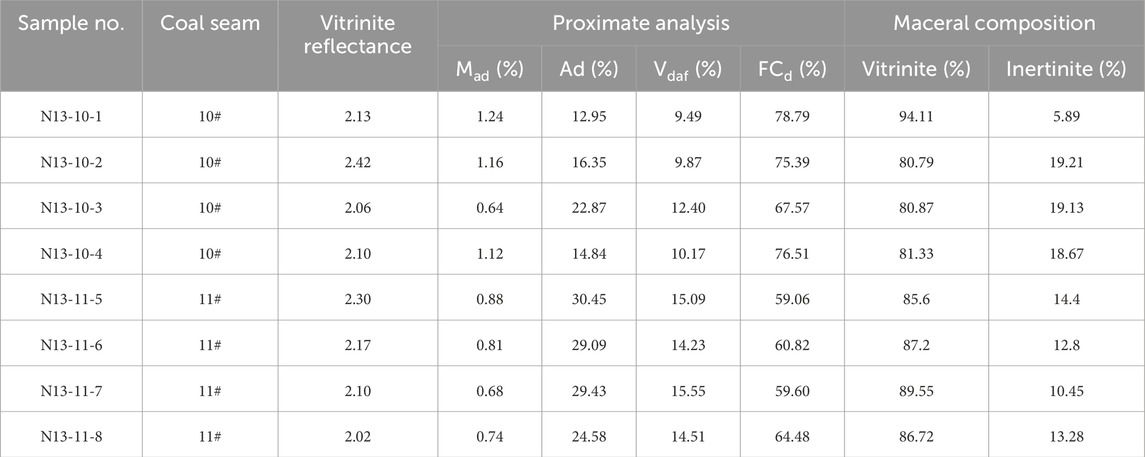
Table 1. Properties of the coal samples.
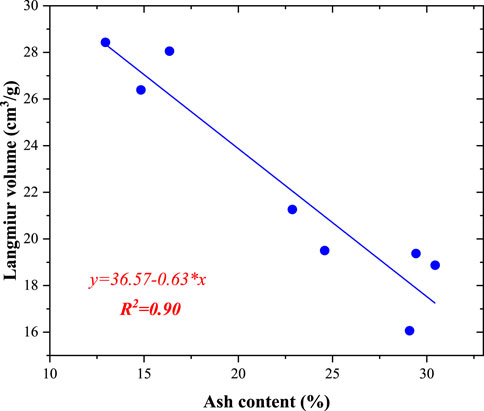
Figure 9. Correlation between the methane adsorption capacity (Langmuir volume) and ash yield.
As illustrated in Figure 10, the relationship between the Langmuir volume and BET surface area (obtained from the N2 adsorption experiment) of these coal samples was not very obvious. Overall, the Langmuir volume decreases with increasing BET surface area. A similar correlation was also found in Figure 11, where the correlation between the Langmuir volume and pore volume was obtained from the N2 adsorption amount. With an increase in the volume of the 2–300 nm pores, the methane adsorption capacity decreased. The BET surface area and pore volume obtained from the low-pressure N2 adsorption experiment were contributed by 2–300 nm pores. However, the number of 2–300 nm pores (obtained from the N2 adsorption experiment) in the coal samples was very low. In addition, micropores (<2 nm) mainly contributed to the total pore surface area of the coal samples. Methane molecules were mainly adsorbed in the micropores because adsorption was caused by the interaction forces between the methane molecules and the coal surface. These mesopores have a weak effect on the methane adsorption capacity. The 2–300 nm pores in coal were mainly contributed by minerals, and as the mineral content increased, the pore volume increased. Comparably, the methane adsorption capacity was mainly contributed by organic matter and decreased with increasing mineral content.
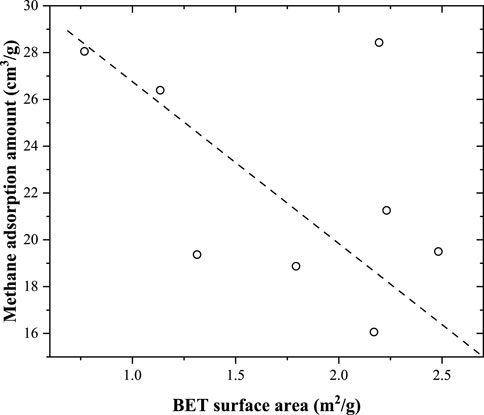
Figure 10. Relationship between the methane adsorption capacity (Langmuir volume) and BET surface area obtained from the N2 adsorption experiment.
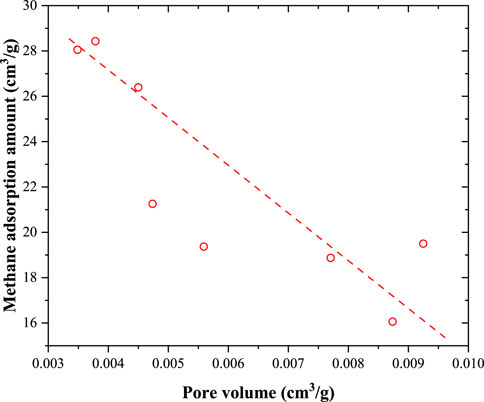
Figure 11. Correlation between Langmuir volume and pore volume obtained from the N2 adsorption amount.
Considering that minerals have a significant effect on the methane adsorption capacity, the methane adsorption capacity on an ash-free basis was calculated (Equation 1). With increasing volatile matter content, both the Langmuir volume and ash-free Langmuir volume decreased. When the influence of minerals was removed, volatile matter had a negative effect on the methane adsorption capacity. There may be several reasons why the methane adsorption capacity decreased with increasing volatile matter content. During this stage (anthracite coal), micropores were formed between the aromatic rings, and a lower volatile matter content indicated more aromatic rings (Liu et al., 2021). During the volatile matter test, some minerals generated gas. In addition, volatile matter was produced during mineral catalysis. Thus, more minerals resulted in more volatile matter. Considering that minerals have a negative effect on methane adsorption capacity, the Langmuir volume decreased with increasing volatile matter (Figure 12). We also compared the methane adsorption capacities of different maceral compositions and found that the maceral composition had a weak effect on the methane adsorption capacity of the coal samples. This is mainly because the maturities of the coal samples are relatively high (Ro>2.0%), and the structure of vitrinite is similar to that of inertinite.
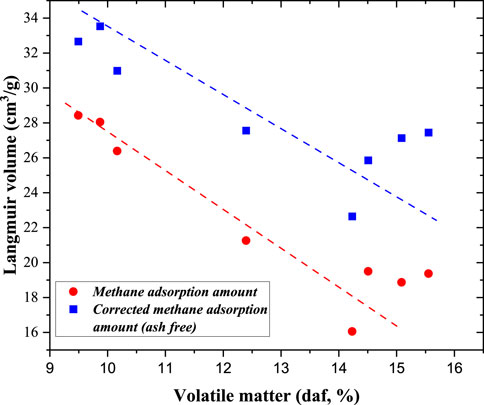
Figure 12. Correlation between the volatile matter and methane adsorption capacity.
Here, Vaf represents the methane adsorption capacity (Langmuir volume) on an ash-free basis; V represents the Langmuir volume obtained from isothermal methane experiment; and Ad represents the ash yield.
4.3 Effects of the pore system and adsorption capacity on coalbed methane extraction
The coal samples in this study were all anthracite coal, and as shown in Figure 6, these samples had a strong methane adsorption capacity. Based on previous studies and the experimental data obtained in this study, anthracite has a strong methane adsorption capacity. This is one of the key reasons for the abundance of coalbed methane resources in anthracite coal samples. However, the mercury injection and the low-pressure N2 adsorption experiments showed that the volume and surface area of the mesopores and nanoscale macropores were quite low, indicating that there were few mesopores and nanoscale macropores in the anthracite coals. Based on the SEM observations, a similar conclusion was drawn; mesopores and macropores were found on the surface of the coal matrix. In addition, as the volume of mesopores and nanoscale macropores increased with the mineral content, inorganic pores occupied a significant proportion of the total mesopores and nanoscale macropores. This means that the organic matter in coal rarely forms mesopores or nanoscale macropores. In addition, the mesopores and nanopores contributed little to the total amount of methane adsorbed because they could not provide many adsorption sites. Comparably, methane molecules in anthracite are mainly stored in micropores (Cheng et al., 2017; Liu et al., 2021). These micropores are primarily formed by coal molecules (Liu et al., 2018).
Based on mercury injection, low-pressure N2 adsorption, SEM observations, and methane isothermal adsorption experimental data, the pore system of anthracite coals was clarified (Figure 13). The pore system of anthracite can be divided into three parts. The size and formation mechanisms of the different parts are different. The first part consisted of micropores. Because these pores are formed by coal molecules, micropores are universally developed in the coal matrix (Cheng et al., 2017; Liu et al., 2021). Thus, numerous micropores are present in anthracite coal (Liu et al., 2018). These pores provide a large space and surface area for methane adsorption, and anthracite coals have a large methane adsorption capacity, as illustrated by the methane isothermal adsorption data (Figure 6). The second part comprised mesopores and nanoscale macropores. The volumes and surface areas of these pores were quite low. Additionally, a large proportion of these pores were inorganic. The third part comprised cleats and fractures. The sizes of these parts were on the micro-meter scale. These pores can form during coalification and tectonic movements (Laubach et al., 1998; Cheng and Pan, 2020). There were a certain number of cleats and fractures in the coal samples used in this study, as indicated by the mercury injection data.
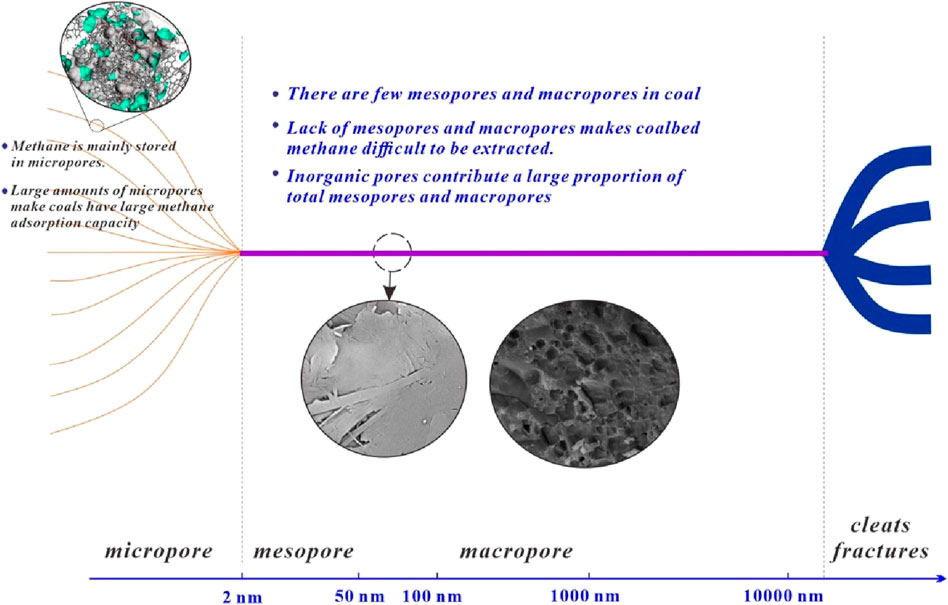
Figure 13. Pore system and the effect on coalbed methane extraction in anthracite coals.
It should be noted that most of the methane molecules are stored in micropores, and when these methane molecules are transported outside the coal, they usually need to be transported through mesopores and macropores and then to fractures and cleats. Only a small number of micropores are directly connected to the fractures and cleats in the coal. However, there were a few mesopores and nanoscale macropores. This means that there are insufficient tunnels to transport methane molecules from the micropores to the cleats and fractures. This makes the extraction of coalbed methane difficult. In the exploitation of coalbed methane, it is important to create tunnels to facilitate the transport of methane molecules from micropores to cleats and fractures. The pore structure and methane adsorption characteristics of anthracite coal observed in this study are common features of anthracite (Markowski, 1998; Adsul et al., 2023). Anthracite from other regions of the world also exhibits similar characteristics, such as well-developed micropores, a lack of nanoscale pores, and strong adsorption capacity, but a shortage of nanoscale migration pathways (Mohanty and Pal, 2017). Therefore, these findings can be universally applied to research on coalbed methane extraction from anthracite.
5 Conclusion
(1) Different types of pore characterization methods (low-pressure N2 adsorption, mercury injection experiment, and SEM observation) showed that there were few mesopores and nanoscale macropores in the eight anthracite coal samples from the Anzenan coalbed methane block in the Qinshui Basin, China.
(2) The volume of 2–300 nm pores in the eight anthracite coal samples increased with increasing ash yield, indicating that the organic matter of anthracite coal rarely formed pores on this scale.
(3) The anthracite coal had a large methane adsorption capacity, and the Langmuir volume increased with decreasing ash yield, indicating that the methane molecules were mainly adsorbed in the micropores of the organic matter in the coal. Considering that the coal samples are typical anthracite, these findings are also applicable to other anthracite coals worldwide. Therefore, creating pore connectivity pathways is crucial for the extraction of coalbed methane from anthracite coal globally.
Data availability statement
The original contributions presented in the study are included in the article/supplementary material; further inquiries can be directed to the corresponding authors.
Author contributions
QX: conceptualization, data curation, formal analysis, funding acquisition, investigation, methodology, project administration, resources, software, supervision, validation, visualization, writing–original draft, and writing–review and editing. RW: methodology, investigation, supervision, and writing–review and editing. ZW: methodology, conceptualization, data curation, formal analysis, project administration, resources, and writing–original draft. YZ: conceptualization, data curation, formal analysis, funding acquisition, investigation, methodology, project administration, resources, software, supervision, validation, visualization, and writing–original draft. QM: conceptualization, data curation, formal analysis, investigation, validation, visualization, and writing–original draft. ZZ: data curation, investigation, methodology, supervision, and writing–review and editing. XB: data curation, formal analysis, investigation, methodology, and writing–original draft. FX: data curation, investigation, methodology, validation, visualization, and writing–original draft.
Funding
The author(s) declare that financial support was received for the research, authorship, and/or publication of this article. This work was supported by the corporate Scientific Research Project [LGP FH-02 (ZJ) 2206007] and Research and Application of Key Technologies for the Integration of Exploration and Development of Deep Coalbed Methane in the Yushe–Wuxiang Block, Shanxi Province.
Conflict of interest
Author ZW was employed by PetroChina Coalbed Methane Company Limited. Author FX was employed by Shaanxi Tiancheng Petroleum Technology Company Limited.
The remaining authors declare that the research was conducted in the absence of any commercial or financial relationships that could be construed as a potential conflict of interest.
Publisher’s note
All claims expressed in this article are solely those of the authors and do not necessarily represent those of their affiliated organizations, or those of the publisher, the editors, and the reviewers. Any product that may be evaluated in this article, or claim that may be made by its manufacturer, is not guaranteed or endorsed by the publisher.
References
Adesida, A. G., Akkutlu, I. Y., Resasco, D. E., and Rai, C. S. (2011). “Kerogen pore size distribution of Barnett shale using DFT analysis and Monte Carlo simulations[C],” in SPE annual technical conference and exhibition. SPE: spe-147397-MS.
Adsul, T., Ghosh, S., Kumar, S., Tiwari, B., Dutta, S., and Varma, A. K. (2023). Biogeochemical controls on methane generation: a review on Indian coal resources. Minerals 13 (5), 695. doi:10.3390/min13050695
Akhondzadeh, H., Keshavarz, A., Awan, F. U. R., Ali, M., Al-Yaseri, A., Liu, C., et al. (2021). Liquid nitrogen fracturing efficiency as a function of coal rank: a multi-scale tomographic study. J. Nat. gas Sci. Eng. 95, 104177. doi:10.1016/j.jngse.2021.104177
Bustin, A. M. M., Bustin, R. M., Chikatamarla, L., Downey, R., and Mansoori, J. (2016). Learnings from a failed nitrogen enhanced coalbed methane pilot: piceance Basin, Colorado. Int. J. Coal Geol. 165, 64–75. doi:10.1016/j.coal.2016.07.010
Bustin, R. M., and Clarkson, C. R. (1998). Geological controls on coalbed methane reservoir capacity and gas content. Int. J. Coal Geol. 38 (1), 3–26. doi:10.1016/s0166-5162(98)00030-5
Cai, Y., Liu, D., Pan, Z., Yao, Y., Li, J., and Qiu, Y. (2013). Pore structure and its impact on CH4 adsorption capacity and flow capability of bituminous and subbituminous coals from Northeast China. Fuel 103, 258–268. doi:10.1016/j.fuel.2012.06.055
Cai, Y., Liu, D., Yao, Y., Li, J., and Qiu, Y. (2011). Geological controls on prediction of coalbed methane of No. 3 coal seam in Southern Qinshui Basin, North China. Int. J. Coal Geol. 88 (2-3), 101–112. doi:10.1016/j.coal.2011.08.009
Chalmers, G. R. L., and Marc Bustin, R. (2007). On the effects of petrographic composition on coalbed methane sorption. Int. J. Coal Geol. 69 (4), 288–304. doi:10.1016/j.coal.2006.06.002
Chattaraj, S., Mohanty, D., Kumar, T., and Halder, G. (2016). Thermodynamics, kinetics and modeling of sorption behaviour of coalbed methane – a review. J. Unconv. Oil Gas Resour. 16, 14–33. doi:10.1016/j.juogr.2016.09.001
Cheng, Y., Jiang, H., Zhang, X., Cui, J., Song, C., and Li, X. (2017). Effects of coal rank on physicochemical properties of coal and on methane adsorption. Int. J. Coal Sci. & Technol. 4 (2), 129–146. doi:10.1007/s40789-017-0161-6
Cheng, Y., and Pan, Z. (2020). Reservoir properties of Chinese tectonic coal: a review. Fuel 260, 116350. doi:10.1016/j.fuel.2019.116350
Cho, S., Kim, S., and Kim, J. (2019). Life-cycle energy, cost, and CO2 emission of CO2-enhanced coalbed methane (ECBM) recovery framework. J. Nat. Gas Sci. Eng. 70, 102953. doi:10.1016/j.jngse.2019.102953
Clarkson, C. R., Solano, N., Bustin, R., Bustin, A., Chalmers, G., He, L., et al. (2013). Pore structure characterization of North American shale gas reservoirs using USANS/SANS, gas adsorption, and mercury intrusion. Fuel 103, 606–616. doi:10.1016/j.fuel.2012.06.119
Crosdale, P. J., Beamish, B. B., and Valix, M. (1998). Coalbed methane sorption related to coal composition. Int. J. COAL Geol. 35 (1-4), 147–158. doi:10.1016/s0166-5162(97)00015-3
Fan, C., Elsworth, D., Li, S., Chen, Z., Luo, M., Song, Y., et al. (2019). Modelling and optimization of enhanced coalbed methane recovery using CO2/N2 mixtures. Fuel 253, 1114–1129. doi:10.1016/j.fuel.2019.04.158
Guan, M., Liu, X., Jin, Z., and Lai, J. (2020). The heterogeneity of pore structure in lacustrine shales: insights from multifractal analysis using N2 adsorption and mercury intrusion. Mar. Petroleum Geol. 114, 104150. doi:10.1016/j.marpetgeo.2019.104150
Hou, X., Liu, S., Zhu, Y., and Yang, Y. (2020). Evaluation of gas contents for a multi-seam deep coalbed methane reservoir and their geological controls: in situ direct method versus indirect method. Fuel 265, 116917. doi:10.1016/j.fuel.2019.116917
Hu, B., Cheng, Y., He, X., Wang, Z., Jiang, Z., Wang, C., et al. (2020). New insights into the CH4 adsorption capacity of coal based on microscopic pore properties. FUEL 262 (UNSP 116675), 116675. doi:10.1016/j.fuel.2019.116675
Joshi, D., Prajapati, P., Sharma, P., and Sharma, A. (2023). Past, present and future of Coal Bed Methane (CBM): a review with special focus on the Indian scenario. Int. J. Coal Prep. Util. 43 (2), 377–402. doi:10.1080/19392699.2022.2051014
Laubach, S. E., Marrett, R. A., Olson, J. E., and Scott, A. R. (1998). Characteristics and origins of coal cleat: a review. Int. J. Coal Geol. 35 (1–4), 175–207. doi:10.1016/s0166-5162(97)00012-8
Laxminarayana, C., and Crosdale, P. J. (1999). Role of coal type and rank on methane sorption characteristics of Bowen Basin, Australia coals. Int. J. Coal Geol. 40 (4), 309–325. doi:10.1016/s0166-5162(99)00005-1
Laxminarayana, C., and Crosdale, P. J. (2002). Controls on methane sorption capacity of Indian coals. AAPG Bull. 86 (2), 201. doi:10.1306/61eeda8a-173e-11d7-8645000102c1865d
Li, F., Jiang, B., Cheng, G., and Song, Y. (2022). Methane adsorption behavior and energy variations of brittle tectonically deformed coal under high temperature and high pressure. ACS Omega 7 (3), 2737–2751. doi:10.1021/acsomega.1c05383
Li, Y., Song, D., Liu, S., Ji, X., and Hao, H. (2021). Evaluation of pore properties in coal through compressibility correction based on mercury intrusion porosimetry: a practical approach. Fuel 291, 120130. doi:10.1016/j.fuel.2021.120130
Li, Y., Yang, J., Pan, Z., and Tong, W. (2020). Nanoscale pore structure and mechanical property analysis of coal: an insight combining AFM and SEM images. Fuel Guildf. 260, 116352. doi:10.1016/j.fuel.2019.116352
Liu, S., Sang, S., Wang, G., Ma, J., Wang, X., Wang, W., et al. (2017). FIB-SEM and X-ray CT characterization of interconnected pores in high-rank coal formed from regional metamorphism. J. Petroleum Sci. Eng. 148, 21–31. doi:10.1016/j.petrol.2016.10.006
Liu, Y., Zhang, C., and Zhang, Y. (2021). Evolution mechanism of methane adsorption capacity in vitrinite-rich coal during coalification. J. Nat. Gas Sci. Eng. 96, 104307. doi:10.1016/j.jngse.2021.104307
Liu, Y., Zhu, Y., Liu, S., Chen, S., Li, W., and Wang, Y. (2018). Molecular structure controls on micropore evolution in coal vitrinite during coalification. Int. J. Coal Geol. 199, 19–30. doi:10.1016/j.coal.2018.09.012
Lorenz, K., and Wessling, M. (2013). How to determine the correct sample volume by gravimetric sorption measurements. Adsorption 19 (6), 1117–1125. doi:10.1007/s10450-013-9537-0
Markowski, A. K. (1998). Coalbed methane resource potential and current prospects in Pennsylvania. Int. J. Coal Geol. 38 (1-2), 137–159. doi:10.1016/s0166-5162(98)00036-6
Mastalerz, M., He, L., Melnichenko, Y. B., and Rupp, J. A. (2012). Porosity of coal and shale: insights from gas adsorption and SANS/USANS techniques. Energy & Fuels 26 (8), 5109–5120. doi:10.1021/ef300735t
Meng, Z., Yan, J., and Li, G. (2017). Controls on gas content and carbon isotopic abundance of methane in qinnan-east coal bed methane block, Qinshui Basin, China. Energy & Fuels 31 (2), 1502–1511. doi:10.1021/acs.energyfuels.6b03172
Mohamed, T., and Mehana, M. (2020). Coalbed methane characterization and modeling: review and outlook. Energy Sources, Part A Recovery, Util. Environ. Eff., 1–23. doi:10.1080/15567036.2020.1845877
Mohanty, M. M., and Pal, B. K. (2017). Sorption behavior of coal for implication in coal bed methane an overview. Int. J. Min. Sci. Technol. 27 (2), 307–314. doi:10.1016/j.ijmst.2017.01.014
Moore, T. A. (2012). Coalbed methane: a review. Int. J. Coal Geol. 101, 36–81. doi:10.1016/j.coal.2012.05.011
Nie, B., Liu, X., Yang, L., Meng, J., and Li, X. (2015). Pore structure characterization of different rank coals using gas adsorption and scanning electron microscopy. Fuel 158, 908–917. doi:10.1016/j.fuel.2015.06.050
Okolo, G. N., Everson, R. C., Neomagus, H. W. J. P., Roberts, M. J., and Sakurovs, R. (2015). Comparing the porosity and surface areas of coal as measured by gas adsorption, mercury intrusion and SAXS techniques. Fuel 141, 293–304. doi:10.1016/j.fuel.2014.10.046
Peng, S., Zhang, T., Loucks, R. G., and Shultz, J. (2017). Application of mercury injection capillary pressure to mudrocks: conformance and compression corrections. Mar. Petroleum Geol. 88, 30–40. doi:10.1016/j.marpetgeo.2017.08.006
Perera, M. S. A., Ranjith, P. G., Choi, S. K., Airey, D., and Weniger, P., 2012. Estimation of gas adsorption capacity in coal: a review and an analytical study. Int. Journal of Coal Preparation and Utilization. 32(1): 25–55. doi:10.1080/19392699.2011.614298
Qin, Y., Moore, T. A., Shen, J., Yang, Z., Shen, Y., and Wang, G. (2018). Resources and geology of coalbed methane in China: a review. Int. Geol. Rev. 60 (5-6), 777–812. doi:10.1080/00206814.2017.1408034
Song, Y., Liu, S., Zhang, Q., Tao, M., Zhao, M., and Hong, F. (2012). Coalbed methane genesis, occurrence and accumulation in China. Petroleum Sci. 9 (3), 269–280. doi:10.1007/s12182-012-0209-6
Su, X., Lin, X., Liu, S., Zhao, M., and Song, Y. (2005). Geology of coalbed methane reservoirs in the southeast Qinshui Basin of China. Int. J. Coal Geol. 62 (4), 197–210. doi:10.1016/j.coal.2005.01.002
Tu, Q., Xue, S., Cheng, Y., Zhang, W., Shi, G., and Zhang, G. (2022). Experimental study on the guiding effect of tectonic coal for coal and gas outburst. Fuel 309, 122087. doi:10.1016/j.fuel.2021.122087
Wang, C., and Cheng, Y. (2023). Role of coal deformation energy in coal and gas outburst: a review. Fuel Guildf. 332, 126019. doi:10.1016/j.fuel.2022.126019
Wang, F., Cheng, Y., Lu, S., Jin, K., and Zhao, W. (2014). Influence of coalification on the pore characteristics of middle–high rank coal. Energy & Fuels 28 (9), 5729–5736. doi:10.1021/ef5014055
Wang, F., Yao, Y., Wen, Z., Sun, Q., and Yuan, X. (2020). Effect of water occurrences on methane adsorption capacity of coal: a comparison between bituminous coal and anthracite coal. Fuel 266, 117102. doi:10.1016/j.fuel.2020.117102
Wang, R., Gong, D., Leng, J., Wang, X., Cong, S., Ding, W., et al. (2017). Developmental characteristics of the Lower Cambrian Niutitang shale reservoir in Northern Guizhou area: a case study in the Cengong block. Earth Sci. Front. 24 (6), 286–299. doi:10.13745/j.esf.yx.2017-10-4
Wang, R., Hu, Z., Dong, L., Gao, B., Sun, C., Yang, T., et al. (2021). Advancement and trends of shale gas reservoir characterization and evaluation. Oil & Gas Geol. 42 (1), 54–65. doi:10.11743/ogg20210105
Wang, R., Hu, Z., and Long, S. (2022). Reservoir characteristics and evolution mechanisms of the upper ordovician wufeng-lower silurian longmaxi shale, Sichuan basin. Oil & Gas Geol. 43 (2), 353–364. doi:10.11743/ogg20220209
Wang, R., Hu, Z., and Nie, H., Comparative analysis and discussion of shale reservoir characteristics in the Wufeng–Longmaxi and Niutitang formations: a case study of the well JY1 in SE Sichuan Basin and well TX1 in SE Guizhou area. 2018b, 40 (5) 639–649.
Wang, R., Hu, Z., Sun, C., Liu, Z., Zhang, C., Gao, B., et al. (2018a). Comparative analysis of shale reservoir characteristics in the Wufeng-Longmaxi (O3w-S1l) and Niutitang (Є1n) Formations: a case study of wells JY1 and TX1 in the southeastern Sichuan Basin and its neighboring areas, southwestern China. Interpretation 6 (4), SN31–SN45. doi:10.1190/int-2018-0024.1
Yan, J., Meng, Z., Zhang, K., Yao, H., and Hao, H. (2020). Pore distribution characteristics of various rank coals matrix and their influences on gas adsorption. J. Petroleum Sci. Eng. 189, 107041. doi:10.1016/j.petrol.2020.107041
Yu, S., Bo, J., Ming, L., Chenliang, H., and Shaochun, X. (2020). A review on pore-fractures in tectonically deformed coals. Fuel 278, 118248. doi:10.1016/j.fuel.2020.118248
Zhang, L., Aziz, N., Ren, T. X., and Wang, Z. (2011). Influence of temperature on coal sorption characteristics and the theory of coal surface free energy. Procedia Eng. 26, 1430–1439. doi:10.1016/j.proeng.2011.11.2320
Zhao, J., Xu, H., Tang, D., Mathews, J. P., Li, S., and Tao, S. (2016). A comparative evaluation of coal specific surface area by CO2 and N2 adsorption and its influence on CH4 adsorption capacity at different pore sizes. Fuel 183, 420–431. doi:10.1016/j.fuel.2016.06.076
Zhong, L. (2004). Adsorptive capacity of coals and its af fecting factors. Earth Sci. 29 (03), 327–332+368.
Zhong, L., and Zhang, X. (1990). The relationship between methane adsorption capacity and the rank and composition of coal. Coal Geol. & Explor. (04), 29–36+71-74.
Zou, G., She, J., Peng, S., Yin, Q., Liu, H., and Che, Y. (2020). Two-dimensional SEM image-based analysis of coal porosity and its pore structure. Int. J. Coal Sci. & Technol. 7, 350–361. doi:10.1007/s40789-020-00301-8
Keywords: anthracite coal, coalbed methane, pore system, methane adsorption capacity, ash yield
Citation: Xu Q, Wang R, Wang Z, Zhao Y, Miao Q, Zhang Z, Bai X and Xinxin F (2024) Nanoscale pore structure in anthracite coals and its effect on methane adsorption capacity. Front. Earth Sci. 12:1413069. doi: 10.3389/feart.2024.1413069
Received: 06 April 2024; Accepted: 29 July 2024;
Published: 13 August 2024.
Edited by:
Ebrahim Fathi, West Virginia University, United StatesReviewed by:
Qian Zhang, Peking University, ChinaFengli Li, Suzhou University, China
Haoze Li, China University of Mining and Technology, China
Copyright © 2024 Xu, Wang, Wang, Zhao, Miao, Zhang, Bai and Xinxin. This is an open-access article distributed under the terms of the Creative Commons Attribution License (CC BY). The use, distribution or reproduction in other forums is permitted, provided the original author(s) and the copyright owner(s) are credited and that the original publication in this journal is cited, in accordance with accepted academic practice. No use, distribution or reproduction is permitted which does not comply with these terms.
*Correspondence: Ruyue Wang, d3J5MTk5MEB2aXAucXEuY29t; Zhengguang Zhang, emhlbmdndWFuZzA0MTFAMTYzLmNvbQ==