- 1Department of Geological and Surveying Engineering, Shanxi Institute of Energy, China
- 2College of Geoscience and Surveying Engineering, China University of Mining and Technology, Beijing, China
To gain insights into the spectroscopy characteristics from coal to graphite, we investigated different metamorphic degrees of coal-based graphite which were collected from Hunan Province China. In this paper, by means of X-ray diffraction (XRD), scanning electron microscopy (SEM), Fourier transform infrared spectroscopy (FTIR), and Raman spectroscopy, graphite with different metamorphism degrees has been characterized to explore the evolution of macromolecular structure of organic matter during graphitization. The results show that with the increase of metamorphism degree, the 002-diffraction peak of the series of samples gradually shrinks and narrows, and the peak intensity becomes stronger, indicating that the microcrystalline structure gradually becomes regular and ordered. As the degree of graphitization increase, the uniformity of particle size in coal samples observed gradually increases, and the morphology becomes more regular, transitioning from disordered and irregular shapes to a structured large-scale flake pattern. The crystallinity improves, and the massive coal particles gradually coalesce into large plate crystals, with the inter-particle pores gradually closing. The graphite structure becomes increasingly evident. The FTIR spectra show that as the degree of graphitization increases, the peak at 1,581 cm−1 corresponding to C=C vibrations gradually intensifies. Some inert functional groups are retained throughout the graphitization process. The pores between coal particles gradually close, and the morphology of graphite particles becomes more regular and ordered. Additionally, during the graphitization process, structures similar to carbon nanotubes may develop. Throughout the structural transformation from coal macromolecules to graphite crystals, the size of the sp2 planar domains in single-layer graphene increases, and the lattice structure of carbon atoms gradually enlarges. These findings contribute to a comprehensive understanding of the properties and characteristics of coal-derived graphite, and can provide theoretical reference and basis for the metallogenic mechanism of coal-derived graphite and the efficient utilization of coal.
1 Introduction
Graphite, one of the minerals of the element carbon monocular crystals, is the allotrope of carbon and the fullerene, carbon nanotube, and diamond (Cao et al., 2017; Wang et al., 2020; Chehreh Chelgani et al., 2016). The graphite crystal structure comprises carbon atomic layers arranged in a hexagonal ring network in parallel stacking, which are connected by van der Waals forces with 0.335 nm inter-layer spacing. The carbon atoms are hybridized into sp2 bonds in the graphite structure layer, and a delocalized Π bond was formed between layers. Thus, the layered structure and chemical bonding characteristics determine graphite’s physical and chemical properties (Gao et al., 2015; US Geological Survey, 2016). China is one of the few countries in the world with crystalline and cryptocrystalline graphite. With the advent of the carbon age, the development and utilization of graphite resources have gradually received attention from countries worldwide. Coal-based graphite, a kind of cryptocrystalline graphite, is the product of coal, which is experienced from the high metamorphic stage to the graphitization stage. However, there are few studies on the graphitization of coal, and it is not unclear research on the characterization of coal-based graphics, influencing factors of graphitization and the graphitization mechanism of coal. Thus, it is essential to study the characteristics of coal-based graphite and the graphitization of coal, which has important value for the rational development and efficient utilization of coal-based graphite (Olson et al., 2016; Day et al., 2016).
Contact metamorphic graphite is an important genetic type of graphite deposit formed by contact metamorphism of coal seam caused by magma intrusion. A contact metamorphic zone gradually changes from graphite to anthracite (Mo et al., 1989). The basic structure of coal units is composed of many groups with different thermal stability values, including carbon nuclei, side chains, and functional groups. Due to the effect of heat, thermal decomposition and polycondensation promote the hexagonal carbon atom planar network layer, which forms the basis of solid phase residue. Moreover, the side chain was broken and gas was released. A large amount of gas is generated, and the microcrystalline layers of coal are rearranged to become orderly, as revealed by the heating experiment of coal (Li et al., 2001).
Landis believed that the graphitization process was a gradual, continuous evolution related to the metamorphism degree of the surrounding rock. With the increase of the metamorphism degree, the crystallization degree of graphite gradually increased. Based on the results of X-ray diffraction, the structure can be ordered from high to low as follows: graphite (fully ordered graphite), D1-graphite (graphite-D1), d1A graphite (graphite-D1A), d2 graphite (graphite-D2), and d3 graphite (graphite-D3). During the evolution from coal to graphite, the nanostructural changes are relatively more complex than the microscopic structure changes revealed by maceral and X-ray diffraction (Buseck and Huang, 1985). Oberlin and Terriere (1975) studied the high-temperature graphitization process of anthracite using high-resolution transmission electron microscopy. When the temperature was <2,000°C, anthracite showed the characteristics of “hard carbon.” However, as the temperature gradually increased (>2,500°C), it began to show the characteristics of “soft carbon.” It is mainly manifested in the gradual flattening of pores formed by carbon layers, leading to the parallel arrangement of carbon layers and graphitization (Oberlin and Terriere, 1975). Deurbergue et al. studied the graphitization of North Korean anthracite using XRD and TEM. They concluded that the parameters derived from XRD represent an “average” value for the sample as a whole. In contrast, TEM allows for observing the heterogeneity in morphology and structure among samples with different degrees of graphitization (Deurbergue et al., 1987). There is a crust-like structure in the graphitization nanostructure of coal measures, proving that the graphitization of coal is a continuous evolution. Rantitsch discovered two carbon structures with different degrees of structural order in their study of the graphitization of East Alpine carbonaceous materials using HRTEM. One structure was circular, whereas the other was a polygonal structure composed of carbon layers with long-range order (Rantitsch et al., 2004). It can be seen from the above studies that there are few studies on the evolution process from high metamorphic anthracite to coal-measure graphite. There are more studies on the evolution characteristics of the low and middle coalification stages, but there are few studies on the evolution process and evolution characteristics of coal from the high metamorphism stage to the graphitization stage, which is not thorough enough to reveal the graphitization of coal.
Graphite and semi-graphite are the final products of the evolution of organic matter, which cannot be effectively divided with coal through traditional coal petrology. The Fourier transform infrared spectroscopy and Raman spectroscopy can reveal the internal vibration of molecules. The highly asymmetric vibrations of functional groups are infrared active, so the infrared bands of some strongly polar groups can be tested by Fourier transform infrared spectroscopy. The Raman active vibration is generated under the change of the laser-induced dipole moment. The symmetric vibration of some non-polar groups and carbon skeleton has a strong Raman band, so Raman spectroscopy is suitable for determining the molecular skeleton. Infrared and Raman spectroscopies can complement each other during the substance identification (Wen et al., 1989). Therefore, FTIR and Raman spectroscopies are used to characterize a series of meta-anthracite and coal-based graphite to explore the changes of coal macromolecules during the graphitization in this paper. It provides a theoretical basis for exploring and developing coal system graphite resources.
2 Geological setting of the study area
Lianyuan Basin, also known as Lianyuan Depression, is located in the north of Lianyuan Basin in Central Hunan Province, separated from Shaoyang Depression by the beaded uplift of Baimashan–Zushling–Longshan in the south of the depression, Xuefeng orogenic belt uplift in the west, Weishan uplift in the northeast, and Xiangxiang Low uplift in the east (Li, 2019). Lianyuan Depression is located in the middle of the Changshao fault depression in the South China fold system. From north to south, it mainly consists of spindle-shaped linear folds and fault-block coal-bearing syncline, and it is accompanied by overthrust faults. The fault structure is mainly compressive, and compressed-torsion reverse fault and thrust fault, followed by an arc fault. In addition, thrust nappe structure, bedding slip fold structure, klippe, structural window, and other structures are also very developed (Miao et al., 2016; Wang et al., 2016).
The Lianyuan Depression has a complete stratigraphic development, with outcrops of Proterozoic, Early Paleozoic, Late Paleozoic, and Mesozoic eras. The Proterozoic and Early Paleozoic strata are exposed in the uplifted or protruded belts around the depression. In contrast, the Late Paleozoic and Mesozoic strata are mainly distributed within the depression (Gong, 2018). The Lianyuan Depression is based on the Caledonian fold unconformity surface. Early Carboniferous-Late Permian coal-bearing strata were deposited, mainly dominated by the Ce Shui Formation, with the Long Tan Formation as a secondary component. The Ce Shui Formation is 100∼170 m thick, primarily consisting of lagoon bay clastic sediments with a small amount of carbonate deposits in the upper part; the Long Tan Formation is 22∼57 m thick, predominantly developed in the Dou Li Shan, En Kou, and Qiao Tou He mining areas, forming coastal clastic sediments, which have become the coal accumulation centers for the Long Tan Formation. The structural line distribution is NE-oriented, with wide and gentle synclines preserving many coal seams. The anticlines are narrower and incomplete due to the development of faults (Li et al., 2013).
There is a Tianlongshan rock mass, about 130 km2 in size, whose zircon U-Pb age is 196–210 Ma, belonging to the T3-J1 period in the research area (Mo et al., 2020). The Tianlongshan rock mass is mainly composed of granodiorite and monzonitic granite, showing bedrock formation. Contact metamorphism is evident with the surrounding rocks, featuring strong silicification and hornfels. A series of vein intrusions and captured limestone and slate bodies can be observed. Due to the thermal metamorphism caused by the intrusion, some of the No. 5 coal seam in the Hanpoao Depression Mine has been metamorphosed into graphite (Li, 2019). In the west wing of the Hanpoao syncline, the lower Carboniferous Ce Shui Formation is fully exposed. At the same time, the underlying strata of the coal-bearing formation have been eroded to varying degrees by Indosinian magmatic rocks. The existence of coal and rock mixing on the eastern flank of the syncline is a sign of an imbricate fan formed by a thrust fault (Yang and Dai, 2008). The dip angle of the syncline is steep, partially upright, and reversed, and the main coal seam of water-measuring coal measures close to magmatic rock mass and has been graphitized or partially graphitized.
3 Samples and methods
3.1 Sample collection
The samples are collected from Shengli mine (YP1), Xinhua Baichong mine (YP2), and Lengshuijiang mine (YP3, YP4, and YP5), respectively, among which the YP1, YP2, and YP3 are from the Carboniferous Ce Shui Formation, and the YP4 and YP5 are from the Upper Permian Leping Formation.
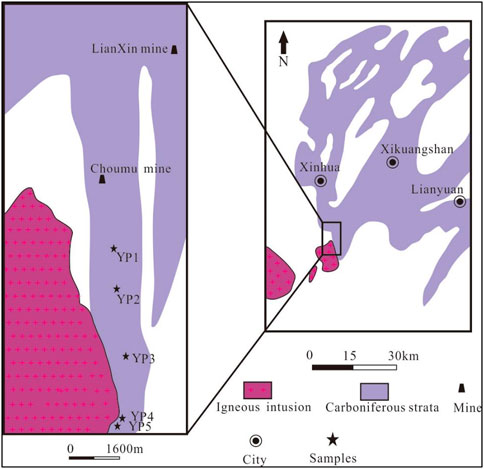
The samples were primarily collected from three coal mines within the Hanpo’ao mining area in the Lianyuan Basin, Hunan Province (Figure 1). These mines, listed from the farthest to the nearest from the Tianlongshan intrusion, are Shengli Coal Mine in Xinhua County (YP1), Baichong Mine in Xinhua (YP2), and Lengshuijiang (YP3, YP4, and YP5). Among these samples, YP1, YP2, and YP3 were sourced from the No. 3 coal seam of the Carboniferous system’s Ceshui formation, and YP4 and YP5 are from the Upper Permian Leping Formation. Most of the No. 3 coal seam is minable, with a thickness of 1.5–2.5 m. According to GB482-2008, sampling was systematically conducted based on the degree of metamorphism. Each sample required a mass of over 2 kg, maintaining as much of the block form as possible. After collection, the samples were sealed in plastic bags to avoid prolonged exposure to air, facilitating subsequent experiments. The coal samples were generally deep black with a metallic luster, exhibiting a stepped fracture, block structure, developed cleavage, and a wrinkled surface. The coal type was anthracite. In the laboratory, the coal samples were selected using the quartering method, ground with a mortar to 200 mesh, dried at 105°C, and then subjected to testing and characterization.
3.2 Methods
3.2.1 X-ray diffraction analysis
X-ray diffraction analysis was performed by D/MAX-2500PC automatic powder X-ray diffractometer (Rigaku Co. of Japan). Determination conditions are as follows: Cu target, voltage: 40 kV; current: 100 mA; scanning step width: 0.02°; slit system: DS=SS=1°, RS=0.3 mm; and scanning speed: 4°/min. The microcrystalline structure parameters are as follows: diameter of aromatic layers La and stacking height Lc are calculated by the Scherer formula: Dhkl=K λ/β cosθ (K: microcrystalline form factor, β is the half-high width of the diffraction peak, and θ is the Bragg angle of the corresponding peak) (Lu et al., 2001; Takagi et al., 2004; Kwiecińska and Petersen, 2004; Ernst et al., 1990).
3.2.2 FTIR spectroscopy analysis
The samples were prepared using the KBr compression technique, and the qualitative and functional group analyses were carried out using the Nicolet 6,700 Fourier transform infrared spectrometer. Test conditions are as follows: scanning times: 32, resolution: 4 cm−1, wavenumber range: 4,000∼400 cm−1, grating size: 100, and dynamic and static motion velocity: 0.6329 m/s.
3.2.3 Raman spectroscopy analysis
The Raman test was performed using the inVia laser Raman spectrometer produced by RENI SHAW, UK, with a laser wavelength of 514.5 nm, a power of 16 MW, a microscopic size range of ≤1 μm, and a spectral resolution of 1 cm−1. At room temperature, the detector was scanned from 100 to 3,200 cm−1 with a step size of 1 cm−1 and a monochromator slit width of 24 μm at the backscattering mode.
4 Results and discussion
4.1 Development of coal-based graphite crystalline
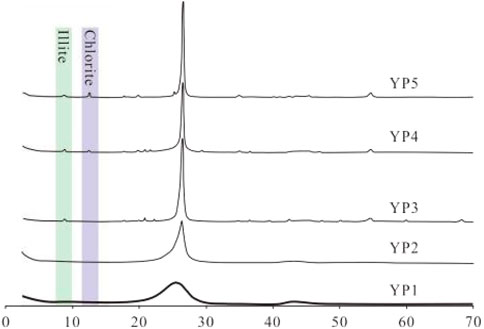
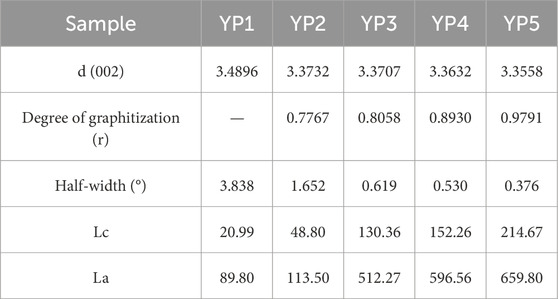
Figure 2 shows the X-ray diffraction pattern of samples with different graphitization degrees. Each sample has a clear diffraction peak at ∼25° (2θ), which is the 002-diffraction peak of coal/graphite. With the increase of the metamorphism degree, the 002-diffraction peak of the samples gradually shrinks and becomes narrower. The peak intensity becomes stronger, indicating that the microcrystalline structure in graphite gradually becomes regular and orderly. The FWHM of the peak 002 reflects the degree of graphite crystallization. The FWHM of the YP1 sample is 3.838°, whereas the FWHM of the YP5 sample has been reduced to 0.376°. The change of the intensity and sharpness of the diffraction peak reflected that the discontinuous polycyclic aromatic hydrocarbon structure changed to the regular lattice structure of graphite, which can also be confirmed by the microcrystalline structure parameters Lc and La in Table 2.
The different stages of the coal-to-graphite metamorphic process are defined by Kwiecinska and Petersen (2004): layer spacing of anthracite d002 > 3.38 nm, semi-graphite of d002 was between 3.37 and 3.38 nm, and graphite of d002 was between 3.354 and 3.37 nm (Kwiecińska and Petersen, 2004). Accordingly, YP1 samples are still classified into high metamorphism anthracite, YP2 and YP3 samples belong to semi-graphite, and YP4 and YP5 samples are classified into graphite. Graphitization degree r is a quantitative parameter (Ernst et al., 1990) describing the degree of carbon material close to perfect graphite, which is calculated by the formula r=(3.440-d002)/(3.440–3.354), in which 3.440 is the layer spacing of non-graphitic carbon, 3.354 is the layer spacing of ideal graphite single crystal, and d002 is the measured layer spacing of the substance (Qiao et al., 2011). The graphitization degree of the YP2 and YP3 (semi-graphite) samples is about 0.8, and the graphitization degrees of the YP4 and YP5 samples are 0.89 and 0.98, respectively. The graphitization degree of the YP1 sample is the lowest (Table 1).
The spectrogram of the YP1 sample shows a “bulge”-shaped diffraction peak at about 25°, characterized by the anthracite symbol (Bai et al., 2013). The 002 peak of the YP2 sample was asymmetric, which is a significant feature of the partial graphitization of coal. The 002 peak of the YP3 sample also shows a slight asymmetry, and there is a small peak at the low angle of the peak of 002, indicating that the sample contains some disordered structure. The number, intensity, and symmetry of hkl diffraction peaks of YP4 and YP5 samples increased, indicating that the graphite crystal structure was nearly three-dimensional.
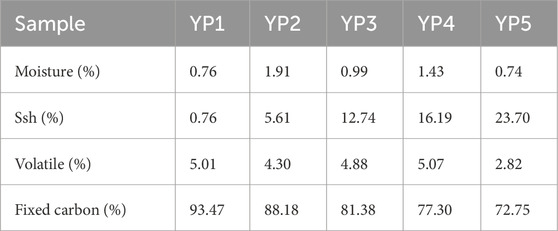
The spectra of YP4 and YP5 show that the samples contain minerals such as chlorite and illite but with low content according to the relative intensity of the peaks. Table 2 shows the samples’ moisture, ash, volatile, and carbon content calculated following GBT 3521–2008. The results show that the carbon contents of all samples are more than 70% and low content volatile, indicating that many different stable groups in the coal are dissociated during graphitization. In contrast, the stable aromatic carbon core components are retained. The relatively high ash content in the YP5 and YP4 samples is 23.7% and 16.2%, respectively. Some scholars believe that iron ions can play a catalytic role in the formation of graphite (Mo et al., 1989). However, there are still few studies on the effect of minerals in raw coal ash on graphitization.
4.2 Micromorphology of the different metamorphic degrees of samples
Figure 3 shows the SEM micromorphology of the series samples. For the YP1 sample in the metamorphic anthracite stage, the particles at high magnification show an amorphous form, whereas the particles at low magnification are lumpy. For the YP2 sample, some particles are graphite with irregular shapes and a certain degree of crimp at the high magnification, whereas a small number of flake crystals and pores are detected at the low magnification. There is a higher crystallization degree for the YP3 and YP4 samples, and both develop some needle-like structures similar to carbon nanotubes. The crystal particle size of the YP4 sample is relatively uniform and has a regular morphology. It has a developed lamellar structure and is linked into parallel layers with closed pores. For the YP5 sample, the graphite structure is already quite obvious with large particles, scale-like but slightly less regular than that of the YP4 sample.
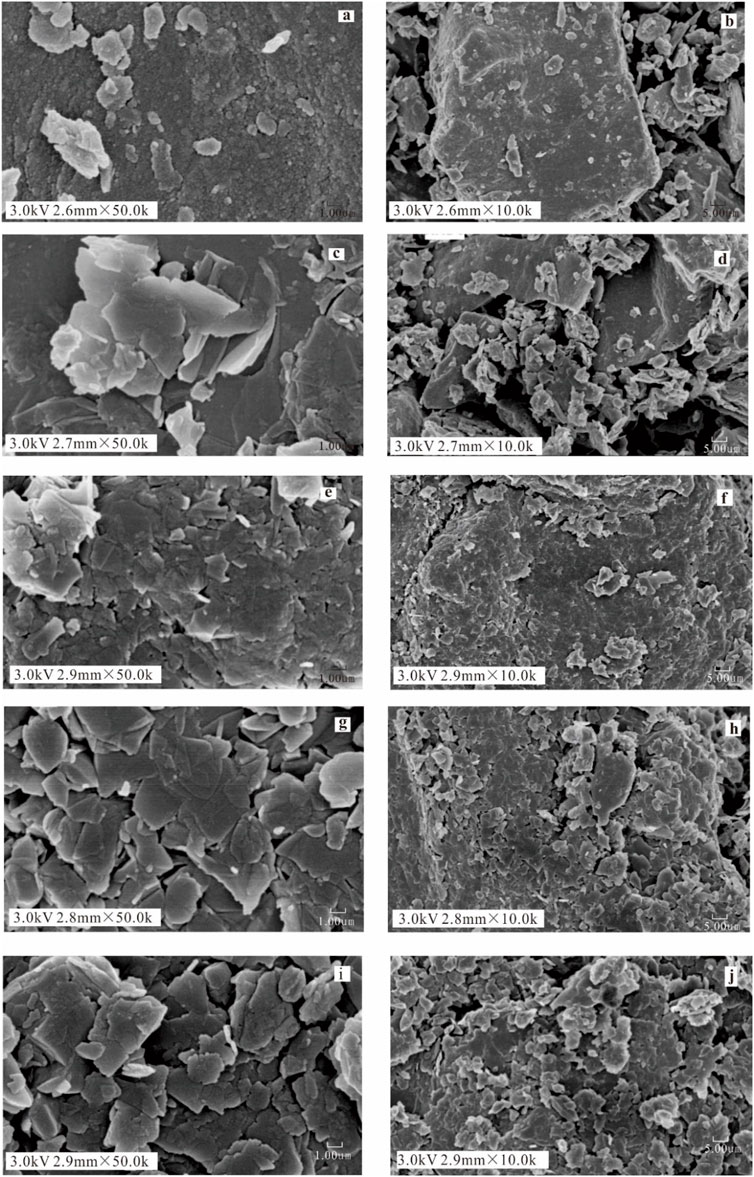
Figure 3. SEM images of different metamorphic grades of graphite, (A, B) YP1, (A, B) YP1, (C, D) YP2, (E, F) YP3, (G, H) YP4, and (I, J) YP5, with high magnification on the left and low magnification on the right.
4.3 Chemical differences of samples
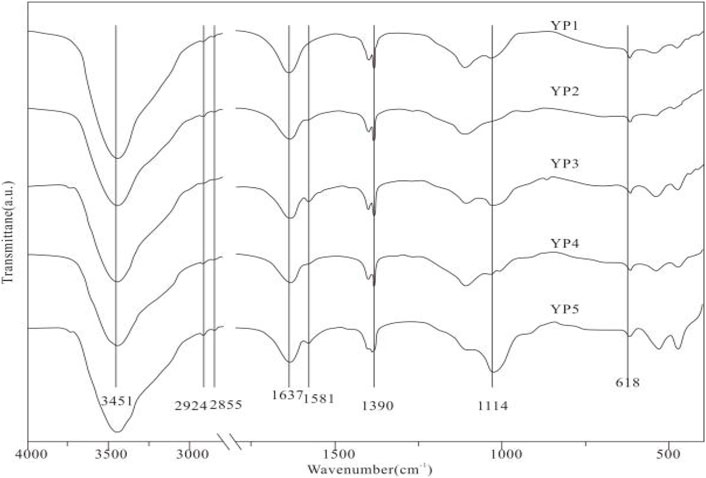
Three regions are mainly divided in the FTIR spectroscopy of the sample: 4,000–2,800 cm−1 (high wavenumber region), 1800–900 cm−1 (medium wavenumber region), and 900–400 cm−1 (low wavenumber region). The strong absorption peak at 3,451 cm−1 is the stretching vibration of OH in water molecules. On the one hand, water mixing is because, in the KBr pressing, the powder will inevitably absorb water in the air; on the other hand, it is also related to the increase of specific surface area and the enhancement of water absorption after the sample is ground. The two weak peaks of 2,924 cm−1 and 2,855 cm−1 are attributed to the asymmetric and symmetric stretching vibration of CH2, respectively (Qiao et al., 2011; Zhang and Xue, 1990; Alstadt et al., 2012; Wang and Han, 1999). The band of 1,637 cm−1 is assigned for the OH vibration of water molecules, and the band of 1,581 cm−1 is assigned for C=C vibration, which is the intrinsic absorption band of the graphite material (Wen et al., 2004). The bands of 1,406 cm−1 and 1,390 cm−1 are assigned for vibration of CH3, whereas bands of 1,275 cm−1 and 1,114 cm−1 are absorption of C-O in phenols, alcohols, ethers, and lipids correspondingly. The band of 1,031 cm−1 is assigned for the strong absorption of clay minerals in the sample (Friedel and Carlson, 1971). The three peaks of 618 cm−1, 539 cm−1, and 480 cm−1 in the low wavenumber region may be caused by the vibration of Al-O-Si groups in the ash meso-silicate rock (Alstadt et al., 2012).
The OH stretching vibration peak width of water molecules in the high wavenumber region is larger and slightly asymmetric, which may be related to the existence of an aromatic ring CH absorption band near 3,050 cm−1 (Alstadt et al., 2012). However, the vibration of the aromatic ring, the wide absorption band of water molecules, covers CH. Similarly, the OH bending vibration peak of water molecules also covered the vibration peak of C = C in the aromatic ring at 1,581 cm−1 to a certain extent (Figure 4). However, with the increase of the graphitization degree, the aromatization degree and the number of carbon atoms of the sp2 hybrid also increase, and the vibration peak is more obvious. The strongest infrared diffraction peak moves from 1,565 cm−1 to 1,587 cm−1 when the graphite particles become thinner. Similarly, Tuinstra and Koenig also found that through Raman spectroscopy (Wen et al., 2005). In addition, the weak absorption of CH2 stretching vibration indicates that a small amount of aliphatic hydrocarbon remains in the natural coal-based graphite. Furthermore, the C-O vibration peak shows that some stable oxygen-containing functional groups can be retained during graphitization.
4.4 Defect structure of samples
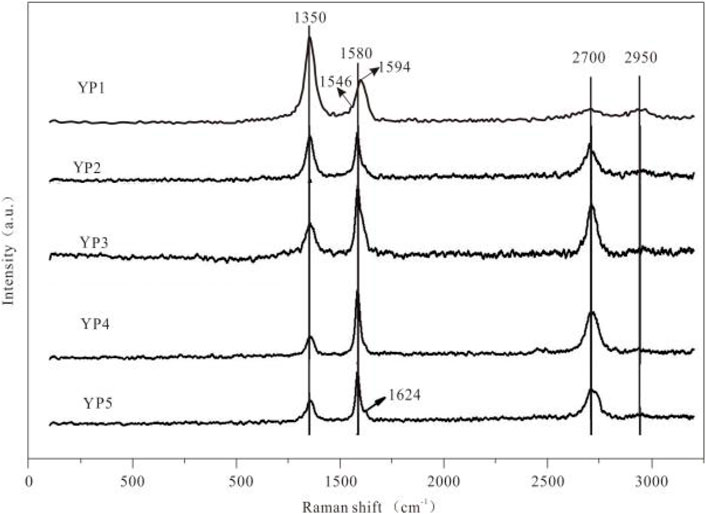
Figure 5 shows the Raman spectra of the samples. There are two Raman peaks of 1,350 cm−1 and 1,580 cm−1 in the first-order region, which are A1g (D mode) and E2g (G mode) symmetry modes in the D6h4 crystal symmetry type of graphite crystal (Qiao et al., 2011; Kim, 2012). The D mode is caused by the double-resonance Raman scattering involving phonons near the K critical point in the Brillouin region (Qiao et al., 2011). Sandra Rodrigues et al. used micro-Raman spectroscopy to study naturally crystallized graphite and found that strong D peaks were generated by discontinuous single graphene layers within the graphite crystal (Alstadt et al., 2012; Rodrigues et al., 2013; Luque del Villar et al., 1998). Therefore, the intensity of the D peak reflected the exposure degree of graphite crystal in the vertical 001 direction, namely, the degree of graphite crystallization or grain size. The G mode is a contraction from a pair of sp2 lattice sites, corresponding to the 1,581 cm−1 peak in the infrared spectrum, reflecting the degree of the aromatic ring structure bonding into graphene during graphitization. The 2,700 cm−1 peak in the second-order region is the frequency doubling of the D mode, and the 2,950 cm−1 peak is the combined frequency of D and G modes. However, in some highly ordered carbon materials, the frequency doubling peak of the D mode still appears even if the 1,350 cm−1 peak does not exist. The first order in the figure shows a small peak of 1,624 cm−1 to the right of the peak of 1,580 cm−1, which is the D2 vibration band and with the same generation mechanism as that of the D band. A D4 diffraction peak of 1,546 cm−1 is also shown in the XHSL sample, so the co-existence of these three peaks increases the G peak to 1,594 cm−1.
The intensity ratio (ID/IG) and area ratio (AD/AG) of D mode and G mode of Raman spectra can be used to characterize the degree of disorder in carbon materials. When the relative size of graphite microcrystals La is between ∼4 and ∼225 nm, La has a positive correlation with the inverse of the intensity ratio ID/IG, approximately La=44(ID/IG)-1∝1/R (Qiao et al., 2011; Lahfid et al., 2010). Table 3 shows the structural parameters of the Raman spectrum, which are obtained after the Lorenz curve fitting of the data. Among them, the intensity ratio and area ratio in the Raman spectroscopic parameters show the highest ordering of the YP4 sample, consistent with the SEM observations. Combined with the SEM results, it was found that the intensity of area comparison was better than that of distinguishing the disorder degree between YP5 and YP3 samples. Similarly, the graphitization degree of YP2 and YP1 is not good, and the sp2 planar domain size in the structure is still small, as shown in Raman data.
Lahfid (2010) studied the Raman spectrum of metasediment in the Glarus Alps and presented the Raman geothermometer as T = (R2-0.27)/0.0045, R2 = (D1+D4)/(D2+D3+G) (Lahfid et al., 2010). However, the formula was not applicable for highly metamorphosed samples, which was similar to the viewpoint (Aoya et al., 2010), as the upper limit temperature was 320 °C, according to Lahifid (2010). Thus, Aoya et al. (2010) and Bessyc (2002) proposed the Raman geothermometer formula as T = 91.4 × R22-556.3 × R2+676.3, R2 = D1/(D1+D2+G), which is fit for higher metamorphism temperature (Beyssac et al., 2002; Wang et al., 2019). Based on Table 3 and the formula, the formation temperature was calculated to be around 333°C–484°C, which is similar to the former studies (Aoya et al., 2010). The temperature was not enough for the graphitization of coal, even for eliminating structural defects and developing graphite crystals. However, the effect of tectonic deformation could not be ignored on the graphitization of coal as proposed in previous studies, which has presented more new evidence for the graphitization of coal under the influence of low temperatures (Wang et al., 2019).
5 Conclusion
(1) Under the action of magma thermal metamorphism, the discontinuous polycyclic aromatic hydrocarbon structure in high metamorphic coal gradually changes to a regular graphite C atomic lattice structure. With the increase of graphitization, the 002-diffraction peak of the sample gradually shrinks and narrows, and the peak intensity strengthened; also, the C atomic lattice structure becomes regular.
(2) During the structure evolution of graphite, the crystal morphology changed from disorder and irregular to a regular large-scale structure. The massive coal particles are linked into large flake crystals, and the pores between the particles are closed gradually.
(3) Different metamorphic degrees of coal-based samples identified differences in spectral signature. At the low graphitization stage, there is few graphite crystalline structure, whereas at large-exposure-degree edge layer of graphite, strong D mode vibration is found. Based on the Raman spectroscopy, although the intrusion has played critical effect on the evolution of defect structure and development of crystalline, effect of deformation could not be ignored.
Data availability statement
The raw data supporting the conclusions of this article will be made available by the authors, without undue reservation.
Author contributions
JL: conceptualization, data curation, formal analysis, investigation, writing–original draft, and writing–review and editing. LW: funding acquisition, investigation, resources, supervision, and writing–original draft. DC: supervision and writing–review and editing.
Funding
The author(s) declare that financial support was received for the research, authorship, and/or publication of this article. This work was supported by the financial support of the Fundamental Research Program of Shanxi Province (Nos. 202203021221230 and 202203021212475) and the National Natural Science Foundation of China (Nos.42402181).
Acknowledgments
The authors express their sincere gratitude to all those who contributed to the success of this study. Special thanks to their advisor, Daiyong Cao, whose insights and guidance were invaluable throughout the research process. The authors are also grateful to Rongfang Qin for their critical feedback and expert advice which significantly enriched this work. The authors also acknowledge financial support of the Science and Technology Department of Shanxi Province for financially supporting this research.
Conflict of interest
The authors declare that the research was conducted in the absence of any commercial or financial relationships that could be construed as a potential conflict of interest.
Publisher’s note
All claims expressed in this article are solely those of the authors and do not necessarily represent those of their affiliated organizations, or those of the publisher, the editors, and the reviewers. Any product that may be evaluated in this article, or claim that may be made by its manufacturer, is not guaranteed or endorsed by the publisher.
References
Alstadt, K. N., Katti, D. R., and Katti, K. S. (2012). An in situ FTIR step-scan photoacoustic investigation of kerogen and minerals in oil shale. Spectrochimica Acta Part A Mol. Biomol. Spectrosc. 89, 105–113. doi:10.1016/j.saa.2011.10.078
Aoya, M., Kouketsu, Y., Endo, S., Shimizu, H., Mizukami, T., Nakamura, D., et al. (2010). Extending the applicability of the Raman carbonaceous-material geothermometer using data from contact metamorphic rocks. J. Metamorph. Geol. 28 (9), 895–914. doi:10.1111/j.1525-1314.2010.00896.x
Bai, He.L., Pan, J. N., Zhao, Y. Q., Wang, H. C., and Yan, L. P. (2013). XRD study on brittle deformation coal of different metamorphism degree. Saf. Coal Mines 44 (11). doi:10.13347/j.cnki.mkaq.2013.11.001
Beyssac, O., Goffé, B., Chopin, C., and Rouzaud, J. N. (2002). Raman spectra of carbonaceous material in metasediments: a new geothermometer. J. Metamorph. Geol. 20 (9), 859–871. doi:10.1046/j.1525-1314.2002.00408.x
Buseck, P. R., and Huang, B. J. (1985). Conversion of carbonaceous material to graphite during metamorphism. Geochimica Cosmochimica Acta 49 (10), 2003–2016. doi:10.1016/0016-7037(85)90059-6
Cao, D., Zhang, H., Dong, Y. J., Wu, G., Ning, S., Mo, J., et al. (2017). Research status and key orientation of coal-based graphite mineral geology. Earth Sci. Front. 24 (5), 317–327. doi:10.13745/j.esf.yx.2016-10-9
Chehreh Chelgani, S., Rudolph, M., Kratzsch, R., Sandmann, D., and Gutzmer, J. (2016). A review of graphite beneficiation techniques. Mineral Process. Extr. Metallurgy Rev. 37 (1), 58–68. doi:10.1080/08827508.2015.1115992
Day, W. C., Hammarstrom, J. M., Zientek, M. L., and Frost, T. P. (2016). Mineral resources of the sagebrush focal areas of Idaho, Montana. Oregon, Utah, and Wyoming: Nevada.
Deurbergue, A., Oberlin, A., Oh, J. H., and Rouzaud, J. N. (1987). Graphitization of Korean anthracites as studied by transmission electron microscopy and X-ray diffraction. Int. J. Coal Geol. 8 (4), 375–393. doi:10.1016/0166-5162(87)90074-7
Ernst, J., Sheldrick, W. S., and Fuhrhop, J. H. (1990). Crystal structure of graphite. Carbon Tech. 39 (4), 1121–1130. doi:10.2113/gscanmin.39.4.1121
Friedel, R. A., and Carlson, G. L. (1971). Infrared spectra of ground graphite. J. Phys. Chem. 75 (8), 1149–1151. doi:10.1021/j100678a021
Gao, T. M., Chen, Q. S., Yu, W. J., and Shen, L. (2015). Projection of China's graphite demand and development prospects. Resour. Sci. 37, 1059–1067.
Gong, M. H. (2018). Master’s degree in geological characteristics of coal bearing gas in the Carboniferous Permian strata of Lianyuan Depression thesis. Beijing: China University of Geosciences.
Kim, Y. (2012). Magneto-Raman spectroscopy of graphene and graphite: probing electronic structure and electron-phonon interaction Doctoral dissertation. Florida: The Florida State University.
Kwiecińska, B., and Petersen, H. I. (2004). Graphite, semi-graphite, natural coke, and natural char classification—ICCP system. Int. J. Coal Geol. 57 (2), 99–116. doi:10.1016/j.coal.2003.09.003
Lahfid, A., Beyssac, O., Deville, E., Negro, F., Chopin, C., and Goffé, B. (2010). Evolution of the Raman spectrum of carbonaceous material in low-grade metasediments of the Glarus Alps (Switzerland). Terra nova. 22 (5), 354–360. doi:10.1111/j.1365-3121.2010.00956.x
Li, B. H., Li, K. X., Lv, C. X., Wu, D. L., and Li, C. (2001). Preliminary investigation of coal based carbon material structure. Coal Convers. (04), 68–70.
Li, H. T., Cao, D. Y., Wang, L. J., Guo, A. J., Li, Y. F., and Xu, H. (2013). Characteristics and evolution of coal controlling structures in the eastern margin of Xuefeng Mountain and central Hunan region. Geotectomics Mineralogy (04), 611–621. doi:10.16539/j.ddgzyckx.2013.04.008
Li, K. (2019). Ph.D. In the ordered process of graphite structure in coal measures at hunan Xinhua. Beijing: China University of Mining and Technology.
Lu, L., Sahajwalla, V., Kong, C., and Harris, D. (2001). Quantitative X-ray diffraction analysis and its application to various coals. Carbon 39 (12), 1821–1833. doi:10.1016/s0008-6223(00)00318-3
Luque del Villar, F. J., Pasteris, J. D., Wopenka, B., Rodas, M., and Fernández Barrenechea, J. M. (1998). Natural fluid-deposited graphite: mineralogical characteristics and mechanisms of formation, , 298, 471, 498. doi:10.2475/ajs.298.6.471
Miao, F. b., Tan, H., Wang, Q., Bai, Y. S., and Peng, Z. Q. (2016). Preservation conditions of shale gas in the carboniferous water formation of lianyuan depression in central hunan. Geol. Sci. Technol. Inf. (06), 90–97.
Mo, J. F., Z, X. L. Z. W. Q., and Li, H. T. (2020). Metallogenic law and prospecting direction of coal-based graphite in hunan province. Coal Geol. and Explor.
Mo, R. J., Liu, S. B., Huang, C. R., Zhang, G. R., Tan, G. M., and Wang, B. X. X. Z. (1989). Geology of graphite deposits in China. Beijing: China Architecture & Building Press, 132–146.
Oberlin, A., and Terriere, G. (1975). Graphitization studies of anthracites by high resolution electron microscopy. Carbon 13 (5), 367–376. doi:10.1016/0008-6223(75)90004-4
Olson, D. W., Virta, R. L., Mahdavi, M., Sangine, E. S., and Fortier, S. M. (2016). Natural graphite demand and supply—implications for electric vehicle battery requirements. Geol. Soc. Am. Spec. Pap. 520, 67–77.
Qiao, H., Juan, H., and Hui, Y. (2011). Spectroscopy characterization and analysis of graphite oxide. Chin. J. Inorg. Chem. 27 (9), 1721–1726. doi:10.1515/MGMC.2011.009
Rantitsch, G., Grogger, W., Teichert, C., Ebner, F., Hofer, C., Maurer, E. M., et al. (2004). Conversion of carbonaceous material to graphite within the greywacke zone of the eastern Alps. Int. J. Earth Sci. 93, 959–973. doi:10.1007/s00531-004-0436-1
Rodrigues, S., Marques, M., Suárez-Ruiz, I., Camean, I., Flores, D., and Kwiecinska, B. (2013). Microstructural investigations of natural and synthetic graphites and semi-graphites. Int. J. Coal Geol. 111, 67–79. doi:10.1016/j.coal.2012.06.013
Takagi, H., Maruyama, K., Yoshizawa, N., Yamada, Y., and Sato, Y. (2004). XRD analysis of carbon stacking structure in coal during heat treatment. Fuel 83 (17-18), 2427–2433. doi:10.1016/j.fuel.2004.06.019
Wang, L., Cao, D. Y., Peng, Y. W., Ding, Z., and Li, Y.(2019).Strain-induced graphitization mechanism of coal-based graphite from Lutang,hunan province,China.Minerals, 2019, 9, 617. doi:10.3390/min9100617
Wang, L., Zhang, H., and Li, Y. (2020). On the difference of characterization and supercapacitive performance of graphene nanosheets from precursors of inertinite-and vitrinite-rich coal. J. Alloys Compd. 815, 152502. doi:10.1016/j.jallcom.2019.152502
Wang, Q., Bai, Y., and Miao, F. B. (2016). Study on mineral composition and brittle characteristics of mud shale in the lower carboniferous water formation of lianyuan depression, hunan province. Geol. Mineral Resour. South China (02), 166–171. doi:10.3969/j.issn.1007-3701.2016.02.009
Wang, Y. B., and Han, D. X. (1999). Research on micro-FT. IR of macerals of CP coals in the bohaiwan basin. ACTA Geol. SINICA-CHINESE EDITION- 73 (4), 370–375.
Wen, C., Jin, Z. H., Guan, J. Q., Sun, D. Y., Li, X., Liu, X. X., et al. (2004). Infrared spectroscopy studies of nano-graphite synthesized by explosive detonation. Chem. Res. Chin. Univ. 25 (6), 1043–1045. doi:10.1016/j.jco.2003.08.015
Wen, C., Li, X., Sun, D. Y., Guan, J. Q., Liu, X. X., Lin, Y. R. Z. H., et al. (2005). Raman spectrum of nano-graphite synthesized by explosive detonation. Spectrosc. Spect. Anal. 25 (1), 54–57. doi:10.1360/biodiv.050084
Wen, L., Liang, W., and Zhang, Z. (1989). Mineral infrared spectroscopy. Chongqing: Chongqing University Press. (in Chinese).
Yang, X., and Dai, B.(2008).A thrust overturning structure related to magma intrusion and its research significance China Coal Geology, 20 (10), 50–52.
Keywords: coal-based graphite, graphitization, spectroscopy characteristics, different metamorphisms, coal
Citation: Li J, Wang L and Cao D (2024) Investigation on spectroscopy characteristics of different metamorphic degrees of coal-based graphite. Front. Earth Sci. 12:1413019. doi: 10.3389/feart.2024.1413019
Received: 06 April 2024; Accepted: 02 September 2024;
Published: 19 September 2024.
Edited by:
Cun Zhang, Qilu University of Technology, ChinaReviewed by:
Runsheng Lv, Henan Polytechnic University, ChinaQiaojing Zhao, Hebei University of Engineering, China
Copyright © 2024 Li, Wang and Cao. This is an open-access article distributed under the terms of the Creative Commons Attribution License (CC BY). The use, distribution or reproduction in other forums is permitted, provided the original author(s) and the copyright owner(s) are credited and that the original publication in this journal is cited, in accordance with accepted academic practice. No use, distribution or reproduction is permitted which does not comply with these terms.
*Correspondence: Lu Wang, d2FuZ2x1Y3VtdGJAMTI2LmNvbQ==
†These authors have contributed equally to this work
 Jing Li1†
 Lu Wang