 Elisa Ferrari
 Marco Massa
 Sara Lovati
 Federica Di Michele1
 Andrea Luca Rizzo
- 1National Institute of Geophysics and Volcanology (INGV), Milano, Italy
- 2Department of Earth and Environmental Sciences, University of Milano-Bicocca, Milano, Italy
The present work would like to illustrate a new concept of multiparametric stations to characterize the crustal fluids-tectonic interaction in specific geological contexts. The dynamics of crustal fluids in relation to tectonics is a complex and sometimes intricate issue. Several factors act and mutually influence themselves, so that in each tectonic and geological context they follow a specific behavior, and a comprehensive cause-effect rule is hard to find. Changes in water chemistry and levels and in soil flux regimes (e.g., CO2, CH4, radon) are just a few examples well documented in the literature as being pre-, co- and post-seismic modifications as well as being markers of the local tectonic stress acting in the crust. A regional study combined with a long-lasting multiparametric monitoring is needed to prepare to a seismic sequence in a given place. The field infrastructure was set up starting from the end of 2021, and multiparametric stations have been installed in correspondence of active seismogenic sources initially located in Northern Italy. Data are transmitted in real-time and archived in an ad hoc developed relational database. Monitoring is mainly focused on groundwater parameters (water level, temperature, and electrical conductivity) of aquifers showing distinct degrees of confinement and lithologies. Sites are also equipped of meteorological sensors (pressure, temperature, rain, humidity, wind speed and direction), radon sensors and surface and borehole seismic stations providing accelerometric and velocimetric data. A mud volcano field is also monitored and holds the installation of a permanent CO2 soil flux station. A statistical analysis working flow is also proposed for a preliminary evaluation of the acquired time-series. In particular, a couple of tools to detect, and thus filter, anthropogenic and meteorological effects on a groundwater level series is described. We wish to provide a model of approach to analogous study cases in other potentially seismic areas.
1 Introduction
Among natural hazards, the occurrence of unexpected and unpredictable earthquakes represents one of the big concerns for people living in potentially seismic areas. Most of the present forecast capability is based on the i) statistical study of earthquake’s recurrence (e.g., Zöller et al., 2007; Kourouklas et al., 2021 and references therein), which includes the development and application of physics-based simulator algorithms (Console et al., 2015), ii) study of physical signals observed before the main shocks (Ouzounov et al., 2018 and references therein), iii) occurrence of gas emissions (mostly radon and CO2), groundwater level and temperature changes (Cicerone et al., 2009; Petitta et al., 2018; Chiodini et al., 2020 and references therein; Gori and Barberio, 2022). Lot of effort is put by scientists in reviewing and summarizing the main evidence (possible precursors) recorded before catastrophic seismic events (Rikitake and Hamada, 2001; Cicerone et al., 2009; Martinelli, 2018 and references therein), in order to find systematic indications that can be assumed as possible precursors.
In the last decades, there is an increasing attention to the role of fluids in triggering the reactivation of faults networks through changes in pore pressure and ultimately inducing the occurrence of earthquakes (Hubbert and Rubey, 1959; Brauer et al., 2003; Miller et al., 2004; Chiarabba et al., 2009; Di Luccio et al., 2010; Malagnini et al., 2012; Ventura and Di Giovambattista, 2012; Keranen and Weingarten, 2018; Napolitano et al., 2020; De Matteis et al., 2021; Gabrielli et al., 2022, 2023). A clear relation between seismicity and surface degassing is constrained by several scientists (Barnes et al., 1978; Gold and Soter, 1980; Miller, 2013; Tamburello et al., 2018; Yoshida and Hasegawa, 2018; Luccio et al., 2022), whereas variations in the CO2 degassing regime and composition of gas emissions were recorded during high-magnitude seismic sequences (e.g., Italiano et al., 2001; Chiodini et al., 2004, 2011, 2020; Collettini et al., 2008; Girault et al., 2018). Changes in fluids circulation at depth in response to variations in the rocks permeability due to seismogenetic activity are responsible of chemical-physical changes observed in thermal groundwaters and/or cold springs from Central and North Italy during the several shocks (Mw > 4.5) recorded from 1997 to 2019 (Quattrocchi et al., 2000, 2003; Favara et al., 2003; Italiano et al., 2004; Federico et al., 2008; Chiodini et al., 2011; Barberio et al., 2017; Petitta et al., 2018; Boschetti et al., 2019; Barbieri et al., 2020; Martinelli et al., 2020; Valigi et al., 2020; Coppola et al., 2021; Franchini et al., 2021; Gori and Barberio, 2022).
This variety of recognized seismic-induced variations in groundwaters and springs leads, in the last years, scientists and stakeholders to pose more attention to the development of multiparametric monitoring network especially in proximity of those areas considered potentially seismogenetic. Some infrastructures are capable of (near) real-time continuous monitoring with various data acquisition frequencies. Certain are devoted to examining mainly water level, temperature and electrical conductance of groundwater (Hosono et al., 2019; Lee et al., 2021), others of thermal springs (Popit et al., 2005). There are rare examples of continuous monitoring of gas composition (radon, He, Ar, N, CH4) associated with thermal springs (e.g., Chaudhuri et al., 2013). Some installations are designed to study distinct phenomena as reported, for instance, by Reddy and Nagabhushanam (2011) who monitor groundwater behavior along with soil radon emissions.
In the Italian context, few studies reported a continuous, high-frequency monitoring, mainly of groundwater level or hydraulic pressure (De Gregorio et al., 2012; Barberio et al., 2017; De Luca et al., 2018). The work of Gori and Barberio (2022) represents an uncommon example of spring monitoring (temperature, pH, electrical conductivity, dissolved oxygen and carbon dioxide). D’Alessandro et al. (2020) reported the first long-term monitoring of soil radon emissions related to seismic activity.
A recent agreement between the National Institute of Geophysics and Volcanology (INGV) and the National System for Environmental Protection (SNPA, composed of the Regional Environmental Protection Agencies - ARPA and ISPRA) has allowed data sharing of available SNPA continuous monitoring of mostly piezometric level, temperature, electrical conductivity, salinity, total dissolved solids from water wells and springs (Comerci et al., 2019). Data are stored on the SINAnet facility (http://www.sinanet.isprambiente.it). The INGV-SNPA agreement is, thus, aimed at gathering information on seismic activity and aquifer/spring status from various acquisition sources, in some cases reaching a near real-time monitoring.
Following the same philosophy, distinct research institutes and universities set up local geochemical or hydrogeological networks: i) INGV has soil gas and hydrogeochemical stations related to the Alto Tiberina Near Fault Observatory (TABOO; https://ingv.it/en/monitoring-and-infrastructure-a/monitoring-networks/the-ingv-and-its-networks/taboo); ii) INGV has hydrogeological stations in Calabria related to IDRO-CALABRIA, task of DL-50 Rete Idrogeochimica project; iii) INGV has hydrogeological stations at Gran Sasso (Martinelli et al., 2021); iv) INGV, CNR, University Aldo Moro of Bari and University Federico II of Napoli have soil gas stations settled in the Southern Apennines, including the Irpinia Near Fault Observatory (PON-GRINT project; https://progetti.ingv.it/en/pongrint); v) INGV operates groundwater continuous monitoring in two sites of the Southern Apennines (FURTHER project; https://progetti.ingv.it/en/further); vi) INGV and University of Perugia monitor springs and thermal waters in Central Italy (COSMOS and DL-50 Rete Idrogeochimica IDRO-DEEP CO2 task); vii) INGV monitors groundwaters in Irpinia under the project MYBURP (https://progetti.ingv.it/it/pian-din#myburp-modulation-of-hydrology-on-stress-buildup-on-the-irpinia-fault); viii) INGV monitoring in the Northern Apennines and Pianura-Padana is led by IDRO-NORD, task of DL-50 Rete Idrogeochimica; ix) INGV has several radon sensors across Italy (IRON project; https://ingv.it/monitoraggio-e-infrastrutture/reti-di-monitoraggio/l-ingv-e-le-sue-reti/iron); x) IGG CNR-Pisa has geochemical stations in Toscana (Martinelli et al., 2021); xi) IMAA CNR has geochemical stations at Tramutola (Potenza province, Martinelli et al., 2021); xii) the Earth Sciences Department of Sapienza University of Rome has hydrogeological stations in Abruzzo (Martinelli et al., 2021).
Noteworthy, the Alto Tiberina and Irpinia Near Fault Observatories are held by EPOS (European Plate Observing System) research infrastructure (https://www.epos-eu.org/) of which the mission is to foster the integration of solid earth data and their by-products made by the entire European scientific community. Seismological, geophysical, geodetic and geochemical data are recorded by the Near Fault Observatories and accessible on the FRIDGE portal (https://fridge.ingv.it/index.php).
In this respect, here we present a new concept of multiparametric stations for real-time continuous monitoring and long-term assessment of natural phenomena. They consist of multichannel velocimetric and accelerometric seismic stations (including one bore-hole with sensor installed 150 m depth), coupled with i) chemical-physical sensors installed in water-wells measuring water level, temperature, and electrical conductivity, ii) meteorological stations measuring atmospheric pressure, temperature, rain, humidity, wind speed and direction, iii) sensors for radon level measurements, iv) CO2 station for detection of anomalous degassing from soil. Groundwater and meteorological data are recorded following an high frequency acquisition rate (1 data per minute), which allows the detection of very fast variations and thus a better understanding of the relationships between the different factors. The wide range of controlled parameters is an indication of the strong multiparametric approach of this network. Our monitoring stations represent an example of a cutting-edge infrastructure in the Italian framework of multiparametric stations. The monitored sites of Northern Italy pertain to specific projects that are ongoing with the working group. However, the network aims at extending the installations to the most seismogenetic areas of the Italian Country, being the approach valid in whatever geological context worldwide.
Data acquired by the multiparametric stations are daily transmitted in real-time to the acquisition center of INGV, department of Milano and then archived in ad hoc MySQL relational database, named MUDA (geophysical and geochemical MUltiparametric DAtabase) able to publish data in quasi real-time through the related web portal (https://muda.mi.ingv.it), which allows data visualization and downloading from every multiparametric monitoring sites (Massa et al., 2023). The ready data availability is fundamental to constantly monitor the evolution of certain phenomena (i.e., earthquake-related variations, but also aquifer response to meteorological parameters or anthropic pumping, changing regime of gas fluxes), besides being useful to check sensor healthy status.
Data acquired until the end of 2023 are presented and discussed with the aim to point out i) the proposed installation and data processing scheme in order to better understand and interpret possible multi-hazard phenomena, ii) the background features of the target areas during a period of seismic quiescence, iii) the variability of hydrogeochemical parameters induced by natural and anthropogenic variations through a statistical analyses, iv) examples and discussions of possible correlation among the recorded multiparametric data and their useful in earthquakes preparation and seismic risk mitigation.
2 Overview of monitored sites and areas
The multiparametric stations are installed in Lombardia, Emilia-Romagna and Veneto regions (Northern Italy; Figure 1). In particular, seven are distributed around the Garda Lake, namely, Montelungo, Gere, Vobarno, Bondo, Volargne, Balconi and Veronello. Four are located in the high (Maser and Fonte) and low (Oppeano and Casaglia) plain of the Pianura Padano-Veneta. Finally, Nirano monitoring station is set in the Northern Apennine of Modena province. Sites altitude ranges from 7 m a.s.l. (Casaglia) to 682 m a.s.l (Bondo). Further location details are listed in Tables 1, 2.
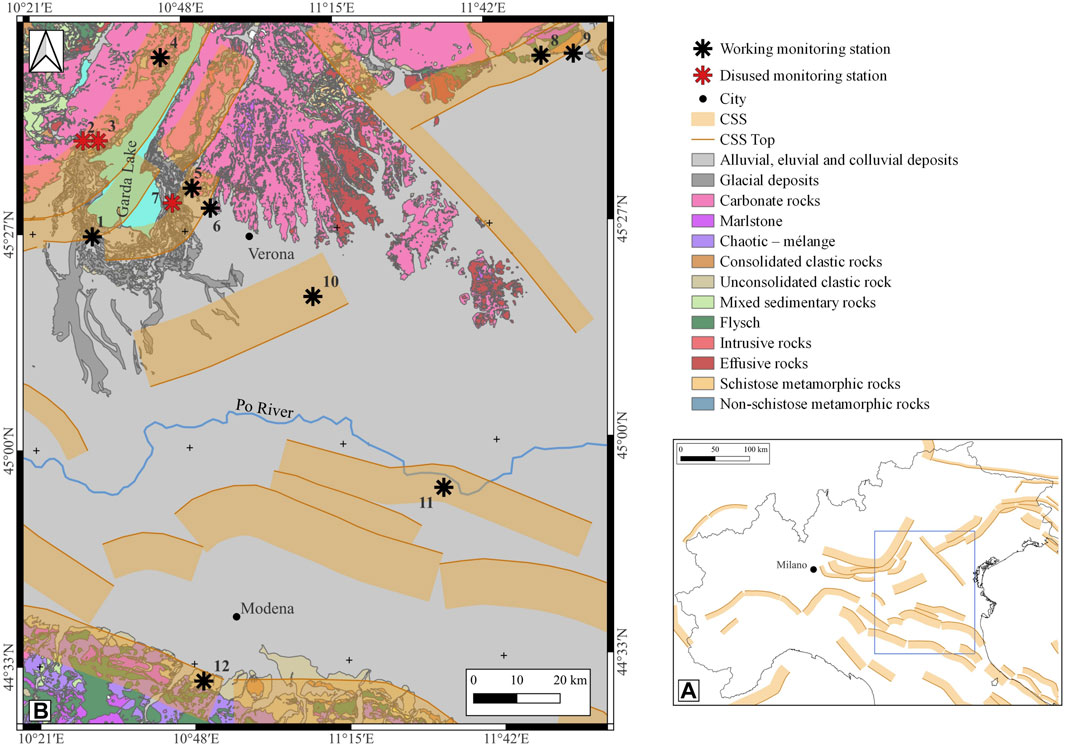
Figure 1. Panel (A) Detail of Northern Italy showing the extent (blue rectangle) of the area covered by the multiparametric stations. Panel (B) Simplified lithological map of the monitored area (modified after Bucci et al., 2021). The Coordinate System is WGS 1984, EPSG 4326. Composite Seismogenic Sources (CSS) and top margin of Composite Seismogenic Sources (CSS Top) are also displayed (Database of Individual Seismogenic Sources, http://diss.ingv.it).
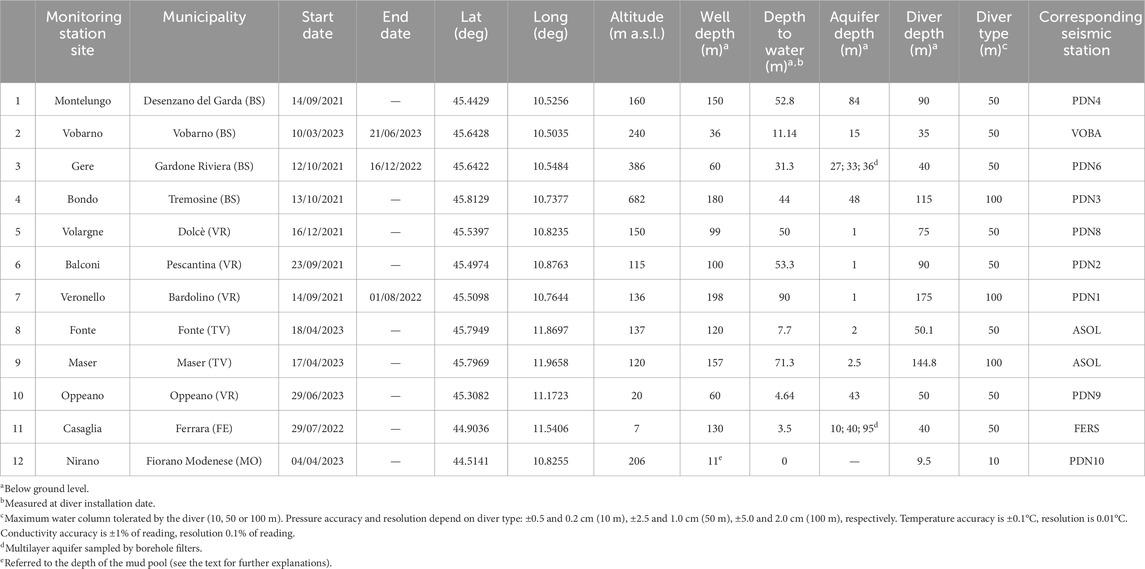
Table 1. Diver installation specifications.
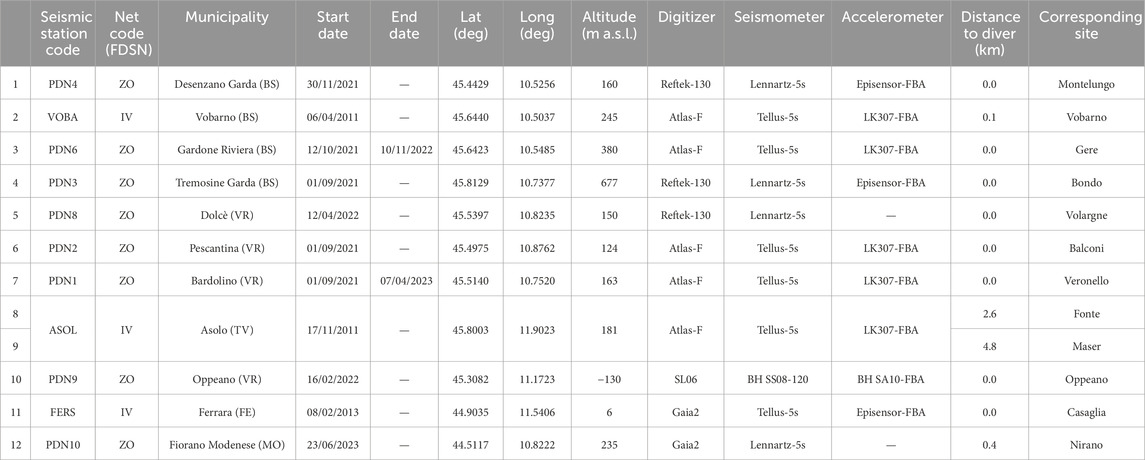
Table 2. Seismic stations installation specifications.
Following the Köppen and Geiger classification, a temperate climate (Cf) is common to all monitored sites. In more detail, Continental temperate (mean annual temperature from 9.5°C to 25°C) and Sub-continental temperate (mean annual temperature from 10°C to 14°C) climate types characterize all the locations except for Vobarno, Gere and Bondo, which fall in the Cool temperate region showing mean annual temperature from 6°C to 9.9°C (Fratianni and Acquaotta, 2017). According to the literature, mean annual cumulated precipitation is patterned as follows: Casaglia 600–700 mm; Oppeano, Nirano 700–800 mm; Veronello, Volargne, Balconi 800–900 mm; Montelungo 900–1,000 mm; Maser, Fonte 1,200–1,300 mm; Vobarno, Gere, Bondo 1,300–1,400 mm (Ceriani and Carelli, 2000; Regione Veneto, 2015; Antolini et al., 2016).
2.1 Geological setting
2.1.1 Garda Lake
Garda Lake defines two distinct paleogeographic domains: the Lombardian Basin to the West and the Venetian-Trento Platform-Plateau to the East. These domains formed within the passive margin of Adria plate during the Mesozoic rifting phase that ultimately led to the opening of the Western Tethys ocean. At the beginning of the Triassic, marine transgression advanced westward leading to the deposition of calcareous formations, mainly of platform and lagoon environments. During the Lower Jurassic, the progression of lithospheric extension caused the collapse of Adria passive margin and carbonate platform drowning. The Lombardian Basin was then site of pelagic sedimentation, whilst the Venetian-Trento Platform-Plateau was characterized by shallow-water conditions (e.g., Bertotti et al., 1993). The two domains are separated by the Ballino-Garda Line, a Jurassic extensional fault oriented N-S (Castellarin, 1972).
Immediately West of Garda Lake, geological formations span the Triassic-Paleogene periods, with younger successions progressively cropping out going south. Overall, Jurassic to Mid-Paleogene formations are thrusted by Triassic units (e.g., Dolomia Principale). The eastern side of Garda Lake lacks the Lower Triassic to Carnian successions. The Upper Jurassic to Lower Cretaceous formations show less thicknesses compared to the coeval units outcropping west of the lake, reflecting the shallow marine environment of the Venetian-Trento Platform-Plateau.
The southern part of the lake is characterized by Quaternary deposits under which the Oligocene/Miocene bedrock lies. The most prominent Quaternary outcrop is the moraine amphitheater including at least five glacial stages (Baroni, 2017).
2.1.2 Pianura Padano-Veneta
The Pianura Padano-Veneta is a Tertiary sedimentary basin surrounded by the south-verging thrusts of the Southern Alps to the North and the north-verging Apennine chain to the South. From a structural point of view, the Pianura Padano-Veneta was the foreland basin of both the Southern Alps and Apennine chains in Mesozoic times, whilst from the Late Paleogene it represented the foredeep initially of the Southern Alps and from the Messinian of the Apennine chain. The Pianura Padano-Veneta hosted the Adriatic sea till the Early Quaternary, when it began to retreat eastward up to the current position (Gasperi, 2001). The plain is characterized by Quaternary continental deposits. North of Po River, fluvial sediments are dominated by gravels and sands coming from the Alpine rocks (mainly silicoclastic, crystalline, limestone). South of Po River, alluvial detritus are governed by sands and clays eroded from calcareous and clayey Apennine formations (Marchetti, 2001).
2.1.3 Maser and Fonte high-plain area
The area is located on the border between the Pianura Veneta and the Venetian foothills, in the Asolo municipality (Treviso province). Here, the NNE-SSW trending hilly morphology reproduces the front of the eastern Southern Alps, a fold-and-thrust belt whose north-dipping faults (e.g., Bassano-Valdobbiadene thrust) are buried under Quaternary deposits (Castellarin et al., 1992). The mountain front is structurally dominated by an anticline geometry (e.g., Montello Anticline, Picotti et al., 2022). It mainly exposes Miocene units such as the Montello Conglomerate, a fan-delta formation deposited by the Alpine rivers during the Messinian marine regression phase (Venzo, 1977). The Quaternary units are represented by Pleistocene fluvio-glacial and Holocene fluvial deposits, arranged as coalescent megafans largely deposited by the Piave river.
2.1.4 Salse di Nirano
The Regional Natural Reserve of Salse di Nirano hosts one of the largest mud volcano field of Europe. Placed near the Apennine margin, it emits fluids mainly consisting of clay mud, saline water and hydrocarbons (liquid and gas). Eruption-style and mud viscosity mainly govern the volcano morphology (cone, gryphon or pool; e.g., Oppo et al., 2013). The area is positioned upon an anticline structure of the NE-verging fold-and-thrust Apennine belt. Mud volcanoes lies at the bottom of a caldera-like depression presumably formed as a consequence of mud diapir top collapse following severe fluids emission (Bonini, 2008). In addition, two main fault and fracture systems can be distinguished, one NW-SE oriented and the other SW-NE/ENE-WSW oriented (Castaldini et al., 2005).
Marine silty clays of the Argille Azzurre formation (Middle Pliocene-Lower Pleistocene) crop out and overlay Epiligurian Eocene-Miocene units. Miocene sandstones and siltstones (Marnoso Arenacea formation) are found at about 1.5 km depth. The latter formation is entitled as the main fluids reservoir. Secondary reservoirs are placed in the permeable Epiligurian units. High-angle faults and fracture zones allow fluids migration to the surface (e.g., Bonini, 2008).
2.2 Hydrogeological setting
The multiparametric stations monitor both porous media and fractured aquifers of different hydrogeological basins. In particular, the aquifer at the site of:
• Montelungo pertains to the Oglio-Mincio high-plain basin (Regione Lombardia, 2017). The aquifer is confined and it is hosted in Quaternary fluvioglacial and alluvial unconsolidated sediments (gravel and sand).
• Vobarno, Gere and Bondo pertain to distinct Alpine valley-bottom basins (Regione Lombardia, 2017). Vobarno and Gere are characterized by unconfined to semi-confined aquifers made of Quaternary unconsolidated sediments (gravel and sand) and fractured and carsified limestones (Medolo formation - Lower Jurassic). The unconfined reservoir of Bondo is hosted in the fractured-carsified limestones belonging to the Dolomia Principale formation (Upper Triassic).
• Volargne, Balconi and Veronello pertain to the Verona high-plain basin (Regione Veneto, 2008). Quaternary fluvioglacial gravelly sediments deposited by the Adige river and streams coming from the Lessini Mountains constitute this unconfined aquifer.
• Fonte and Maser pertain to the Treviso high-plain basin (Regione Veneto, 2008). The unconfined aquifer at Fonte is exceptionally shallow (less than 10 m below ground level) and is set in the sandy gravels of the so-called “Piave di Montebelluna” megafan. The unconfined aquifer at Maser is hosted in the fractured and carsified Conglomerato del Montello formation (Late Miocene).
• Oppeano pertains to the differentiated Venetian low-plain basin (Regione Veneto, 2008). The confined aquifer is constituted by Holocene alluvial sands mainly deposited by the Adige river.
• Casaglia pertains to the differentiated Emilia-Romagna low-plain basin (Severi et al., 2014). Semi-confined to confined aquifers alternate in depth and span Holocene alluvial to Pleistocene alluvial to delta deposits overlying Pleistocene deposits of marine environment (e.g., Sabbie di Imola).
2.3 Seismological setting
In some areas, such as Northern Italy, where the seismicity is moderate but the exposure is large, because of the high population density and because of several industrial plants, understanding the seismogenetic potential becomes essential. In the last 30 years, thousands of small to moderate energy seismic events (∼200/year, Figure 2A, http://terremoti.ingv.it/) have occurred in Northern Italy. Despite the low-to-medium seismic hazard of the area (MPS Working Group, 2004; Stucchi et al., 2011; Figure 2B), the exposure level of the cities, the local geological condition and the proximity with active buried seismogenic structure make many portions of North Italy a medium to high seismic risk zone.
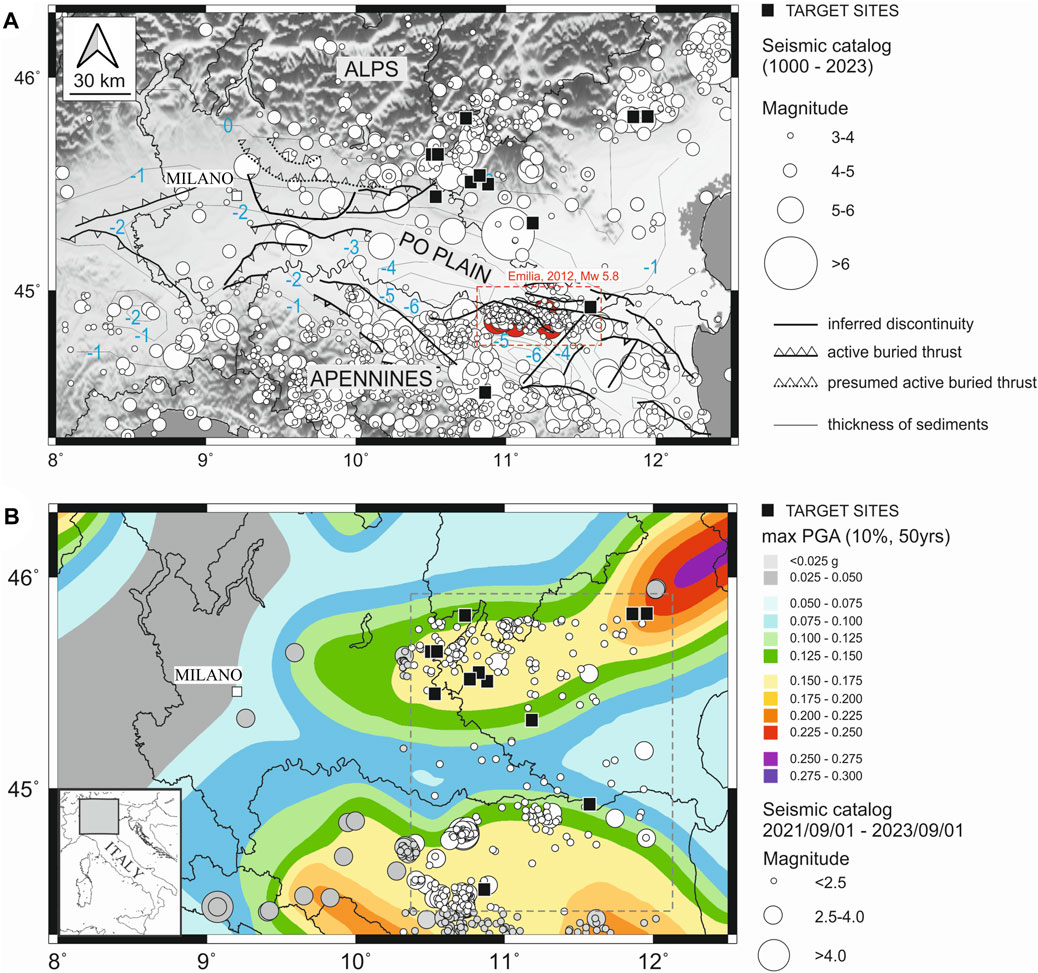
Figure 2. Panel (A) Simplified structural sketch map of the Po plain (modified after Pieri and Groppi, 1981; Bigi et al., 1990). White circles indicate the seismicity from yrs. 1000–2023. Red circles in the red inset indicate the 2012 Emilia seismic sequence. The Composite Seismogenic Sources are derived from DISS (Database of Individual Seismogenic Sources, http://diss.ingv.it). Black squares indicate the target sites, i.e., monitoring stations sites. Panel (B) Seismic hazard map of Italy (MPS Working Group, 2004; Stucchi et al., 2011), in terms of peak ground acceleration (PGA) with 10% possibility of exceedance in 50 years (i.e., a return period of 475 years), referred to the rigid soils (i.e., Vs. > 800 m/s). Circles indicate the epicenters of the earthquakes for the period reported in the legend. In particular, the white ones fall in the monitored area (light grey dashed rectangle).
Except the 20th May 2012, Mw 5.8, Emilia seismic sequence (Luzi et al., 2013), with epicenters located 170 km southeast of Milan, Northern Italy underwent few moderate events, with a magnitude between 4.5 and 5.5 (i.e., the 14th August 2000, Mw 4.8, Asti; the 3rd April 2003, Mw 4.8, Novi Ligure; the 14th September 2003, Mw 5.2, Monghidoro; the 24th November 2004, Mw 5.2, Salò and the 23rd December 2008, Mw 5.4, Parma events, http://terremoti.ingv.it). In particular, the Emilia, Mw 5.8 mainshock occurred very close to the target site number 11, indicated with a black star in Figure 1.
Considering the historical seismicity (Rovida et al., 2020; https://emidius.mi.ingv.it/CPTI15-DBMI15/), the more significant earthquakes of the area occurred on 3rd January 1117, Mw 6.52 (Verona earthquake), ∼140 km, South-East of Milan, in a sector of the Po plain where the target site number 10 is installed (see the black star in Figure 1).
In general, the highest rate of energetic events in the area is associated with S-verging thrust faults typical of the central and East South Alpine Chain due to the ∼N-S convergence between the Adriatic microplate and the Alps (Figure 2A). In particular, the eastern part of North Italy was repeatedly hit by relevant earthquakes: the most recent destructive occurred in Friuli, during the seismic sequence of sixth May 1976, with maximum magnitude Mw = 6.5 (Pondrelli et al., 2001 and references therein), whereas the largest historical event is the 1,695 Asolo earthquake, with estimated Mw 6.48 and Imax X (Rovida et al., 2020) broadly associated to the thrust system of the Montello area (Danesi et al., 2015), where the target sites 8 and 9 are installed (see the black stars in Figure 1).
The North center part of the South Alpine Chain, close to the Garda Lake area is associated with a moderate seismicity (see Figure 2). The more relevant earthquake occurred on 24th November 2004, with ML = 5.2 (Salò earthquake), whereas in the past other energetic events shocked the area, such as the Mw = 5.6, 30th October 1901, Salò earthquake. In the Garda Lake area the target sites from 1 to 7, as reported in Figure 1 (see the black starts), are installed.
The last investigated site, number 12 (see the black star in Figure 1), is installed in correspondence with the Apennines chain, in the Regional Natural Reserve of Salse di Nirano (Lupi et al., 2016). The area underwent the regional seismicity associated with the Apennine fronts defined by different arcs of blind, north-verging thrusts and folds, able to generate moderate energetic seismic events with maximum magnitude around 6 (i.e., 5th June 1501, Mw 6.05, modenese event). The target site 12 is located in correspondence with a mud volcano of the Nirano natural reserve, representing an example of the superficial expression of the local geological systems characterized by high fluid pressures at depth, which deviate from hydrostatic conditions and determine the leakage of fluids and mud. The mud volcano generates a very local drumbeat-type, usually with a magnitude lower than 1, characterized by a relevant high frequencies content, between 10 and 40 Hz (Lupi et al., 2016; Giovani et al., 2017) well recognizable on the three components of motion.
3 Materials and methods
Site selection is guided by the location of seismogenic sources (Figure 1). The installed instrumentation monitors groundwater and meteorological parameters, as well as seismological signals. Montelungo and Bondo sites are also equipped with a radon sensor, while at Salse di Nirano site a CO2 soil flux chamber is installed (Supplementary Figure S1).
Tracking of groundwater level, electrical conductivity, and temperature is achieved using CTD-Diver® (Van Essen Instruments, https://www.vanessen.com/) lowered into a borehole. Groundwater level is expressed as the height of the water column above the diver, while the depth of the water table from the top of the well has been measured by a phreatimeter at the time of diver installation. The pressure sensor (piezoresistive ceramic) measures the water pressure supplemented by the atmospheric pressure. A barometric compensation is needed to account for atmospheric pressure variations and thus obtain the corrected water level value. Electrical conductivity is measured by a 4-platinum electrode measuring cell, whilst temperature is measured by a semiconductor sensor. The diver is set up for continuous recording of the three aforementioned parameters according to a sampling frequency of 1 min. Collected data are daily transmitted through a modem (GDTS, Royal Eijkelkamp, https://www.royaleijkelkamp.com/) to the Eijkelkamp head office and then sent to the INGV acquisition center by API or email. The modem also acquires the atmospheric pressure data employed for barometric compensation of diver pressure readings. Details on water well features and diver technical specifications are listed in Table 1. As to pinpoint all monitored aquifers, water temperature and electrical conductance vertical profile have been carried out at each site by taking one measure every 2 s while lowering the probe according to a rate of 1 m/min. These data were then compared to the stratigraphy furnished by the well’s owner or extracted from data of nearby boreholes published on ISPRA website (https://sgi2.isprambiente.it/mapviewer/).
Davis Vantage Vue® (Davis Instruments, https://www.davisinstruments.com/) weather station provides information on atmospheric pressure (resolution of 0.1 hPa), temperature (resolution of 0.1°C), humidity (resolution of 1%), rainfall amount (resolution of 0.2 mm), wind speed (resolution of 1 km/h) and direction (resolution of 1°). Data are gathered with a sampling rate of 1 min, logged by a WeatherLink Live™ console which makes it available in real-time on the dedicated website (https://www.weatherlink.com/). Data storage to the INGV acquisition center occurs via API. Weather stations are installed at a minimum height of 2 m above the ground surface and away from obstacles that could falsify wind and rain measurements.
Air radon concentration is measured every 4 h using a photodiode detector (AER Plus, Algade) having a sensitivity of 15 Bq/m3 by counts/hour. The sensor is placed near the water well in a plastic box to prevent direct contact with water moisture. Temperature and humidity are measured simultaneously. Radon instruments are part of the Italian Radon Monitoring Network (IRON-Istituto Nazionale di Geofisica e Vulcanologia, https://www.ingv.it/monitoraggio-e-infrastrutture/reti-di-monitoraggio/l-ingv-e-le-sue-reti/iron). Radon data are transmitted in real-time by the Sigfox (https://www.sigfox.com) 0G-technology and archived at the Sigfox cloud, with the exception of particularly remote sites where a periodic local data downloading is also necessary.
A permanent station for CO2 soil flux measurements is placed at Salse di Nirano. The location was chosen by merging the information about the local seismicity and the CO2 flux data both published by Sciarra et al. (2019) and acquired by a recent survey performed in July 2023 using a portable accumulation chamber (Thearen, https://thearen.com/). The background flux measured in July 2023 ranged between 1 and 19 g m−2 d−1, with an average of 11 g m −2 d−1 and characterized both vegetated and clay-dominated areas. The installation site is characterized by an anomalous CO2 flux (150–440 g*m-2*d-1) occurring at a fracture system in the Argille Azzurre formation. Further details on these new measurements will be given in a separate paper (in preparation). The permanent station has a non-stationary flux chamber and it is equipped with an infrared analyzer (Thearen, Italy) measuring CO2 concentrations in a time frame of 3 minutes. A CO2 flux measure is returned each hour already corrected for pressure and temperature recorded inside the chamber. Soil temperature and moisture (detected by PT100 sensor and CS616 reflectometer, respectively) and meteorological parameters (atmospheric pressure, temperature, humidity, rain, wind speed and direction) are concomitantly acquired. Data are daily sent to the head company server-cloud through a dedicated router that enables automatic data transmission and then acquired by INGV acquisition center through an ad hoc server to server connection.
Seismic stations are installed over a wide area extended from the Alps, at North, to the northern Apennines, at South (Figure 2). In particular, the higher number of stations (7) are installed at the southern limit of the central Alps, around the Garda Lake. The other stations are installed at the southern limit of the Eastern Alps (2), in the Po alluvial basin (2) and in correspondence of the Salse di Nirano park (1), at the limit between the Po Plain and the Northern Apennines. All seismic stations are registered at ISC web site (http://www.isc.ac.uk/), while the international network codes are provided by the Federation of Digital Seismograph Networks (FDSN, https://www.fdsn.org/). In particular, nine seismic stations belong to the new temporary network named PDnet (FDSN code ZO, https://www.fdsn.org/networks/detail/ZO_2021/) and three further stations (sites 8, 9, 11) belong to the Italian National Seismic Network (FDSN code IV, https://www.fdsn.org/networks/detail/IV/). All stations are equipped with 24-bit digital recorders (see Table 2), in almost cases with both an enlarged-band seismometer and a FBA-accelerometer (Table 2). In this case digitizer are Reftek-130 (https://reftek.com/), Atlas-F Lunitek (https://www.lunitek.it/) or Gaia2 (Salvaterra and Rao, 2013), while the seismic sensors are Lennartz (https://www.lennartz.de/) or Lunitek-Tellus, with 5s owner period of oscillation and FBA Kinemetrics Episensor (https://kinemetrics.com/) or FBA Lunitek LK307 accelerometers (Table 2). In particular, at PDN9 borehole station (Oppeano, site 10) the SS08-120s seismometer and the SA10-FBA accelerometer (Sara Elctronics, https://www.sara.pg.it) are co-located at 150 m depth. Both sensors are coupled with the Sara SL06 24 bits digitizer. All stations are equipped with power supply and buffer battery, kept charged with 220 V or solar panels. The stations are synchronized with GPS time signals and are fully integrated in the framework of INGV national monitoring network. Data are sent in real time by UTMS connections to the INGV Milano data center, where they are archived in miniSEED format (http://ds.iris.edu/ds/nodes/dmc/data/formats/miniseed/). All waveforms are downloadable from the INGV EIDA node (https://eida.ingv.it/it/). Data quality for continuous data streams and selected events is provided through the ISMDq (INGV strong-motion data quality) web site (http://ismd.mi.ingv.it/quality.php, Massa et al., 2022).
All multiparametric data acquired by the different type of sensors are stored in a local ad hoc developed MySQL database, named MUDA (geophysical and geochemical MUltiparametric DAtabase) now in operation at INGV Milano data center. MUDA is supplied with a dynamic website (https://muda.mi.ingv.it) allowing daily and freely available data to all users for both viewing and download (Massa et al., 2023).
3.1 Statistical analysis
Here we briefly introduce the main statistical tools used in this work, and we would like to outline their potential and eventual future applications. For further details on the possible theoretical approaches to statistical data analysis, please see for instance Manu (2022), Hamilton (1994), Auffarth (2021).
From the mathematical point of view a time series (TS) can be defined as
namely, a function that maps a time interval [0,T], where T is the total acquisition time, into real numbers. For many applications in geosciences, such as the ones presented in this paper, the acquisition interval is a discrete sequence, and the recorded signal is called a discrete time series.
The techniques used for TS analysis are many, and the choice depends on the objectives of the study itself, but also on the quantity and quality of the available data.
We can identify three main areas of time series investigation that differ in the final objective of the study: Time Series Prediction, Time Series Classification, Time Series Interpretation and Causality (Manu, 2022). In the first case, the ultimate goal is to make forecasts, i.e., to use past data to predict what will happen in the future. Although certainly interesting, this type of analysis is not yet applicable to our datasets, characterized by a maximum acquisition time of about 2 years.
The second type of analysis, on the other hand, is applied when one wants to classify a TS by associating it with a particular physical phenomenon or placing it in a group according to certain characteristics that may be known a priori or established during the analysis.
The present work, although preliminary from the point of view of statistical analysis, can be placed mostly in the third group. Our aim, in fact, is to identify and interpret the information hidden in the time series we are studying, highlighting any correlations between them. We would like to point out that in this work we will not be analyzing all the data described above. In fact, our aim is not to provide a complete statistical analysis of the data collected (mainly because some of the series described are too short to allow an exhaustive analysis), but to describe and illustrate the potential of our multi-parametric stations, while defining an analysis workflow that allows us to automatically identify anomalies, trends and seasonal behavior. In particular, the following procedure is applicable to groundwater level time-series.
The first step in any data analysis workflow is the cleaning of the dataset needed to identify missing data, outliers (i.e., null or incorrectly recorded data) and/or duplicate data. Once identified, missing data and outliers were estimated using Python’s interpolation tool (https://www.python.org/) while duplicate data were removed.
On average the amount of gaps not overcome the 10% of the entire data sets; in particular, the amount of missing data with respect the whole recording period ranges 0.8% at Veronello to exceed 30% at Fonte and Casaglia sites.
Potential and periodic peaks or variations in the hydrogeochemical TS are estimated by using the signal differences, Δ(t), expressed in Eq. 1 as:
Where M(t) is the recorder of the quantity M at the time t. At t = 0 we set M(0) = 0.
Then, an outlier detection tool is employed to pick and thus filter out the distinct peaks potentially indicative of anomalies. Having analyzed any singularities in the TS, the next step is to highlight the presence of any periodicities and to study its general trend. There are basically two possible approaches: i) analyzing the signal in the frequency range, e.g., by calculating the discrete Fourier transform (DTS) or ii) decomposing the signal using the STL decomposition (Seasonal and Trend decomposition using Loess). The latter is based on the observation that any time series can be decomposed into three components, as reported in Eqs 2, 3: trend T(t), seasonality S(t) and residuals R(t) (Cleveland et al., 1990). A time series Y is additive if
whereas it is multiplicative if
The choice between the two approaches is not always simple unless the cyclicity is evident from the overall graph or the physical phenomenon that one wants to analyze is well known. In general, we can say the TS is multiplicative if the periodic component follows the trend, whereas it is additive if the distance between the maximum and minimum of the periodic components remain almost constant during the evolution of the TS.
4 Preliminary results
The first multiparametric stations were installed during the second half of 2021. Supplementary Figure S1 summarizes the operating periods of each site per sensor type. Montelungo, Balconi, Bondo and Volargne are the most long-lived, having at least 2 years of data recordings. Gere and Veronello were definitively dismissed, while Vobarno is temporarily disused due to a working site. The description of results and subsequent discussion are mainly focused on the four lasting sites so as to highlight any intra-annual and inter-annual variations. The other sites will only be mentioned to describe specific cases.
4.1 Groundwater parameters
Montelungo, Balconi, Bondo and Volargne time-series show minimum to negligible variations in groundwater temperatures (maximum ΔT ∼ 0.5°C; Figure 3A). It should be stated that this calculation does not take into account variations triggered by known phenomena (water pumping at Balconi and peculiar phenomena at Bondo), which will be mentioned in the discussion. Remarkably, Fonte and Maser show larger temperature variations (ΔT = 0.9°C and 3.2°C, respectively) despite their short recordings (∼8 months). Temperatures among sites roughly (R2 index ∼ 0.4) negatively correlate to the site altitude (see Figures 3B,C) or sensor altitude as already reported for other locations in the literature (e.g., Prada et al., 2005; Baena et al., 2009). In this view, Bondo has the lowest temperatures (∼11°C) according to its highest elevation. By excluding Bondo, the resulting weak R2 index (∼0.2) of groundwater temperature-altitude correlation suggests the existence of other parameters that influence it, such as the groundwater level depth, the height of the water column above the probe (Egidio et al., 2022), the aquifer dimension including multiple water layers, water recharge and circulation paths.
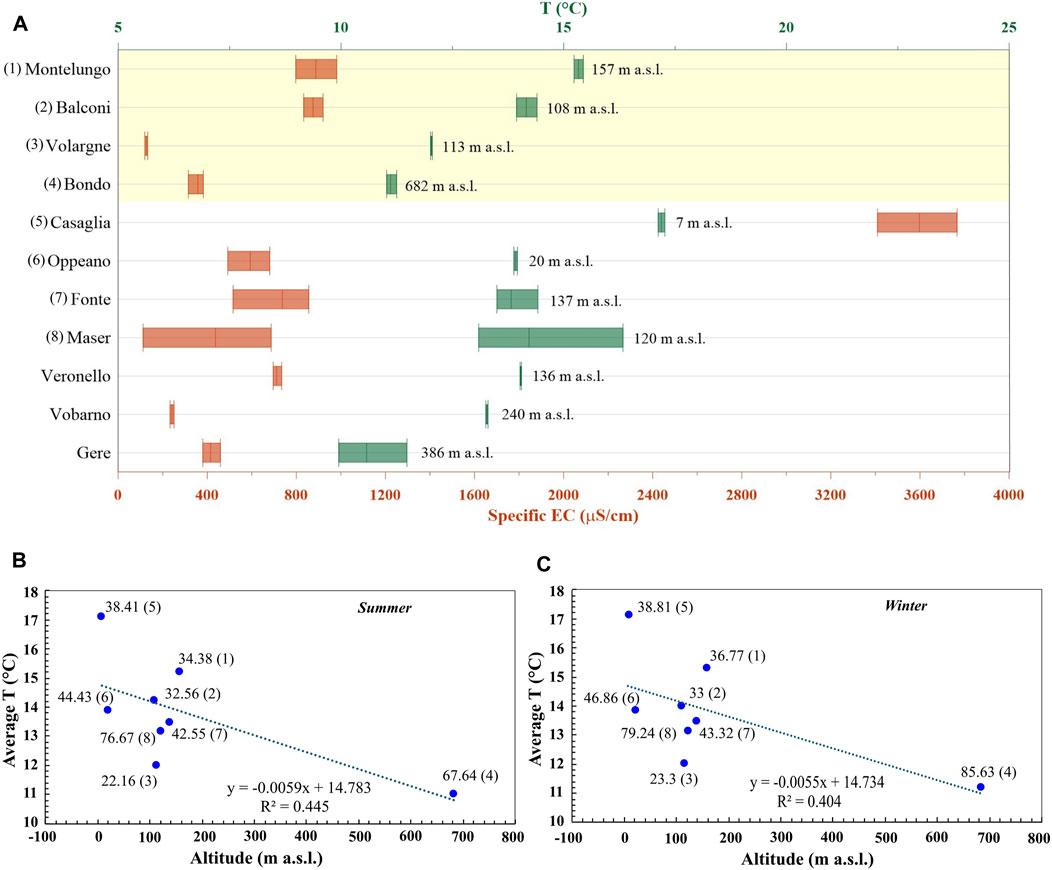
Figure 3. Panel (A) Groundwater temperature (green) and specific electrical conductance (red) ranges recorded at each site. Altitude is also reported alongside bar temperature. Thin line within each bar refers to the weighted average of the measure. The four most long-lived stations are presented first and highlighted by a light yellow background. Data of the other sites refer to ∼20 and ∼7 months of recordings at Casaglia and Oppeano, Fonte, Maser, respectively. Active monitoring stations are numbered from 1 to 8. Panel (B) Average groundwater temperature calculated for the month of July 2023 is plotted against site altitude. Labels refer to the mean water column above the sensor in July 2023. Numbers in brackets indicate the monitoring site according to the listing in Panel (A). Equation and determination coefficient of the linear trendline (dotted line) of plotted values are also reported. Panel (C) Average groundwater temperature calculated for the month of December 2023 is plotted against site altitude. Labels refer to the mean water column above the sensor in December 2023.
The variability of the specific electrical conductivity (recalculated at 25°C; ∼120 to 980 μS/cm; Figure 3A) is mainly ascribable to water-rock interaction coupled to the hydrological cycle, so to a balance between lithological differences and the temporal variations in the volume of water aquifer and circulation. Besides the four main sites, it is worth mentioning the Casaglia aquifer whose water shows much greater values of conductivity (∼3,400–3,800 μS/cm). This is presumably related to the mineralization included in the Sabbie di Imola formation, a Pleistocene deposit of transitional environment (delta and seashore), and/or to the presence of peaty layers characterizing the Casaglia aquifer (Amorosi and Pavesi, 2010; Farina et al., 2015).
In only 2 years of monitoring, it is not possible to identify and constrain long-term trends of water level variability in relation to a seasonal frequency, especially because 2022 and 2023 were characterized by strong differences in rain frequency and intensity. Nevertheless, a seasonality of aquifer recharge can be observed at Balconi and Volargne in which groundwater levels reach the maximum value at the end of summer/beginning of autumn (Figures 4A,B). Both are unconfined aquifers of the Verona high-plain basin characterized by the presence of conglomerate and gravels and sandy gravels (Figures 5A–C). Their recharge phase is the combination of rainfall and presumably irrigation inputs, as these two sites are within an agricultural area. Montelungo and Bondo miss a regular seasonality of the water level and display only one recharge phase in the last year of observation in concomitance to a significant increase in rain precipitations observed during 2023 (Figures 4C, D).
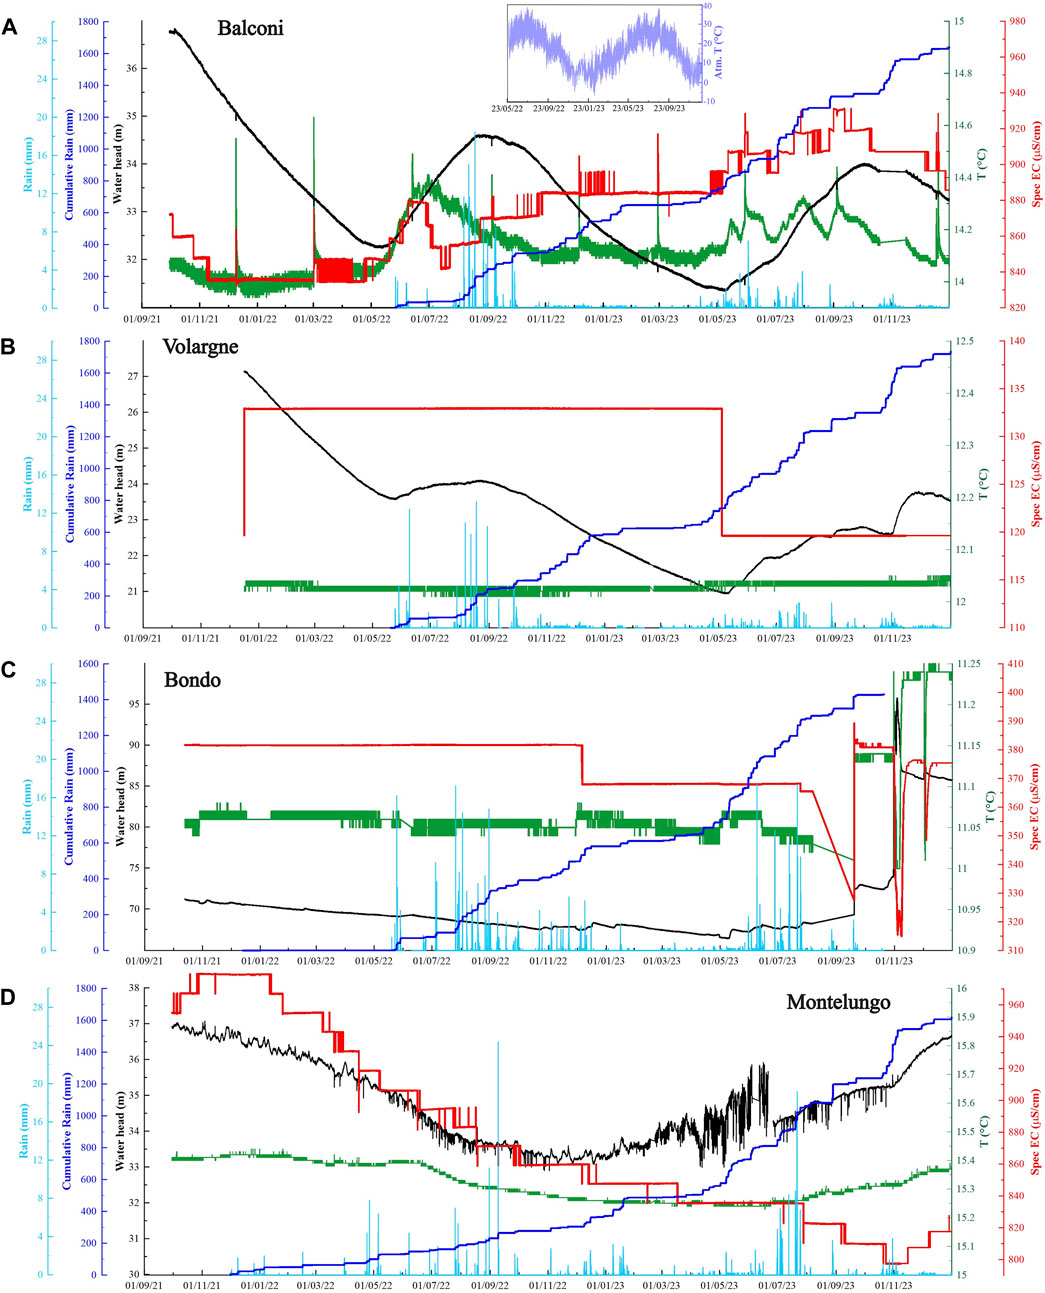
Figure 4. Groundwater level (black), temperature (green) and specific electrical conductivity (red) time-series for Balconi [Panel (A)], Volargne [Panel (B)], Bondo [Panel (C)] and Montelungo [Panel (D)]. Recorded rain (light blue) and calculated cumulative rain (blue) are also reported for each site. Bondo rain measurements are not available from middle October 2023 due to rain gauge technical issues. Miniature in Panel (A) shows atmospheric temperature time-series relative to Balconi site.
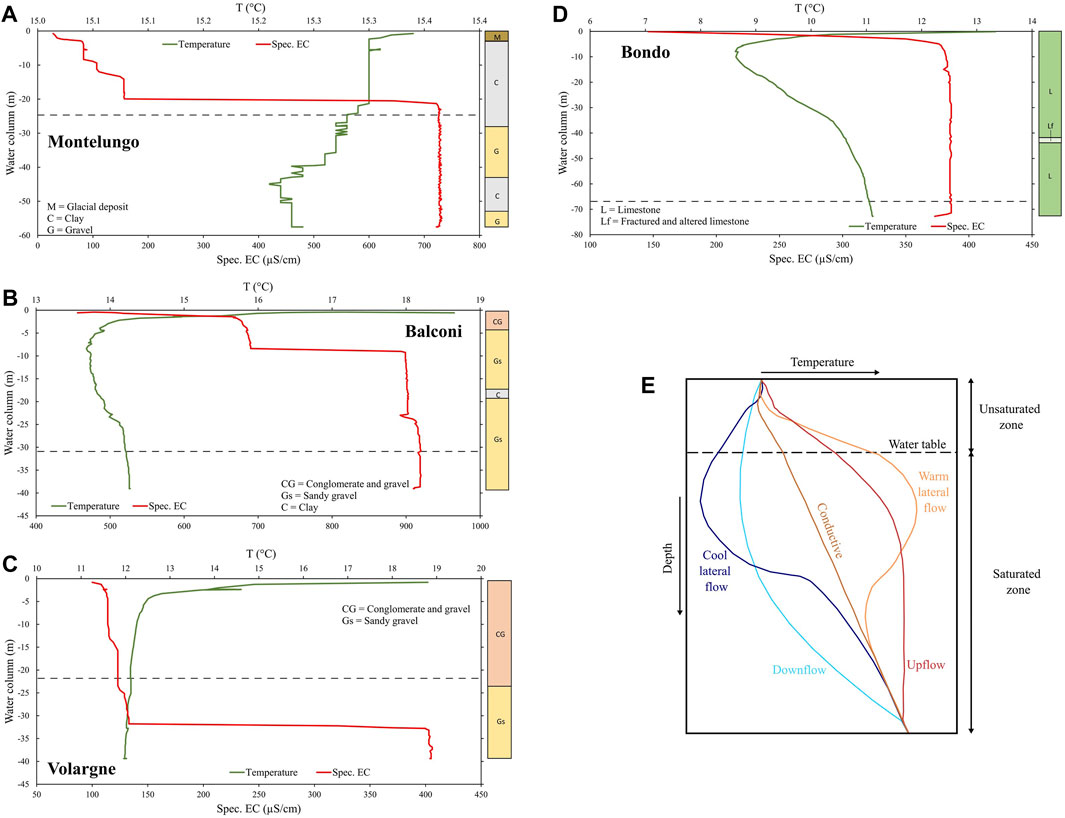
Figure 5. Temperature (green) and specific electrical conductivity (red) vertical profile of the water column of Montelungo [Panel (A)], Balconi [Panel (B)], Volargne [Panel (C)] and Bondo [Panel (D)] wells. The black dashed line indicates the corresponding installation depth of the diver. For each site the borehole stratigraphic column is reported. Panel (E) Different scenarios of groundwater temperature variation in depth (modified after Pepin et al., 2022).
4.2 Water column vertical profiles
Temperature variations with depth are indicative of groundwater flow occurring in the aquifer (Pepin et al., 2022). Bondo clearly show a cool lateral flow occurring approximately in the first 20 m of the water column where the temperature has an initial decrease before it gradually increases downwards (Figures 5D, E). Montelungo exhibits a different behavior with a slight decrease of temperature with depth. At ∼50 m there seems to be an inversion of the trend; however, the depth of the well does not allow to follow this change. Neither warm lateral flow nor groundwater upflow are recorded by the other sites.
As electrical conductivity is directly proportional to Total Dissolved Solids content (Clark, 2015), detected differences in vertical profile are indicative of groundwater layering. Overall, higher conductivity values are found at the bottom of the water column supporting a larger quantity of dissolved anions and cations and thus a greater density (Figure 5).
4.3 Radon time-series
Two years of radon data recorded at Bondo show a variability strictly dependent on the local seasonality. In particular, radon emissions tend to increase from April and start to gently decrease towards the end of the summer. The highest recorded value is 50,478 Bq/m3. From the beginning of autumn till the beginning of spring radon concentration decreases until ∼25–250 Bq/m3 (Figure 6A). The observed trend follows air temperature variability.
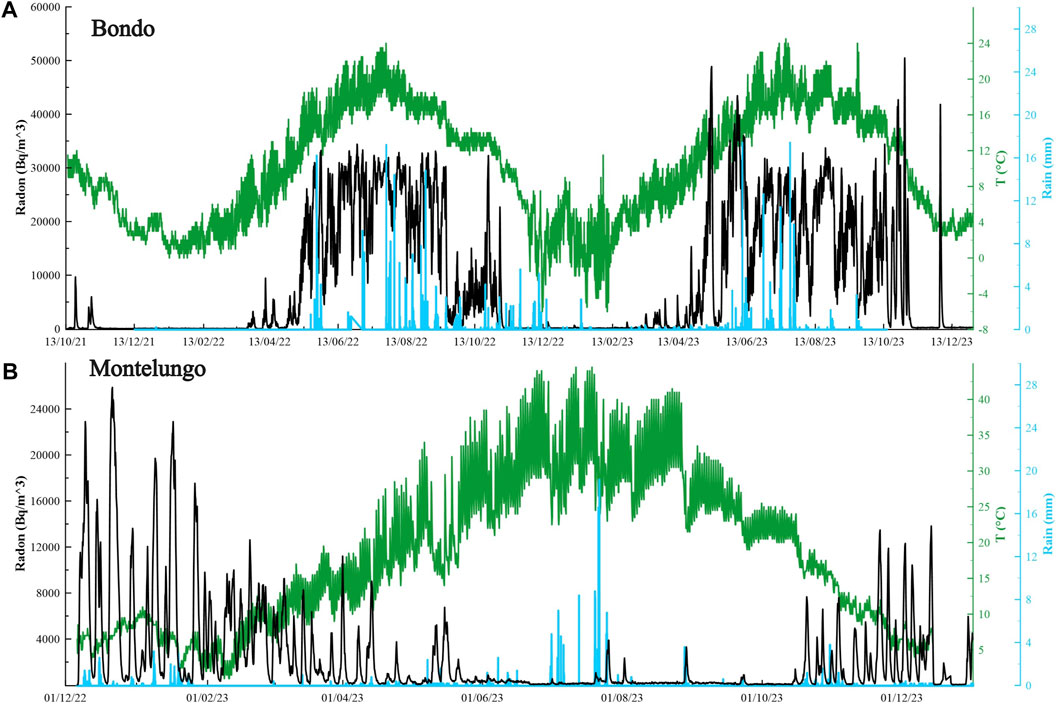
Figure 6. Air radon concentrations (black) time-series recorded at Bondo [Panel (A)] and Montelungo [Panel (B)]. Air temperature (green) and rain (light blue) are also reported.
Despite the shorter time series available (slightly less than a year), Montelungo radon emissions are higher in the winter season reaching up to ∼24,000 Bq/m3, while they progressively decrease towards summertime getting as low as ∼60 Bq/m3. This is an opposite trend compared to that reported for Bondo (Figure 6B). Similar heterogeneities among sites are known in the literature (e.g., D’Alessandro et al., 2020) and are ascribed to site-specific meteorological conditions (especially temperature and rainfall intensity; e.g., Piersanti et al., 2016) combined to lithological features (e.g., Groves-Kirkby et al., 2010), ground permeability changes and pre-rain moisture state (Piersanti et al., 2016).
Measured humidity does not influence radon concentrations at both sites, at least for the period of monitoring carried out until the time of preparation of this manuscript.
4.4 Soil CO2 flux data
Figure 7A shows the temporal variation of CO2 flux diffusing from soil at Salse di Nirano (Modena), starting from 27th September 2023. Daily oscillations of the flux can be observed in the time-series and are characterized by irregular amplitudes. Considering that the automatic station makes a measure every hour, to filter out this daily variability, a moving average at 24 points was calculated (superimposed red line). The averaged CO2 flux ranges from 2 to 27 g m−2 d−1. At least four changes in the flux regime could be identified in the time-series. In particular, the “d” regime seems influenced by the atmospheric pressure: a period of high atmospheric pressure favors low fluxes (Figure 7). This agrees with the barometric pumping effect reported by several authors in the literature (Wyatt et al., 1995; Auer et al., 1996; Martinez and Nilson, 1999; Camarda et al., 2019), which is founded on the principle of pressure equilibrium at the soil-air interface. Soil humidity decrease apparently promotes a flux increase in regime “c,” presumably due to greater soil pores no longer occupied by water molecules and thus enhancing greater CO2 flow. However, these are preliminary considerations taking into account the relatively short CO2 flux time-series. It is necessary to carefully evaluate the interplay with all the meteorological and soil parameters after at least 1 year of data.
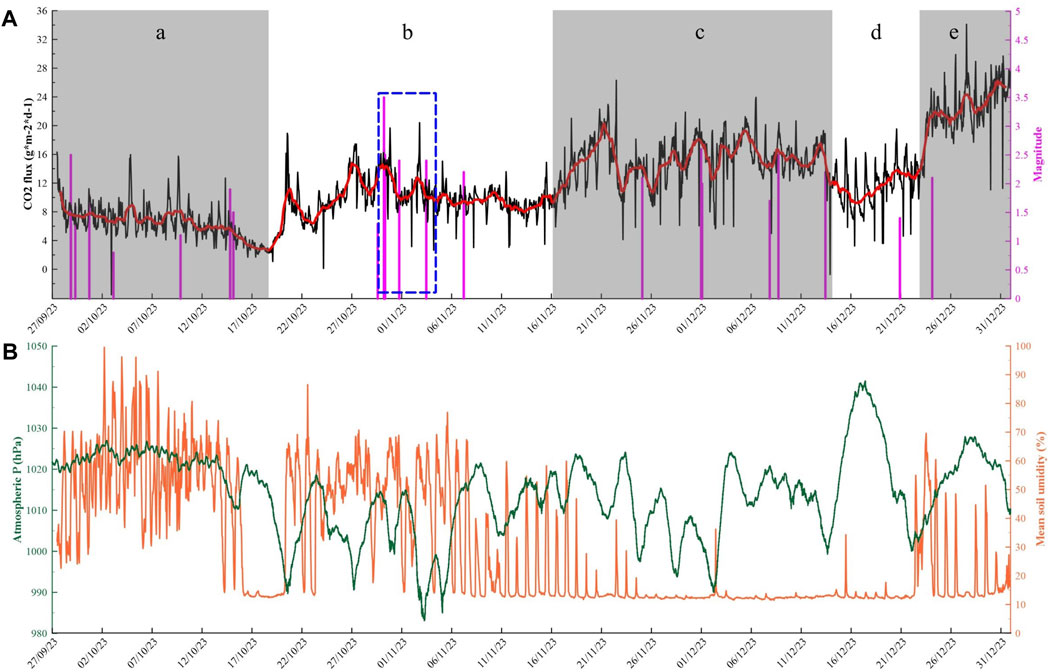
Figure 7. Panel (A) CO2 soil flux (black) time-series recorded at Nirano. The red line represents the running average calculated at 24 points. Distinct flux regimes are identified by lower case letters from “a” to “e.” Earthquakes occurred within a 30 km radius from the Salse di Nirano are reported in purple. The blue dashed rectangle highlights the seismic events from 30th October to 3rd November 2023. Panel (B) Variation of atmospheric pressure (green) and mean soil humidity (orange) measured on site.
4.5 Seismological data
The seismic monitoring aims to detect possible changes, especially in microseismicity of the area, focusing on the ground motion produced by small-magnitude, shallow-depth seismic events not usually recorded by the National Seismic Network (RSN, https://eida.ingv.it/it/networks/network/IV) of INGV. In this way, since September 2021 the selected multiparametric sites have been gradually equipped also of multichannel seismic stations. At present, data are now recorded by a total of 10 stations combined with 11 multiparametric sites (i.e., Maser and Fonte both refer to the IV.ASOL seismic station, Table 1). On the basis of the INGV earthquakes bulletin (https://terremoti.ingv.it), during the installation period, the seismic stations recorded a total of 252 events, with magnitude values spanning from 2.0 to 4.2. The highest magnitudes are recorded in cases of two events, both occurred near Ceneselli (Padano Veneto basin) on October 25th and 28th, 2023. The epicenters are localized 18 km NW from IV.FERS station (site 11) and 37 km SE from ZO.PDN9 station (site 10). In both cases the peak ground velocity (PGV) and acceleration (PGA) recorded at the closest station (i.e., IV.FERS) did not exceed the values of 0.5 cm/s and 10 gal, respectively. In general, the station that in the target period recorded the highest number of earthquakes (37 events, with magnitude from 2.0 to 3.5) is ZO.PDN10 (site 12), installed in the Regional Natural Reserve of Salse di Nirano (Northern Apennines).
In particular, from the end of 2021, the new PDnet installations (FDSN code ZO, yellow triangles in Figure 8) around the Garda Lake strengthened a development phase of the RSN (FDSN code IV, blue triangles in Figure 8) in the same area. Overall, the new installations made possible some tests about the minimum magnitude threshold of the area. The spatial variability of magnitude detection is estimated by comparing the average ambient noise levels at each recording site, with a synthetic spectrum computed by considering the ω-square source model (Brune 1970) for a distribution of hypocenters located at each node of a regular grid with step of 5 km in the inner zone of PDnet; magnitude values are considered in the range from 1.0 to 4.0, with step of 0.1. The seismic wave attenuation was introduced by considering a 1/R dependence of geometrical spreading, a frequency dependence of the quality factor estimated for the area by Castro et al. (2008) and a constant k-value of 0.06 (Augliera et al., 2010). Earthquakes are assumed to be detected by the network when the signal-to-noise ratio, computed in the frequency range 1–10 Hz, is larger than 10 at least for three stations. With respect to the evidence reported in Augliera et al. (2010), the new station configuration allows to decrease the minimum magnitude threshold from about 2.0 to 1.7, at least in the central and northern area of Garda Lake and surroundings. On the contrary no improvements are observable at the limit with the Padano-Veneto alluvial basin, where the high value of the cultural noise does not allow to decrease the minimum detectable magnitude threshold also considering the new installation.
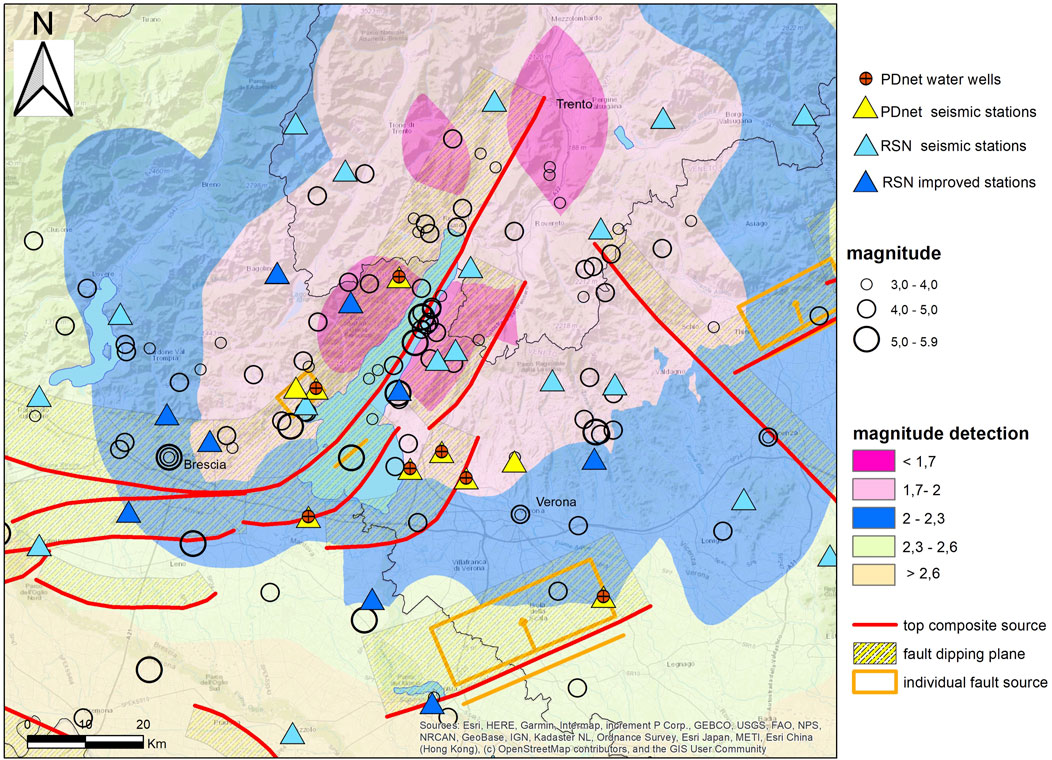
Figure 8. Magnitude detection threshold for Garda Lake area. Map also shows the instrumental INGV seismic bulletin of the area (https://terremoti.ingv.it/), both ZO (yellow) and IV (blue) seismic stations and water wells monitoring stations installed in the recent years around Garda Lake and the seismogenic sources deduced from DISS database (https://diss.ingv.it/).
In order to appreciate possible advantage of borehole installation in sites characterized by high level of cultural noise, the ZO.PDN9 6-channels borehole station (FBA-accelerometer and 120s broad band velocimeter) is installed at Oppeano multiparametric site (see Table 2) at depth of 150m, co-located with the surface IV.OPPE RSN station. Seismic noise levels recorded by borehole instruments depend on many factors, such as the installation depth, the subsurface geology of the recording site, and the type of ambient noise produced by human activities that characterize the installation area. Comparisons at Oppeano site are made in the frequency band 0.01–45 Hz (Figure 9), where the surface station is characterized by an average level of velocity power spectral density (PSD) of −125 dB; the co-located borehole station, allows to reduce the recorded average ambient noise down to about −140 dB, moreover decreasing the influence of possible temperature excursion and both of daily and seasonal variability (e.g., Marzorati and Bindi, 2006). In particular, in Figure 9 it is possible to appreciate the relevant difference in the frequency range 1–20 Hz between borehole and surface stations, where the latter is characterized by mean PSD levels about 10 dB higher with respect to the relative recorded at depth of 150 m. The consequences are evident in case of local earthquake recordings, where just in case of borehole installation the spectra of the target events greatly exceed the ambient noise level also in case of low magnitude events (Figure 9, left panels).
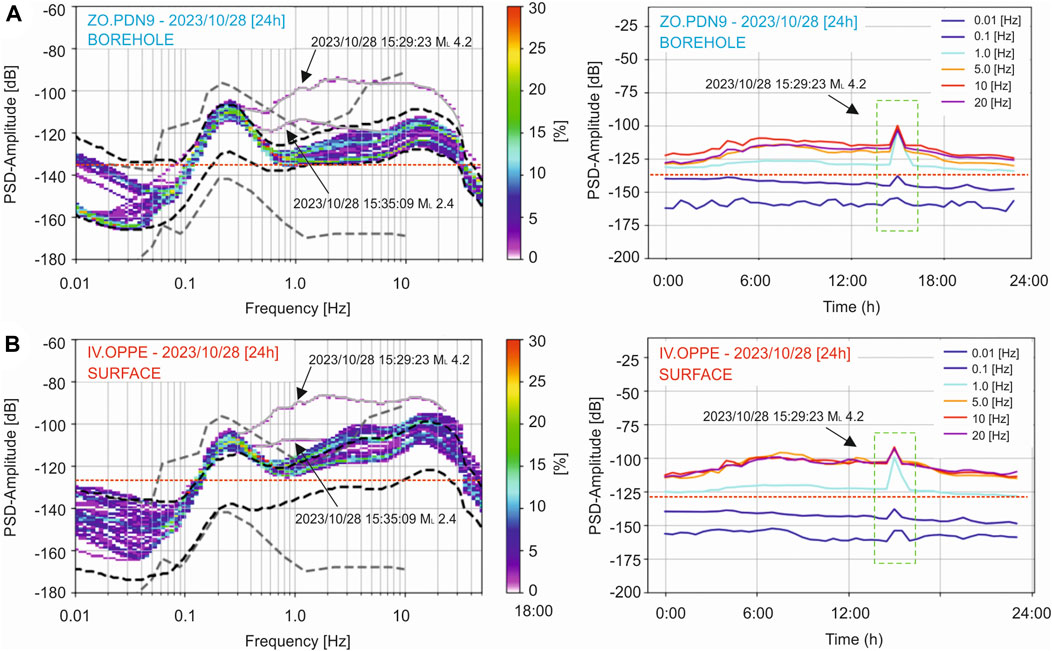
Figure 9. Ambient noise level recorded at co-located stations of Oppeano: (A) and (B) panels show the borehole station ZO.PDN9 and the surface station IV.OPPE, respectively. Left panels show the Probability Density Functions (PDFs), while in the right panels the PSDs (Power Spectral Density) are shown for several frequency intervals. All panels show the comparisons between the ambient noise levels and both the 28/10/2023 (15:29:23 UTC) ML 4.2 and the 28/10/2023 (15:35:09 UTC) ML 2.4 events occurred 36 km SE of Oppeano. In the left panels the black dotted lines show the low and high ambient noise models calibrated by Peterson (1993).
5 Discussion
5.1 An example of data analysis
Data acquired by multiparametric stations are mainly targeted on detection of the response to local stress fields. Prior to do this, it is fundamental to determine for each site and each variable (i.e., groundwater parameters, radon concentrations, CO2 soil fluxes) the variations linked to other environmental phenomena, as for instance meteorological conditions and tidal effects, as well as to anthropogenic disturbances. Once all these alterations are filtered from the original signal, potential earthquake-related modifications should be detected more easily.
As a rigorous evaluation of the time-series of all the sites is not the main focus of the present article and it is worthy of a separate paper, here we only introduce an example of statistical analysis applied on Balconi groundwater level time-series. We have chosen this site for several reasons: i) it has one of the longest records, ii) its dataset contains a limited number of missing data and iii) it shows some peculiarities, as it will be discussed below. Temperature and electrical conductivity gave no significant results and are not considered here. The workflow implemented on Balconi time-series can be generalized and applied to other sites.
Figure 10A shows the water level profile h and the difference in groundwater level (Δh) calculated over the entire acquisition period. It results that the aquifer seasonal oscillation is smoothed, and minor changes are enhanced and displayed as peaks. Local variations of ∼12–16 cm are observed approximately every 3 months. An outlier detection tool allows automatic location of these peaks, which were also labelled by yellow stars in the water level profile h. These peaks correspond to decrease in groundwater level that are ascribable to water pumping, as confirmed by the owners of the water well. Thus, this kind of time-series analysis is efficient in detecting anthropogenic activity.
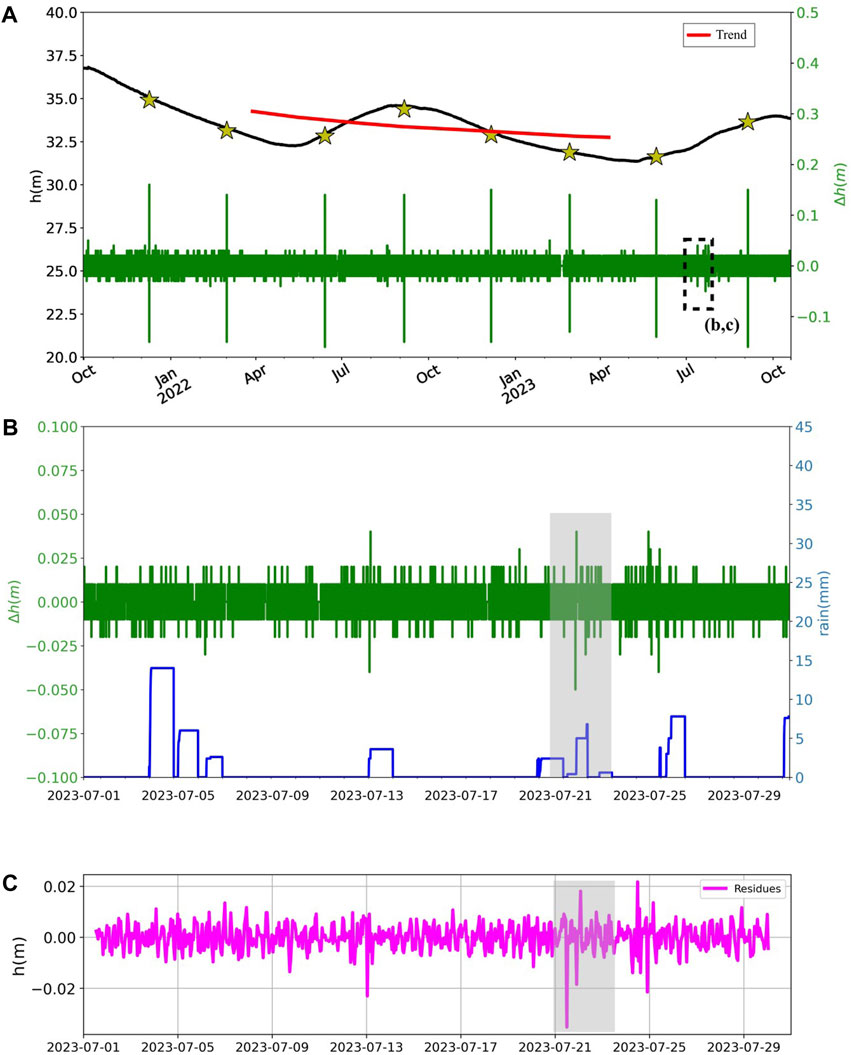
Figure 10. Panel (A) Balconi groundwater level time-series (black) from October 2021 to October 2023. The red line represents the level trend obtained by means of statistical analysis. Yellow stars correspond to the major peaks (outliers) displayed by the difference in groundwater level (green). The black dashed rectangle highlights the period (July 2023) detailed in Panel (B) and (C). Panel (B) Difference in groundwater level (green) and daily cumulative rain (blue) in July 2023. Panel (C) Groundwater level residual signal obtained by means of statistical analysis (see the text for further explanations).
As a further step, these anomalies are removed, and other secondary peaks are identified. Many of these are attributable to rainfall events, as shown in a detail of Figure 10B (light grey rectangle).
Two years of groundwater level recording at Balconi site (Figure 10A) highlights a trend of seasonal recharge-discharge of the aquifer coupled to a general aquifer depletion. As soon as the time series will be long enough, a statistical approach will allow a more rigorous study of this long-term periodicity. Nevertheless, a short-term study of the periodical signal (signal decomposition) has been performed by setting different periods. At the scale of month, a well-defined periodicity has not been found. A longer time-series is needed to verify the existence of seasonal periodicities. Figure 10C shows the residual signal [R(t) = Y(t) − T(t) − S(t), see Eq. (2) in Section 3.1)] calculated for July. In more detail R(t) has been calculated using an STL decomposition for a periodicity of 12 h (ideally corresponding to a tidal signal) and assuming the additive signal. Some of the peaks represents the aquifer response to rainfall (for instance, the light grey rectangle in Figure 10C), as also evidenced by the signal differences (Δh) in Figure 10B. Additional environmental factors could explain the other peaks and a further analysis is required.
This example has been willing to test the combined application of different time-series analysis techniques to identify both natural- and human-induced variations, also at different scales of observation. The future goal of our research will be to extract the signal cleared of all these variations induced by exogenous processes and investigate it from a statistical point of view to look for seismogenic-induced alterations.
5.2 Preliminary observations
We made a few observations we consider worthy of note, as well as of a future in-depth study, to give an idea of the potential of the available data.
5.2.1 Correlation between meteorological and groundwater parameters
Among meteorological factors, rainfall is the main one potentially promptly influencing all three monitored groundwater parameters. Besides triggering groundwater level rise, atmospheric precipitation can change the water temperature and its electrical conductivity (rainfall EC < 200 μS/cm). The rate at which a rainfall event influences these parameters depends also on the hydrogeological basin extent, the amount of precipitation on the aquifer recharge area, the extent of the recharge area, the distance between the monitored well and the recharge area and the degree of confinement of the aquifer. In this context, for instance, a deep confined aquifer far from the recharge zone and/or pertaining to a large hydrogeological basin would register little and delayed variations in monitored parameters compared to a phreatic aquifer having direct rainfall infiltration and limited hydrogeological basin extent.
Aquifer response to comparable amounts of precipitation in the same period varies among sites. Figure 11 shows an example of groundwater recordings related to the meteorological event of 9th–11th May 2023. A slow and gentle rise in water level and temperature at Balconi is opposed to a quick (few hours) and sharp increase in water level and temperature and decrease in electrical conductivity at Maser (Figures 11A,B). The latter aquifer exhibits a high sensibility to rainfall inputs supposedly due to the fractured sandstone and the specific fracture configuration of Maser aquifer. This agrees with the proved high hydraulic conductivity of fractures (Kohut et al., 1984; Miles and Novakowski, 2016). Similarly, Fonte shows rapid water level rise (Figure 11C). In this case, the quick response is due to the very shallow depth to water (less than 8 m), to the high permeability of the gravels constituting this aquifer and to its unconfined nature. The high sensibility of Maser and Fonte aquifers to rainfall inputs is also evidenced by the extremely variable temperature and conductivity records (Figure 3A) not observed in the other sites. Bondo is an example of water level variation in response to precipitation not coupled with temperature and conductance modifications (Figure 11D). It represents a fractured aquifer, but unlikely Maser its water table increase is slower, probably due to a different fractures’ connection and/or to a lesser hydrogeological basin extent.
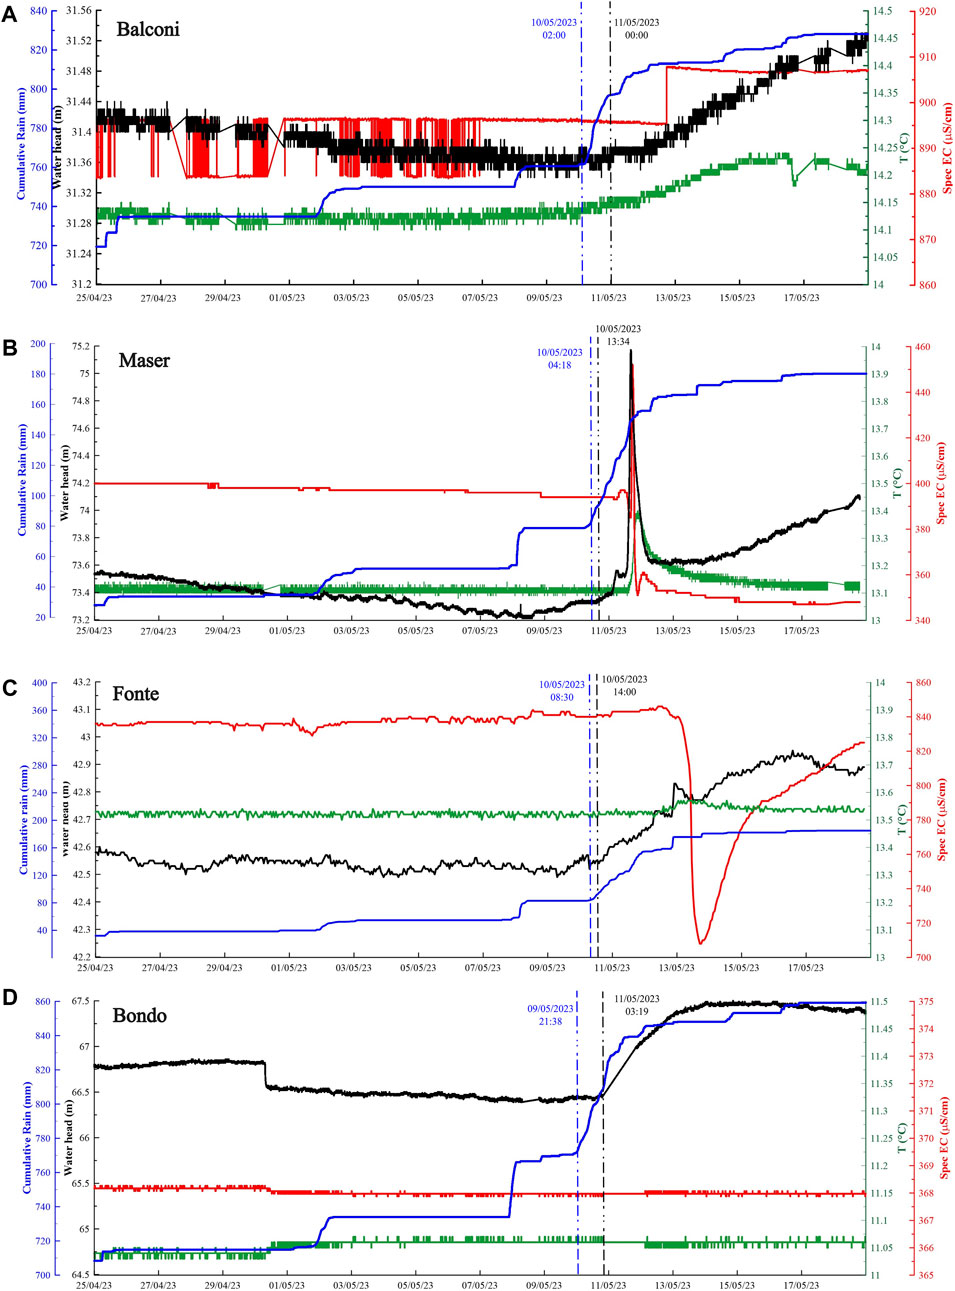
Figure 11. Groundwater level (black), temperature (green) and specific electrical conductivity (red) time-series for Balconi [Panel (A)], Maser [Panel (B)], Fonte [Panel (C)] and Bondo [Panel (D)]. Calculated cumulative rain (blue) is also reported for each site. The blue dashed line indicates the beginning of the strong rainfall event. The black dashed line indicates the beginning of groundwater raising.
Atmospheric temperature is proven to affect groundwater temperature, especially in shallow aquifers (up to ∼20 m depth; Lee and Hahn, 2006; Taylor and Stefan, 2009; Menberg et al., 2014). Monitoring sites having at least 1 year of recordings are considered to analyze groundwater temperature seasonal oscillations and correlation to air temperature. As shown in Figure 4, groundwater temperature is essentially constant in all the studied stations except for Balconi. This one displays a nearly seasonal variation characterized by maximum values reached in June-July and minima in December-January, in agreement with the measured air temperature periodicity (see miniature in Figure 4A). The absence of seasonality in Bondo, Montelungo and Volargne groundwater temperatures could be explained by the height of the water column above the sensor that minimizes temperature variations (Bucci et al., 2020; Egidio et al., 2022) coupled to the volume of the aquifer and its degree of confinement. Since Balconi aquifer has features similar to the Volargne one and higher water column, the observed temperature periodicity could be mostly influenced by agronomic watering coupled to the local hydrogeological conditions (extension of recharge zone and/or volume of water income), as also suggested by the more pronounced water level seasonal variation displayed by Balconi.
Despite the extremely low depth to water of Casaglia aquifer (3.5 m below ground level), its temperature does not show significant variations over the year. Atmospheric temperature is not apparently influencing this shallow aquifer and the reason must be found in the installation depth of the sensor (the higher the water column above the diver, the more the temperature fluctuations are dampened; Bucci et al., 2020; Egidio et al., 2022) coupled to the semi-confined nature of the aquifer which does not provide a direct groundwater-atmosphere interface.
5.2.2 Evidence of modification in groundwater circulation
A very interesting comment concerns Bondo site and aquifer, where on the 1st November 2023 the groundwater level has surged of ∼20 m. This increase was likely induced by intense rainfall that occurred in concomitance of this variation, as also proven by the diminishing temperature and electrical conductivity (Figure 12). However, it must be mentioned that before this variation, since the installation of this station, we have never recorded any water level variation in response to rainfall, with a general trend of water level decrease from ∼71 to ∼68 m (Figure 5). As the variation is incredibly high, other explanations should be invoked. During this period of intense rainfall, many landslides affected the area, as reported by the local media. In particular, as shown in Figure 12, the seismic station of Bondo (ZO.PDN3) starting from about the 20:00 UTC on 30 October 2023, shows a clear transient recorded on all three components of motion, with very long duration (some hours), amplitude values higher with respect the ambient noise level usually recorded (the Peak Ground Velocity, PGV was equal to 0.01 cm/s, comparable to a local earthquake with magnitude ranging from 2.5 to 3.0), high frequency content, in general ranging from 5 to 30 Hz and a strong polarization effect, with a preferential amplification of motion along the NS direction. In this case, the recorded data of ZO.PDN3 are attributable to local landslides that occurred from 30th and 31st October 2023, following strong rainfall phenomena. Thus, a landslide could have modified the volume/extent of the monitored aquifer, eventually the water flow infiltration, by influencing the water level and leading the aquifer to be more sensitive to meteorological events level. Alternatively, as Bondo represents a fractured aquifer, the envisaged rainfall-related phenomena could have modified the aquifer fracture network, inducing an hydraulic connectivity reduction and thus an extreme water level rise in the monitored well.
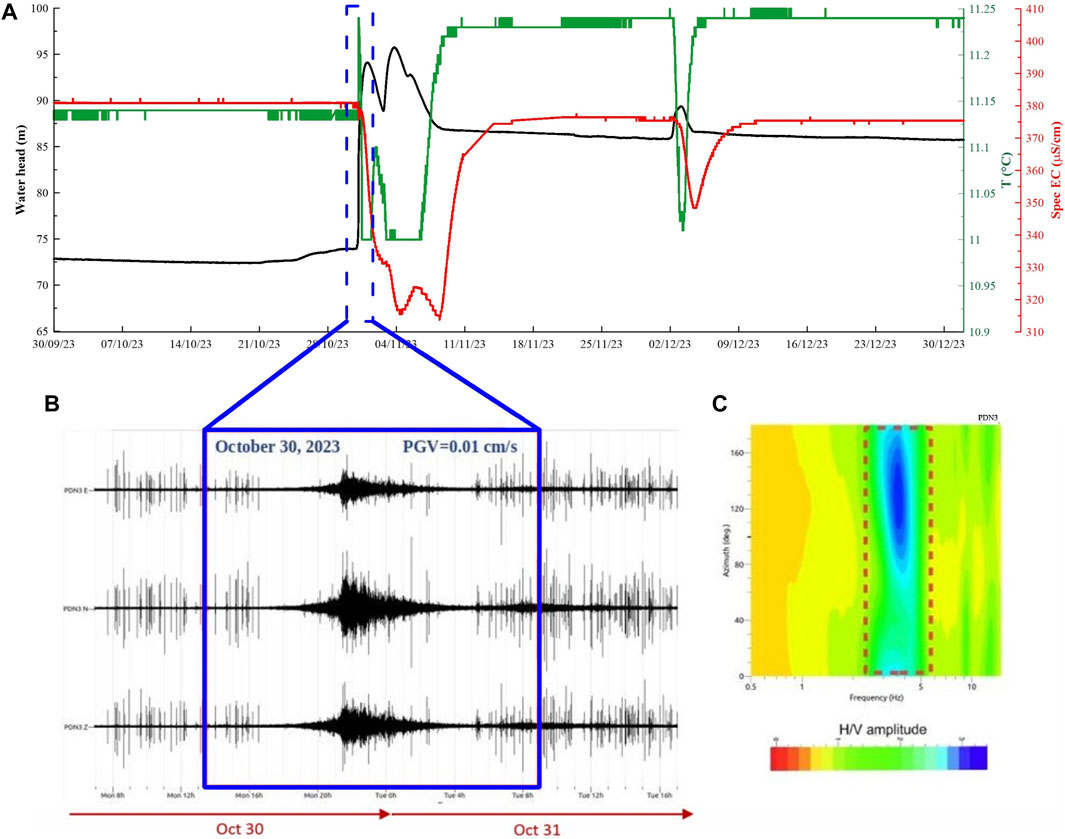
Figure 12. Panel (A) Detail of Bondo quick groundwater level raise, temperature and specific electrical conductivity perturbations due to intense rainfall event. Panel (B) Transient signal recorded on all three components of motion of Bondo seismic station. Panel (C) Directional ambient noise HVSRs. The red dashed rectangle highlights the preferential amplification of motion.
5.2.3 Groundwater response to teleseism
Outstanding variations of monitored parameters were not yet observed in concomitance of earthquake events occurred near (within 10 km) a specific multiparametric station location. In particular, the strongest seismic events of Ceneselli (RO) (25th and 28th October 2023; magnitude 4.2, https://terremoti.ingv.it/en) and of Modena province (June–October 2023; magnitude 3–3.5) did not significantly affect Casaglia and Nirano sites, respectively. However, sporadic peculiar changes were observed in the occasion of some strong earthquakes (M ≥ 7.5) occurred around the world. The Turkey seismic sequence that took place on the 6th February 2023 was characterized by two main events of magnitude 7.9 (at 01:17, UTC time) and 7.5 (at 10:24, UTC time). Balconi groundwater level has shown unusual oscillations up to 8 cm in width approximately 1 hour after both quakes (Figure 13A). The same site experienced a drop in the water level of about 3 cm, following the Philippines earthquake of magnitude 7.5 (2nd December 2023, 14:37 UTC time). As confirmation of this, a similar behavior is displayed by Volargne aquifer (Figures 13B,C). Comparable groundwater responses to teleseism (i.e., a tremor associated with an earthquake occurred over 1,000 km away; Anderson et al., 2007) are reported in the literature for other Italian sites. Barberio et al. (2020) described several water level variations of two boreholes located close to Popoli (Pescara province, Central Italy), mainly related to events with MW ≥ 7.6 occurred between July 2014 and December 2019. Here, the groundwater response to teleseism is ascribed to the passage of Rayleigh seismic waves, which cause volume changes of the aquifer. The size of the variations is in the range of centimeters within a short time span, in accordance with our observations. The eventual absence of groundwater level alterations is explained by the authors with low ground velocity variations and/or low monitoring frequency (5 min) of their probes incapable of detecting high-frequency signals.
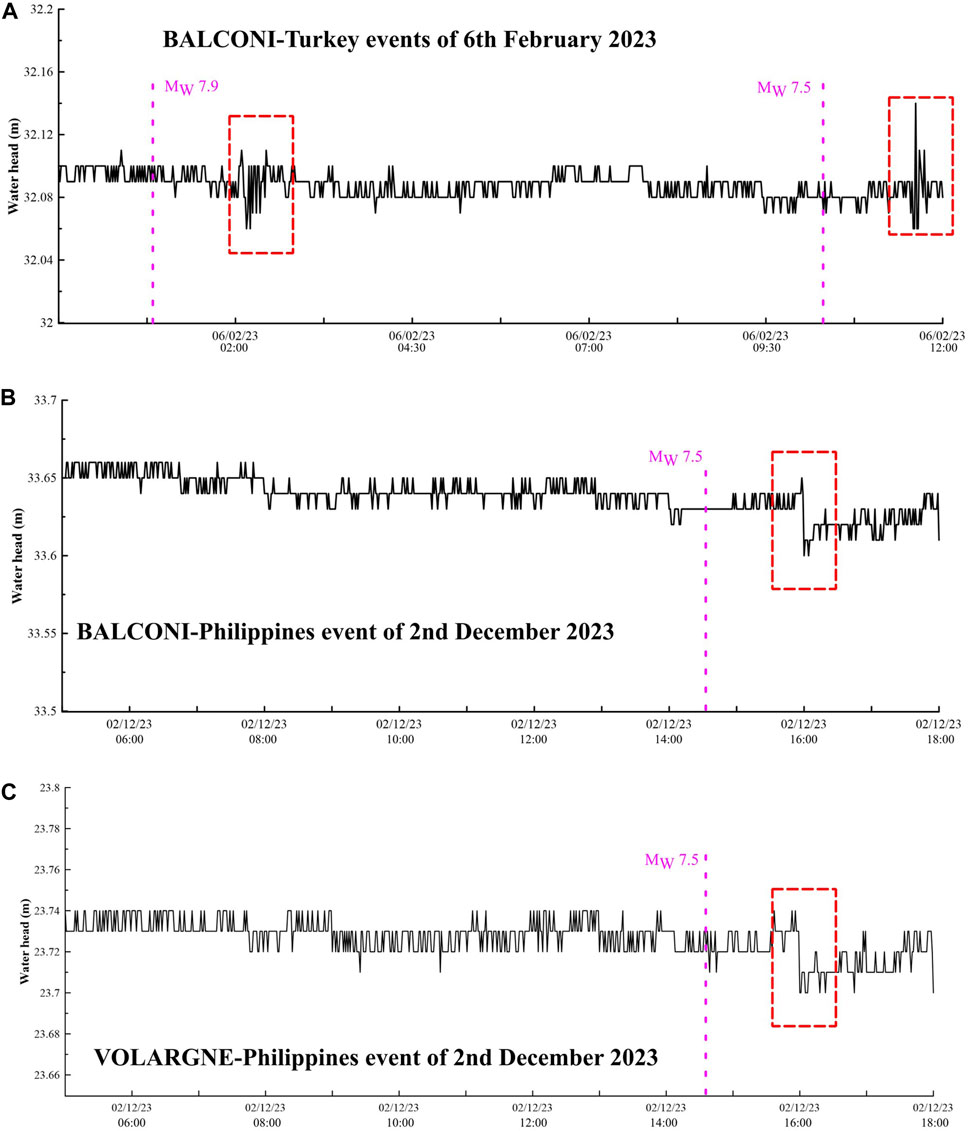
Figure 13. Panel (A) Balconi groundwater level (black) perturbations (red dashed rectangles) in concomitance with the Turkey seismic events occurred on 6th February 2023 (purple lines). Panel (B) Balconi groundwater level (black) perturbation (red dashed rectangle) in concomitance with the Philippines seismic event occurred on 2nd December 2023 (purple lines). Panel (C) Volargne groundwater level (black) perturbation (red dashed rectangle) in concomitance with the Philippines seismic event occurred on 2nd December 2023 (purple lines).
5.2.4 Monitoring of a mud volcano field
The monitoring performed at the Salse di Nirano site is aimed at investigating the behavior of the peculiar fluid emissions (mud and CO2 soil flux) in connection with the local seismic activity. The monitoring in such a framework could also serve as a warning system for the community in case of particularly intense eruptions. As a sad example, the mud volcano eruption occurred in 2014 at the Maccalube di Aragona (Agrigento, Sicily) caused the death of two children (e.g., Gattuso et al., 2021). The violent eruption of LUSI (Indonesia) mud volcano consisted in boiling mud and steam ejected several meters above the crater. Fortunately, there were no victims, but the event, that lasted from May to December 2006, caused tens of thousands of people to move away from their houses as the mud flows covered about 7 km2 (Mazzini et al., 2007).
Over the ∼3 months monitoring period reported in this work, 27 earthquakes took place within a 30 km radius from the Salse di Nirano site. The majority have magnitude < 2.5. The most energetic event of magnitude 3.5 occurred on the 30th October 2023 at 05:25 (UTC, https://terremoti.ingv.it/en). The monitored mud pool did not show significant and unambiguous level, temperature and electrical conductivity variations. Noteworthy, a CO2 flux peak was recorded in concomitance of the seismic event, in the framework of the flux regime B (see the red line in the blue box of Figure 7A). During this period a series of earthquakes concentrated near Castellarano (MO), within less 10 km from the Salse di Nirano. A relationship between intensification of seismic activity in a restricted area and variation in CO2 soil fluxing could be raised. However, prior to this, it is fundamental to verify the CO2 flux correlation with meteorological and soil parameters over at least 1 year of recordings to exclude and filter out changes not linked to the tectonic activity.
6 Conclusion
The complex interaction between local tectonics and crustal fluids dynamics arises the need for focused monitoring of all involved parameters. For this purpose, here we propose a new approach that consists of multiparametric stations boast a geographical extent covering distinct environments (plain, hilly and mountainous regions) and geological conditions. The continuous near real-time monitoring allows simultaneous comparison of different kind of recorded signals (groundwater, seismic, meteorological, soil gas fluxes and concentrations), thus acting as a major tool for earthquake-related research.
The collected data have a far greater importance as they can be used also for multidisciplinary studies. For instance, groundwater records could give information on the aquifer storage capacity and its variation over time, fundamental for the local freshwater management. In addition, their coupling to meteorological records is a valuable tool for studying climate-change impacts.
Data availability statement
The datasets presented in this study can be found in online repositories. The names of the repository/repositories and accession number(s) can be found below: https://muda.mi.ingv.it/.
Author contributions
EF: Conceptualization, Data curation, Investigation, Writing–original draft. MM: Conceptualization, Data curation, Investigation, Methodology, Writing–review and editing. SL: Conceptualization, Data curation, Investigation, Writing–review and editing. FM: Formal Analysis, Software, Writing–review and editing. AR: Conceptualization, Data curation, Investigation, Methodology, Writing–review and editing.
Funding
The author(s) declare that financial support was received for the research, authorship, and/or publication of this article. INGV institutional fundings.
Acknowledgments
We would especially like to thank Lucia Luzi (INGV-Milano) for her support in the multiparametric project and for her scientific advices. A particular thanks to all people who contributed to the site search phase and the installation of multiparametric stations described in this paper. In particular: Tullia Bonomi (Milano Bicocca University), Ing. Michela Biasibetti and Ing. Bruno Pannuzzo (Acque Bresciane company), Ing. Massimo Carmagnani and Ing. Ignazio Leone (Acque Veronesi company), Ing. Giovanni Lepore and Fabrizio Brunello (Azienda Gardesana Servizi company), Ing. Paolo Pizzaia (Alto Trevigiano Servizi company), Arch. Luca Bertanza (municipality of Tremosine Garda, BS), Arch. Umberto Minuta (municipality of Dolcè, VR), Geom. Elena Beraldini (municipality of Negrar, VR), Marzia Conventi (municipality of Fiorano Modenese, MO - Dir. Riserva Salse di Nirano), Luca Martelli and Paolo Severi (Emilia Romagna Region). We would like to thank all the colleagues of the INGV sections and offices who contribute daily to the management of the National Seismic Network, as well as providing access to the data they produce.
Conflict of interest
The authors declare that the research was conducted in the absence of any commercial or financial relationships that could be construed as a potential conflict of interest.
The author(s) declared that they were an editorial board member of Frontiers, at the time of submission. This had no impact on the peer review process and the final decision.
Publisher’s note
All claims expressed in this article are solely those of the authors and do not necessarily represent those of their affiliated organizations, or those of the publisher, the editors and the reviewers. Any product that may be evaluated in this article, or claim that may be made by its manufacturer, is not guaranteed or endorsed by the publisher.
Supplementary material
The Supplementary Material for this article can be found online at: https://www.frontiersin.org/articles/10.3389/feart.2024.1412900/full#supplementary-material
References
Amorosi, A., and Pavesi, M. (2010). Aquifer stratigraphy from the middle-late Pleistocene succession of the Po Basin. Mem. Descr. Carta Geol. D’it. XC, 7–20.
Anderson, D. N., Fagan, D. K., Tinker, M. A., Kraft, G. D., and Hutchenson, K. D. (2007). A mathematical statistics formulation of the teleseismic explosion identification problem with multiple discriminants. B. Seismol. Soc. Am. 97 (5), 1730–1741. doi:10.1785/0120060052
Antolini, G., Auteri, L., Pavan, V., Tomei, F., Tomozeiu, R., and Marletto, V. (2016). A daily high-resolution gridded climatic data set for Emilia-Romagna, Italy, during 1961–2010. Int. J. Climatol. 36, 1970–1986. doi:10.1002/joc.4473
Auer, L. H., Rosenberg, N. D., Birdsell, K. H., and Whitney, E. M. (1996). The effects of barometric pumping on contaminant transport. J. Contam. Hydrol. 24 (2), 145–166. doi:10.1016/S0169-7722(96)00010-1
Augliera, P., D’Alema, E., Marzorati, S., and Massa, M. (2010). A strong motion network in northern Italy: detection capabilities and first analysis. Bull. Earthq. Eng. 8, 1091–1104. doi:10.1007/s10518-009-9165-y
Baena, C. L., Andreo, B., Mudry, J. C., and Cantos, F. (2009). Groundwater temperature and electrical conductivity as tools to characterize flow patterns in carbonate aquifers: The Sierra de las Nieves karst aquifer, southern Spain. Hydrogeol. J. 17, 843–853. doi:10.1007/s10040-008-0395-x
Barberio, M. D., Barbieri, M., Billi, A., Doglioni, C., and Petitta, M. (2017). Hydrogeochemical changes before and during the 2016 Amatrice Norcia seismic sequence (central Italy). Sci. Rep. U. K. 7 (11735), 1–12. doi:10.1038/s41598-017-11990-8
Barberio, M. D., Gori, F., Barbieri, M., Billi, A., Caracausi, A., De Luca, G., et al. (2020). New observations in Central Italy of groundwater responses to the worldwide seismicity. Sci. Rep. U. K. 10, 17850–1. 10. doi:10.1038/s41598-020-74991-0
Barbieri, M., Boschetti, T., Barberio, M. D., Billi, A., Franchini, S., Iacumin, P., et al. (2020). Tracing deep fluid source contribution to groundwater in an active seismic area (central Italy): a combined geothermometric and isotopic (δ13C) perspective. J. Hydrol. 582, 1–11. doi:10.1016/j.jhydrol.2019.124495
Barnes, I., Irwin, W. P., and White, D. E. (1978). Global distribution of carbon dioxide discharges, and major zones of seismicity. U.S. Geol. Surv. Water-Resources Investig. Open-File Rep.
Baroni, C. (2017). “Lake Garda: an outstanding archive of Quaternary geomorphological evolution,” in Landscape and landforms of Italy. World geomorphological landscapes Editors M. Soldati, and M. Marchetti (Springer). doi:10.1007/978-3-319-26194-2_14
Bertotti, G., Picotti, V., Bernoulli, D., and Castellarin, A. (1993). From rifting to drifting: tectonic evolution of the South-Alpine upper crust from the Triassic to the early Cretaceous. Sediment. Geol. 86 (1–2), 53–76. doi:10.1016/0037-0738(93)90133-P
Bigi, G., Costantino, D., Parotto, M., Sartori, R., and Scandone, P. (1990). “Structural model of Italy,” in Firenze, società elaborazioni cartografiche (S.EL.CA.), consiglio Nazionale delle ricerche progetto finalizzato geodinamica. Scala 1:500.000, 9 Fogli.
Bonini, M. (2008). Elliptical mud volcano caldera as stress indicator in an active compressional setting (Nirano, Pede-Apennine margin, northern Italy). Geology 36, 131–134. doi:10.1130/G24158A.1
Boschetti, T., Barbieri, M., Barberio, M. D., Billi, A., Franchini, S., and Petitta, M. (2019). CO2 inflow and elements desorption prior to a seismic sequence, Amatrice-Norcia 2016, Italy. Geochem. Geophy. Geosy. 20, 2303–2317. doi:10.1029/2018GC008117
Bräuer, K., Kämpf, H., Strauch, G., and Weise, S. M. (2003). Isotopic evidence (3He/4He, 13CCO2) of fluid-triggered intraplate seismicity. J. Geophys. Res. 108 (B2), 1–11. doi:10.1029/2002JB002077
Bucci, A., Lasagna, M., De Luca, D. A., Acquaotta, F., Barbero, D., and Fratianni, S. (2020). Time series analysis of underground temperature and evaluation of thermal properties in a test site of the Po plain (NW Italy). Environ. Earth Sci. 79, 185. doi:10.1007/s12665-020-08920-9
Bucci, F., Santangelo, M., Fongo, L., Alvioli, M., Cardinali, M., Melelli, L., et al. (2021). A new digital lithological Map of Italy at 1:100.000 scale. PANGAEA. doi:10.1594/PANGAEA.935673
Camarda, M., De Gregorio, S., Capasso, G., Di Martino, R. M. R., Gurrieri, S., and Prano, V. (2019). The monitoring of natural soil CO2 emissions: issues and perspectives. Earth-Sci. Rev. 198, 1–14. doi:10.1016/j.earscirev.2019.102928
Castaldini, D., Valdati, J., Ilies, D. C., Chiriac, C., and Bertogna, I. (2005). Geo-tourist map of the natural reserve of Salse di Nirano (Modena Apennines, Northern Italy). Italian J. Quat. Sci. 18 (1), 245–255.
Castellarin, A. (1972). Evoluzione paleotettonica sinsedimentaria del limite tra “Piattaforma Veneta” e “Bacino Lombardo'” a Nord di Riva del Garda. G. Geol. 38, 11–212.
Castellarin, A., Cantelli, L., Fesce, A. M., Mercier, J. L., Picotti, V., Pini, G. A., et al. (1992). Alpine compressional tectonics in the southern Alps. Relationships with the N-Apennines. Ann. Tect. 6 (1), 62–94.
Castro, R., Massa, M., Augliera, P., and Pacor, F. (2008). Body-wave attenuation in the region of Garda, Italy. Pure Appl. Geophys. 165, 1351–1366. doi:10.1007/s00024-008-0365-1
Ceriani, M., and Carelli, M. (2000). “Carta delle precipitazioni medie annue del territorio alpino lombardo (registrate nel periodo 1891-1990),” in Regione Lombardia, direzione generale territorio (Urbanistica: U.O. Difesa del Suolo).
Chaudhuri, H., Barman, C., Iyengar, A. N. S., Ghose, D., Sen, P., and Sinha, B. (2013). Network of seismo-geochemical monitoring Observatories for earthquake prediction research in India. Acta geophys. 61 (4), 1000–1025. doi:10.2478/s11600-013-0134-0
Chiarabba, C., Piccinini, D., and De Gori, P. (2009). Velocity and attenuation tomography of the Umbria Marche 1997 fault system: evidence of a fluid-governed seismic sequence. Tectonophysics 476, 73–84. doi:10.1016/j.tecto.2009.04.004
Chiodini, G., Caliro, S., Cardellini, C., Frondini, F., Inguaggiato, S., and Matteucci, F. (2011). Geochemical evidence for and characterization of CO2 rich gas sources in the epicentral area of the Abruzzo 2009 earthquakes. Earth Planet Sc. Lett 304, 389–398. doi:10.1016/j.epsl.2011.02.016
Chiodini, G., Cardellini, C., Amato, A., Boschi, E., Caliro, S., Frondini, F., et al. (2004). Carbon dioxide Earth degassing and seismogenesis in central and southern Italy. Geophys. Res. Lett. 31, 1–4. doi:10.1029/2004GL019480
Chiodini, G., Cardellini, C., Di Luccio, F., Selva, J., Frondini, F., Caliro, S., et al. (2020). Correlation between tectonic CO2 Earth degassing and seismicity is revealed by a 10-year record in the Apennines, Italy. Sci. Adv. 6, eabc2938–7. doi:10.1126/sciadv.abc2938
Cicerone, R. D., Ebel, J. E., and Britton, J. (2009). A systematic compilation of earthquake precursors. Tectonophysics 476, 371–396. doi:10.1016/j.tecto.2009.06.008
Clark, I. (2015). Groundwater geochemistry and isotopes. Boca Raton: CRC Press, Taylor and Francis Group.
Cleveland, R. B., Cleveland, W. S., McRae, J. E., and Terpenning, I. J. (1990). STL: a seasonal-trend decomposition procedure based on loess. J. Off. Stat. 6 (1), 3–33.
Collettini, C., Cardellini, C., Chiodini, G., De Paola, N., Holdsworth, R. E., and Smith, S. A. F. (2008). Fault weakening due to CO2 degassing in the Northern Apennines: short- and long-term processes. Geol. Soc. Sp. 299, 175–194. doi:10.1144/SP299.11
Comerci, V., Doglioni, C., Italiano, F., Baiocco, F., Barberio, M. D., Caracausi, A., et al. (2019). Towards a national hydrogeochemical monitoring system: a further tool to investigate geological hazards. Misc. INGV 49, 1–338.
Console, R., Carluccio, R., Papadimitriou, E., and Karakostas, V. (2015). Synthetic earthquake catalogs simulating seismic activity in the Corinth Gulf, Greece, fault system. J. Geophys. Res-Sol. Ea. 120, 326–343. doi:10.1002/2014JB011765
Coppola, M., Correale, A., Barberio, M. D., Billi, A., Cavallo, A., Fondriest, M., et al. (2021). Meso-to nano-scale evidence of fluid-assisted co-seismic slip along the normal Mt. Morrone Fault, Italy: implications for earthquake hydrogeochemical precursors. Earth Planet Sci. Lett. 568, 117010–117015. doi:10.1016/j.epsl.2021.117010
D'Alessandro, A., Scudero, S., Siino, M., Alessandro, G., and Mineo, R. (2020). Long-term monitoring and characterization of soil radon emission in a seismically active area. Geochem. Geophy. Geosy. 21, e2020GC009061. doi:10.1029/2020GC009061
Danesi, S., Pondrelli, S., Salimbeni, S., Cavaliere, A., Serpelloni, E., Danacek, P., et al. (2015). Active deformation and seismicity in the Southern Alps (Italy): the Montello hill as a case study. Tectonophysics 653, 95–108. doi:10.1016/j.tecto.2015.03.028
De Gregorio, S., Federico, C., Cappuzzo, S., Favara, R., Giudice, G., Gurrieri, S., et al. (2012). Stress-induced temperature variations in groundwater of the Monferrato area (north-western Italy). Geofluids 12, 142–149. doi:10.1111/j.1468-8123.2011.00348.x
De Luca, G., Di Carlo, G., and Tallini, M. (2018). A record of changes in the Gran Sasso groundwater before, during and after the 2016 Amatrice earthquake, central Italy. Sci. Rep. U. K. 8 (15982), 1–16. doi:10.1038/s41598-018-34444-1
De Matteis, R., Convertito, V., Napolitano, F., Amoroso, O., Terakawa, T., and Capuano, P. (2021). Pore fluid pressure imaging of the Mt. Pollino region (southern Italy) from earthquake focal mechanisms. Geophys. Res. Lett. 48, e2021GL094552. doi:10.1029/2021GL094552
Di Luccio, F., Palano, M., Chiodini, G., Cucci, L., Piromallo, C., Sparacino, F., et al. (2022). Geodynamics, geophysical and geochemical observations, and the role of CO2 degassing in the Apennines. Earth-Sci. Rev. 234, 1–21. doi:10.1016/j.earscirev.2022.104236
Di Luccio, F., Ventura, G., Di Giovambattista, R., Piscini, A., and Cinti, F. R. (2010). Normal faults and thrusts reactivated by deep fluids: the 6 April 2009 Mw 6.3 L’Aquila earthquake, central Italy. J. Geophys. Res. 115, 1–15. doi:10.1029/2009JB007190
Egidio, E., Mancini, S., De Luca, D. A., and Lasagna, M. (2022). The impact of climate change on groundwater temperature of the piedmont Po plain (NW Italy). Water 14, 2797. doi:10.3390/w14182797
Farina, M., Marcaccio, M., and Zavatti, A. (2015). “Esperienze e prospettive nel monitoraggio delle acque sotterranee,” in Il contributo dell'Emilia Romagna. Pitagora editrice bologna.
Favara, R., Italiano, F., and Martinelli, G. (2003). Earthquake-induced chemical changes in the thermal waters of the Umbria region during the 1997–1998 seismic swarm. Terra nova. 13, 227–233. doi:10.1046/j.1365-3121.2001.00347.x
Federico, C., Pizzino, L., Cinti, D., De Gregorio, S., Favara, R., Galli, G., et al. (2008). Inverse and forward modelling of groundwater circulation in a seismically active area (Monferrato, Piedmont, NW Italy): insights into stress-induced variations in water chemistry. Chem. Geol. 248, 14–39. doi:10.1016/j.chemgeo.2007.10.007
Franchini, S., Agostini, S., Barberio, M. D., Barberio, M. D., Barbieri, M., Billi, A., et al. (2021). HydroQuakes, central Apennines, Italy: towards a hydrogeochemical monitoring network for seismic precursors and the hydro-seismo-sensitivity of boron. J. Hydrol. 598, 1–16. doi:10.1016/j.jhydrol.2020.125754
Fratianni, S., and Acquaotta, F. (2017). “The climate of Italy,” in Landscape and landforms of Italy. World geomorphological landscapes Editors M. Soldati, and M. Marchetti (Springer). doi:10.1007/978-3-319-26194-2_14
Gabrielli, S., Akinci, A., De Siena, L., Del Pezzo, E., Buttinelli, M., Maesano, F. E., et al. (2023). Scattering attenuation images of the control of thrusts and fluid overpressure on the 2016–2017 Central Italy seismic sequence. Geophys. Res. Lett. 50, e2023GL103132. doi:10.1029/2023GL103132
Gabrielli, S., Akinci, A., Ventura, G., Napolitano, F., Del Pezzo, E., and De Siena, L. (2022). Fast changes in seismic attenuation of the upper crust due to fracturing and fluid migration: the 2016–2017 Central Italy seismic sequence. Front. Earth Sci. 10, 909698. doi:10.3389/feart.2022.909698
Gasperi, G. (2001). “Structural setting of the study area,” in Illustrative notes of the geomorphological map of Po Plain (Italy). Supp. Geogr. Fis. Dinam. Quat. – IV Editors G. B. Castiglioni, and G. B. Pellegrini, 45–54.
Gattuso, A., Italiano, F., Capasso, G., D’Alessandro, A., Grassa, F., Pisciotta, A. F., et al. (2021). The mud volcanoes at Santa Barbara and Aragona (Sicily, Italy): a contribution to risk assessment. Nat. Hazards Earth Syst. Sci. 21, 3407–3419. doi:10.5194/nhess-21-3407-2021
Giovani, L., Vallocchia, M., Antunes, V., Lupi, M., Obermann, A., Mazzini, A., et al. (2017). Esperimento di sismica passiva per lo studio di dettaglio dei vulcani di fango nella riserva naturale regionale delle Salse di Nirano (Modena). Tech. Rep. INGV 382.
Girault, F., Adhikari, L. B., France-Lanord, C., Agrinier, P., Koirala, B. P., Bhattarai, M., et al. (2018). Persistent CO2 emissions and hydrothermal unrest following the 2015 earthquake in Nepal. Nat. Commun. 9 (2956), 1–10. doi:10.1038/s41467-018-05138-z
Gold, T., and Soter, S. (1980). The Deep-Earth-Gas hypothesis. Sci. Am. 242 (6), 154–161. doi:10.1038/scientificamerican0680-154
Gori, F., and Barberio, M. D. (2022). Hydrogeochemical changes before and during the 2019 Benevento seismic swarm in central-southern Italy. J. Hydrol. 604, 1–10. doi:10.1016/j.jhydrol.2021.127250
Groves-Kirkby, C. J., Denman, A. R., Philips, P. S., Crockett, R. G. M., and Sinclair, J. M. (2010). Comparison of seasonal variability in European domestic radon measurements. Nat. Hazards Earth Syst. Sci. 10, 565–569. doi:10.5194/nhess-10-565-2010
Hosono, T., Yamada, C., Shibata, T., Tawara, Y., Wang, C.-Y., Manga, M., et al. (2019). Coseismic groundwater drawdown along crustal ruptures during the 2016 Mw 7.0 Kumamoto earthquake. Water Resour. Res. 55, 5891–5903. doi:10.1029/2019WR024871
Hubbert, M. K., and Rubey, W. W. (1959). Role of fluid pressure in mechanics of overthrust faulting: mechanics of fluid-filled porous solids and its application to overthrust faulting. Geol. Soc. Am. Bull. 70 (2), 115–166. doi:10.1130/0016-7606(1959)70[115:ROFPIM]2.0.CO;2
Italiano, F., Martinelli, G., and Nuccio, P. M. (2001). Anomalies of mantle-derived helium during the 1997–1998 seismic swarm of Umbria-Marche, Italy. Italy. geophy. Res. Lett. 28 (5), 839–842. doi:10.1029/2000GL012059
Italiano, F., Martinelli, G., and Rizzo, A. (2004). Geochemical evidence of seismogenic-induced anomalies in the dissolved gases of thermal waters: a case study of Umbria (Central Apennines, Italy) both during and after the 1997-1998 seismic swarm. Geochem. Geophy. Geosy. 5 (11), 1–11. doi:10.1029/2004GC000720
Keranen, K. M., and Weingarten, M. (2018). Induced seismicity. Annu. Rev. Earth Pl. Sc. 46, 149–174. doi:10.1146/annurev-earth-082517-010054
Kohut, A. P., Hodge, W. S., Johanson, A., and Kalyn, D. (1984). Natural seasonal response of groundwater levels in fractured bedrock aquifers of the southern coastal region of British Columbia. Int. Groundw. Symposium Groundw. Resour. Util. Contam. Hydrogeology, Montr. PQ. 1, 97–107.
Kourouklas, C., Console, R., Papadimitriou, E., Murru, M., and Karakostas, V. (2021). Strong earthquakes recurrence times of the Southern Thessaly, Greece, fault system: insights from a physics-based simulator application. Front. Earth Sci. 9, 1–17. doi:10.3389/feart.2021.596854
Lee, H. A., Hamm, S.-Y., and Woo, N. C. (2021). Pilot-scale groundwater monitoring network for earthquake surveillance and forecasting research in Korea. Water 13 (2448), 1–19. doi:10.3390/w13172448
Lee, J.-Y., and Hahn, J.-S. (2006). Characterization of groundwater temperature obtained from the Korean national groundwater monitoring stations: implications for heat pumps. J. Hydrol. 329, 514–526. doi:10.1016/j.jhydrol.2006.03.007
Lombardia, R. (2017). “Programma di Tutela e Uso delle Acque,” in Elaborato 2: Caratterizzazione, monitoraggio e classificazione dei corpi idrici sotterranei, 244.
Lupi, M., Ricci, B. S., Kenkel, J., Ricci, T., Fuchs, F., Miller, S. A., et al. (2016). Subsurface fluid distribution and possible seismic precursory signal at the Salse di Nirano mud volcanic field, Italy. Geophys. J. Int. 204 (2), 907–917. doi:10.1093/gji/ggv454
Luzi, L., Pacor, F., Ameri, G., Puglia, R., Burrato, P., Massa, M., et al. (2013). Overview on the strong motion data recorded during the May-June 2012 Emilia seismic sequence. Seism. Res. Lett. 84 (4), 629–644. doi:10.1785/0220120154
Malagnini, L., Pio Lucente, F., De Gori, P., Akinci, A., and Munafo’, I. (2012). Control of pore fluid pressure diffusion on fault failure mode: insights from the 2009 L'Aquila seismic sequence. J. Geophys. Res-Sol. Ea. 117, 1–15. doi:10.1029/2011JB008911
Manu, J. (2022). Modern Time Series Forecasting with Python: explore industry-ready time series forecasting using modern machine learning and deep learning. UK: Packt Publishing.
Marchetti, M. (2001). “Fluvial, fluvioglacial and lacustrine forms and deposits,” in Illustrative notes of the geomorphological map of Po Plain (Italy). Supp. Geogr. Fis. Dinam. Quat IV Editors G. B. Castiglioni, and G. B. Pellegrini, 73–104.
Martinelli, G. (2018). “Contributions to a history of earthquake prediction research,” in Pre-earthquake processes: a multidisciplinary approach to earthquake prediction studies Editors D. Ouzounov, S. Pulinets, K. Hattori, and P. Taylor (John Wiley & Sons).
Martinelli, G., Ciolini, R., Facca, G., Fazio, F., Gherardi, F., Heinicke, J., et al. (2021). Tectonic-related geochemical and hydrological anomalies in Italy during the last fifty years. Minerals 11 (107), 107–116. doi:10.3390/min11020107
Martinelli, G., Facca, G., Genzano, N., Gherardi, F., Lisi, M., Pierotti, L., et al. (2020). Earthquake-related signals in Central Italy detected by hydrogeochemical and satellite techniques. Front. Earth. Sci. 8, 1–10. doi:10.3389/feart.2020.584716
Martinez, M. J., and Nilson, R. H. (1999). Estimates of barometric pumping of moisture through unsaturated fractured rock. Transp. Porous Med 36, 85–119. doi:10.1023/a:1006593628835
Marzorati, S., and Bindi, D. (2006). Ambient noise levels in north Central Italy. Geochem. Geophy. Geosy. 7 (9), 1–14. doi:10.1029/2006gc001256
Massa, M., Rizzo, A. L., Ferrari, E., Lovati, S., Scafidi, D., Puglia, R., et al. (2023). MUDA working group (geophysical and geochemical MUltiparametric DAtabase). doi:10.13127/muda
Massa, M., Scafidi, D., Mascandola, C., and Lorenzetti, A. (2022). Introducing ISMDq—a web portal for real-time quality monitoring of Italian strong-motion data. Seismol. Res. Lett. 93 (1), 241–256. doi:10.1785/0220210178
Mazzini, A., Svensen, H., Akhmanov, G. G., Aloisi, G., Planke, S., Malthe-Sørenssen, A., et al. (2007). Triggering and dynamic evolution of the LUSI mud volcano, Indonesia. Earth Planet. Sc. Lett. 261, 375–388. doi:10.1016/j.epsl.2007.07.001
Menberg, K., Blum, P., Kurylyk, B. L., and Bayer, P. (2014). Observed groundwater temperature response to recent climate change. Hydrol. Earth Syst. Sci. 18, 4453–4466. doi:10.5194/hess-18-4453-2014
Miles, O. W., and Novakowski, K. S. (2016). Large water-table response to rainfall in a shallow bedrock aquifer having minimal overburden cover. J. Hydrol. 541, 1316–1328. doi:10.1016/j.jhydrol.2016.08.034
Miller, S. A. (2013). The role of fluids in tectonic and earthquake processes. Adv. Geophys. 54, 1–46. doi:10.1016/B978-0-12-380940-7.00001-9
Miller, S. A., Collettini, C., Chiaraluce, L., Cocco, M., Barchi, M., and Kaus, B. J. P. (2004). Aftershocks driven by a high-pressure CO2 source at depth. Nature 427, 724–727. doi:10.1038/nature02251
MPS Working Group (2004). Redazione della mappa di pericolosità sismica prevista dall’Ordinanza PCM del 20 marzo 2003 Rapporto Conclusivo per il Dipartimento della Protezione Civile.
Napolitano, F., De Siena, L., Gervasi, A., Guerra, I., Scarpa, R., and La Rocca, M. (2020). Scattering and absorption imaging of a highly fractured fluid-filled seismogenetic volume in a region of slow deformation. Geosci. Front. 11, 989–998. doi:10.1016/j.gsf.2019.09.014
Oppo, D., Capozzi, R., and Picotti, V. (2013). A new model of the petroleum system in the Northern Apennines, Italy. Mar. Pet. Geol. 48, 57–76. doi:10.1016/j.marpetgeo.2013.06.005
Ouzounov, D., Pulinets, S., Hattori, K., and Taylor, P. (2018). Pre-earthquake processes: a multidisciplinary approach to earthquake prediction studies. John Wiley & Sons.
Pepin, J. D., Robertson, A. J., and Kelley, S. A. (2022). Salinity contributions from geothermal waters to the rio grande and shallow aquifer system in the transboundary mesilla (United States)/Conejos-Médanos (Mexico) basin. Water 14 (1), 33. doi:10.3390/w14010033
Peterson, J. R. (1993). Observations and modeling of seismic background noise. U.S. Geol. Surv. Tech. Rep., 93–322. doi:10.3133/ofr93322
Petitta, M., Mastrorillo, L., Preziosi, E., Banzato, F., Barberio, M. D., Billi, A., et al. (2018). Water-table and discharge changes associated with the 2016–2017 seismic sequence in central Italy: hydrogeological data and a conceptual model for fractured carbonate aquifers. Hydrogeol. J. 26, 1009–1026. doi:10.1007/s10040-017-1717-7
Picotti, V., Romano, M. A., Ponza, A., Guido, F. L., and Peruzza, L. (2022). The Montello thrust and the active mountain front of the eastern southern Alps (northeast Italy). Tectonics 41, e2022TC007522. doi:10.1029/2022TC007522
Pieri, M., and Groppi, G. (1981). Subsurface geological structure of the Po plain, Italy in progetto finalizzato geodinamica/sottoprogetto “modello strutturale” (Rome: consiglio Nazionale delle ricerche publ. N° 414).
Piersanti, A., Cannelli, V., and Galli, G. (2016). The Pollino 2012 seismic sequence: clues from continuous radon monitoring. Solid earth. 7, 1303–1316. doi:10.5194/se-7-1303-2016
Pondrelli, S., Ekstrom, G., and Morelli, A. (2001). Seismotectonic re-evaluation of the 1976 Friuli, Italy, seismic sequence. J. Seismol. 5, 73–83. doi:10.1023/a:1009822018837
Popit, A., Vaupotič, J., and Dolenec, T. (2005). Geochemical and geophysical monitoring of thermal waters in Slovenia in relation to seismic activity. Ann. Geophys. 48 (1), 73–83.
Prada, S. N., da Silva, M. O., and Cruz, J. V. (2005). Groundwater behaviour in Madeira, volcanic island (Portugal). Hydrogeol. J. 13, 800–812. doi:10.1007/s10040-005-0448-3
Quattrocchi, F., Favara, R., Capasso, G., Pizzino, L., Bencini, R., Cinti, D., et al. (2003). Thermal anomalies and fluid geochemistry framework in occurrence of the 2000-2001 Nizza Monferrate seismic sequence (northern Italy): episodic changes in the fault zone heat flow or chemical mixing phenomena? Nat. Hazards Earth Syst. Sci. 3, 269–277. doi:10.5194/nhess-3-269-2003
Quattrocchi, F., Pik, R., Pizzino, L., Guerra, M., Scarlato, P., Angelone, M., et al. (2000). Geochemical changes at the Bagni di Triponzo thermal spring during theUmbria-Marche 1997–1998 seismic sequence. J. Seismol. 4, 567–587. doi:10.1023/A:1026590028678
Reddy, D. V., and Nagabhushanam, P. (2011). Groundwater electrical conductivity and soil radon gas monitoring for earthquake precursory studies in Koyna, India. Appl. Geochem. 26, 731–737. doi:10.1016/j.apgeochem.2011.01.031
Regione Veneto (2008). Le acque sotterranee della pianura veneta. I risultati del Progetto SAMPAS, 104.
Regione Veneto (2015). “Valutazione Ambientale Strategica. Programma Operativo Regionale del Veneto. Parte FESR 2014-2020,” in Rapporto Ambientale, Allegato 1, Clima e cambiamenti climatici, 67.
Rikitake, T., and Hamada, K. (2001). “Earthquake prediction,” in Encyclopaedia of physical science and technology. 4 (San Diego, CA, USA: Academic Press), 743–760.
Rovida, A., Locati, M., Camassi, R., Lolli, B., and Gasperini, P. (2020). The Italian earthquake catalogue CPTI15. Bull. Earthq. Eng. 18 (7), 2953–2984. doi:10.1007/s10518-020-00818-y
Sciarra, A., Cantucci, B., Ricci, T., Tomonaga, Y., and Mazzini, A. (2019). Geochemical characterization of the Nirano mud volcano, Italy. Appl. Geochem. 102, 77–87. doi:10.1016/j.apgeochem.2019.01.006
Severi, P., and Bonzi, L. (2014). “Gli acquiferi dell’Emilia Romagna,” in Esperienze e prospettive nel monitoraggio delle acque sotterranee. Il contributo dell’Emilia Romagna Pitagora ed.
Stucchi, M., Meletti, C., Montaldo, V., Crowley, H., Calvi, G. M., and Boschi, E. (2011). Seismic hazard assessment (2003-2009) for the Italian building code. Bull. Seismol. Soc. Am. 101, 1885–1911. doi:10.1785/0120100130
Tamburello, G., Pondrelli, S., Chiodini, G., and Rouwet, D. (2018). Global-scale control of extensional tectonics on CO2 earth degassing. Nat. Commun. 9 (4608), 4608–4609. doi:10.1038/s41467-018-07087-z
Taylor, C. A., and Stefan, H. G. (2009). Shallow groundwater temperature response to climate change and urbanization. J. Hydrol. 375, 601–612. doi:10.1016/j.jhydrol.2009.07.009
Valigi, D., Fronzi, D., Cambi, C., Beddini, G., Cardellini, C., Checcucci, R., et al. (2020). Earthquake-induced spring discharge modifications: the Pescara di Arquata spring reaction to the August–October 2016 Central Italy earthquakes. Water 12 (767), 1–18. doi:10.3390/w12030767
Ventura, G., and Di Giovambattista, R. (2012). Fluid pressure, stress field and propagation style of coalescing thrusts from the analysis of the 20 May 2012 ML 5.9 Emilia earthquake (Northern Apennines, Italy). Terra nova. 25, 72–78. doi:10.1111/ter.12007
Venzo, S., Petrucci, F., and Carraro, F. (1977). I depositi quaternari e del Neogene Superiore nella bassa valle del Piave da Quero al Montello e del Paleopiave nella valle del Soligo (Treviso). Mem. degli Ist. Geol. Mineral. dell'Università Padova 30, 1–27.
Wyatt, D. E., Richers, D. M., and Pirkle, R. J. (1995). Barometric pumping effects on soil gas studies for geological and environmental characterization. Environ. Geol. 25, 243–250. doi:10.1007/BF00766753
Yoshida, K., and Hasegawa, A. (2018). Hypocenter migration and seismicity pattern change in the Yamagata-Fukushima border, NE Japan, caused by fluid movement and pore pressure variation. J. Geophys. Res-Sol. Ea. 123, 5000–5017. doi:10.1029/2018JB015468
Keywords: crustal fluids, seismicity, hydrogeochemistry, groundwater monitoring, radon, borehole seismic station, CO2 flux
Citation: Ferrari E, Massa M, Lovati S, Di Michele F and Rizzo AL (2024) Multiparametric stations for real-time monitoring and long-term assessment of natural hazards. Front. Earth Sci. 12:1412900. doi: 10.3389/feart.2024.1412900
Received: 05 April 2024; Accepted: 20 May 2024;
Published: 24 June 2024.
Edited by:
Fanyu Zhang, Lanzhou University, ChinaReviewed by:
Sebastiano D'Amico, University of Malta, MaltaPaolo Madonia, National Institute of Geophysics and Volcanology (INGV), Italy
Copyright © 2024 Ferrari, Massa, Lovati, Di Michele and Rizzo. This is an open-access article distributed under the terms of the Creative Commons Attribution License (CC BY). The use, distribution or reproduction in other forums is permitted, provided the original author(s) and the copyright owner(s) are credited and that the original publication in this journal is cited, in accordance with accepted academic practice. No use, distribution or reproduction is permitted which does not comply with these terms.
*Correspondence: Elisa Ferrari, ZWxpc2EuZmVycmFyaUBpbmd2Lml0