 Weiyao Zhu1,2,3
 Yubao Gao
- 1State Key Laboratory of Shale Oil and Gas Enrichment Mechanisms and Effective Development, Beijing, China
- 2Research and Development Center for the Sustainable Development of Continental Sandstone Mature Oilfield By National Energy Administration, Beijing, China
- 3School of Civil and Resources Engineering, University of Science and Technology Beijing, Beijing, China
Low permeability oil reservoir resources are rich and their efficient development is considered an important way to solve energy security issues. However, the development process of low permeability oil reservoirs is faced with the challenges of insufficient natural energy and rapid production decline. The high-pressure water injection technology is a method that relies on high-pressure and large-volume to inject fluid into the reservoir to replenish energy. It is considered as an important technical means to quickly replenish formation energy. This study focuses on the injection capacity for the high-pressure water injection technology of low permeability oil reservoir. Firstly, the fluid-structure interaction mathematical model for two-phase fluid flow was established. The solution of the mathematical model was then obtained by coupling the phase transport in porous media module and Darcy’s law module on the COMSOL numerical simulation platform. The numerical model established in this study was verified through the Buckley-Leverett model. The study on the injection capacity of high-pressure water injection technology was conducted using the geological background and reservoir physical properties of Binnan Oilfield (Shengli, China). The results show that the production pressure difference is the key factor in determining the injection capacity. When the production pressure difference increases from 5 MPa to 30 MPa, the cumulative injection volume increases by 8.1 times. In addition, sensitivity analysis shows that the injection capacity is significantly influenced by the properties of the reformation area. The effect of these parameters from high to low is as follows: stress sensitivity factor, permeability, rock compressibility, and porosity. Compared to the reformation area, the influence of the physical parameters of the matrix area on the injection capacity is negligible. Therefore, effective reservoir reformation is essential for enhancing the injection capacity. This research provides a theoretical basis for the design and optimization of the high-pressure water injection technology schemes for low permeability oil reservoir.
1 Introduction
Energy security is an important topic of common concern around the world. Petroleum resources account for the largest proportion of the energy structure, which is 31.2% (Zeng et al., 2022; Global, 2024). At the same time, the demand for petroleum continues to rise with industrialization. The low permeability reservoirs have huge development potential. Approximately 38% of global petroleum reserves reside in low-permeability reservoirs (Xiao et al., 2023). China’s low permeability sandstone oil reservoirs are rich in resources and extensively distributed (Jiang et al., 2022). The geological reserves and the technically recoverable reserves are 178.2 × 10⁸t and 12.34 × 10⁸t respectively (Yu et al., 2022). According to statistics, the crude oil production of China’s low permeability reservoirs accounted for 36.9% of the total annual crude oil production in 2017. At the same time, forecasts indicate that by 2030, the annual production from low permeability oil reservoirs in China will reach 50%. The efficient development of low permeability reservoirs will be an important way to ensure China’s energy supply demands (Jia, 2020; Ji and Fang, 2023).
Low permeability reservoirs are usually characterized by small porosity, low permeability (1-10 mD), complex pore structure and high clay content (Wei et al., 2023). The development of these reservoirs faces challenges such as insufficient natural energy, slow propagation of pressure, and a rapid decline in production rates (Kang et al., 2022). To enhance the recovery of low permeability reservoirs, common development methods include gas flooding (Das et al., 2020), chemical flooding, and water flooding (Zhao et al., 2022). The gas flooding development method includes CO2 flooding (Zhang et al., 2018), air flooding (Hou et al., 2010), and foam flooding (Li et al., 2020). Among these, CO2 flooding has the dual advantages of carbon sequestration and enhanced oil recovery (Hu et al., 2019). However, it encounters issues with gas channeling during field applications. In addition, the development of low permeability reservoirs is usually accompanied by hydraulic fracturing techniques, which not only increases the heterogeneity of the reservoir but also raises the probability of gas channeling. Furthermore, because CO2 is an acidic gas, it necessitates stricter transportation pipeline standards, which in turn elevates the cost of extraction. While foam flooding can prevent gas channeling and enhance recovery, its stability is often inadequate, resulting in increased construction costs and a more intricate operational process (Zhang et al., 2019). Chemical flooding reduces the interfacial tension between oil and water, thus enhancing the recovery factor (Li et al., 2022). However, the large specific surface area of low-permeability reservoirs causes significant adsorption loss of chemicals, contributing to the high cost of oil recovery. The water flooding is a simple and cost-effective method that remains commonly used to enhance oil recovery in low permeability reservoirs. In recent years, the high-pressure water injection technology has been widely applied in low permeability reservoirs. This technology can quickly replenish reservoir energy and increase reservoir pressure, subsequently enhancing oil well production pressure difference, liquid production, and recovery. The high-pressure water injection technology is regarded as an important technical means to achieve the efficient development of low permeability reservoirs (Li et al., 2021).
He et al. (He et al., 2017) proposed a development method of cyclic water injection for naturally fractured low permeability reservoirs. This method can effectively control the water cut of production wells, avoid further increase in water cut, and enhance oil recovery of low permeability reservoirs. Wang et al. (Wang et al., 2018) proposed a method of moderate mild water injection to enhance oil recovery of ultra-low permeability reservoirs in Yanchang Oilfield. They established a mathematical model for fractured reservoirs that considers the dual effects of imbibition and displacement, and used numerical simulation methods to obtain optimal injection and production parameters. Xie et al. (Xie et al., 2009) designed the optimal time of water injection by combining physical experiments and theoretical analysis. The results show that advanced water injection before the reservoir is put into production can reduce the adverse effects of stress sensitivity. Wang and Wei (Wang and Wei, 2011) conducted research on advanced water injection in low-permeability reservoirs. Advanced water injection can help maintain formation pressure at a higher level and sustain a higher-pressure gradient, which is an effective way to develop low permeability oil reservoirs. However, increasing evidence shows that the water injection process can induce the formation of fractures and lead to changes in the permeability of the reservoir near the well (Nwokolo, 2013; Wang et al., 2017a). At the same time, in order to solve the problem of difficult water injection in low permeability reservoirs, Liu et al. (Liu et al., 2022) proposed the high-pressure water injection technology that changes from “constant velocity injection” to “high pressure injection” to increase the injection capacity of the water injection well. This will undoubtedly increase the possibility of fracture formation and lead to the formation of a reformed area with strong seepage capacity near the well. Wang et al. (Wang et al., 2017b) conducted research on the pressure propagation dynamics during water flooding, taking into account the extension of fractures caused by the flooding process. The area near the injection well is assumed to be a reformation area with high seepage capacity. The fluid flow in the reservoir is equivalent to a radial composite model, and the bottom hole pressure change law of the water injection well is obtained. Wang et al. (Wang et al., 2019) studied the pressure propagation law in the process of fracture opening and closing caused by water flooding of low permeability reservoirs based on well test analysis method. Currently, there are few studies on the injection capacity of high-pressure water injection. Most of this research relies on well test analysis to explore the changing patterns of bottom hole pressure during high-pressure water injection. All these studies presume that the flow within the reservoir constitutes single-phase flow adhering to Darcy’s law (Chu et al., 2023a; Chu et al., 2023b). The effects of threshold pressure gradient and fluid-structure interaction are not considered.
To fill this gap, this study used numerical simulation methods to investigate the influence of reservoir properties on the injection capacity of high-pressure water injection. Initially, a numerical model for oil-water two-phase fluid-structure interaction was developed. Subsequently, the mathematical model was solved using the finite element numerical modeling software COMSOL. Finally, a sensitivity analysis was performed on the key parameters affecting the injection capacity under high-pressure water injection.
2 Methodology
2.1 Physical model
As shown in Figure 1, there is a water injection well in a rectangular closed formation, which is injecting water into the reservoir with high pressure and large volume. The entire physical model is divided into two areas. The inner area is a region with higher seepage capacity. It is a reformation area, formed due to water injection that exceeds the formation fracture pressure during high-pressure water injection. Concurrently, microseismic monitoring data reveal the reformation area to be elliptical. The outer region refers to the initial formation. In order to describe the two-phase fluid flow during high-pressure water injection in low permeability reservoirs, some idealizations and assumptions are made as follows.
(1) the fluid flow within the reservoir consists of oil-water two-phase flow under isothermal conditions;
(2) the reservoir has a uniform thickness horizontally, and the initial formation pressure is evenly distributed;
(3) the permeability of the reservoir is assumed to be isotropic;
(4) the effect of gravity is ignored;
(5) there is no mass transfer or exchange between oil and water phases;
(6) the threshold pressure gradient and stress sensitivity effects are taken into account.
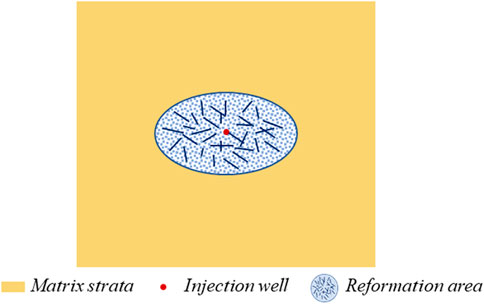
Figure 1. Schematic diagram of physical model for high-pressure water injection.
2.2 Mathematical model
This study used two independent numerical modules to calculate the saturation distribution and pressure distribution during high-pressure water injection of low permeability reservoirs (Zhang et al., 2022). Based on the finite element method, the saturation changes of the oil phase and the water phase were calculated through the phase transport in porous media module. By improving Darcy’s law module (Liu et al., 2019), the pressure field of the oil-water mixture was calculated taking into account the threshold pressure gradient. Then the calculated pressure field and saturation field were coupled to obtain a complete mathematical model.
(1) Phase Transport in Porous Media
Based on the law of conservation of mass, the continuity equation of the fluid in the reservoir can be expressed as:
where
The kinematic equations of the oil and water phases can be obtained under the condition of considering the capillary forces and they can be expressed as Eqs 2, 3:
where
where
where
The control equations can be obtained, by substituting Eqs. 2, 3 into Eq. 1,
where
Besides, the saturation of the oil and water phases satisfies Eq. 7,
(2) Oil and water phase pressure calculation method
To calculate the pressure distribution of the oil-water mixture, the properties of the mixture must first be obtained. Chen et al. (Chen et al., 2006) proposed the calculation method of mixture density and viscosity, which can be expressed as:
Darcy’s law for the oil-water mixture can be determined as:
where
where
where
The discrete fracture model is used to describe the flow of fluid in fractures. The kinematic equation of fluid flow in fractures can be expressed as:
Where
Where
At the initial moment, the reservoir pressure and water saturation are equal everywhere. The initial condition can be expressed as:
The outer boundary of the model
Constant pressure water injection was used in the simulation. The inner boundary conditions can be expressed as:
Solution Procedure for Evaluation of High Pressure Injection Capacity in Low Permeability Reservoirs Shown in Figure 2.
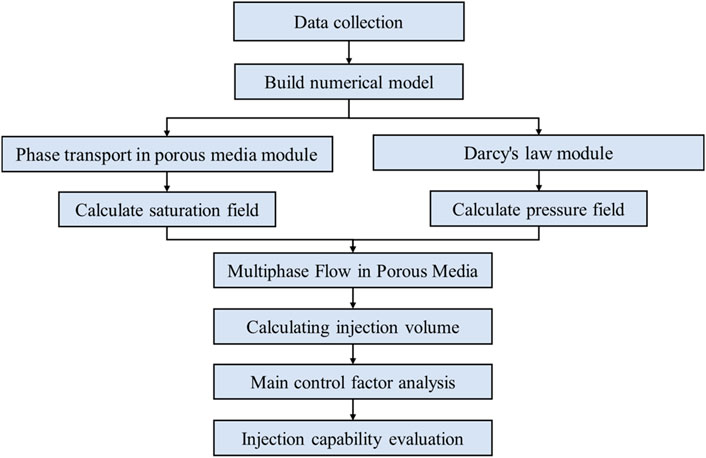
Figure 2. The injection capacity evaluation calculation flow chart.
2.3 Description of the simulation model
This study simulates high-pressure water injection using COMSOL Multiphysics software. In the simulation, the phase transport in porous media module and the Darcy’s law module were selected. The two modules achieve coupled solutions through the multiphysics interface multiphase flow in porous media. As shown in Figure 3, the geometric model is a square reservoir of 800 m × 800 m, and the inner area is an elliptical reformation area with a long semi-axis of 150 m and a short semi-axis of 60 m. A water injection well with constant pressure is located at the center of the reservoir. Due to the symmetry of the physical model, in order to reduce the calculation amount of the model and increase the calculation speed, only half of the reservoir area is calculated. The meshing method selects unstructured mesh, as shown in Figure 3. In order to accurately describe the fluid flow near the wellbore and fracture, mesh refinement was performed around the wellbore and fracture. The numerical model contains a total of 1,375 domain cells and 175 boundary elements. Other parameter settings in the numerical model are shown in Table 1.
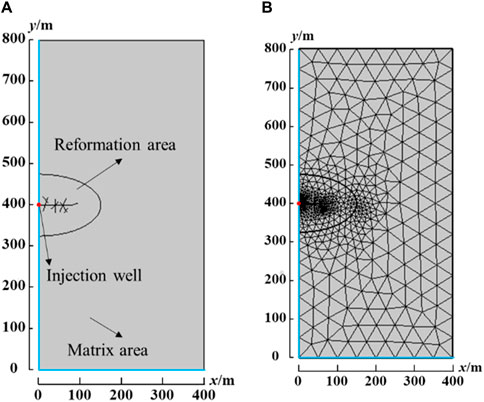
Figure 3. Physical model of the simulation: (A)the diagram of the half-geometry for the simulation model, (B)mesh generation model for the simulation.

Table 1. Model validation parameters for the numerical model.
For low permeability reservoirs, the effective treatment of threshold pressure gradient is one of the key issues in high-pressure water injection simulation. The kinematic equation for considering the influence of gravity in the Darcy’s Law module of COMSOL Multiphysics can be described as:
where
The piecework function of Eq. 23 can be written into COMSOL by programming to realize the numerical processing of threshold pressure gradient.
3 Model validation
In order to ensure the accuracy of numerical model calculations, we conducted a reliability verification on the model. The Buckley-Leverett model was used to verify the accuracy of the numerical model in this study. It is mainly used to describe the advancement of the fluid displacement front in the flow process of two-phase immiscible fluids. According to the Buckley-Leverett equation, the position x of the displacement phase saturation front can be described as:
where
The parameters for the model validation as shown in Table 2.
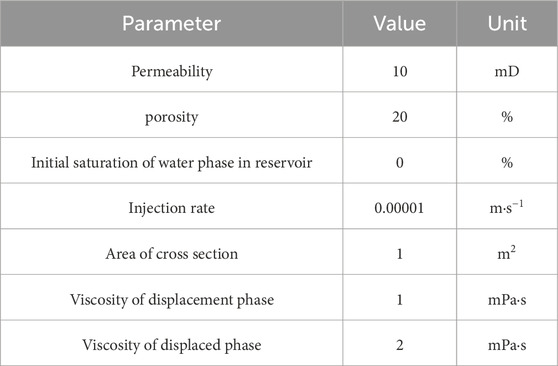
Table 2. Model validation parameters for the numerical model.
The calculation results of the numerical model and the analytical model are shown in Figure 4. The numerical solution and the analytical solution basically coincide, which verifies the effectiveness of the numerical model and shows that the numerical model has high calculation accuracy.
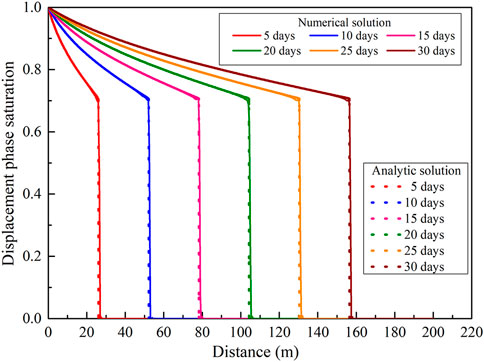
Figure 4. Comparison of calculation results between numerical and analytical models.
4 Case study
4.1 Geology background
This study focuses on the development of low-permeability oil fields in the Bohai Bay Basin in East China. The Bohai Bay Basin is a complex near-coast Mesozoic and Cenozoic continental rift basin that contains substantial petroleum reserves (Guo et al., 2010; Yu et al., 2015). The Bohai Bay Basin has experienced complex structural evolution. The target area Binnan Oilfield is located in the Lijin Depression in the northwest of the Dongying Depression, adjacent to the Binxian Uplift to the west and the Chenjiazhuang Uplift to the north. Figure 5 shows the structural location map of the study area. The target formation is mainly composed of sandstone, siltstone and thin limestone interlayers, and the porosity ranges from 1% to 17.9% with an average porosity of 9%. The permeability range of the reservoir is 0.1–11.457 mD. According to the mercury injection curve in this area, the pore throat radius is mainly distributed between 0.0025μm and 1.5 μm (Song et al., 2012; Wang et al., 2016). Other simulation parameters are shown in Table 3. It is worth mentioning that the target block is a low-permeability oil reservoir that has not yet been put into production.
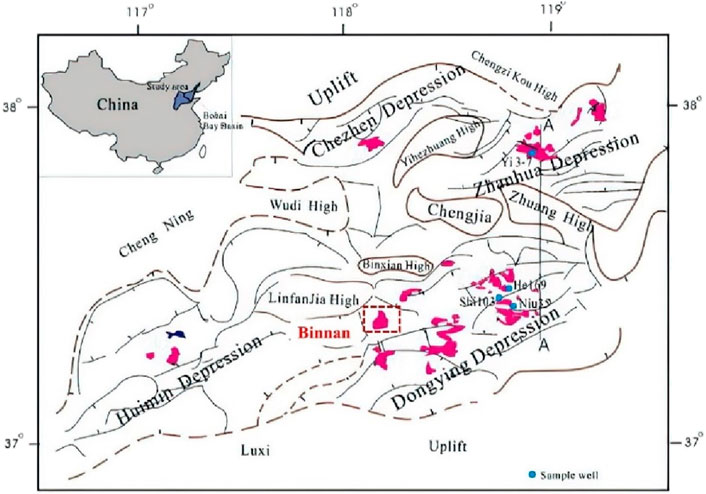
Figure 5. Tectonic location map of the study area [modified from Chen et al. (2009)].
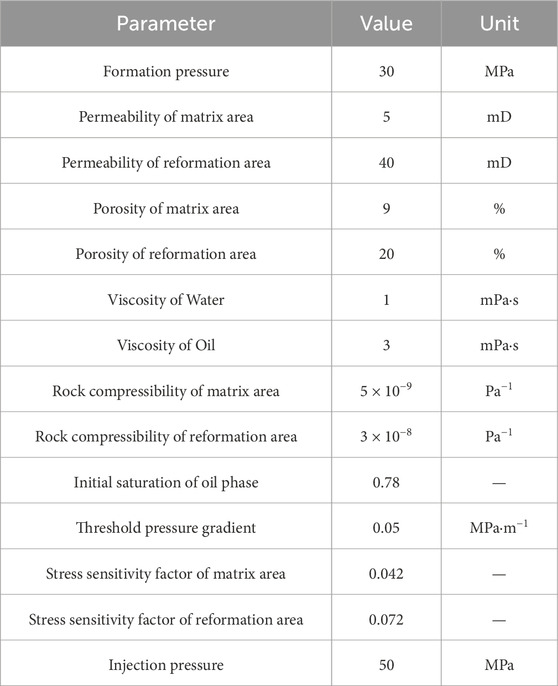
Table 3. The detailed geological properties of the Binnan reservoir.
4.2 Sensitivity analysis
4.2.1 Effect of permeability
During high-pressure water injection, a reformation area with developed fractures is formed near the wellbore, resulting in permeability that exceeds that of the original formation. Figure 6 shows the effect of different permeability of the reformation area (ranging from 20 mD to 60 mD) on the injection rate and cumulative injection volume. As shown in Figure 6A, the permeability of the reformation area is positively related to the injection rate. At the same time, as the water injection time increases, the injection rate gradually becomes smaller. This occurs as the increasing volume of water injection leads to a gradual rise in reservoir pressure, which in turn reduces the production pressure differential, consequently lowering the injection rate The relationship between the cumulative injection volume and the permeability in the reformation area is depicted in Figure 6B. A lower permeability within the reformation area exerts a more significant impact on the cumulative injection volume. When permeability rises from 20 mD to 30 mD, the cumulative injection volume sees an increase of 44.8%. In contrast, a rise in permeability from 50 mD to 60 mD within the reformation area results in a more modest increase of only 15.3% in the water injection volume. The effect of matrix permeability on injection capacity is shown in Figure 7. Compared to the reformation area permeability, the influence of matrix permeability is relatively small. When the permeability of the matrix area increases from 1mD to 9mD, the average injection rate increases from 638.6 m3 d−1–644.9 m3 d−1, and the cumulative injection volume increases from 1.90 × 10⁴ m3 to 1.94 × 10⁴ m3.
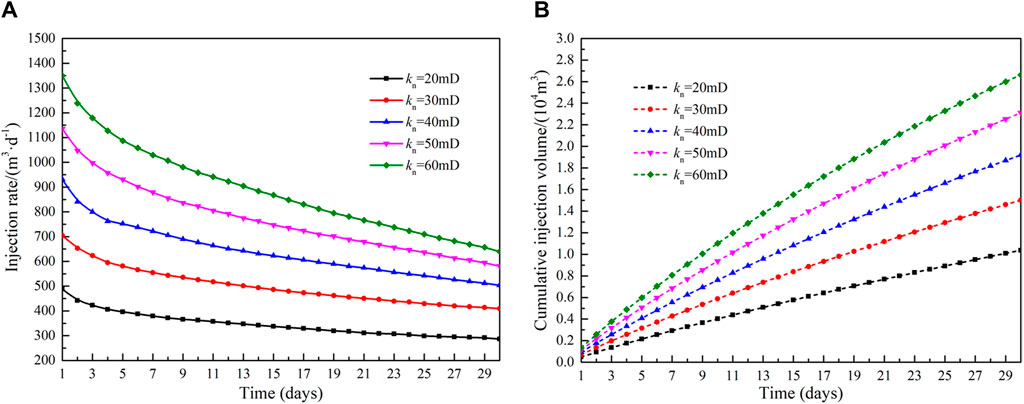
Figure 6. Influence of permeability of reformation area on injection capacity: (A)injection rate and (B)cumulative injection volume.
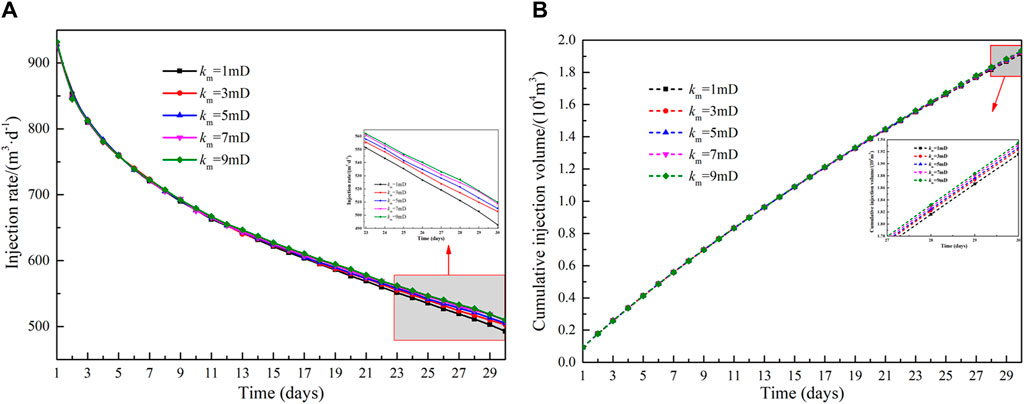
Figure 7. Influence of permeability of matrix area on injection capacity: (A)injection rate and (B)cumulative injection volume.
4.2.2 Effect of porosity
The effect of porosity (ranging from 0.14 to 0.26) in the reformation area on injection capacity is shown in Figure 8. As shown in Figure 8A, the injection rate increases gradually with an increase in porosity but decreases progressively as production time extends. Concurrently, a lower porosity has a more pronounced impact on the injection rate. Figure 8B illustrates the relationship between porosity and the cumulative injection volume within the reformation area. When the porosity increases from 0.14 to 0.26, the cumulative injection volume increases by 16.0%. This occurs because a higher porosity corresponds to greater fluid storage space, which in turn enhances the injection capacity. Figure 9 shows the effect of different matrix porosity on injection rate and cumulative injection volume. When the porosity of the matrix increases from 0.05 to 0.13, the average injection rate increases by 1.99% and the cumulative injection volume increases by 1.87%. The effect of porosity in the matrix area is relatively small compared to the porosity in the reformation area.
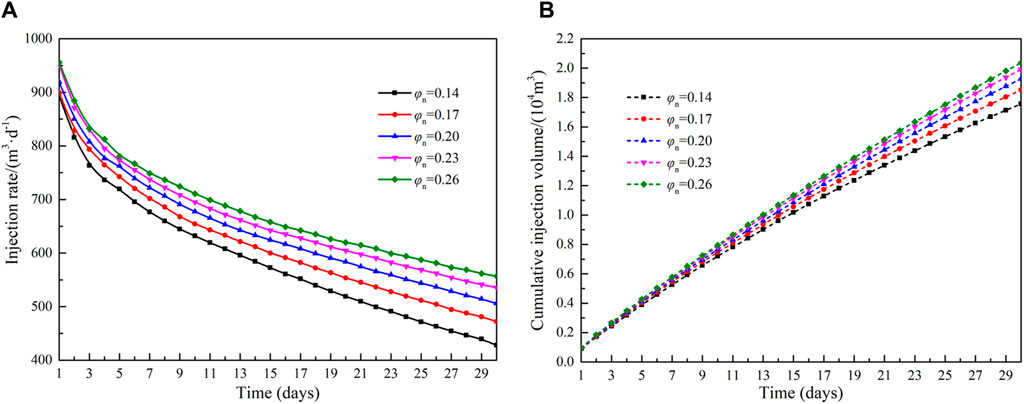
Figure 8. Influence of porosity of reformation area on injection capacity: (A)injection rate and (B)cumulative injection volume.
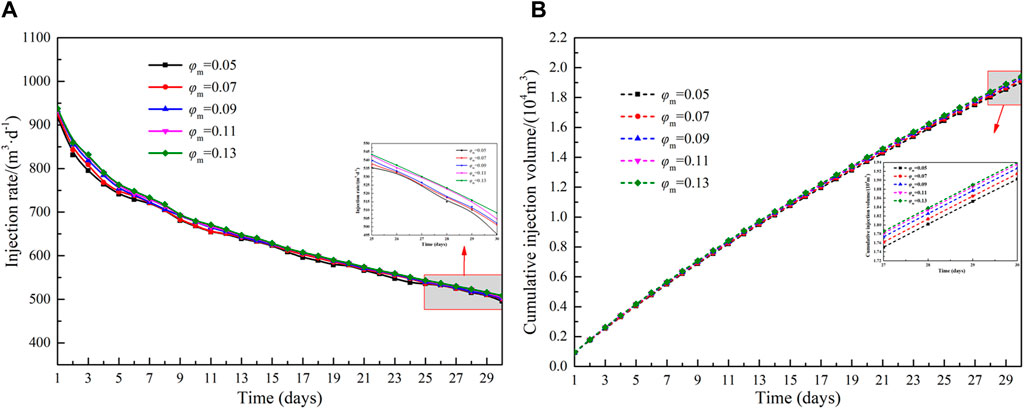
Figure 9. Influence of porosity of matrix area on injection capacity: (A)injection rate and (B)cumulative injection volume.
4.2.3 Effect of stress sensitivity factor
Figure 10 shows the effect of different reformation area stress sensitivity factor on injection rate and cumulative injection volume. When the injection pressure is constant, the injection rate and cumulative injection volume are proportional to the stress sensitivity factor. During high-pressure water injection, the pore pressure within the reservoir escalates as fluid is introduced, consequently enhancing reservoir permeability, decreasing flow resistance, and augmenting injection capacity. The influence of the stress sensitivity factor in the matrix area on the injection capacity is shown in Figure 11. The influence of the stress sensitivity coefficient in the matrix area is significantly less than that of the reformation area. When the stress sensitivity factor of the matrix area increases from 0.032 to 0.052, the cumulative injection volume increases by 0.019 × 10⁴ m3. This is because the production time is short, leading to the injected fluid primarily residing in the reformation area. As a result, the energy in the matrix area remains un-supplemented, and its permeability is not enhanced.
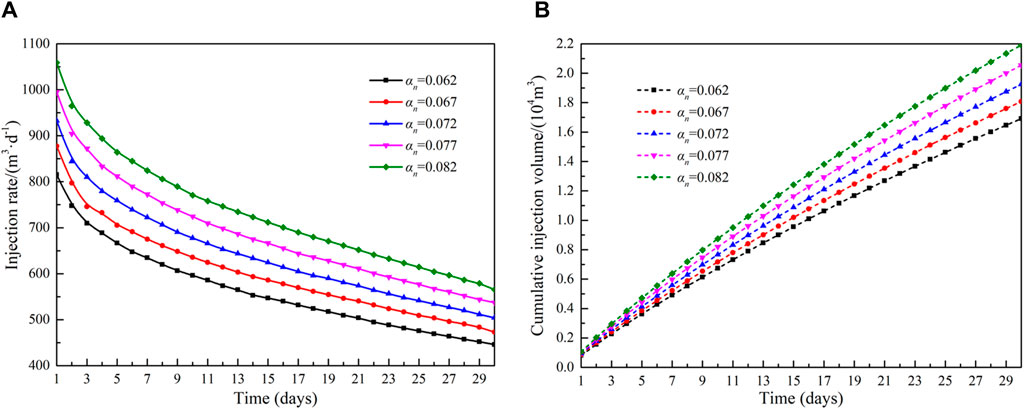
Figure 10. Influence of stress sensitivity factor of reformation area on injection capacity: (A)injection rate and (B)cumulative injection volume.
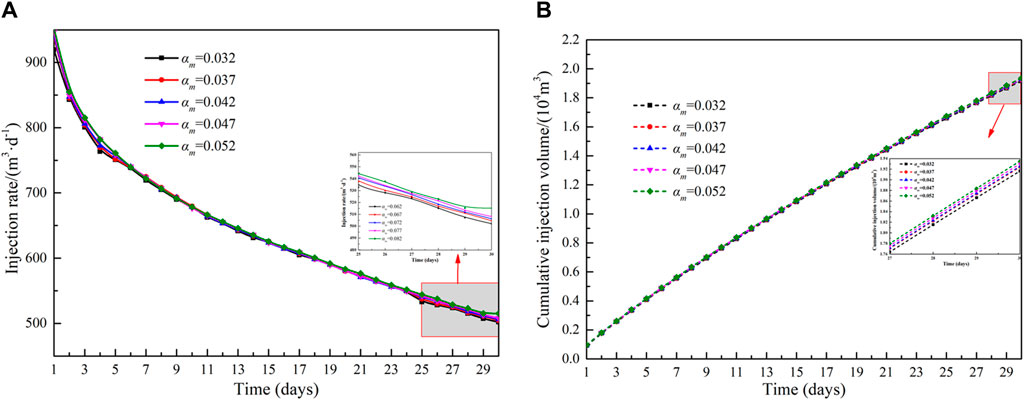
Figure 11. Influence of stress sensitivity factor of matrix area on injection capacity: (A)injection rate and (B)cumulative injection volume.
4.2.4 Effect of rock compressibility
The influence of rock compressibility on injection capacity in the reformation area is shown in Figure 12. When the production pressure difference is constant, the injection rate and cumulative injection volume are proportional to the rock compressibility. The pore pressure increases with fluid injection, and the effective storage space becomes larger. The pore space increases with increasing rock compressibility. When the rock compression coefficient increases from 2 × 10⁸Pa−1 to 4 × 10⁸Pa−1, the average injection rate increases from 557.7 m3 d−1–711.4 m3 d−1, and the cumulative injection volume increases from 1.67 × 10⁴ m3 to 2.13 × 10⁴ m3. Figure 13 shows the effect of different matrix region compressibility coefficients on injection rate and cumulative injection volume. Compared to the compressibility of the reformation area, the compressibility of the matrix area has a much smaller effect. When the rock compression coefficient in the matrix area increases from 1 × 10⁹Pa−1 to 9 × 10⁹Pa−1, the cumulative injection volume increases by 2.12%.
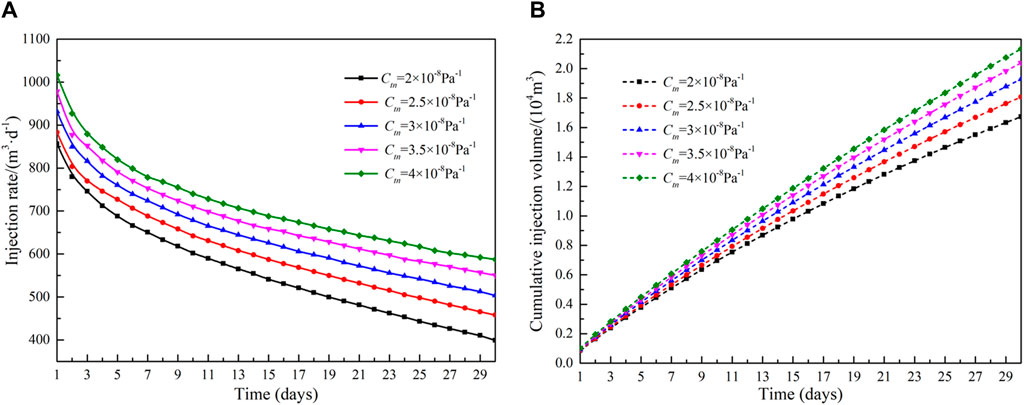
Figure 12. Influence of rock compressibility of reformation area on injection capacity: (A)injection rate and (B)cumulative injection volume.
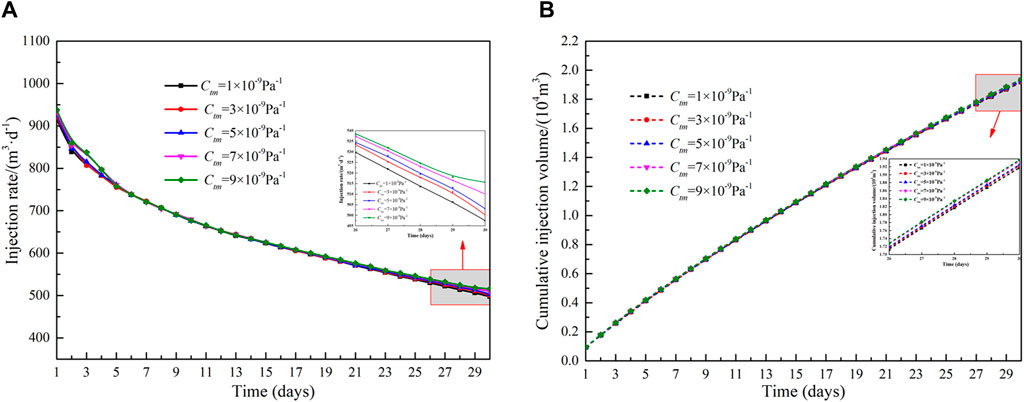
Figure 13. Influence of stress rock compressibility of matrix area on injection capacity: (A)injection rate and (B)cumulative injection volume.
4.2.5 Effect of threshold pressure gradient
The effect of threshold pressure gradient on injection capacity is shown in Figure 14. The variation range of threshold pressure gradient is between 0.01 MPa m−1 and 0.09 MPa m−1. The injection rate and cumulative injection volume decrease as the threshold pressure gradient increases. When the threshold pressure gradient of the reservoir is larger, the resistance to fluid flow is greater, and this greater resistance has a more significant impact on injection capacity. When the threshold pressure gradient increases from 0.01 MPa m−1 to 0.09 MPa m−1, the cumulative injection volume decreases by 7.1%.
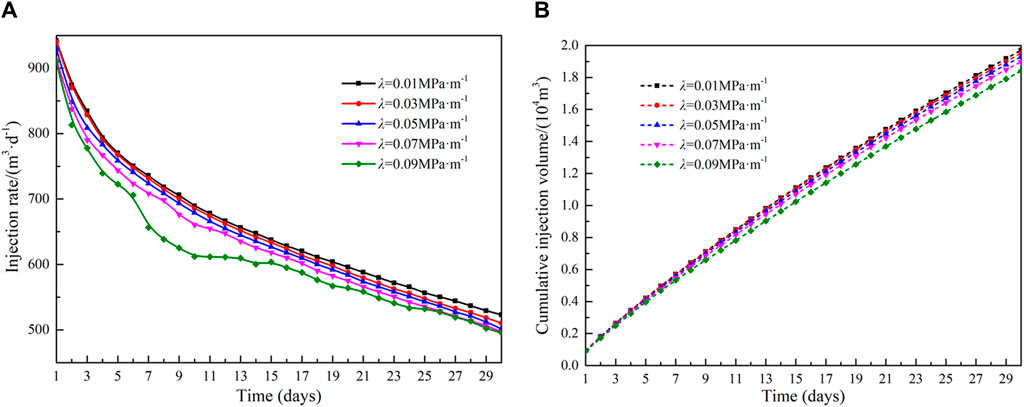
Figure 14. Influence of threshold pressure gradient on injection capacity: (A)injection rate and (B)cumulative injection volume.
4.2.6 Effect of production pressure difference
Figure 15 shows the injection rate and cumulative injection volume curves under different production pressure difference conditions. It can be seen from Figure 15A that the injection rate increases as the production pressure difference increases, but decreases over time as the injection continues. When the production pressure difference increases from 5 MPa to 30 MPa, the average injection rate increases from 183.5 m3 d−1–1,665.0 m3 d−1, an increase of 9.1 times, the cumulative injection volume increases from 0.55 × 10⁴ m3 to 4.99 × 10⁴ m3, an increase of 8.1 times.
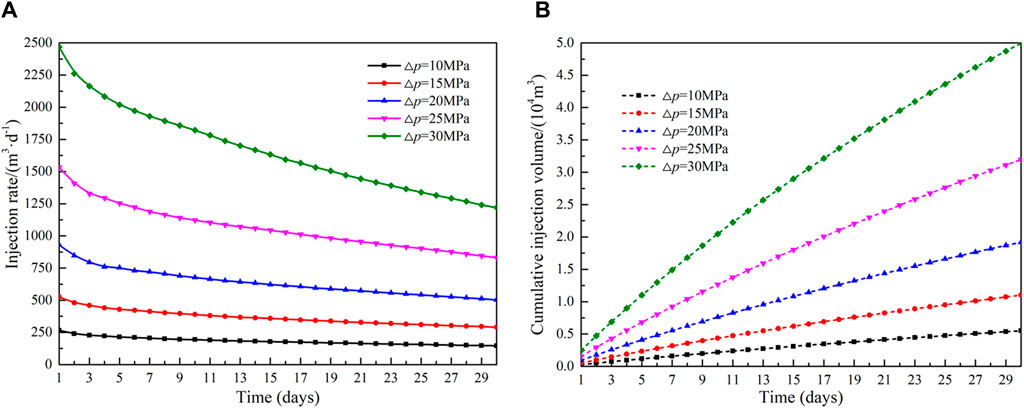
Figure 15. Influence of production pressure difference on injection capacity: (A)injection rate and (B)cumulative injection volume.
4.2.7 Discussion of the effects of the parameters on cumulative injection volume
The influence levels of the above 10 uncertainty parameters on the difference in cumulative injection volume are summarized in the tornado diagram (Yu et al., 2015; Wang et al., 2017c), as shown in Figure 16. The results show that the most sensitive parameter is production pressure difference, followed by stress sensitivity factor in the reformation area, permeability in the reformation area, rock compressibility in the reformation area, porosity in the reformation area, threshold pressure gradient, stress sensitivity factor in the matrix area, permeability in the matrix area, rock compressibility in the matrix area and porosity in the matrix area. According to the scope of investigation in this study, the effect of parameters in the reformation area on the cumulative injection volume varies between −22.0% and 25.8%. Compared with the reformation area parameters, the effect of matrix area parameters is less sensitive, and their influence on the cumulative injection volume varies between −0.13% and 0.27%. Therefore, during high-pressure water injection, effective reservoir reformation is crucial to improve injection capacity. Furthermore, the effect of threshold pressure gradient on injection capacity is negatively correlated.
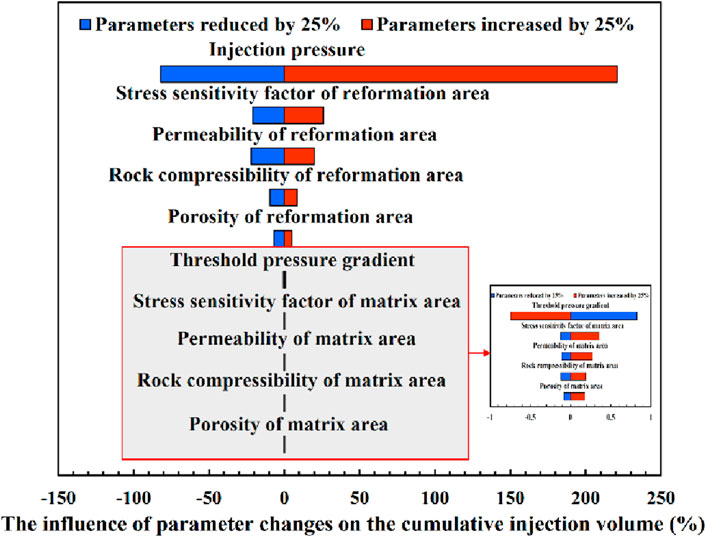
Figure 16. Tornado chart of sensitivity study.
5 Conclusion
This study proposed an injection capacity evaluation method of high-pressure water injection for low permeability reservoirs. A mathematical model of oil-water two-phase fluid-structure interaction considering the threshold pressure gradient was established. The finite element method was used to solve the established mathematical model. Based on the geological background of Binnan Oilfield, the injection capacity evaluation study was carried out, and several conclusions can be drawn.
(1) The production pressure difference is the key factor that determines the injection capacity of high-pressure water injection. When the production pressure difference increases from 5 MPa to 30 MPa, the average injection speed increases by 9.1 times; the cumulative injection volume increases by 8.1 times.
(2) The effect of the physical parameters in the reformation area on the injection capacity of high-pressure water injection is significantly greater than that of the parameters in the matrix area. During the high-pressure water injection process, effective reservoir reformation is a key measure for enhancing injection capacity.
(3) The order of factors based on their effect on the cumulative injection volume from high to low is as follows: production pressure difference, stress sensitivity factor in the reformation area, permeability in the reformation area, rock compressibility in the reformation area, porosity in the reformation area, threshold pressure gradient, stress sensitivity factor in the matrix area, permeability in the matrix area, rock compressibility in the matrix area and porosity in the matrix area.
Forthcoming research endeavors will be directed towards initiating and propagating fractures caused by high-pressure injection and analyzing the impact of dynamic fracture changes on the injection capacity of low-permeability reservoirs. Furthermore, research will continue to focus on the development phase following the replenishment of formation energy. This will involve carrying out capacity forecasting research and optimizing production systems to enhance oil recovery.
Data availability statement
The original contributions presented in the study are included in the article/supplementary material, further inquiries can be directed to the corresponding author.
Author contributions
WZ: Conceptualization, Methodology, Validation, Writing–original draft, Writing–review and editing. YG: Conceptualization, Methodology, Software, Validation, Writing–original draft. YW: Methodology, Writing–review and editing. PL: Software, Writing–review and editing. YL: Conceptualization, Validation, Writing–original draft.
Funding
The author(s) declare that financial support was received for the research, authorship, and/or publication of this article. The Open Fund Project of Research and Development Center for the Sustainable Development of Continental Sandstone Mature Oilfield by National Energy Administration (33550000-22-ZC0613-0217).
Acknowledgments
We are very grateful to all the people who have contributed to this work.
Conflict of interest
The authors declare that the research was conducted in the absence of any commercial or financial relationships that could be construed as a potential conflict of interest.
Publisher’s note
All claims expressed in this article are solely those of the authors and do not necessarily represent those of their affiliated organizations, or those of the publisher, the editors and the reviewers. Any product that may be evaluated in this article, or claim that may be made by its manufacturer, is not guaranteed or endorsed by the publisher.
References
Blunt, M. J. (2017). Multiphase flow in permeable media: a pore-scale perspective. Cambridge University Press.
Chen, D., Pang, X., Jiang, Z., Zeng, J., Qiu, N., and Li, M. (2009). Reservoir characteristics and their effects on hydrocarbon accumulation in lacustrine turbidites in the Jiyang Super-depression, Bohai Bay Basin, China. Mar. Petroleum Geol. 26 (2), 149–162. doi:10.1016/j.marpetgeo.2008.03.003
Chen, Z., Huan, G., and Ma, Y. (2006). Computational methods for multiphase flows in porous media. Society for Industrial and Applied Mathematics.
Chu, H., Ma, T., Zhu, W., Gao, Y., Zhang, J., and Lee, W. J. (2023b). A novel semi-analytical monitoring model for multi-horizontal well system in large-scale underground natural gas storage: Methodology and case study. Fuel 334, 126807. doi:10.1016/j.fuel.2022.126807
Chu, H., Zhang, J., Li, J., Zhu, W., Ma, T., Gao, Y., et al. (2023a). Impact of well interference on transient pressure behavior during underground gas storage: a comparative study. J. Clean. Prod. 430, 139628. doi:10.2118/214780-ms
Das, A., Nguyen, N., and Nguyen, Q. P. (2020). Low tension gas flooding for secondary oil recovery in low-permeability, high-salinity reservoirs. Fuel 264, 116601. doi:10.1016/j.fuel.2019.116601
Global (2024). BP. Available at: https://www.bp.com/en/global/corporate/energy-economics/statistical-review-of-world-energy.html.
Guo, X., He, S., Liu, K., Song, G., Wang, X., and Shi, Z. (2010). Oil generation as the dominant overpressure mechanism in the cenozoic dongying depression, Bohai Bay Basin, China. AAPG Bull. 94 (12), 1859–1881. doi:10.1306/05191009179
He, Y., Cheng, S., Li, L., Mu, G., Zhang, T., Xu, H., et al. (2017). Waterflood direction and front characterization with four-step work flow: a case study in changqing oil field China. SPE Reserv. Eval. Eng. 20 (03), 708–725. doi:10.2118/178053-pa
Hou, S., Ren, S., Wang, W., Niu, B., Yu, H., Qian, G., et al. (2010). Feasibility study of air injection for IOR in low permeability oil reservoirs of Xinjiang Oilfield China. SPE Int. Oil Gas Conf. Exhib. China. SPE. SPE-131087-MS. doi:10.2523/131087-ms
Hu, Y., Hao, M., Chen, G., Sun, R., and Li, S. (2019). Technologies and practice of CO2 flooding and sequestration in China. Petroleum Explor. Dev. 46 (4), 753–766. doi:10.1016/s1876-3804(19)60233-8
Ji, B., and Fang, J. (2023). An overview of efficient development practices at low permeability sandstone reservoirs in China. Energy Geosci. 4, 100179. doi:10.1016/j.engeos.2023.100179
Jia, C. (2020). Development challenges and future scientific and technological researches in China's petroleum industry upstream. Acta Pet. Sin. 41 (12), 1445. doi:10.7623/syxb202012001
Jiang, D., Chen, H., Xing, J., Shang, L., Wang, Q., Sun, Y., et al. (2022). A novel method of quantitative evaluation and comprehensive classification of low permeability-tight oil reservoirs: a case study of Jidong Oilfield, China. Petroleum Sci. 19 (4), 1527–1541. doi:10.1016/j.petsci.2022.03.001
Kang, W., Zhou, B., Issakhov, M., and Gabdullin, M. (2022). Advances in enhanced oil recovery technologies for low permeability reservoirs. Petroleum Sci. 19 (4), 1622–1640. doi:10.1016/j.petsci.2022.06.010
Li, S., Wang, Q., Zhang, K., and Li, Z. (2020). Monitoring of CO2 and CO2 oil-based foam flooding processes in fractured low-permeability cores using nuclear magnetic resonance (NMR). Fuel 263, 116648. doi:10.1016/j.fuel.2019.116648
Li, X., Yang, Z., Li, S., Huang, W., Zhan, J., and Lin, W. (2021). Reservoir characteristics and effective development technology in typical low-permeability to ultralow-permeability reservoirs of China National Petroleum Corporation. Energy Explor. Exploitation 39 (5), 1713–1726. doi:10.1177/01445987211005212
Li, X., Zou, J., and Yan, R. (2022). Effect of in-situ emulsification of surfactant on the enhanced oil recovery in low-permeability reservoirs. Colloids Surfaces A Physicochem. Eng. Aspects 634, 127991. doi:10.1016/j.colsurfa.2021.127991
Liu, W., Zhang, Q., and Zhu, W. (2019). Numerical simulation of multi-stage fractured horizontal well in low-permeable oil reservoir with threshold pressure gradient with moving boundary. J. Petroleum Sci. Eng. 178, 1112–1127. doi:10.1016/j.petrol.2019.04.033
Liu, Y., Wang, F., Wang, Y., Li, B., Zhang, D., Yang, G., et al. (2022). The mechanism of hydraulic fracturing assisted oil displacement to enhance oil recovery in low and medium permeability reservoirs. Petroleum Explor. Dev. 49 (4), 864–873. doi:10.1016/s1876-3804(22)60316-1
Nwokolo, C. (2013). Application of novel techniques to fractured injection diagnostics in waterflood developments. Lagos, Nigeria: Paper presented at the SPE Nigeria Annual International Conference and Exhibition.
Pedrosa, O. A. (1986). “Pressure transient response in stress-sensitive formations,” in Paper presented at the SPE California regional meeting, oakland, California.
Song, G., Wang, Y., Lu, D., Yan, R., and Yang, J. (2012). Controlling factors of carbonate rock beach and bar development in lacustrine facies in the Chunxia submember of Member 4 of Shahejie Formation in south slope of Dongying Sag, Shandong Province. J. Palaeogeogr. 14 (5), 565–570.
Wang, J., Jiang, Z., Zhang, Y., Wei, X., Wang, H., and Liu, S. (2016). Quantitative evaluation of the reservoir potential and controlling factors of semi-deep lacustrine tempestites in the Eocene Lijin Sag of the Bohai Bay Basin, East China. Mar. Petroleum Geol. 77, 262–279. doi:10.1016/j.marpetgeo.2016.05.006
Wang, L., and Wei, L. (2011). Study on advanced water injection time in low permeability reservoir. Energy Power Eng. 3 (2), 194–197. doi:10.4236/epe.2011.32025
Wang, X., Dang, H., and Gao, T. (2018). Method of moderate water injection and its application in ultra-low permeability oil reservoirs of Yanchang Oilfield, NW China. Petroleum Explor. Dev. 45 (6), 1094–1102. doi:10.1016/s1876-3804(18)30112-5
Wang, Y., Cheng, S., Feng, N., He, Y., and Yu, H. (2017b). The physical process and pressure-transient analysis considering fractures excessive extension in water injection wells. J. Petroleum Sci. Eng. 151, 439–454. doi:10.1016/j.petrol.2017.01.006
Wang, Y., Cheng, S., Feng, N., Xu, J., Qin, J., He, Y., et al. (2017a). Semi-analytical modeling for water injection well in tight reservoir considering the variation of waterflood-Induced fracture properties–Case studies in Changqing Oilfield, China. J. Petroleum Sci. Eng. 159, 740–753. doi:10.1016/j.petrol.2017.09.043
Wang, Y., Cheng, S., Zhang, K., and Ayala, L. F. (2019). Investigation on the transient pressure response of water injector coupling the dynamic flow behaviors in the wellbore, waterflood-induced fracture and reservoir: semi-analytical modeling and a field case. Int. J. Heat Mass Transf. 130, 668–679. doi:10.1016/j.ijheatmasstransfer.2018.09.083
Wang, Y., Wang, X., Xing, Y., Xue, J., and Wang, D. (2017c). Three-dimensional numerical simulation of enhancing shale gas desorption by electrical heating with horizontal wells. J. Nat. Gas Sci. Eng. 38, 94–106. doi:10.1016/j.jngse.2016.12.011
Wei, J., Liang, S., Zhang, D., Li, J., and Zhou, R. (2023). Frozen core experimental study on oil-water distribution characteristics at different stages of water flooding in low permeability oil reservoirs. Energy 278, 128007. doi:10.1016/j.energy.2023.128007
Xiao, W., Ren, J., Pu, W., Yuan, C., Meng, L., Zheng, L., et al. (2023). Laboratory tests and field pilot of foam-assisted deoxidized-air flooding in a low-permeability sandstone reservoir. Fuel 352, 129150. doi:10.1016/j.fuel.2023.129150
Xie, X., Jiang, H., Chen, M., Liu, T., and Zhang, W. (2009). Timing of advanced water flooding in low permeability reservoirs. Min. Sci. Technol. (China) 19 (1), 124–128. doi:10.1016/s1674-5264(09)60023-5
Yu, W., Zhang, T., Du, S., and Sepehrnoori, K. (2015). Numerical study of the effect of uneven proppant distribution between multiple fractures on shale gas well performance. Fuel 142, 189–198. doi:10.1016/j.fuel.2014.10.074
Yu, Z., Wang, Z., Jiang, Q., Wang, J., Feng, Y., Zheng, J., et al. (2022). Evaluation of low permeability conglomerate reservoirs based on petrophysical facies: a case study from the Triassic Baikouquan Formation, northern Mahu Sag, Junggar Basin, China. J. Petroleum Sci. Eng. 219, 111082. doi:10.1016/j.petrol.2022.111082
Zeng, F., Dong, C., Lin, C., Tian, S., Wu, Y., Lin, J., et al. (2022). Pore structure characteristics of reservoirs of Xihu Sag in East China Sea Shelf Basin based on dual resolution X-ray computed tomography and their influence on permeability. Energy 239, 122386. doi:10.1016/j.energy.2021.122386
Zhang, N., Wei, M., and Bai, B. (2018). Statistical and analytical review of worldwide CO2 immiscible field applications. Fuel 220, 89–100. doi:10.1016/j.fuel.2018.01.140
Zhang, P., Ren, S., Shan, Y., Zhang, L., Liu, Y., Huang, L., et al. (2019). Enhanced stability and high temperature-tolerance of CO 2 foam based on a long-chain viscoelastic surfactant for CO2 foam flooding. RSC Adv. 9 (15), 8672–8683. doi:10.1039/c9ra00237e
Zhang, Q., Liu, W., Wei, J., Taleghani, A. D., Sun, H., and Wang, D. (2022). Numerical simulation study on temporary well shut-in methods in the development of shale oil reservoirs. Energies 15 (23), 9161. doi:10.3390/en15239161
Zhao, X., Cun, X., Li, N., Yu, J., Ren, X., Shen, F., et al. (2022). Simulation of volumetric acid fracturing fracture in low permeability carbonate rock. Petroleum Sci. Technol. 40 (19), 2336–2360. doi:10.1080/10916466.2022.2041664
Zhu, W., Liu, Y., Li, Z., Yue, M., and Kong, D. (2021). Study on pressure propagation in tight oil reservoirs with stimulated reservoir volume development. ACS omega 6 (4), 2589–2600. doi:10.1021/acsomega.0c04661
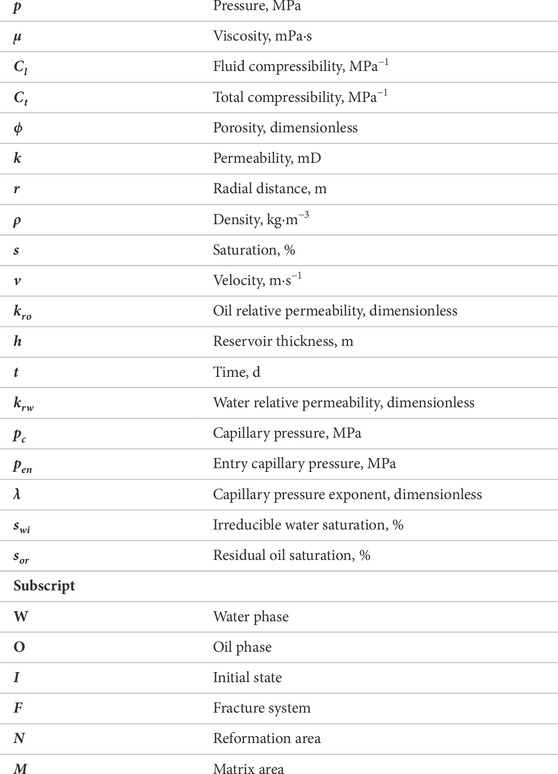
Nomenclature
Keywords: injection capacity, high-pressure water injection, low permeability oil reservoir, numerical simulation, sensitivity analysis
Citation: Zhu W, Gao Y, Wang Y, Liu P and Liu Y (2024) The injection capacity evaluation of high-pressure water injection in low permeability reservoir: numerical and case study. Front. Earth Sci. 12:1411451. doi: 10.3389/feart.2024.1411451
Received: 03 April 2024; Accepted: 14 May 2024;
Published: 07 June 2024.
Edited by:
Hongjian Zhu, Yanshan University, ChinaReviewed by:
Yongfei Yang, China University of Petroleum, ChinaFuhua Shang, Inner Mongolia University of Technology, China
Copyright © 2024 Zhu, Gao, Wang, Liu and Liu. This is an open-access article distributed under the terms of the Creative Commons Attribution License (CC BY). The use, distribution or reproduction in other forums is permitted, provided the original author(s) and the copyright owner(s) are credited and that the original publication in this journal is cited, in accordance with accepted academic practice. No use, distribution or reproduction is permitted which does not comply with these terms.
*Correspondence: Yubao Gao, Z3l1YmFvMTk5NkAxNjMuY29t