 Guangdong Lv1,2
 Wenwei Li
95% of researchers rate our articles as excellent or good
Learn more about the work of our research integrity team to safeguard the quality of each article we publish.
Find out more
ORIGINAL RESEARCH article
Front. Earth Sci. , 12 July 2024
Sec. Geohazards and Georisks
Volume 12 - 2024 | https://doi.org/10.3389/feart.2024.1411244
This article is part of the Research Topic Mechanism, Stability and Mitigation of Large-scale Reservoir Landslides View all 8 articles
This research develops an elastoplastic damage constitutive model incorporating the strain softening response of common engineering soil materials in southeastern Xizang to evaluate and optimize reinforcement solutions for highway-traversing landslide accumulations. Grounded in deterioration mechanics theory, the model characterizes the progressive strength loss and failure evolution of the soils. Verified and calibrated, it is numerically implemented in FLAC3D to simulate the stability conditions of a landslide affecting planned highway infrastructure in southeastern Xizang. Safety factors of 1.25, 1.07, and 1.02 under normal operation, rainfall, and seismic excitation loads, respectively, reveal the inadequacy of intrinsic stability. Consequently, dynamic compaction and chemical grouting techniques are assessed via simulation. An optimal strategy, entailing 6-m-deep densification at the highway location with 10% silica fume enhancement of 66.3% of the landslide area and 50.8% of the soil-bedrock interface, results in safety factors of 1.70, 1.49, and 1.23 for the three scenarios. The improved area is minimized to streamline construction practicality and economics while preserving geotechnical integrity. The integrated modeling outcomes demonstrate the model's capability in capturing localized incremental damage and the efficacy of numerical simulation for stability diagnosis and targeted remediation of intricate landslides. Advancements in constitutive relations development are vital for further innovation in geohazard evaluation and infrastructure safety assurance.
In geotechnical engineering, addressing the unique challenges posed by the mountainous terrain of Southeast Xizang, especially in highway engineering, is of paramount importance. The region is characterized by a complex geological structure, frequent seismic activity, and numerous landslide accumulations. Consequently, it is crucial to gain a thorough understanding of the mechanical properties of these distinctive quaternary accumulations and develop effective reinforcement strategies. Studies such as those by Yanjun et al. (Yanjun et al., 2003) and Zhang et al. (Zhang et al., 2022) have focused on addressing severe slope failure hazards along the Sichuan-Xizang Highway and the scientific problems in railway tunnel construction in Southeast Xizang, respectively. The 2008 Wenchuan earthquake’s profound impact, which triggered over 60,000 landslides, highlights the urgent need for advanced geohazard assessments in such regions (Wu et al., 2020). The significant research by Chigira et al. (Chigira et al., 2010) and Yin et al. (Yin et al., 2009) documented the landslides induced by the 2008 Wenchuan earthquake and analyzed the landslide hazards triggered by this event, emphasizing the need for enhanced geohazard understanding and mitigation strategies (Huang and Li, 2008; Zuo et al., 2023).
Advancements in geotechnical assessments have been crucial in understanding the stability of landslide accumulation slopes and susceptibility, evidenced by significant literature (Zuo et al., 2023; Kumar et al., 2018; Shu et al., 2023; Pradhan and Siddique, 2020). Recent innovations include the use of advanced rock mass characterization and simulation techniques (Pradhan and Siddique, 2020; Zhang et al., 2019; Li et al., 2019), with methods like the finite element method (FEM) and finite difference method (FDM) playing a key role in enhancing slope stability analysis and predicting landslide triggers, as detailed in studies by Chen et al. (Chen et al., 2020), Siddique et al. (Siddique et al., 2020), and Yi et al. (Yi et al., 2023). Additionally, the adoption of discontinuous numerical simulation approaches, such as Discrete Element Modeling (DEM) and Discontinuous Deformation Analysis (DDA), has improved modeling accuracy. These methods have been crucial in studying the impact of geological conditions, seismic forces, and topographical features on landslide stability. Notably, Cai et al. (Cai et al., 2022) employed a continuous–discontinuous method to analyze the Yigong landslide, simulating the entire failure process. Similarly, Huang et al. (Huang et al., 2016) enhanced the Discontinuous Deformation Analysis by incorporating dynamic friction degradation of joints, which improved the modeling of earthquake-induced landslides. Luo et al. (Luo et al., 2021) and Wang et al. (Wang et al., 2023) have contributed critical insights into seismic-induced landslide failures. These advancements provide detailed insights into landslide mechanics, enabling more precise assessments of slope stability under varied geological and seismic conditions as highlighted by Huang et al. (Zuo et al., 2023). This evolving landscape of geotechnical methods underscores the need for continuous innovation and application of new models to better understand and mitigate landslide risks, setting the stage for this current study.
The selection of appropriate soil constitutive models is crucial in numerical simulations for reliable slope stability analysis, given the complex behavior of soil under diverse environmental and loading conditions. Recent studies emphasize the critical role of such models in accurately simulating large deformations and post-failure behaviors of slopes, significantly enhancing the precision of safety factor calculations, which are essential measures of slope stability and risk assessment in geotechnical engineering (Ering and Sivakumar Babu, 2016; Zou et al., 2020; Tang et al., 2019). Yuan et al. (Yuan et al., 2020) highlight the vital contribution of these models to slope failure simulations, while Mohsan et al. (Mohsan et al., 2021) underscore the importance of comparing different models to ensure reliable stability estimates, offering insights into their advantages and limitations. Gallardo et al. (Gallardo et al., 2023) stress the need for nuanced constitutive modeling, especially for analyzing unsaturated conditions in copper filtered tailings piles, to accurately assess static stability. Cao et al. (Cao et al., 2024) discuss the relevance of rock damage models in modeling brittle rock behavior and strength failure criteria, vital for slope stability evaluations. Studies by E Ponzoni et al. (Ponzoni et al., 2023) and A Dadashiserej et al. (Dadashiserej et al., 2024) further illustrate the importance of model selection in understanding soil foundation layers' pre-failure and failure stages and analyzing cyclic shear strain failure criteria in subduction zone earthquakes, respectively. These discussions highlight the discrepancies among constitutive models used in similar studies, pointing out how variations in model performance and suitability can lead to different predictions and safety assessments, underscoring the need for careful selection based on specific soil characteristics and environmental conditions.
In summary, the collective research highlights the importance of using the right soil constitutive models for slope stability simulations, due to soil’s complex behavior under various conditions. Accurate models are essential for precise and realistic stability assessments, enhancing the safety and reliability of geotechnical structures. However, different models may vary in their effectiveness, especially under changing conditions. Understanding these limitations is crucial for selecting the most appropriate model, ensuring more accurate and reliable stability evaluations and improving geotechnical project management.
The intricacies and inherent risks associated with infrastructure projects in regions like Southeast Xizang necessitate the fusion of technological advancements with pragmatic engineering solutions. This fusion is vital for enhancing landslide stability and fortifying at-risk areas. Prior research lays a solid groundwork for devising efficient mitigation strategies, crucial for bolstering the safety and durability of highway engineering projects in challenging environments, as noted by Jiang et al. (Jiang et al., 2022) and Zhang et al. (Zhang et al., 2021). Comprehensive literature reviews and detailed field studies of highway projects in Southeast Xizang emphasize the need for thorough stability analyses of landslide accumulation bodies. This requirement is amplified by the region’s frequent landslides and complex geological conditions, which often result in highways intersecting landslide-prone zones. The cornerstone of this study is the creation of an advanced soil constitutive model, integrating features characteristic of deterioration and damage, and tailored to the specific mechanical and strength attributes of the regional soil. Implementing this model in the enhancement and reinforcement of highway embankments in local engineering initiatives is a critical aspect of this research. It facilitates a comprehensive examination of the deformation and stability of accumulation bodies under various reinforcement scenarios. Such evaluation is crucial in providing a solid scientific foundation for ongoing research and practical applications in the field of landslide accumulation body improvement and reinforcement.
Damage in materials pertains to their deterioration due to internal structural changes under load, evolving dynamically with the material’s inherent defects during loading (Rehman et al., 2016). Currently, two primary approaches are employed in the study of material damage: micromechanics and micromechanics. Micromechanics explores small-scale structural alterations using advanced scientific techniques such as electron microscopy, which involves examining micropores, micro-fractures, and applying volume unit averaging methods (Allison et al., 2014; Ng et al., 2014). In micromechanical studies, damage variables are typically defined based on the stress-strain equivalence principle and strain analysis (Yang et al., 2010). In the context of common engineering soil materials, particularly those in the southeastern region of Xizang, stress-strain, or shear stress displacement patterns, as illustrated in Figure 1, can generally be segmented into three distinct phases, each characterized by varying degrees of damage.
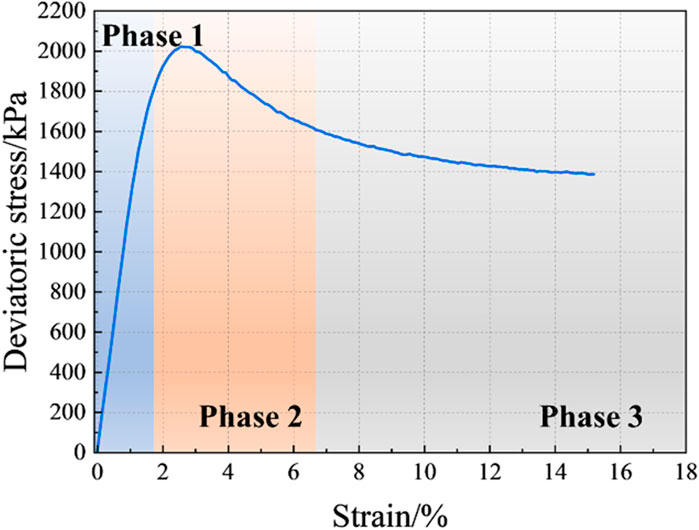
Figure 1. Typical stress response curves.
Phase 1 can be characterized as the elastic phase, during which the specimen’s volume contracts, resembling anisotropic compression. In this phase, the specimen’s internal pores constrict without incurring damage. Phase 2, the softening stage, is marked by the initiation and expansion of microscopic cracks within the specimen, accompanied by increasing damage. Here, cohesion escalates with axial load, countering external forces. As stress peaks, deviator stress diminishes sharply with axial strain, leading to further development, expansion, and penetration of cracks, and escalating damage. Phase 3, the residual stage, features a deceleration in deviator stress variation, with the damage level stabilizing.
Indeed, the plastic strain in soil is indicative of the internal energy dissipation process within the material (Hanley et al., 2018). Consequently, this study posits a close relationship between the damage extent in coarse-grained mixed soil under stress and its plastic strain. To this end, the concept of equivalent plastic strain from classical elastoplastic theory is adopted as the dependent variable for the damage variable. The formulation of the damage variable is expressed as Eqs 1–3.
where D is the damage variable, and a is the dimensionless parameter of the model;
The mechanical response curves from triaxial shear and direct shear tests suggest that the soil behaves as a linear elastic material during the initial loading phase, without incurring plastic strain. However, upon reaching the yield point, plastic strain emerges, leading to internal damage in the sample and the accumulation of equivalent plastic strain, thereby transitioning the stress-strain curve into the softening stage. This paper concludes that the onset of yield in soil can be effectively determined by employing the Mohr-Coulomb strength criterion (Eqs 4, 5) (Taborda et al., 2022).
Where FS is the shear strength,
The tensile yield criterion is expressed as Eq. 6:
Where f t is the tensile strength, and
To accurately represent the softening stage of the material, this study posits that the cohesion of the material progressively diminishes in correlation with the escalation of material damage. This relationship can be expressed as Eq. 7:
where cnew is the cohesion of material under damaged condition, c0 is the initial cohesion, and cr is the residual cohesion.
When the equivalent plastic strain is greater than the critical equivalent plastic strain, the soil reaches the residual stage, and the damage amount remains unchanged. The cohesion value of the residual stage is equivalent to the residual cohesion value, that is, the cohesion value of the soil is affected by the degree of damage during the loading process, and gradually decreases from the initial cohesion C0 to the residual value Cr.
The model adopts the law of associative flow, and according to the expression of the yield function, the shear plastic potential function g can be expressed as Eq. 8:
The tensile plastic potential function gt can be expressed as Eq. 9:
In summary, the parameters of this model include cohesion c, internal friction angle, critical equivalent plastic strain, tensile strength, residual cohesion, and dimensionless parameters
To streamline the implementation of the constitutive model of elastoplastic damage, this model is also integrated into established industrial software. Specifically, the study plans to utilize FLAC3D software for the secondary development of the constitutive model (Wang et al., 2017). Consequently, the three-dimensional finite difference format of the model has been derived.
In the early stage of the model, it is considered to be the elastic stage, and the tensor form of the stress-strain increment relationship can be expressed as Eq. 10:
Where
The component form can be expressed as Eq. 11:
During the ceremony,
Upon the stress state of an element reaching the yield surface, the corresponding stresses necessitate adjustment. In FLAC3D, this is achieved by initially calculating the probe stress based on elasticity, followed by employing the return mapping method for correction. Accordingly, the stress increment is formulated as Eq. 12:
where
This can be expressed as Eqs 13–16:
where
Then by the consistency condition, that is, the yield condition that the real stress should meet Eq. 20:
From the above, the plastic multiplier can be solved as Eqs 21, 22:
Bringing Eqs 13, 22 into Eq. 11 yields:
The case study selects the landslide accumulation body along the 318 National Highway in Tongmai Town, Bomi County with complicated geological and topographic conditions. Given the comprehensive route selection, the planned highway must traverse the landslide’s centre, rendering its stability crucial. The genesis of this landslide accumulation, as depicted in Figure 2, involves several factors. The Yigong landslide-induced debris flow significantly impacted the original slope. The flood’s sowing height reached approximately 40 m, and prolonged immersion markedly weakened the soil’s mechanical properties at the slope’s base. Furthermore, the debris flow eroded and scoured the slope’s foot, undermining its structure, causing the slope’s front edge to recede, increasing the free surface area, and consequently diminishing the front edge’s supportive function. Post-flood, the rapid decline in water level led to the abrupt disappearance of groundwater in the submerged area at the slope’s base. This event, coupled with hydro-dynamic pressure, a sudden increase in the free surface, and reduced soil strength, precipitated a rapid loss of balance in the slope soil. The resulting traction damage occurred along a relatively weak surface, accumulating in the slope’s middle and lower sections. Some materials also encroached upon the riverbed, culminating in the present landslide accumulation.
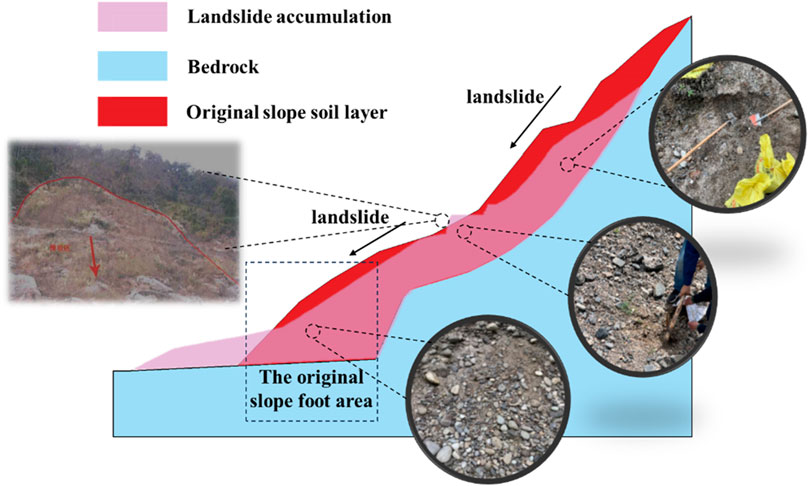
Figure 2. The composition of the landslide accumulation.
The composition of the landslide accumulation primarily consists of gravel and block stone, as depicted in Figure 2. This material structure is relatively loose and forms a highly permeable layer, thus facilitating rainfall infiltration and predisposing it to creeping deformation. The central and lower sections of the landslide accumulation body serve as vital transportation routes, where heavy vehicle traffic significantly increases the engineering load, adversely affecting the stability of the landslide accumulation.
Based on onsite drilling data and survey findings, the landslide accumulation in southeast Xizang primarily consists of coarse-grained mixed soil interspersed with stones and gravel, featuring a central gravel layer underlain by commonly drifting pebbles and a bedrock of mafic plagioclase gneiss. A numerical model was developed using FLAC3D software, complemented by Rhino software for constructing the geological model due to the complex terrain and preprocessing limitations of FLAC3D. This approach allowed for accurate representation by simplifying the model’s geometry to reflect essential geological features, focusing on stability and deformation patterns. Unit node data was then imported into FLAC3D for computational analysis, assigning specific soil and rock mechanics parameters based on depth and material properties. The model’s boundary conditions were meticulously set to simulate real-world constraints: fixed displacements in the x, y, and z directions at the bottom boundary represent deep earth layer behaviour, while front and back boundaries fixed in the x direction and left and right side boundaries in the y direction ensure lateral stability and mass continuity. These settings are crucial for the model’s ability to predict displacement and stress distribution under various loading conditions, enhancing its predictive accuracy for assessing regional stability and informing mitigation strategies. The numerical model is depicted in Figure 3, serving as a vital tool in understanding the dynamics of the landslide and its potential impact.
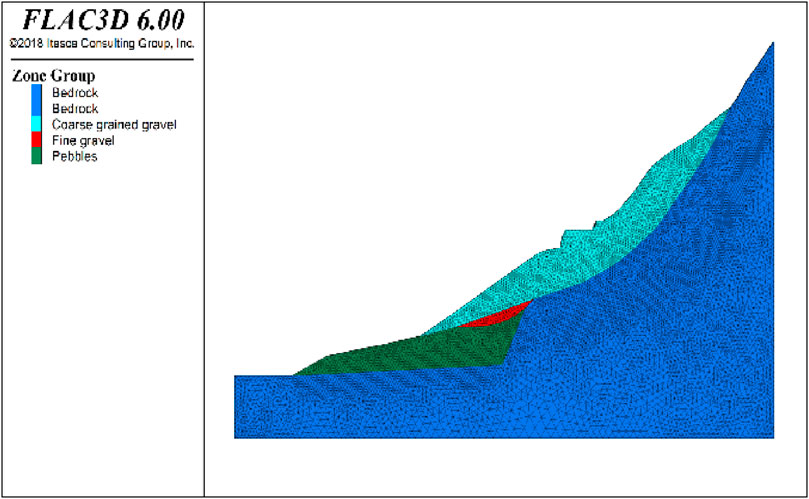
Figure 3. Model meshing.
In alignment with the actual project’s construction plan, the total length of the numerical calculation model is set at 190 m, with a height of 120 m and a thickness of 1 m. The model is segmented into 91,478 units and 27,140 nodes for computational purposes.
The proposed third-class highway, planned over a landslide-prone area with frequent rainfall and earthquakes, undergoes a stability analysis under three distinct operating conditions: normal, rainfall, and seismic. This analysis is critical for determining the feasibility of reinforcement strategies and guiding further enhancements for landslide management. In normal conditions, the study accounts for the highway’s vehicular load and the project’s self-weight on the landslide’s upper portion, using a quasi-static method to simulate these long-term impacts. This method effectively represents the loads as quasi-static, with the total load (Q) from the embankment uniformly distributed across the roadbed’s bottom, simulating a subgrade load of 100 kPa for the roadbed and pavement, plus an additional 7.9 kPa for standard highway-II level vehicles, totalling 107.9 kPa. For rainfall conditions, the model simplifies the process of soil strength decline from unsaturated to saturated states induced by rainfall. It adjusts the soil strength parameters of the saturated landslide accumulation by reducing them by 15%, reflecting the decreased soil strength post-rainfall, as supported by prior studies and geotechnical tests (Nguyen and Likitlersuang, 2019; Ng and Shi, 1998). In seismic scenarios, the analysis exclusively considers the horizontal seismic forces, with a basic seismic intensity of 8° and a horizontal seismic coefficient (Kh) of 0.2 for third-class highways. This comprehensive approach ensures a detailed evaluation of the landslide’s stability under varying conditions, facilitating targeted reinforcement solutions.
The extensive investigation of the landslide accumulation revealed that its upper layer primarily consists of massive rubble, while the area near the slope corner, affected by river erosion, is largely composed of floating pebbles. These two materials create a distinct gravel interlayer at their junction. This study proposes two effective reinforcement methods for the landslide accumulation. The first is dynamic compaction consolidation, such as impact rolling or vibro-stamping, recommended for areas with moderate slopes and feasible construction conditions, to enhance the density of the surface’s loose accumulations. Increased compactness significantly improves the soil’s deformation properties, notably its load-bearing capacity as a foundation. The second method, chemical improvement, is recognized for its cost-effectiveness, flexible application, and enduring benefits. This technique, often implemented with grouting and other processes, is widely utilized in diverse engineering projects, including water conservancy and transportation. In steeper slopes, chemical grouting substantially elevates soil shear strength, thereby improving the accumulation’s overall stability. This study builds on Zhao et al.'s method (Zhao et al., 2022) for soil improvement in high-altitude areas, which involves integrating PVA solution with filler materials. It specifically examines how combining PVA solution with silica fume or fibre affects soil enhancement and the resultant stability of the accumulation.
To enhance the accuracy of soil parameter determination in slope stability analysis, this study utilized a damage elastic-plastic constitutive model. Triaxial shear tests and direct shear tests were performed on coarse mixed and improved soil samples using an electro-hydraulic servo type large-scale dynamic and static triaxial test instrument and a DHJ50-2 cyclic shear testing machine. These tests aimed to assess the mechanical properties of the soils, with a specific model developed to effectively analyse the results (as shown in Figure 4). This comprehensive methodology enabled the precise evaluation of soil behaviour under various stress conditions, enhancing our understanding of their stability and structural integrity. Tests and simulations involved natural soil samples collected from the site, dense coarse-grained gravel with increased relative density to 0.7, and coarse-grained gravel stabilized by various improvers, subjected to confining pressures of 100, 200, 300, and 400 kPa. The model parameters were calibrated according to the stress-strain response characteristics depicted in Table 1. It should be noted that the parameters utilized in the slope stability analysis conducted in this study correspond to a confining pressure of 100 kPa.
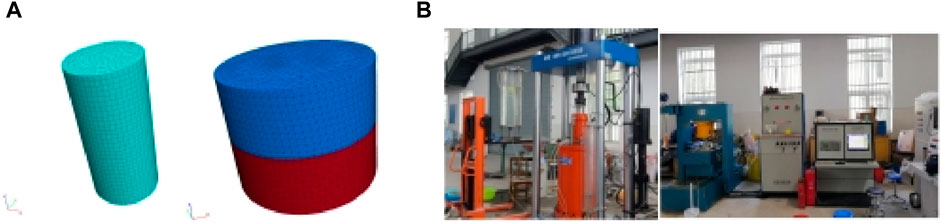
Figure 4. Numerical simulation model and experiment test. (A) Numerical simulation model. (B) Large triaxial test and direct shear test.
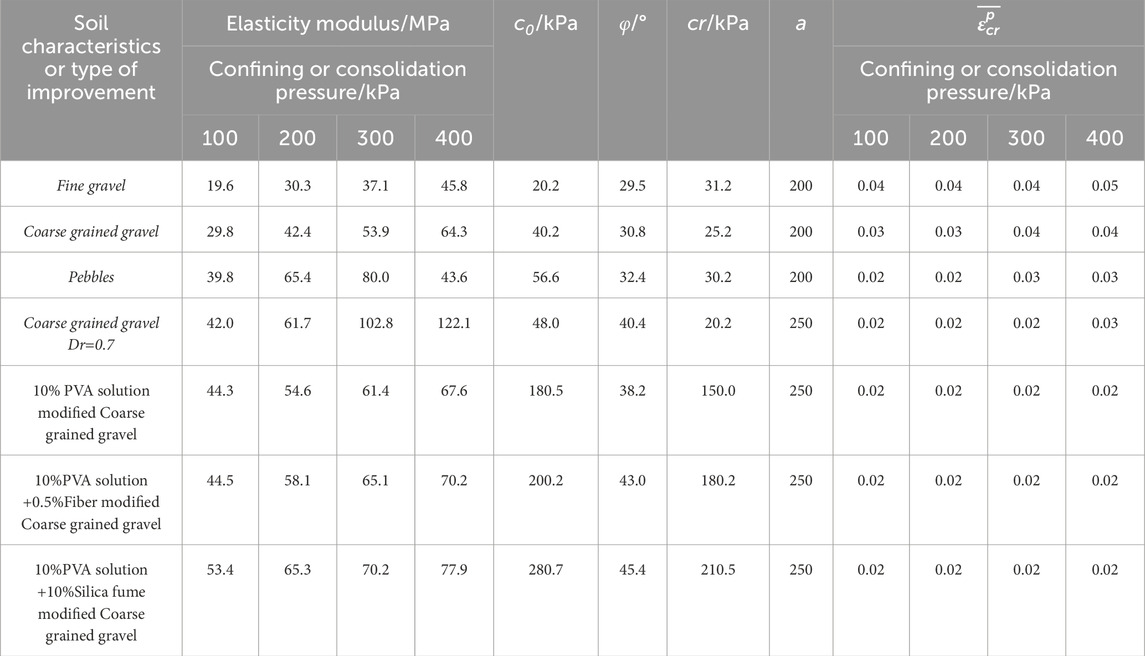
Table 1. Model calibration parameters.
The strength reduction method is used to calculate the factor of safety. The following two formulas are used to change the shear strength parameters of the rock and soil mass to determine the safety factor of the landslide accumulation, namely:
In which: c, c′ are the cohesion values of the materials before and after the reduction are respectively; φ, φ' are the internal friction angle before and after the material is reduced; Fs is the strength reduction factor. In this paper, the horizontal displacement of the landslide accumulation is abruptly changed. The reduction factor is used as the factor of safety.
In Figure 5A, depicting normal operating conditions, displacement within the landslide accumulation is primarily concentrated in the upper region on the right side of the highway, with the maximum total displacement exceeding 0.20 m. Interestingly, the highest vertical displacement, reaching up to 0.21 m, is observed on the left side of the highway, indicating a tendency towards uneven settlement. At the surface of the upper accumulation, the maximum horizontal displacement of 0.26 m underscores the instability of the highway design due to inadequate strength, leading to significant sliding displacement influenced by highway loading. During rainfall, as illustrated in Figure 5B, the displacement pattern remains similar, albeit with an expanded area of maximum and significant displacements (over 0.1 m) due to the diminished strength of the surface layer. Here, the horizontal, vertical, and total displacement values peak at 0.34 m, 0.23 m, and 0.34 m, respectively, with the horizontal displacement witnessing a 30% increase from the normal condition. Under seismic conditions, Figure 5C reveals a significant escalation in both horizontal and total displacements in the upper regions, particularly on the right side of the highway and along the left side of the design. The displacement exceeds 0.1 m across a wider area, stretching to the interface between the landslide body and the bedrock. The surface layer experiences a maximum horizontal displacement of 0.56 m and a total displacement of 0.57 m, highlighting a pronounced risk of slippage and the emergence of a potential slip surface necessitating reinforcement. Despite these changes, the maximum vertical displacement remains constant at 0.21 m, suggesting that seismic loading minimally affects the vertical movement of the accumulation. This comprehensive analysis demonstrates how varying conditions impact the displacement patterns within landslide accumulations, emphasizing the critical need for tailored reinforcement strategies to mitigate the risks associated with each specific scenario.

Figure 5. Displacement distributions under different working conditions: (A) Horizontal displacement (B) Vertical displacement (C) Total Displacement.
According to the strength reduction method, the safety factors of the landslide accumulation under normal operation, rainfall, and seismic conditions are 1.25, 1.07, and 1.02, respectively. As per the “Technical Code for Building Slope Engineering” (GB50330-2013) (Urban and Rural Construction Committee, 2013), considering the presence of National Highway 318—an important transportation route—within the landslide accumulation, the engineering safety level should be classified as Class I. The required safety factors are 1.35 for normal working conditions and above 1.15 for seismic conditions. The calculated results are notably below these standard requirements, indicating inadequate stability. Moreover, as demonstrated in Figure 6, under normal operation and rainfall conditions, the maximum shear strain exceeds 0.5 at the highway design, significantly higher than in other areas of the accumulation. This suggests lower strength at the highway location and a risk of local failure. Conversely, under seismic conditions, the area of maximum shear strain concentration at the highway design dissipates, being replaced by a strain exceeding 0.5 at the interface between the landslide accumulation and the bedrock. The increasing upper values indicate a heightened risk of overall sliding under seismic conditions.
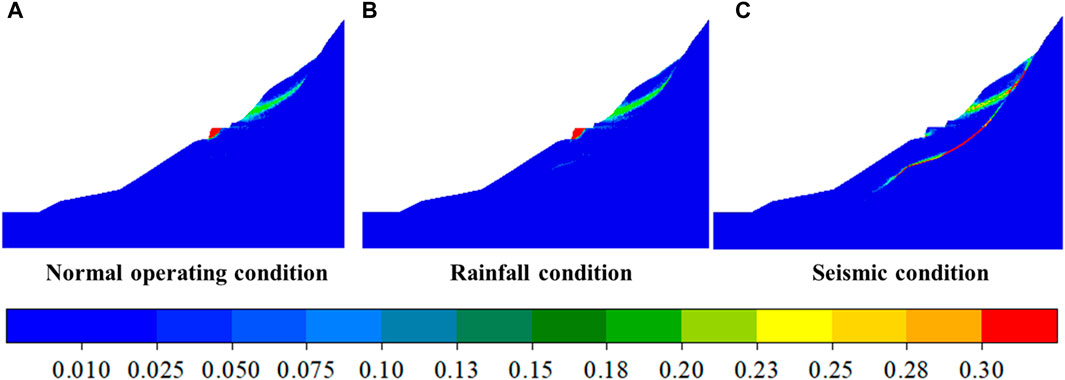
Figure 6. The maximum shear strain distribution of the landslide accumulation under different working conditions: (A) Normal operating condition (B) Rainfall condition (C) Seismic condition.
In summary, the computational analysis indicates that the overall stability of the landslide accumulation fails to meet the requirements of relevant standards. This finding suggests that the current state of the highway engineering project on this landslide accumulation poses significant risks. To ensure the long-term stability of the highway, it is imperative to implement appropriate reinforcement measures aimed at controlling deformation and enhancing stability.
This section focuses on the design and optimization of landslide accumulation reinforcement. This approach aims to control deformation and enhance stability. According to preliminary survey, displacement due to engineering loads is predominantly concentrated in the highway design area and the upper part of the accumulation. Consequently, tailored reinforcement designs can be implemented in these specific areas. As illustrated in Figure 7, the section of the landslide accumulation at the highway design is prone to vertical settlement exceeding 0.2 m and potential failure due to its low strength. In flatter terrains, dynamic compacting can be employed to improve compactness and thereby increase bearing capacity.
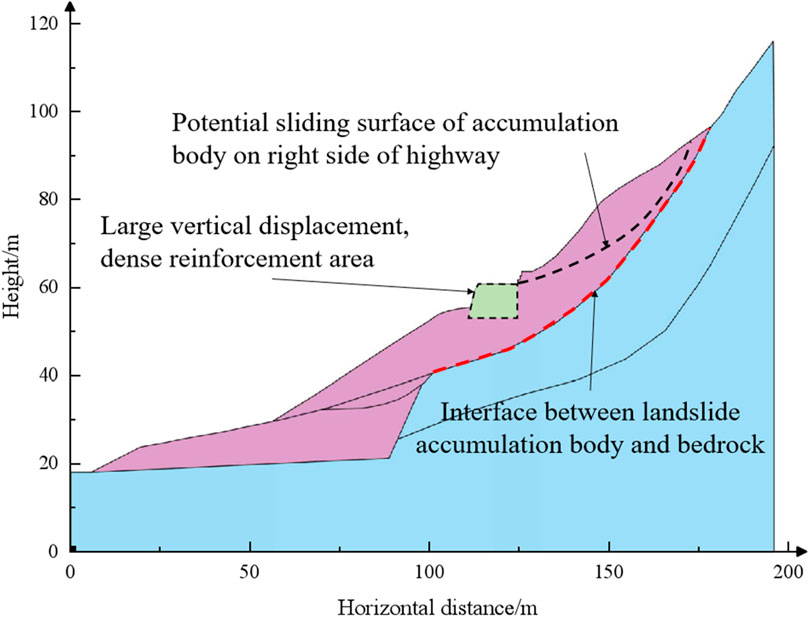
Figure 7. Schematic diagram of the area where the landslide accumulation needs to be improved and reinforced.
According to the pre-test results, the accumulation on the right side of the highway is susceptible to local sliding under normal operation and rainfall conditions, while under seismic conditions, it is at risk of global sliding. Given the steep terrain on both sides of the proposed highway, chemical improvement methods can be employed to strengthen the coarse-grained mixed soil in the grouting area, thereby enhancing the overall stability of the landslide accumulation and controlling sliding deformation. Decisions regarding the depth of dynamic compacting reinforcement, areas for chemical improvement, and material selection are based on numerical simulations. It is essential to note that the design and optimization of improved reinforcement should align with the construction process and adhere to the following steps:
(1) Initially, the reinforcement depth of dynamic density is established with the objective of controlling vertical displacement in the highway design office area.
(2) Subsequently, the grouting reinforcement area with the most significant impact on stability is identified. The effectiveness of various chemical improvement schemes is compared using numerical simulation results.
(3) The extent of the chemically improved reinforcement area is then determined based on the potential reinforcement region. The grouting area is strategically optimized from the top downwards, aiming to control stability and fulfil specification requirements. This approach prevents the risk of plastic soil flow at the slope’s base, which reduce anti-slip force and trigger landslides, by starting the optimization from higher elevations and expanding downwards.
(4) For the designated chemical improvement areas, the impact of different coarse-grained mixed soil improvement materials on stability is considered. This analysis informs the selection of suitable improvement materials.
Initially, the requisite depth for dynamic compaction is established. Subsequently, for the accumulation body in the area, engineering models at depths of 1, 2, 3, 4, 5, 6, 7, and 8 m are developed to analyse deformation and stability post-compaction. In each model, the soil parameters specified at dense depths are adjusted to coarse-grained gravel a relative density (DR) of 0.7, as outlined in Table 1, to simulate the densification effect. Given that the primary objective of dynamic compaction improvement is to minimize uneven settlement, the analysis primarily focuses on vertical displacement outcomes at various compaction depths. The contour distribution of these outcomes is illustrated in Figure 8.
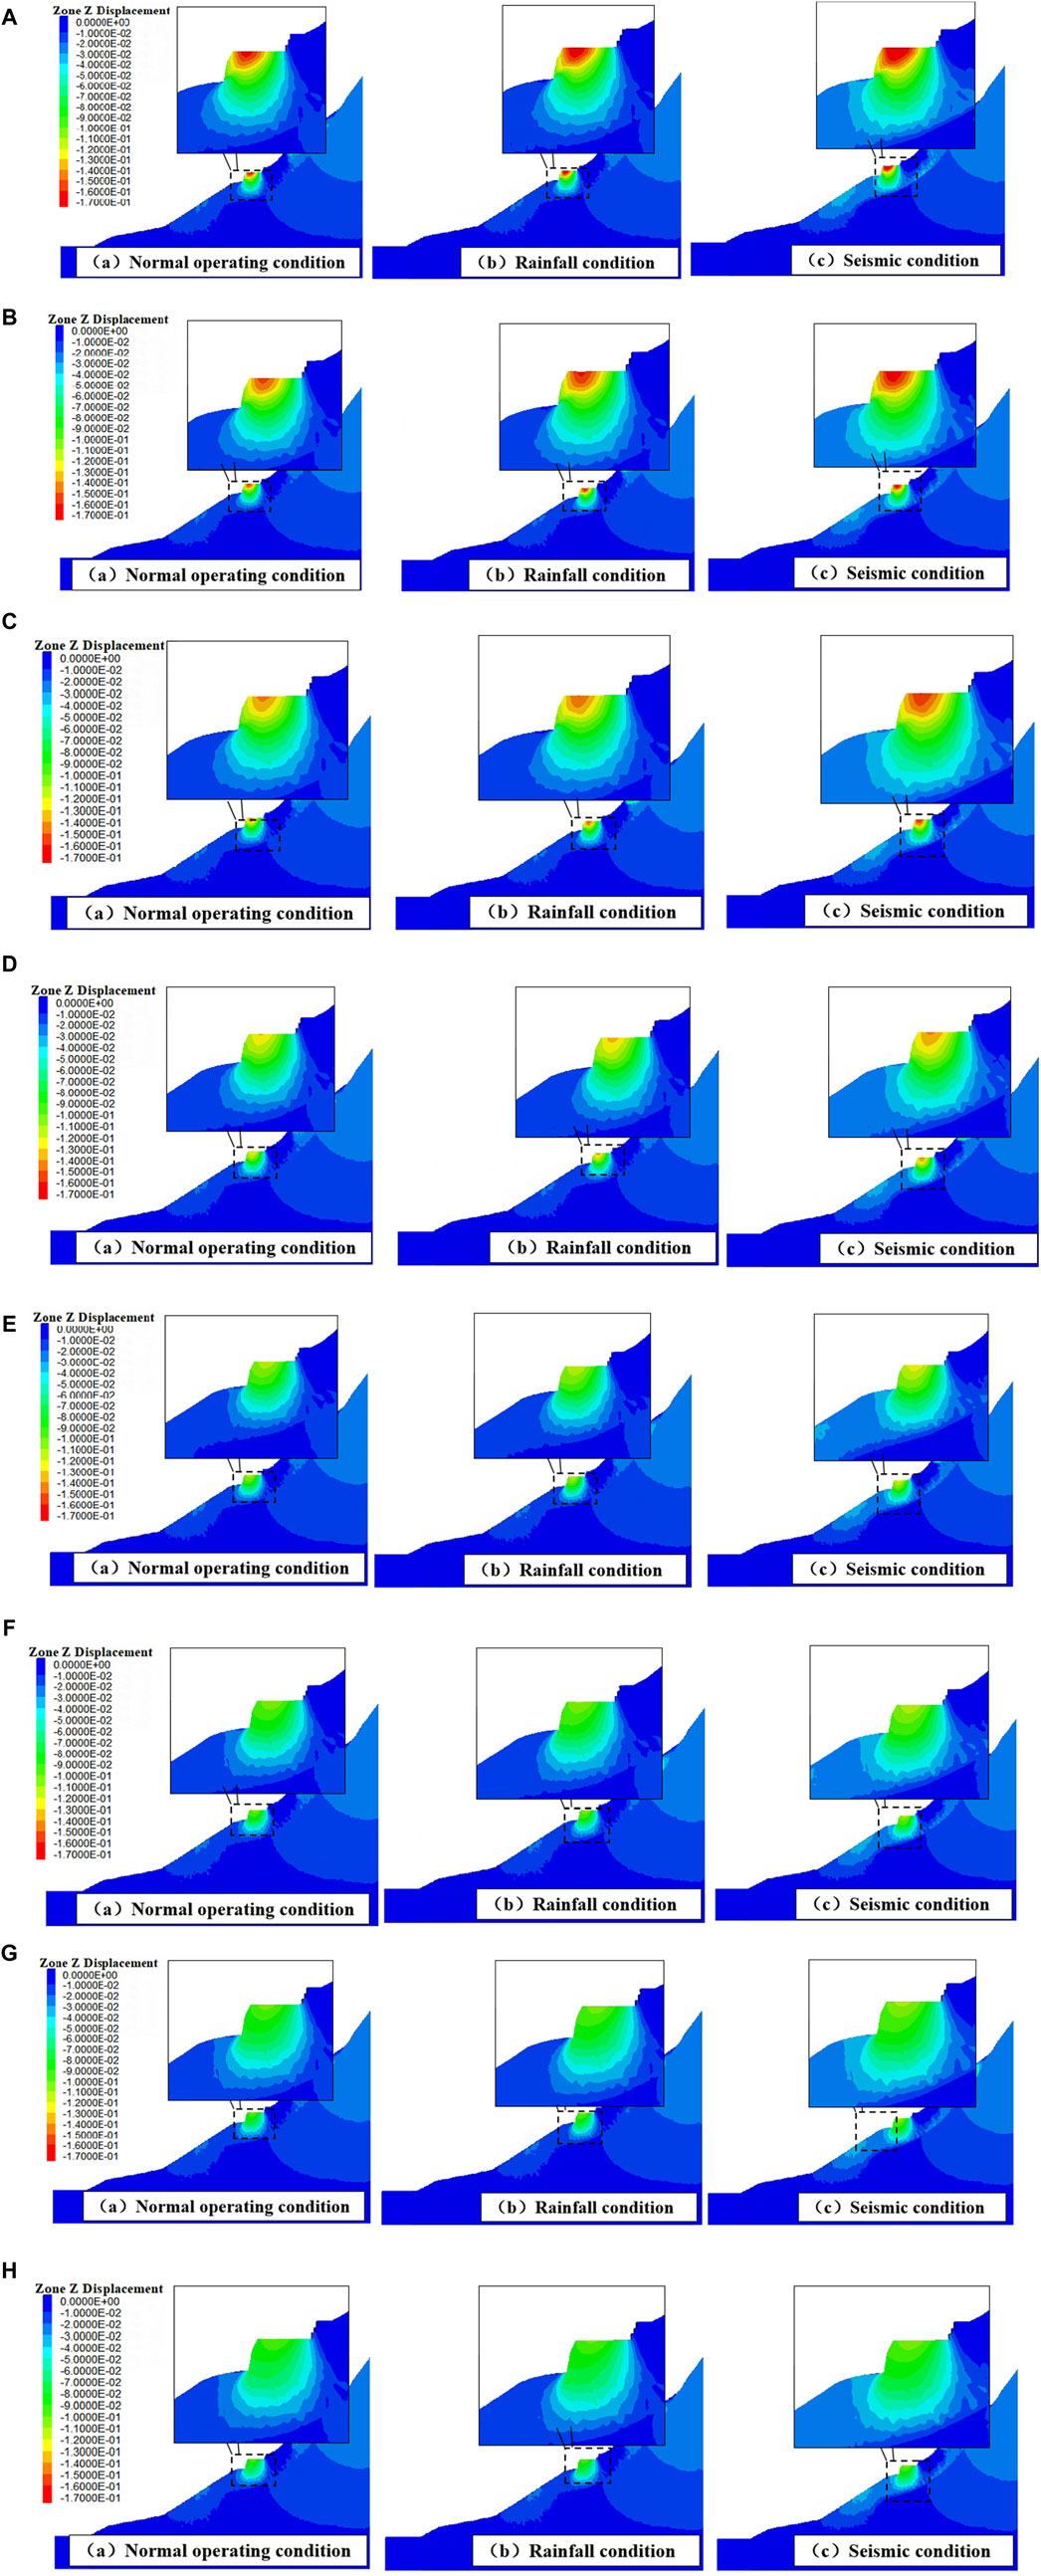
Figure 8. Vertical displacement distribution at different compaction depths: (A) Dense 1 m (B) Dense 2 m (C) Dense 3 m (D) Dense 4 m (E) Dense 5 m (F) Dense 6 m (G) Dense 7 m (H) Dense 8 m.
Analysis reveals that when soil compaction is limited to a depth of 3 m, vertical displacement predominantly occurs outside the accumulation in the highway design area, exhibiting an ellipsoidal distribution. Under these conditions, the maximum vertical settlement of the surface layer exceeds 0.15 m, increasing to over 0.20 m under rainfall and seismic conditions. Conversely, when compaction depth exceeds 3 m, the maximum vertical displacement of the surface layer diminishes to less than 0.15 m, as indicated by the dark red high-displacement-value area on the vertical displacement distribution map. This trend of displacement reduction continues with increased compaction depth; for instance, at 8 m depth, the maximum vertical displacement at the highway’s centre is only 0.102 m, even under seismic conditions.
The stability analysis indicators for varying compaction depths are detailed in Table 2. As compaction depth increases, the maximum vertical displacement observed in highway design shows a decreasing trend. This variation is depicted in Figure 8, where the curves exhibit distinct segmentation under three different working conditions. For compaction depths below 6 m, the curve’s slope is steep, indicating a significant reduction in maximum displacement. Beyond 6 m, the displacement stabilizes around 0.10 m. Similarly, the safety factor undergoes a noticeable change up to a compaction depth of 6 m, beyond which it remains virtually unchanged, suggesting that a compaction depth of 6 m is optimal.
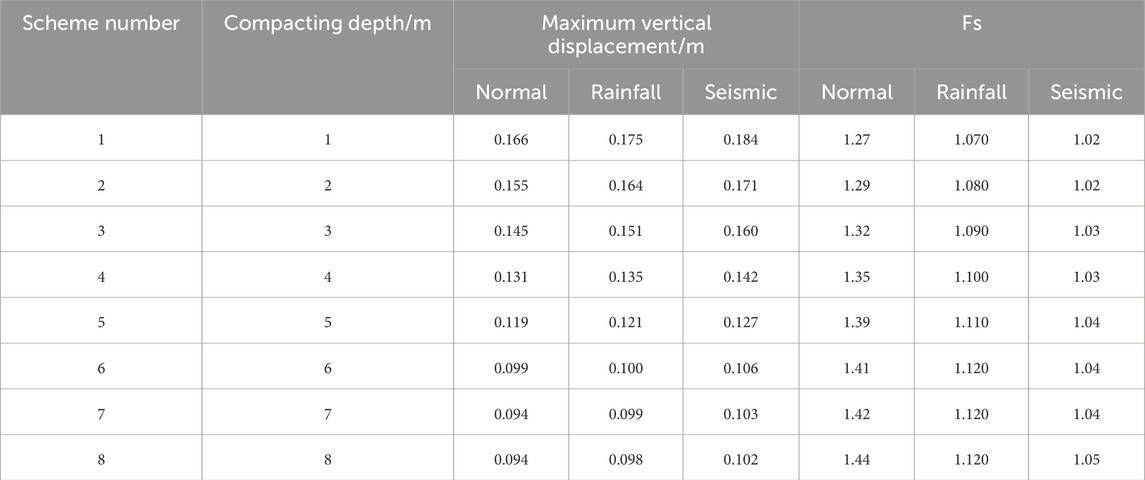
Table 2. Stability analysis metrics.
Despite improvements, the values under rainfall and seismic conditions fail to meet the code requirements due to the susceptibility of the highway’s upper right side to instability. As shown in Figure 9, dense reinforcement effectively controls the vertical deformation of the highway design. However, this reinforcement does not enhance the anti-skid capacity of the right-side accumulation. Therefore, it is imperative to strengthen the upper accumulation with chemical modification techniques.
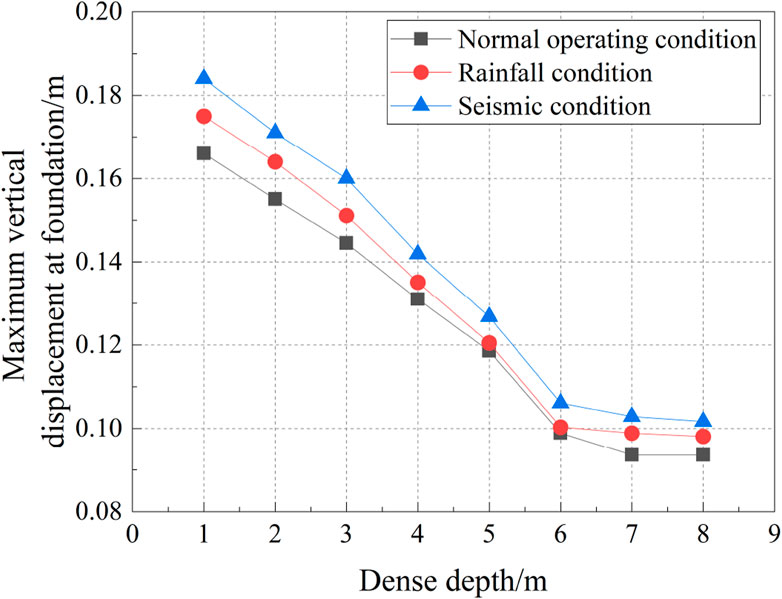
Figure 9. The maximum vertical displacement varies with the depth of compaction.
Chemical improvement reinforcement is categorized into two types: sliding strip reinforcement and whole sliding body reinforcement. If sliding strip reinforcement alone fails to meet stability and deformation control requirements, whole sliding body reinforcement becomes necessary. Initially, a PVA solution mixed with silica fume was employed to evaluate the efficacy and suitability of various improvement methods in enhancing the stability of the highway’s right-side accumulation. The sliding belt reinforcement area of the accumulative body is defined as a circular region 2 m below the potential sliding surface, whereas the overall improvement area includes all regions from 2 m below the potential sliding surface to the surface. Given the smaller total area of the landslide accumulation-bedrock interface compared to the sliding mass, the optimization of the sliding body’s reinforcement area was prioritized to ensure comprehensive interface improvement. For construction ease, the sliding body was segmented horizontally into five reinforcement zones, representing 5.5%, 22.7%, 38.1%, 23.6%, and 10.1% of the total area, as illustrated in Figure 10. Models were developed to simulate the deformation and stability of the landslide accumulation with various chemical improvement materials, expanding the reinforcement areas of the sliding body. The resulting horizontal displacement distribution is depicted in Figures 11 A–E. Additionally, separate models incorporating a 10% PVA solution mixed with either 0.5% fibre or 10% silica fume were created to simulate the deformation and stability of the landslide accumulation, focusing on chemical improvement and interface reinforcement.
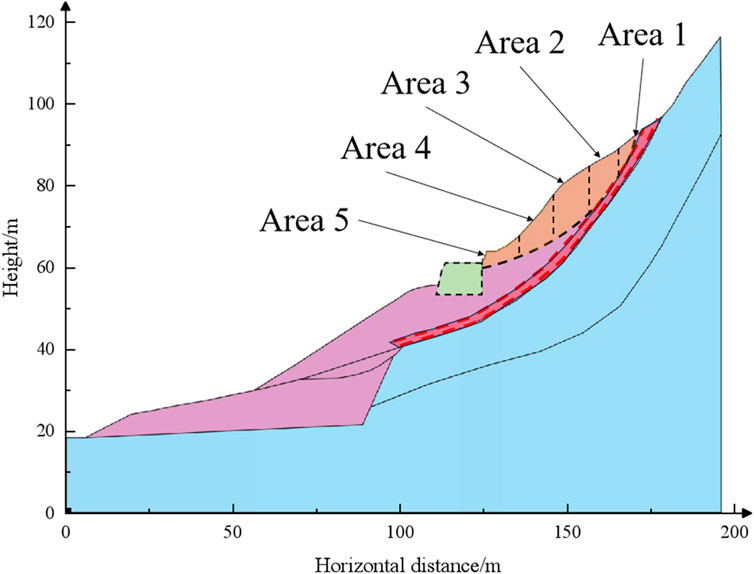
Figure 10. Schematic diagram of the division of the sliding body reinforcement area.
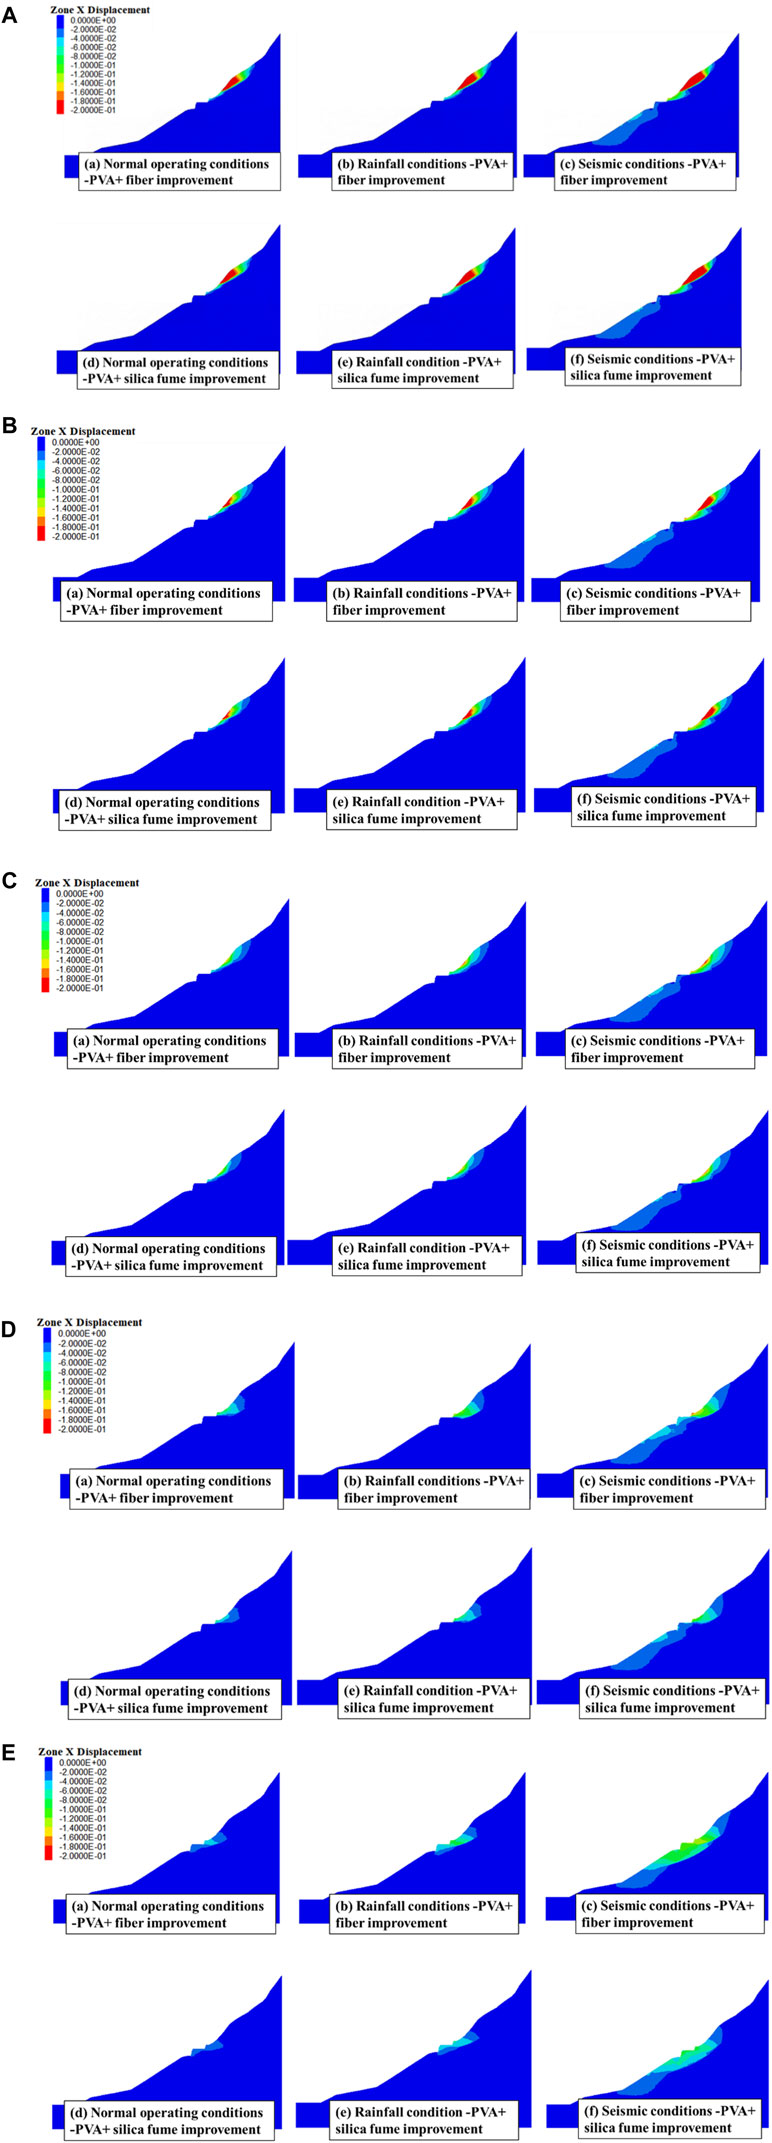
Figure 11. Horizontal displacement distribution under different proportions of improved area: (A) 5.5% of the sliding body reinforcement area (B) 28.2%of the sliding body reinforcement area (C) 66.3% of the sliding body reinforcement area (D) 89.9% of the sliding body reinforcement area (E) 100% of the sliding body reinforcement area.
As illustrated in Figures 11A–C, the horizontal displacement of the surface layer in the accumulation body demonstrates a continuous decrease with the enlargement of the improved area, particularly under normal operation and rainfall conditions. As illustrated in Figure 11C, under normal operating conditions, once the improved area constitutes 66.3% of the sliding body’s total area, the zone experiencing horizontal displacements greater than 0.2 m (indicated in dark red) completely vanishes. Subsequently, as the improved area expands further, the displacement contour map exhibits a contracting pattern, with the contour interface progressively converging towards the excavation step and the highway design. Ultimately, when the improved area encompasses 100%, only a region not exceeding 30 square meters around the highway design experiences a minimal horizontal displacement of approximately 0.02 m, signifying a substantial reduction in the potential landslide area.
Under rainfall conditions, the progression of horizontal displacement parallels that observed during normal operating conditions. As depicted in Figure 11D, when the improved area constitutes 89.9% of the sliding body’s total area, zones with horizontal displacements exceeding 0.2 m vanish entirely. Subsequently, as the improved area increases, the extent of horizontal displacement diminishes and exhibits a declining trend. This results in a gradual horizontal displacement of the soil on the lower side of the highway, yet the displacement never exceeds 0.04 m, remaining within acceptable limits. Conversely, under seismic conditions, as shown in Figures 11C–E, even when the improved area surpasses 66.3%, the horizontal displacement of the right-side accumulation decreases. However, a displacement extends from the highway design to the bottom of the accumulation body, growing in extent with increased reinforcement. In these areas, displacement values often exceed 0.10 m. Notably, while silica fume modification results in a smaller concentrated displacement area compared to fibre-containing improvements, regardless of the improvement material, when the reinforcement covers 100% of the area, the horizontal displacement values at the highway design consistently exceed 0.12 m.
To assess the effectiveness of the improved reinforcement more accurately, the deformation characteristics of the landslide accumulation were quantified for various proportions of the improved area. This was achieved by analysing the mesh attributes of the model, including Sm0.2 and Su0.05 to Su0.25. These parameters represent the extent of the plastic zone and total displacements exceeding 0.2 m, as well as horizontal displacements greater than 0.05, 0.10, 0.15, 0.20, and 0.25 m, respectively.
Under normal operating conditions, the analysis of horizontal displacements (exceeding thresholds of 0.05–0.25 m as shown in Figures 12A–C) show that areas exceeding these displacements decrease with an increase in the improved area, indicating that chemical improvement effectively minimizes plastic slippage and enhances landslide stability. This is further supported by notably eliminating zones with displacements over 0.10 m when the improved area reaches 89.9%. Additionally, the safety factor (Fs) consistently rises above the code-required minimum of 1.35 with the expansion of the improvement area, underscoring the chemical modification’s effectiveness.
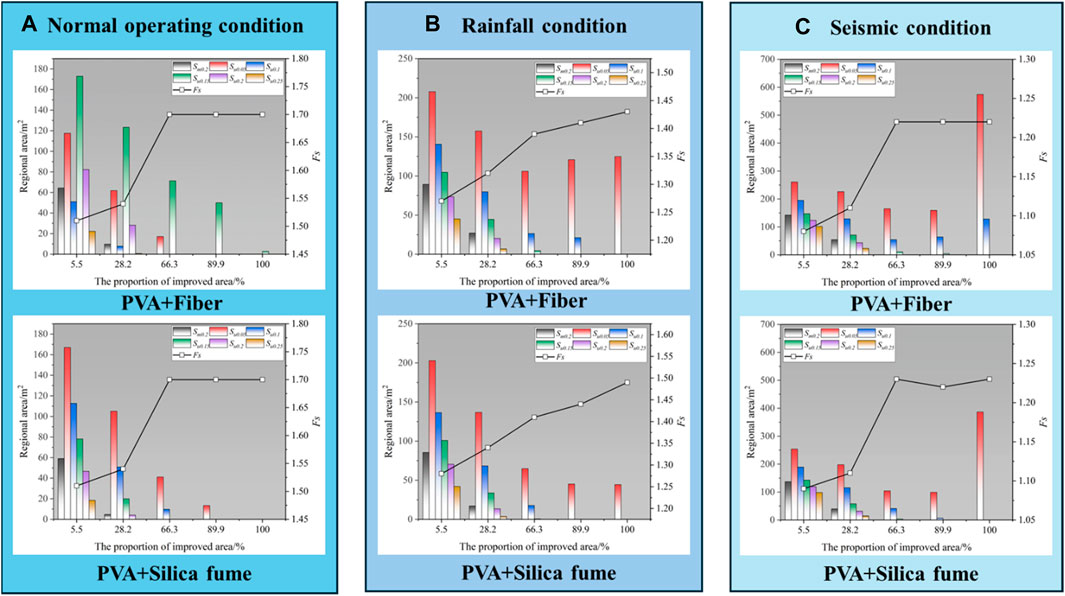
Figure 12. The displacement area index and the proportion of the area of the reinforcement area under different conditions: (A) Normal operating condition (B) Rainfall condition (C) Seismic condition.
Under rainfall conditions, Maximum horizontal displacement and the areas exceeding displacement thresholds reduce with the improved area’s enlargement, stabilizing when coverage exceeds 89.9%. However, with fibre-containing materials, the area with displacements over 0.05 m starts increasing after surpassing 66.3% coverage. Both fibre and silica fume-enhanced sections achieve Fs values above 1.35, with silica fume showing marginally better performance in controlling deformations under rainfall conditions, necessitating at least 66.3% improvement area.
Under seismic conditions, Figure 12C indicate that despite a decrease in maximum horizontal displacement with greater improvement area, significant areas still experience displacements over 0.05 m with fibre or silica fume. Fiber modifications show less effectiveness in deformation control compared to silica fume under these conditions. Achieving a safety factor above the required 1.35 is possible once the improved area exceeds 66.3%, with further increases not yielding additional benefits. Hence, for stability and deformation control under seismic conditions, a 66.3% reinforcement area with silica fume improvement is recommended.
In conclusion, numerical simulations of various landslide improvement and reinforcement area strategies demonstrate that the landslide accumulation satisfies the specification requirements under diverse working conditions once the improved reinforcement area of the sliding mass reaches 66.3%. Moreover, this approach results in a considerable safety margin in the safety factor. Consequently, further optimization of the improved reinforcement area at the landslide accumulation-bedrock interface was undertaken. Figure 13 illustrates that, based on the improvement and reinforcement of 66.3% of the sedimentary body’s area with a compaction depth of 6 m, the design of the improved reinforcement area at the landslide accumulation-bedrock interface was optimized. The original interface reinforcement area was subdivided into five segments, constituting 13.7%, 16.4%, 20.6%, 25.2%, and 24.1% of the original total area, respectively. The horizontal displacement distribution from these models is presented in Figure 14.
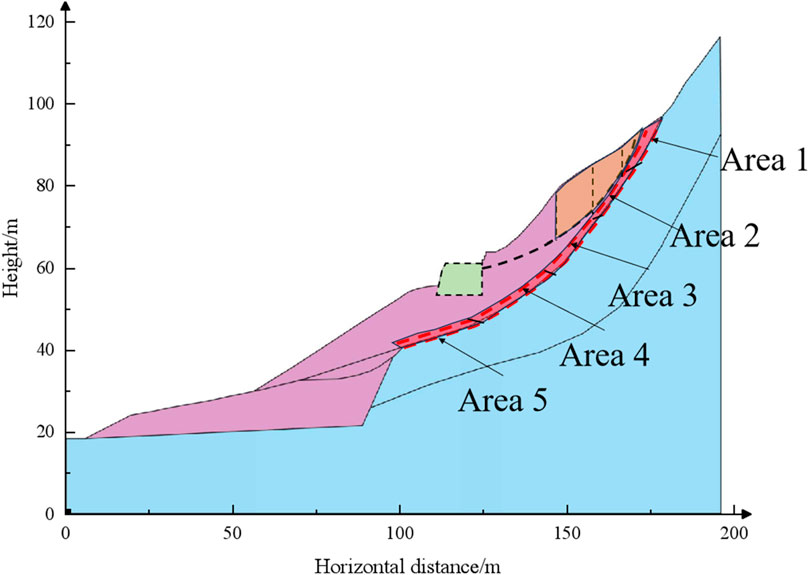
Figure 13. Schematic diagram of the division of the improved reinforcement area at the interface between landslide accumulation and bedrock.

Figure 14. The horizontal displacement distribution of each working condition in different reinforcement area proportion schemes: (A) Interface reinforcement area 13.7% (B) Interface reinforcement area 30.1% (C) 50.8% of the interface reinforcement area (D) 75.9% of the interface reinforcement area (E) 100.0% of the interface reinforcement area.
In comparison to the unoptimized scheme, the horizontal displacement under normal operation and rainfall conditions predominantly occurs at elevations above 77 m on the right side of the highway, a pattern that remains consistent and will not be reiterated. Under seismic conditions, even though the horizontal displacement of the accumulation stabilizes once the reinforcement area reaches 30.1%, the regions where the horizontal displacement exceeds 0.1 m below the highway design do not show a significant decrease until the reinforcement area extends to 75.9%. To quantitatively assess the effectiveness of the reinforcement scheme on the landslide accumulation, the deformation data for various improved areas was compiled using the same research methodology as before.
Figure 15 demonstrate that the maximum horizontal displacement, the total area with displacement exceeding 0.2 m, and the extent of zones surpassing each horizontal displacement threshold all decrease as the improved area increases. Once the reinforced area of the interface attains 30.1%, the reduction in the area index under normal operation and rainfall conditions ceases to be significant. Taking the area with horizontal displacement exceeding 0.05 m (Su0.05) as an example, a growth from 13.7% to 30.1% in the reinforced area results in a decrease of Su0.05 by 56.3% and 59.2% under normal operating conditions for improvements with fibre and silica fume, respectively. In rainfall scenarios, this decrease is 60.7% and 71.2%. Under seismic conditions, as the improved area expands from 13.7% to 75.9%, the Su0.05 reduces by nearly 90%. Beyond this point, the proportion of the improved area shows no significant change, except for silica fume chemical improvements, where the stable value’s inflection point coincides with an improved area proportion of 50.8%. Safety factor calculations corroborate this finding; with an improved area of 50.8%, the safety factor for PVA-coupled silica fume reaches 1.15 under seismic conditions, fulfilling specification requirements. Conversely, when using PVA-bonded fibre for improvement, the improved area must comprise 75.9% to meet these specifications.
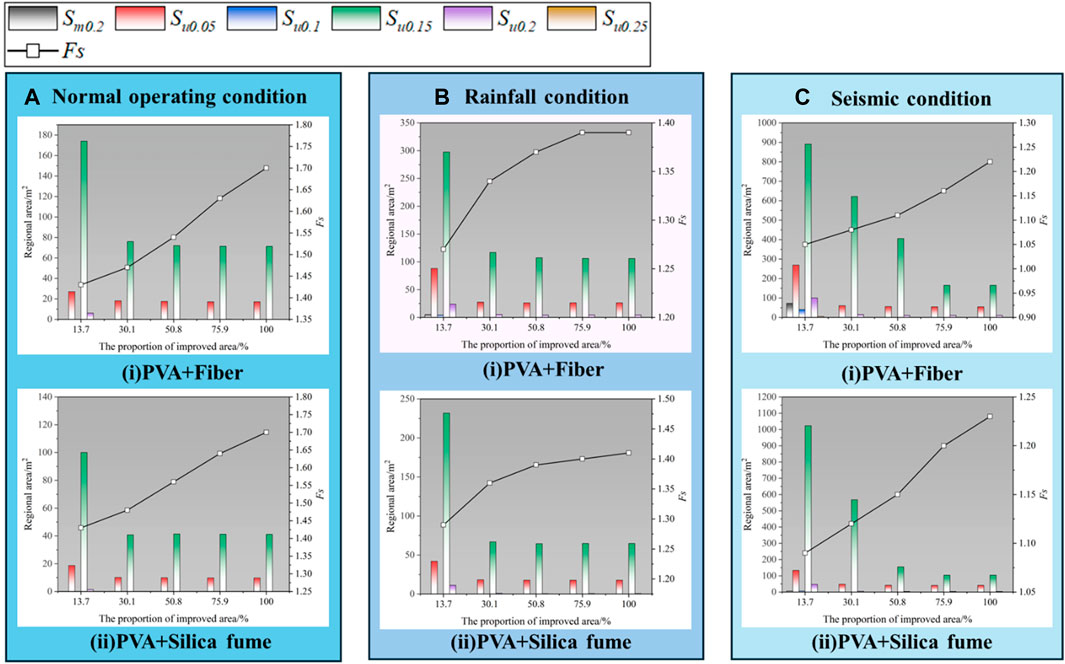
Figure 15. The displacement area index and the proportion of the area of the reinforcement area under different conditions: (A) Normal operating condition (B) Rainfall condition (C) Seismic condition.
In conclusion, the optimal improvement and reinforcement measures for the landslide accumulation have been identified. They entail treating 66.3% of the potential landslide body’s total area on the right side of the highway and 50.8% of the soil within a 2-m range above the landslide accumulation-bedrock interface. This treatment utilizes a 10% PVA solution, based on a dynamic density of 6 m at the highway design location, and affects 75.9% of the soil. Implementing this strategy ensures that the safety factor of the landslide accumulation under normal operation, rainfall, and seismic conditions complies with code requirements, and the resulting deformation remains within acceptable limits.
This study establishes a stability analysis model for landslide accumulation, incorporating the deterioration damage characteristics of coarse-grained mixed soil. It simulates the deformation development and stability of highway engineering projects affected by landslide accumulation under various conditions, including natural undeveloped, normal operation, rainfall, and seismic scenarios, and optimizes improvement and reinforcement measures. The key conclusions are:
(1) Utilizing damage deterioration theory, an elastoplastic damage constitutive model reflecting the strain softening characteristics of coarse-grained mixed soil has been developed. This model was integrated into the FLAC3D software, calibrated, and validated using mechanical test data from previous chapters. The results confirm that the model effectively captures the strain softening behavior of coarse-grained mixed soil in southeast Xizang.
(2) The application of this constitutive model under normal operation, earthquake, and rainfall conditions in the Yigong area of southeast Xizang yielded safety coefficients of 1.25, 1.07, and 1.02, respectively, failing to meet code requirements. Consequently, implementing suitable improvement and reinforcement measures is imperative to enhance stability and ensure the project’s safety and longevity.
(3) In alignment with the compaction and chemical improvement methods of coarse-grained mixed soil explored in preceding chapters, the study investigates the effectiveness of various reinforcement schemes through numerical simulation. It was determined that the following improvement and reinforcement measures are effective for the landslide accumulation: dynamic compaction of 6 m at the highway design location, combined with chemical improvement using 10% silica fume applied to 66.3% of the potential landslide body on the right side of the highway and 50.8% of the soil within 2 m above the landslide accumulation-bedrock interface. Alternatively, employing a 10% PVA solution or 0.05% fibre chemical improvement on 75.9% of the soil within the same 2-m interface range is also viable.
In summary, this research has developed an elastoplastic damage constitutive model that incorporates the strain softening response of common engineering soil materials in southeastern Xizang. This model effectively assesses and optimizes reinforcement solutions for highways traversing landslide accumulations. The validation and application of this model not only enhance our understanding of the progressive failure processes in soil materials but also bolster the safety of infrastructure within complex geological settings. Future studies should continue to refine and expand the theoretical and practical applications of constitutive relationships, particularly in the fields of geohazard assessment and infrastructure safety assurance. Moreover, given the variability of geological conditions and external loading, further investigations should explore more targeted geological simulations and enhancement techniques to improve the model’s accuracy and practicality.
The original contributions presented in the study are included in the article/Supplementary material, further inquiries can be directed to the corresponding author.
GL: Conceptualization, Data curation, Funding acquisition, Investigation, Methodology, Project administration, Resources, Supervision, Visualization, Writing–review and editing. WL: Writing–original draft, Writing–review and editing. BW: Resources, Methodology, Writing–review and editing. JZ: Conceptualization, Formal Analysis, Investigation, Software, Validation, Visualization, Writing–original draft. JW: Data curation, Formal Analysis, Methodology, Software, Supervision, Writing–review and editing.
The author(s) declare financial support was received for the research, authorship, and/or publication of this article. This work was supported by the open project of Research Center of Civil, Hydraulic and Power Engineering of Xizang (XZA202405CHP 2008B).
The authors declare that the research was conducted in the absence of any commercial or financial relationships that could be construed as a potential conflict of interest.
All claims expressed in this article are solely those of the authors and do not necessarily represent those of their affiliated organizations, or those of the publisher, the editors and the reviewers. Any product that may be evaluated in this article, or claim that may be made by its manufacturer, is not guaranteed or endorsed by the publisher.
Allison, P. G., Moser, R. D., Schirer, J. P., Martens, R. L., Jordon, J. B., and Chandler, M. Q. (2014). In-situ nanomechanical studies of deformation and damage mechanisms in nanocomposites monitored using scanning electron microscopy. Mater. Lett. 131, 313–316. doi:10.1016/j.matlet.2014.05.196
Cai, Z., Liu, E., Chen, N., Feng, J., Hu, G., and Su, Y. (2022). Numerical analysis of the initiation and sliding process of the Yigong landslide using a continuous–discontinuous method. Environ. Earth Sci. 81 (5), 150. doi:10.1007/s12665-022-10279-y
Cao, H., Zhu, D., Bao, T., Sun, P., Li, J., and Erneste, H. (2024). Applicability of rock damage model based on power law distribution. Acta Geophys., 1–16. doi:10.1007/s11600-023-01260-9
Chen, Z., He, C., Yang, W., Guo, W., Li, Z., and Xu, G. (2020). Impacts of geological conditions on instability causes and mechanical behavior of large-scale tunnels: a case study from the Sichuan–Tibet highway, China. Bull. Engineer-ing Geol. Environ. 79, 3667–3688. doi:10.1007/s10064-020-01796-w
Chigira, M., Wu, X., Inokuchi, T., and Wang, G. (2010). Landslides induced by the 2008 wenchuan earthquake, sichuan, China. Geomorphology 118 (3-4), 225–238. doi:10.1016/j.geomorph.2010.01.003
Dadashiserej, A., Jana, A., Stuedlein, A. W., and Evans, T. M. (2024). Cyclic resistance models for transitional silts with application to subduction zone earthquakes. J. Geotechnical Geoenvironmental Eng. 150 (2), 04023135. doi:10.1061/jggefk.gteng-11671
Ering, P., and Sivakumar Babu, G. L. (2016). Slope stability and deformation analysis of Bangalore MSW landfills using constitutive model. Int. J. Geomechanics 16 (4), 04015092. doi:10.1061/(asce)gm.1943-5622.0000587
Gallardo, R., Sáez, E., and Lopez-Caballero, F. (2023). Modeling self-compaction and static stability of a copper filtered tailings pile under unsaturated conditions. Acta Geotech. doi:10.1007/s11440-023-02130-w
Hanley, K. J., Huang, X., and O'Sullivan, C. (2018). Energy dissipation in soil samples during drained triaxial shearing. Géotechnique 68 (5), 421–433. doi:10.1680/jgeot.16.p.317
Huang, D., Song, Y., Cen, D., and Fu, G. (2016). Numerical modeling of earthquake-induced landslide using an improved discontinuous deformation analysis considering dynamic friction degradation of joints. Rock Mech. Rock En-gineering 49, 4767–4786. doi:10.1007/s00603-016-1056-3
Huang, R., and Li, W. (2009). Development and distribution of geohazards triggered by the 5.12 Wenchuan Earthquake in China. Sci. China Ser. E-Technol. Sci. 52, 810–819. doi:10.1007/s11431-009-0117-1
Jiang, W., Xi, J., Li, Z., Zang, M., Chen, B., Zhang, C., et al. (2022). Deep learning for landslide de-tection and segmentation in high-resolution optical images along the Sichuan-Tibet transportation corridor. Remote Sens. 14 (5490), 5490. doi:10.3390/rs14215490
Kumar, N., Verma, A. K., Sardana, S., Sarkar, K., and Singh, T. N. (2018). Comparative analysis of limit equilibrium and numerical methods for prediction of a landslide. Bull. Eng. Geol. Environ. 77, 595–608. doi:10.1007/s10064-017-1183-4
Li, X., Chen, Z., Chen, J., and Zhu, H. (2019). Automatic characterization of rock mass discontinuities using 3D point clouds. Eng. Geol. 259, 105131. doi:10.1016/j.enggeo.2019.05.008
Luo, X., Ma, Q., and Jiang, H. (2021). Pre-evaluation on stability of proposed expressway embankment with existing geo-thermal regulation measures in permafrost regions. J. Central South Univ. 28, 264–283. doi:10.1007/s11771-021-4601-5
Mohsan, M., Vardon, P., and Vossepoel, F. (2021). On the use of different constitutive models in data assimilation for slope stability. Comput. Geotechnics 138, 104332. doi:10.1016/j.compgeo.2021.104332
Ng, C., and Shi, Q. (1998). A numerical investigation of the stability of unsaturated soil slopes subjected to transient seepage. Comput. Geotechnics 22, 1–28. doi:10.1016/S0266-352X(97)00036-0
Ng, K., Sun, Y., Dai, Q., and Yu, X. (2014). Investigation of internal frost damage in cementitious materials with microme-chanics analysis, SEM imaging and ultrasonic wave scattering techniques. Constr. Build. Mater. 50, 478–485. doi:10.1016/j.conbuildmat.2013.09.061
Nguyen, T., and Likitlersuang, S. (2019). Reliability analysis of unsaturated soil slope stability under infiltration considering hydraulic and shear strength parameters. Bull. Eng. Geol. Environ. 78, 5727–5743. doi:10.1007/s10064-019-01513-2
Ponzoni, E., Muraro, S., Nocilla, A., and Jommi, C. (2023). Deformational response of a marine silty-clay with varying or-ganic content in the triaxial compression space. Can. Geotechnical J. (ja). doi:10.1139/cgj-2023-0058
Pradhan, S. P., and Siddique, T. (2020). Stability assessment of landslide-prone road cut rock slopes in Himalayan terrain: a finite element method based approach. J. Rock Mech. Geotechnical Eng. 12 (1), 59–73. doi:10.1016/j.jrmge.2018.12.018
Rehman, S. K. U., Ibrahim, Z., Memon, S. A., and Jameel, M. (2016). Nondestructive test methods for concrete bridges: a review. Constr. Build. Mater. 107, 58–86. doi:10.1016/j.conbuildmat.2015.12.011
Shu, S., Ge, B., Wu, Y., and Zhang, F. (2023). Probabilistic assessment on 3D stability and failure mechanism of undrained slopes based on the kinematic approach of limit analysis. Int. J. Geomechanics 23 (1), 06022037. doi:10.1061/(ASCE)GM.1943-5622.0002635
Siddique, T., Mondal, M., Pradhan, S. P., Salman, M., and Sohel, M. (2020). Geotechnical assessment of cut slopes in the landslide-prone Himalayas: rock mass characterization and simulation approach. Nat. Hazards 104, 413–435. doi:10.1007/s11069-020-04175-6
Taborda, D. M., Pedro, A. M., and Pirrone, A. I. (2022). A state parameter-dependent constitutive model for sands based on the Mohr-Coulomb failure criterion. Comput. Geotechnics 148, 104811. doi:10.1016/j.compgeo.2022.104811
Tang, Y., Wu, W., Yin, K., Wang, S., and Lei, G. (2019). A hydro-mechanical coupled analysis of rainfall induced landslide using a hypoplastic constitutive model. Comput. Geotechnics 112, 284–292. doi:10.1016/j.compgeo.2019.04.024
Urban, C.Rural Construction Committee (2013). Technical code for building slope engineering (GB 50330-2013). Beijing: China Architecture and Building Press.
Wang, Y., Cui, X., Che, Y., Li, P., Jiang, Y., and Peng, X. (2023). Identification and analysis of unstable slope and seasonal frozen soil area along the Litang section of the Sichuan–Tibet railway, China. Remote Sens. 15, 1317. doi:10.3390/rs15051317
Wang, Z., Liu, X., Yang, X., and Fu, Y. (2017). An improved duncan–chang constitutive model for sandstone subjected to drying–wetting cycles and secondary development of the model in FLAC 3 D. Arabian J. Sci. Eng. 42, 1265–1282. doi:10.1007/s13369-016-2402-1
Wu, R., Zhang, Y., Guo, C., Yang, Z., Tang, J., and Su, F. (2020). Landslide susceptibility assessment in mountainous area: a case study of Sichuan–Tibet railway, China. Environ. Earth Sci. 79, 157–216. doi:10.1007/s12665-020-8878-8
Yang, Q., Zhou, W. Y., and Chen, X. (2010). Thermodynamic significance and basis of damage variables and equivalences. Int. J. Damage Mech. 19 (8), 898–910. doi:10.1177/1056789509359651
Yanjun, S., Zhongqi, Y., Zhifa, Y., Yangchun, W., and Da'an, L. (2003). Addressing severe slope failure hazards along Si-chuan-Tibet Highway in Southwestern China. Episodes J. Int. Geoscience 26 (2), 94–96. doi:10.18814/epiiugs/2003/v26i2/003
Yi, Y., Xu, X., Xu, G., and Gao, H. (2023). Landslide detection using time-series InSAR method along the Kangding-Batang section of Shanghai-Nyalam road. Remote Sens. 15, 1452. doi:10.3390/rs15051452
Yin, Y., Wang, F., and Sun, P. (2009). Landslide hazards triggered by the 2008 Wenchuan earthquake, Sichuan, China. Landslides 6, 139–152. doi:10.1007/s10346-009-0148-5
Yuan, W., Liu, K., Zhang, W., Dai, B., and Wang, Y. (2020). Dynamic modeling of large deformation slope failure using smoothed particle finite element method. Landslides 17, 1591–1603. doi:10.1007/s10346-020-01375-w
Zhang, D., Sun, Z., and Fang, Q. (2022). Scientific problems and research proposals for Sichuan–Tibet railway tunnel con-struction. Undergr. Space 7 (3), 419–439. doi:10.1016/j.undsp.2021.10.002
Zhang, F., Damjanac, B., and Maxwell, S. (2019). Investigating hydraulic fracturing complexity in naturally fractured rock masses using fully coupled multiscale numerical modeling. Rock Mech. Rock Eng. 52 (12), 5137–5160. doi:10.1007/s00603-019-01851-3
Zhang, J., Zhu, W., Cheng, Y., and Li, Z. (2021). Landslide detection in the Linzhi-Ya'an section along the Sichuan-Tibet railway based on InSAR and hot spot analysis methods. Remote Sens. 13 (3566), 3566. doi:10.3390/rs13183566
Zhao, Z., Li, W., Shi, H., Li, Z., Li, J., Zhao, C., et al. (2022). Strength of coarse-grained soil stabilized by poly (vinyl alcohol) solution and silica fume under wet–dry cycles. Polymers 14 (17), 3555. doi:10.3390/polym14173555
Zou, Z., Yan, J., Tang, H., Wang, S., Xiong, C., and Hu, X. (2020). A shear constitutive model for describing the full process of the deformation and failure of slip zone soil. Eng. Geol. 276, 105766. doi:10.1016/j.enggeo.2020.105766
Keywords: damage constitutive model, landslide accumulation, stability analysis, reinforcement optimization, case study
Citation: Lv G, Li W, Wang B, Zuo J and Wang J (2024) Degradation-damage model application for landslide accumulation stability and reinforcement optimization in Southeast Xizang: a case study. Front. Earth Sci. 12:1411244. doi: 10.3389/feart.2024.1411244
Received: 02 April 2024; Accepted: 11 June 2024;
Published: 12 July 2024.
Edited by:
Luqi Wang, Chongqing University, ChinaReviewed by:
Yibo Shan, Nanjing Hydraulic Research Institute, ChinaCopyright © 2024 Lv, Li, Wang, Zuo and Wang. This is an open-access article distributed under the terms of the Creative Commons Attribution License (CC BY). The use, distribution or reproduction in other forums is permitted, provided the original author(s) and the copyright owner(s) are credited and that the original publication in this journal is cited, in accordance with accepted academic practice. No use, distribution or reproduction is permitted which does not comply with these terms.
*Correspondence: Wenwei Li, MTgwODA0MDEwMDAyQGhodS5lZHUuY24=
Disclaimer: All claims expressed in this article are solely those of the authors and do not necessarily represent those of their affiliated organizations, or those of the publisher, the editors and the reviewers. Any product that may be evaluated in this article or claim that may be made by its manufacturer is not guaranteed or endorsed by the publisher.
Research integrity at Frontiers
Learn more about the work of our research integrity team to safeguard the quality of each article we publish.