 Majid Nemati1,2
 Ahmad Rashidi
 Reza Derakhshani
- 1Department of Geology, Shahid Bahonar University of Kerman, Kerman, Iran
- 2Department of Earthquake Research, Shahid Bahonar University of Kerman, Kerman, Iran
- 3Department of Civil Engineering, Behbahan Khatam Alanbia University of Technology, Behbahan, Iran
- 4Department of Earth Sciences, Utrecht University, Utrecht, Netherlands
This study investigates the variations in stress, strain, and deformation of the Earth’s crust in Iran arising from tectonic movements and seismic activities. We employed the Kostrov and Molnar methods to quantify these parameters, focusing on the influence of different zoning techniques on the estimations. Analyzing data from 637 earthquakes (moment magnitudes > 5.5) spanning 1909 to 2016, we determined the directions of maximum pressure, tension, and seismic strain through two primary approaches: comprehensive zoning and individual earthquake analysis. Additionally, we assess horizontal shortening and vertical crustal adjustments. Our methodology involves three distinct strategies: individual earthquake analysis, 1° × 1° zoning, and tectonic zoning. The findings demonstrate that the choice of zoning method significantly affects the direction and magnitude of seismic strain estimations. Although both methods identified significant deformations in the Dasht Bayaz and Qaen regions of Eastern Iran, differences between the Kostrov and Molnar methods in estimating seismic strain are observed. The high Zagros region shows signs of crustal thickening, whereas the Zagros foreland exhibits crustal thinning. Intriguingly, Eastern Alborz indicates uplift, and Western Alborz suggests subsidence, offering an alternative view to the conventional tectonic understanding of the Alborz range. These results highlight the critical role of zoning in stress analyses and the disparities between widely used estimation techniques. They underscore the necessity of careful method selection and interpretation in geodynamic studies, particularly in seismically active regions like Iran.
1 Introduction
The strain rate of the Earth’s crust can be estimated by a variety of methods, including seismic techniques that utilize earthquake mechanisms and GPS methods that track the displacement and velocity of the Earth’s crust. One significant advancement in this field was made in 1974 by Kostrov (Kostrov, 1974), who introduced an Equation for estimating both the magnitude and directions of seismic strain. This methodology has been widely adopted by researchers globally, including those in Iran, to assess seismic stress and strain. An example of its application can be seen in the work of Tesauro (Tesauro et al., 2006), who used this approach to estimate seismic and geodetic strains across Central Europe in blocks of 0.5° × 0.5°.
In Iran, researchers, including (Masson et al., 2005; Zolfaghari, 2009; Ansari and Zamani, 2014; Zarifi et al., 2014) have estimated the size and direction of the principle strains. Masson et al. (2005) utilized two seismic catalogs—Jackson et al. (1995) and the Harvard University Global Centroid Moment Tensor (GCMT) catalog—to estimate seismic stress and strain. Zolfaghari (Zolfaghari, 2009) estimated the seismic and geodetic strain rate in Alborz, considering historical earthquakes with magnitudes greater than 1.6. The data used by Zarifi et al. (2014) for these estimations extended up to 2013. Rashidi et al. (2019) employed the inversion of focal mechanism and geodetic data to achieve the strain rate and stress fields (Rashidi and Derakhshani, 2022). In Iran, given the unique characteristics of fault activity (Nemati and Derakhshani, 2021; Rashidi et al., 2023a; Mohammadi Nia et al., 2023) and earthquakes in each region, estimating the magnitude and direction of stress, strain, and displacement speed of the Earth’s crust is critically important (Derakhshani and Eslami, 2011). In our research, we calculated the directions of maximum pressure and tension, as well as the seismic strain rate, using both Kostrov and Molnar methods. Additionally, we measured the horizontal and vertical velocity of the Earth’s surface, analyzing 637 earthquakes with moment magnitudes greater than 5.5, spanning from 1909 to 2016. Our new estimates are distinct and have been compared with those of other researchers who used different data sets and zoning techniques.
In the Kostrov method, we are required to use large earthquakes (magnitude > 5.5), leading to the omission of smaller earthquakes. Although the seismic energy released by microearthquakes is not comparable to that of large earthquakes, it cannot be neglected. Consequently, the Molnar method was employed to account for microearthquakes, which contribute significantly to the seismic energy released in every seismic area. Another crucial aspect is the spatial distribution of seismic energy in tectonically active areas. Microearthquakes can affect a wider area, distributing seismic energy more broadly. A significant limitation of both methods is the unavailability of complete and reliable earthquake catalogs, which are essential for estimating and describing the total strain history of the area.
2 Materials and methods
The Kostrov method (Kostrov, 1974), as outlined in Eq. 1, is the primary method employed in this research to estimate the average seismic strain rate εij (in nanostrains per year) for a set of N earthquakes.
In this Equation, μ represents the average shear modulus (3.3 × 10¹⁰ N/m2) in the continental crust, as detailed by Stein and Wysession (Stein and Wysession, 2009). The variable ν denotes the spatial volume of the crust affected by the considered earthquakes, while T refers to the time interval of the data collection. M represents the strain tensor, where M0n is its scalar component, and Mijn is the vector component, representing the tensor of the nth earthquake. The volume ν is calculated by multiplying the area of the selected block by the thickness of the seismogenic layer in each range. To estimate the magnitude of the seismic strain rate, only the scalar part of the tensor is required.
According to researchers such as Jackson et al. (1995), it is generally accepted that the selection of regular blocks in zoning methodologies should be viewed as a means for simplifying and averaging the application of Kostrov’s Equation. This implies that the dimensions of the selected blocks ought to encompass the length of most faults within the area under study. Moreover, the approach to tectonic zoning should, as far as possible, align with the tectonic features of the area, as illustrated in Figure 1A. However, it is important to note that triangular zoning, while potentially useful, may not align as closely with the area’s tectonics and fault lines. Additionally, data processing in triangular zones can be more challenging compared to square zoning.
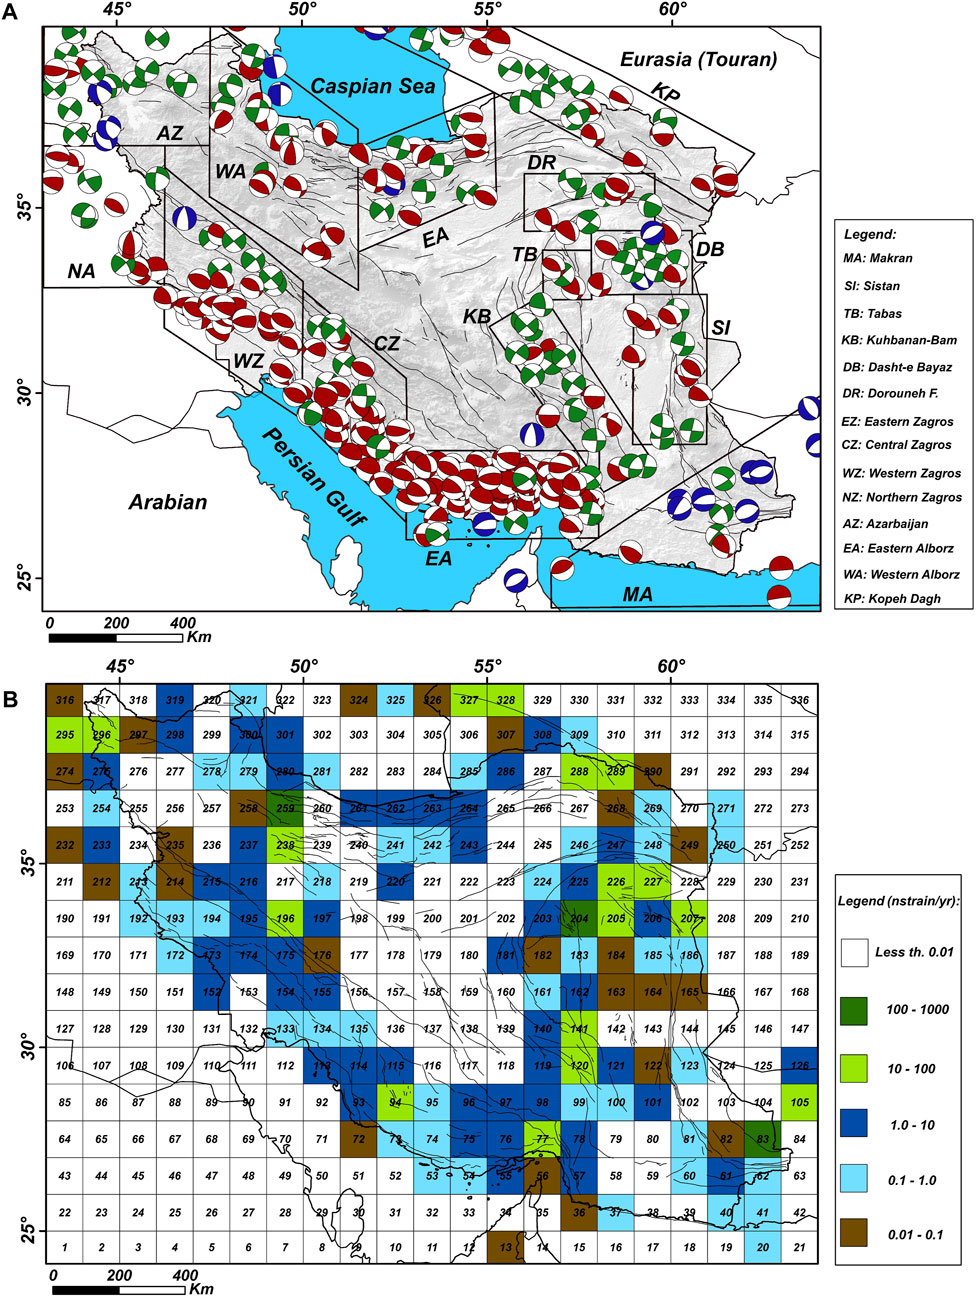
Figure 1. (A) Map illustrating the mechanisms of earthquakes in Iran, as studied in this research. The map delineates 14 tectonic zones, identified based on seismic states, fault lines, and their respective mechanisms. The zones are labeled as follows: WA, Western Alborz; EA, Eastern Al-borz; AZ, Azarbaijan; KP, Kopeh Dagh; TB, Tabas; NZ, North Zagros; WZ, Western Zagros; CZ, Central Zagros; EZ, Eastern Zagros; SI, Sistan; KB, Kuhbanan-Bam; DB, Dasht-e-Bayaz; DR, Doroune, and MA, Makran. (B) Map showing seismic strain estimations based on 1° × 1° blocks. In this map, the color coding represents different strain rate ranges: brown for 0.01 to 0.1, light blue for 0.1 to 1, dark blue for 1 to 10, light green for 10 to 100, and dark green for 100 to 1,000 nstrain/yr. Areas without significant earthquake activity or with strain rates less than 0.01 nstrain/yr are marked in red. The error margins for these estimations are sourced from (Hessami et al., 2003).
In the context of Iran, the longest coseismic faults observed have a maximum length of 125 km, as noted by Berberian et al. (1999). This measurement is associated with the 1997 Zirkuh Qaen earthquake, which had a moment magnitude (MW) of 7.2.
Therefore, for this study, Iran and its surrounding areas were segmented into 336 blocks, each measuring 1º × 1º, as illustrated in the map shown in Figure 1B. However, aligning with the perspectives of other researchers like (Jenny et al., 2004), it’s also suggested that the dimensions of the selected blocks should encompass a uniform range, particularly from a geological standpoint. This contrasts with the approach of Ansari and Zamani (Ansari and Zamani, 2014), whose tectonic blocks are considerably larger and do not closely follow fault lines. Zarifi et al. (2014) have also explored this area of study. In our research, we have implemented and compared both of these approaches to understand their respective impacts and outcomes.
In this study, we focus on all significant earthquakes with a magnitude greater than 5.5 (M > 5.5) and shallow earthquakes with a depth of less than 25 km to estimate strain rate using the Kostrov method. To analyze the mechanisms of these earthquakes, we utilized two catalogs: one from Jackson et al. (1995), which includes 86 earthquakes, and the Harvard University Global Centroid Moment Tensor (GCMT) catalog, comprising 551 earthquakes. The latter encompasses earthquakes from two distinct periods: from 1909 to 1975, with moment magnitudes ranging from 6.0 to 7.4, and from 1976 to 2016, with moment magnitudes between 4.3 and 7.7.
Due to the small number of earthquakes with a depth of more than 30 km in Iran, our study’s methodologies have been specifically tailored for the shallow crust, limited to depths of less than 25 km. Consequently, certain significant seismic events, such as the 2013 Saravan Sistan earthquake (MW 7.7; depth ranging from 70 to 95 km, as per GCMT data), were not included in our data processing. This earthquake, characterized by a normal faulting mechanism, was attributed to the extensional forces on the Makran plate, which is known for its increasing subduction angle beneath the crust (Nemati, 2019; Derakhshani et al., 2023).
In this study, the depth of the seismogenic layer in Iran was assumed to have a maximum depth of 20 km. This assumption was based on the data from local seismic networks and waveform modeling, with specific references to Nemati et al. (2011) in the Alborz region, Hatzfeld et al. (2003) in the Zagros area, and Berberian et al. (1999) in eastern Iran. The earthquake data for the 336 small blocks were individually extracted using a Fortran program in a Linux environment. Subsequently, data processing for each block was conducted separately. The editing and processing stages utilized Excel and Origin software, respectively. Furthermore, all maps pertinent to this research were created using GMT software, as illustrated in Figure 1.
In this research, to estimate seismic strain rates, we employed two different zoning approaches: 1) For a general investigation based on tectonic zones, we considered occurred earthquakes, information about the tectonics of the study area, mechanisms of the faults, focal mechanisms of the earthquakes, seismic states, fault trends, and geological evidence presented in various studies, e.g., Zagros (Navabpour and Barrier, 2012), Kopeh Dagh (Hollingsworth et al., 2006); Alborz (Rashidi, 2021), Sistan (Ezati et al., 2022b, 2023; Rashidi et al., 2022), resulting in fourteen defined tectonic zones. 2) For detailed investigation, we segmented the study area into 336, 1° × 1° blocks. These tectonic zones encompass several 1° × 1° blocks; the blocks within different tectonic zones were examined, and then the zones were compared. In other research, e.g., Raeesi et al. (2017) and Masson et al. (2005), larger blocks (2° × 2°) have been used for seismicity analysis; however, as more detailed information has become available in recent years, we have opted for 1° × 1° blocks to enable a more detailed analysis of seismic stress and strain.
Masson et al. (2005) have noted more significant variations in the Alborz region compared to the Zagros region. Upon examining the map in Figure 1B, which covers Zagros, Alborz, and eastern Iran, it is evident that the area of Dasht-e-Beyaz and Abiz in the east of Iran (experiencing a maximum strain rate of 1,000 nstrain/year) undergoes more deformation than both the Alborz and Zagros regions. In Alborz, the level of deformation is observed to be higher than in Zagros. The deformations in Zagros are primarily confined to the crustal volume that generated the 1972 Qir-Karzin earthquake (MS 6.9) as documented by (Dewey and Grantz, 1973), and the 1977 Khorgo Bandar Abbas earthquake (MS 7.0) as described by (Berberian and Papastamatiou, 1978). This is indicated by the light green coloration in Figure 1B.
To ensure that smaller earthquakes (M < 5.5) are not overlooked, this study employs the Molnar method (Molnar, 1979) as a secondary approach. This method, which also incorporates smaller earthquakes, is used to estimate seismic strain using Eqs 2–4.
In these Equations, the coefficients a, b, c, and d correspond to the Gutenberg-Richter Equation (Gutenberg and Richter, 1956) (Eq. 3), respectively. The coefficients for the Hanks and Kanamori (Hanks and Kanamori, 1979) Equation, which establishes the relationship between MW and M0 (Eq. 4), are 1.5 and 16.05. In Eq. 2, M0max refers to the largest seismic moment among earthquakes in a selected block.
For the application of the Molnar method, a comprehensive catalog that includes microearthquakes is necessary. To this end, the seismic catalog of the International Institute of Seismology and Earthquake Engineering of Iran (IIEES), which contains data on 23,331 earthquakes, was chosen. To standardize and harmonize the magnitudes of the earthquakes in this catalog, primarily comprised of mb, MS, and ML magnitudes, the relationships proposed by Nemati and Tatar (Nemati and Tatar, 2015) Eq. 5 were utilized in conjunction with Eq. 4. The details of this are illustrated in Figure 2.
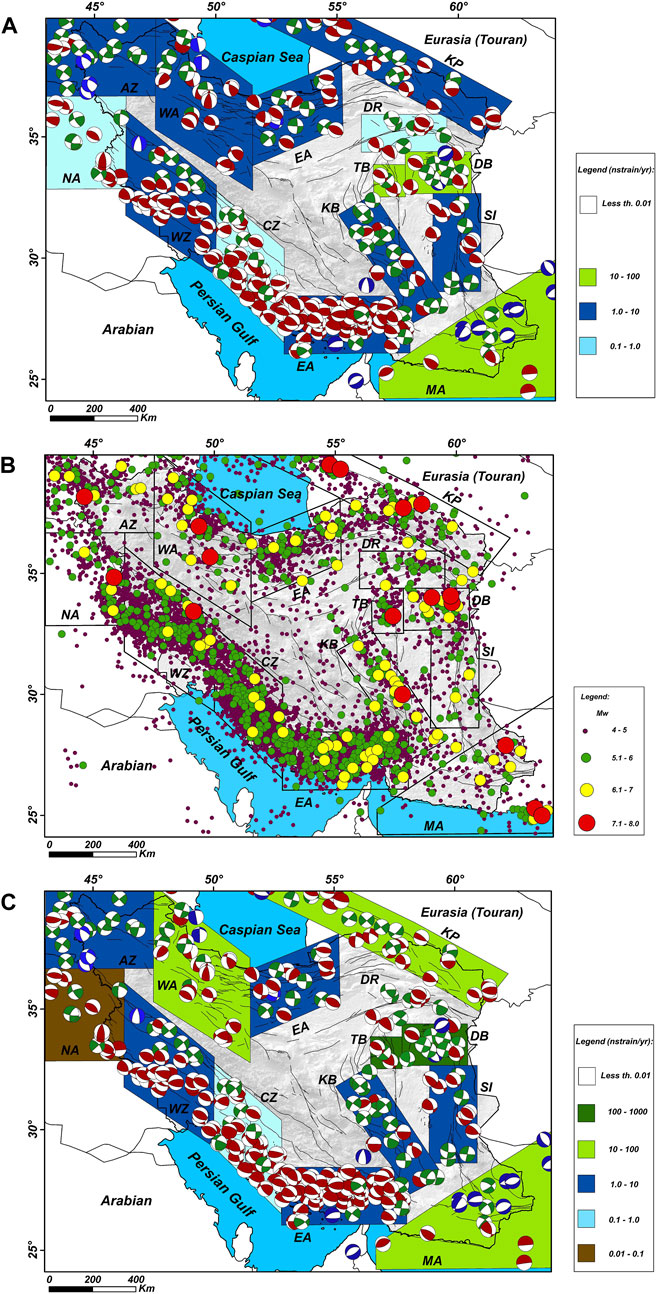
Figure 2. (A) Estimation of seismic strain rate using the Kostrov method; (B) Representation of both small and large earthquakes employed in the Molnar method; and (C) Seismic strain rates estimation across Iran’s tectonic blocks using the Molnar method, based on independently calculated components of the moment tensor of earthquakes. In panel (A), the strain rate ranges are depicted with different colors: light blue for 0 to 1, dark blue for 1 to 10, and green for 10 to 100 nstrain/yr. Similarly, in panel (C), the color coding is as follows: brown for a range of 0.01–0.1, light blue for 0.1 to 1, dark blue for 1 to 10, light green for 10 to 100, and dark green for 100 to 1,000 nstrain/yr, representing both contractional and extensional strains.
To accurately estimate strain using the Molnar method, it is necessary to first determine seismic parameters. Table 1 presents these parameters for the 14 tectonic areas of Iran, as delineated in Figure 1A. A key piece of information in this table is the magnitude of completeness (MC) for the data in each area. The MC can be readily identified from the Gutenberg-Richter (Gutenberg and Richter, 1956) diagram, where it corresponds to the first bend in the graph (Woessner and Wiemer, 2005).
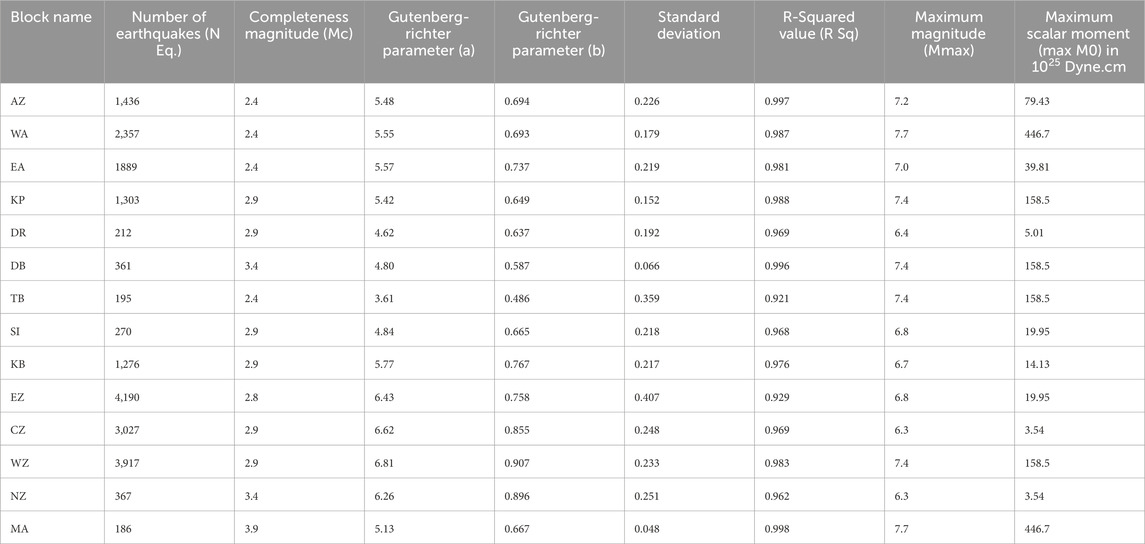
Table 1. Seismic Parameters of the 14 tectonic areas in Iran for strain estimation using the Molnar Method. This table includes several key columns: the name of each tectonic block, the total number of earthquakes recorded in that block, the absolute magnitude derived from the Gutenberg-Richter diagram (Gutenberg and Richter, 1956), the specific seismic parameters associated with each block, the standard deviation of the Gutenberg-Richter Equation as applied to each block, the standard error of the regression analysis (fitting) for the Equation, the maximum recorded magnitudes of earthquakes in each block, and the maximum scalar moment of the largest earthquake in each block.
As illustrated in Figures 2A–C, the areas shaded in light and dark blue represent regions where strain estimations are similar among the two methods. Notably, Molnar’s method yields a higher strain rate value for the Dasht-e-Beyaz area in Eastern Iran. Conversely, in the Northern Zagros region, this method estimates a lower strain rate, possibly due to the prevalence of micro-earthquakes as opposed to larger seismic events in this area.
An important limitation of the two methods could be magnitude transformation because the magnitudes in the utilized catalog must be unified. During magnitude transformation, due to fundamental differences between different magnitude scales it can affect the precision of the results, although this is not inevitable. Regarding the differences between the Kostrov and Molnar methods, it is crucial to note that the Kostrov method, which uses large earthquakes, accounts for the majority of the seismic energy released in a seismic area. It is significant that the seismic energy from a single large earthquake could equate to the total energy of a complete sequence of aftershocks from that earthquake in a seismic cycle (Nemati, 2014). Thus, the Kostrov method is more comprehensive in using the majority of localized seismic energy, while the Molnar method is useful for considering the distributed seismic energy in a tectonic area. A notable advantage of the Kostrov method is that it uses the seismic moment of large earthquakes obtained by mechanisms calculated mainly based on waveform modeling. Waveform modeling uses teleseismic waves, which do not accurately capture the anisotropy of the crust, unlike microearthquakes. Therefore, the Kostrov method could be better at reflecting the energy of seismic sources. The comparison of the two methods regarding input data demonstrates that the Kostrov method is better, as it can use more reliable and sufficiently long earthquake catalogs compared to the input data for the Molnar method. Recording microearthquakes requires a sufficiently dense seismic network, unavailable in the pre-instrumental era (1900–1964). During this period in seismology, we have more or less reliable data for large earthquakes but not for microearthquakes.
Assuming coaxiality between stress and strain, the direction of the compressional and tensional stresses in the Earth’s crust within a seismic area can be determined based on the orientation of pressure (P) and tension (T) vectors of earthquakes in that region. To achieve this, two sets of calculations are necessary:
1The resultant compressive and tensile stresses of earthquakes in each square block.
2The directions of these stresses estimated and compared for each earthquake individually, as delineated in Eqs 6, 7 (Stein and Wysession, 2009).
In these equations, S represents the strike direction, D denotes the dip, and R signifies the slip direction or rake of the seismic fault.
The equations for the tension (T) and pressure (P) vectors are defined as:
In the Zagros and Eastern Iran regions, the orientation of the pressure vectors aligns with the direction of convergence between the Arabian and Eurasian plates (Ghanbarian et al., 2021). According to the research by Vernant et al. (2004), this convergence occurs at a rate of approximately 21 mm/year in Southern Iran, predominantly in a north-northeast direction (as shown in Figures 3A, B).
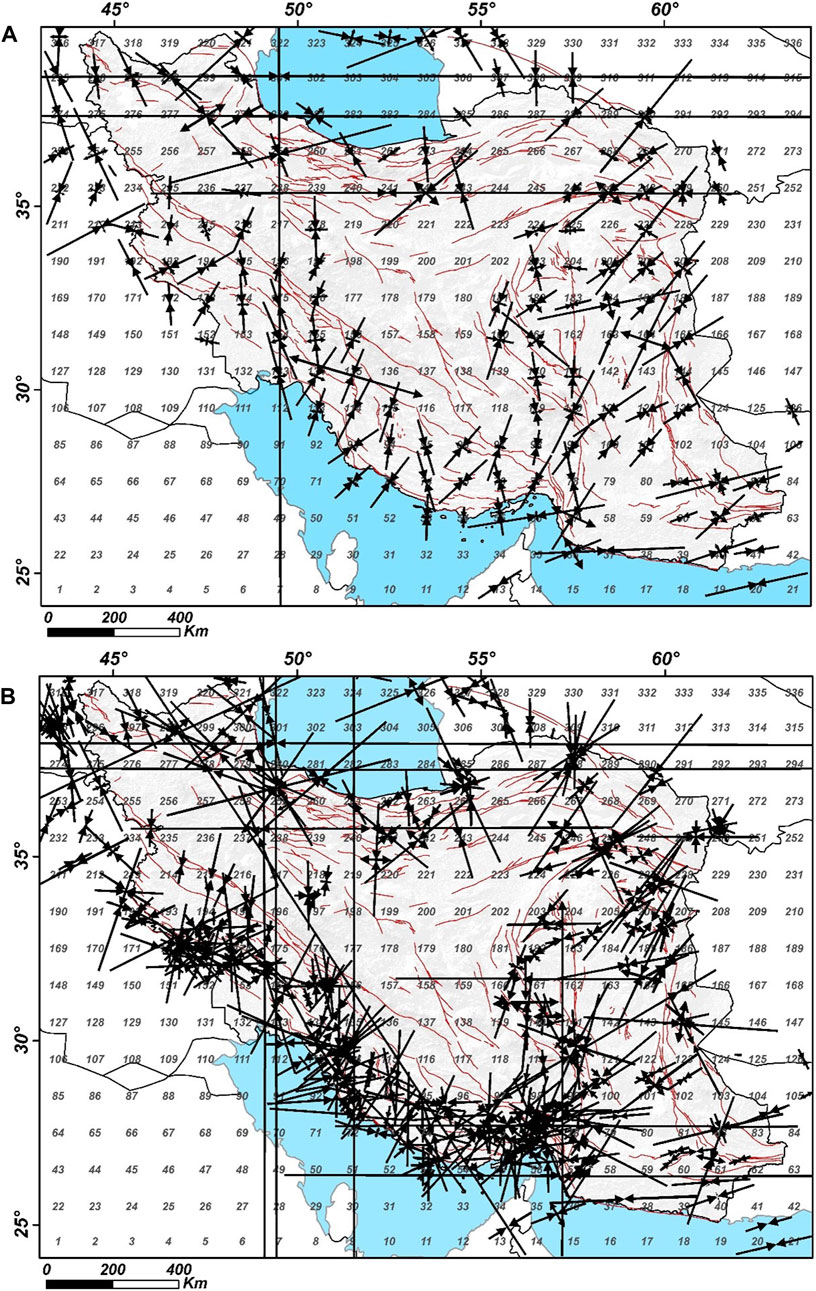
Figure 3. (A) The resultant axes of tension and pressure derived from earthquakes within each quadrangular block; (B) The tension and pressure axes corresponding to individual earthquakes. The faults are marked in red.
Our study has conducted a comparative analysis of the pressure and tension vectors across Iran (illustrated in Figure 3A), which are mapped using a 1º × 1º block arrangement. These vectors are juxtaposed against the geodetic strain vectors reported by (Raeesi et al., 2017), which are also depicted using the same block arrangement. Our comparison reveals that, except for the Makran and Alborz regions, there is a notable correlation between the orientations of the vectors in the two maps, indicating a general consistency in the directional alignment of tectonic movements and strain distribution across these regions.
3 Crustal movements
To estimate the various components of the Earth’s crust displacement velocity, it is essential to analyze the different components of the seismic moment tensor of earthquakes (Mij in 1). The six independent components of this tensor can be calculated using Eqs 8–13, as described by Jackson et al. (1995), utilizing three key parameters: strike (S), dip (D), and slip direction (R) of the seismic fault. These parameters were sourced from (Jackson et al., 1995) and the GCMT catalog.
Since the internal strain within the Earth’s crust partially manifests as displacement between crustal blocks, it is feasible to estimate the displacement velocity of the crust in various directions. This can be achieved by using the components of the strain tensor derived from the moment tensor of earthquakes, as outlined by (Jackson and McKenzie, 1988). They have also established equations linking the displacement velocity of the crust in different directions to the components of both the strain tensor and the moment tensor of earthquakes. Once the independent components of the earthquake moment tensor are determined using the aforementioned equations, the displacement speed of the crust in the horizontal and vertical directions can be estimated using Eqs 14, 15, as suggested by (Pondrelli et al., 1995).
In these equations, x, y, and z represent the length and width (which are equal to one degree for regular blocks), and thickness of the selected block, respectively. Here, the thickness corresponds to that of the seismogenic layer for which the velocity is being estimated. Vh and Vz denote the horizontal and vertical rates of crustal displacement within the selected block, as illustrated in Figure 4. Since the dimensions of the blocks in Figures 4A, B are oriented in the north and east directions, x, y, and z correspond to the north, east, and vertical directions, respectively.
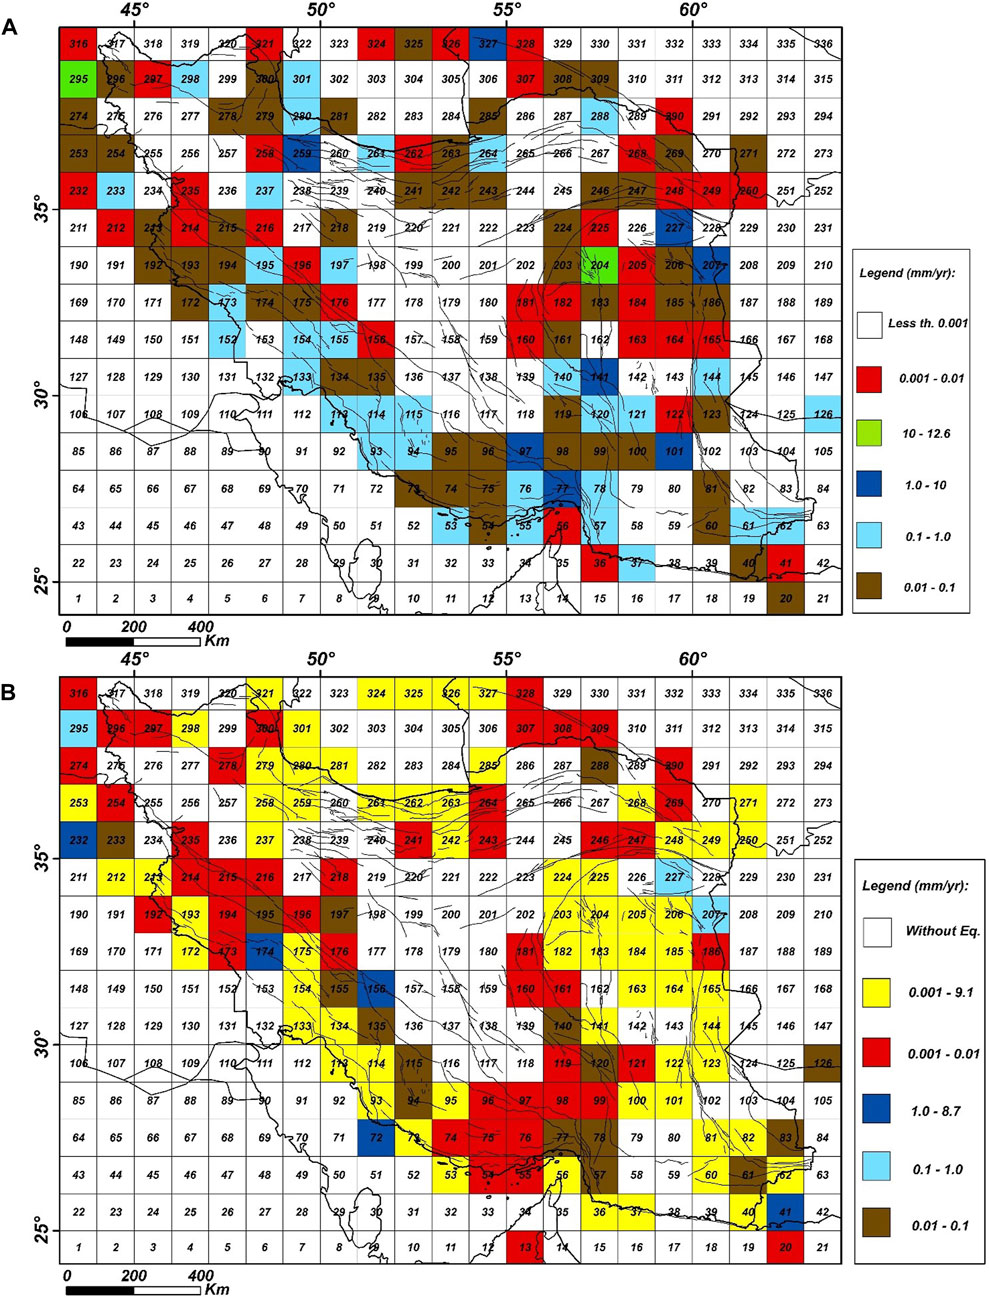
Figure 4. Estimation of the displacement speed of the crust in the main horizontal (A) and vertical (B) directions by using the independent components of the moment tensor of earthquakes. In panel (A), red, brown, light blue, dark blue and green colors indicate the speed range from 0.001 to 0.01, 0.01 to 0.1, 0.1 to 0.1, 0.1 to 10, and 10–12.6 mm per year, respectively, and also in panel (B), red, brown, light blue and dark blue colors indicate the speed range from 0.001 to 0.01, 0.01 to 0.1, 0.1 to 1.0, and 0.001 1–8.7 mm per year and the yellow color also indicates subsidence, which is between 0.001 and 9.1 mm per year. In these maps, the gray blocks are without earthquakes.
The maps presented in Figure 4 indicate that blocks #204 and #295 exhibit the highest rates of horizontal displacement. Specifically, block #204 was the site of the significant Tabas Golshan earthquake (MS 7.4) and its subsequent aftershocks (Berberian, 1979). This area shows pronounced horizontal displacement rates. Additionally, block #295 demonstrates the maximum horizontal displacement speed, which can be attributed to the compressive forces generated by the earthquakes in this region, as depicted in Figure 4A.
Berberian (Berberian, 1995) analyzed the active tectonics in the Zagros region, attributing the area’s geological features to the activity along two primary types of faults: the main longitudinal thrust faults and the transverse vertical faults. The longitudinal thrusts play a significant role in the region’s tectonic structure (Ghanbarian and Derakhshani, 2022). Additionally, the transverse vertical faults, exemplified by the Kazeroun and Sabzpoushan faults, contribute to the area’s geological complexity. The High Zagros region, in particular, has experienced uplift due to the activity along the High Zagros fault, evidenced by historical seismic events like the earthquake on 18 November 1226 AD, which had a magnitude of MW = 6.4 and a maximum intensity of I0 = VII.
Based on the current position of Paleozoic rocks along the high Zagros belt, Berberian (Berberian, 1995) estimated the cumulative amount of vertical displacement along this fault to be more than 6 km (Berberian, 1981). Although the mechanism of earthquakes does not confirm the thinning of the Earth’s crust in the subsidence of the Zagros foreland, Berberian (Berberian, 1981) has pointed out the uplift of the high Zagros since the Lower Miocene along the Zagros fault.
Other subsidences can also be seen on the western coast of Makran, eastern Jazmurian, northern Lut, southern coasts, and the central subsidence of the Caspian Sea, which is consistent with the tectonics of the mentioned areas. Thinning of the crust in the areas of Kopeh Dagh, western Alborz, and Talash, where we expect uplift and crustal deformation, is not consistent with the tectonics of those areas.
According to Figure 4B, red, brown, and blue colors can be interpreted as crustal uplift or subduction, and yellow color can also be interpreted as subsidence or thinning of the Earth’s crust in that area. Therefore, the uplifted Zagros area is associated with the uplift or subduction of the crust, and the Zagros foredeep is associated with the subsidence or thinning of the Earth’s crust, which is in fair agreement with the tectonics of the mentioned areas. Other subsidence can also be seen in the western coast of Makran, eastern Jazmurian, northern Lut, southern coasts, and the central subsidence of the Caspian Sea, which is consistent with the tectonics of the mentioned areas. Thinning of the crust in the areas of Kope Dagh, western Alborz, and Talash, where we expect uplift and crustal deformation, is not consistent with the tectonics of those areas.
4 Discussion
The tectonic processes, such as crustal thinning and subsidence of certain zones, are not precisely timed. Using the methods in this research, we can only estimate stress, strain, and crustal velocity. While large blocks are beneficial for stress and strain estimation due to their compatibility with area tectonics, they introduce more errors due to the necessity of averaging.
The average stress, strain, and velocity values in blocks are attributed to specific points in different shaped blocks. This averaging assumes uniformity across a block, which is not entirely accurate. An optimal estimation balances the influences of tectonics, topography, and uniformity errors.
The estimated strain rate of 0.01–411 nstrain/yr in this research contrasts with Tesauro et al., 2006’s findings for Central Europe, likely due to differing tectonic regimes and data ranges. This discrepancy also reflects the variance in convergence rates between the Iran-Arabia and Africa-Europe regions.
Comparisons with other studies in Iran (Ansari and Zamani, 2014; Zarifi et al., 2014; Raeesi et al., 2017) reveal inconsistencies in estimated strain rates, likely due to different block classifications, earthquake counts, calculation methods, and data ranges.
The tectonic areas in this study were chosen based on seismotectonic perspectives, considering factors like fault directions, dominant mechanisms, and earthquake distributions. Notably, the direction of mountain ranges like Alborz and Zagros has not significantly changed, although Alborz shows a sinusoidal form.
Crustal deformations have been investigated using seismic stress and strain analysis in different research, such as tectonic stress and the spectra of seismic shear waves from earthquakes (BRUNE JN, 1970); horizontal stress orientations (Lund and Townend, 2007); active crustal deformation in tow seismogenic zones of the Pannonian region (Bus et al., 2009); crustal deformation map of Iran (Khorrami et al., 2019); Stress-strain characterization of seismic source fields (Jordan and Juarez, 2021); evolution of the Stress and Strain field and Seismic Inversion of fault zone (Khoshkholgh et al., 2022); active deformation Patterns in the Northern Birjand Mountains, Iran (Ezati et al., 2022a); tectonic Evolution of Fault Splays in the East Iran Orogen (Rashidi et al., 2023b); seismic strain and seismogenic stress regimes in the crust of the southern Tyrrhenian region (Neri et al., 2003).
The significant variation in strain rate estimations across different zoning methods suggests that intermediate zoning might provide a more accurate estimation. However, the zoning shape should be consistent with the area’s topography, and the block size must consider the length of coseismic faults.
Incorporating small earthquakes (M < 5.0) in strain estimation shows their significant contribution, challenging the convention of focusing only on larger earthquakes. This is the first time seismic strain in Iran has been estimated using Molnar’s method, which accounts for small earthquakes.
GPS data shows interseismic deformation, such as Figure 8 of (Zarifi et al., 2014), while the focal mechanism of earthquakes shows the seismic strain caused by the earthquakes. Hence, these two parameters are different from each other. GPS data processing is a common method for estimating Earth’s crust shortening. Discrepancies in velocity rates estimated by seismic data and actual tectonic movements in Iran, particularly in the Zagros foreland subsidence, may be attributed to salt layers in the sedimentary cover.
Talebian and Jackson’s research on Zagros (Talebian and Jackson, 2004) suggests most earthquake foci are within the sedimentary cover, possibly influenced by salt layers. This might explain the vertical displacement in this area.
In the regions where crustal thickening occurs, reverse faults with corresponding mechanisms are expected. Consequently, earthquake mechanisms, maximum stress directions, and seismic strains must be perpendicular to these reverse faults. Thus, the crustal thickening in the High Zagros region is attributed to the activity of the High Zagros reverse fault, as evidenced by historical seismic events like the earthquake on 18 November 1226 AD, which had a magnitude of MW = 6.4 and a maximum intensity of I0 = VII. In this region, the seismic strain rate is high, and the direction of seismic strain is perpendicular to the High Zagros reverse fault. The lithologic units of the High Zagros differ from those of the Zagros foreland. The latter includes salt layers in the sedimentary cover, which undergo ductile deformation. Consequently, in the Zagros foreland, deformation predominantly manifests as folding rather than fracturing (earthquakes); furthermore, in this region, the seismic strain rate values are low, and the magnitudes of earthquakes are generally moderate to low. This is due to the earthquakes occurring at a depth of 10 km; as their waves move toward the surface and encounter salt domes, their energy is reduced. Therefore, there is no crustal thickening in the Zagros foreland, and the return period of the earthquakes is very long. Thus, crustal thickening in the High Zagros results from high rates of seismic strain, while crustal thinning in the Zagros foreland is due to low rates of seismic strain.
5 Conclusion
In conclusion, this study offers valuable insights into the diverse tectonic and seismic dynamics of Iran. By categorizing the region into seven distinct parts based on the direction of tension, pressure, and crustal displacement velocities, we gain a deeper understanding of its complex geological landscape. These regions encompass the northeastern and southwestern Zagros belt, the northeastern and southwestern sectors of eastern Iran, the eastern and northeastern Kopeh Dagh, as well as the eastern and middle Alborz, along with the Talash region, which spans western and eastern Alborz, and Azerbaijan. This comprehensive categorization serves as a crucial tool for unraveling the intricate interplay of tectonics and seismicity in this geologically complex region.
Data availability statement
The original contributions presented in the study are included in the article/Supplementary Material, further inquiries can be directed to the corresponding author.
Author contributions
MN: Conceptualization, Investigation, Methodology, Supervision, Validation, Visualization, Writing–original draft. AR: Conceptualization, Data curation, Formal Analysis, Project administration, Software, Validation, Writing–review and editing. ME: Formal Analysis, Software, Writing–original draft. RD: Funding acquisition, Investigation, Project administration, Resources, Validation, Visualization, Writing–review and editing.
Funding
The author(s) declare that no financial support was received for the research, authorship, and/or publication of this article.
Acknowledgments
We extend our gratitude to the International Research Institute of Seismology and Earthquake Engineering for providing access to their invaluable online seismic database.
Conflict of interest
The authors declare that the research was conducted in the absence of any commercial or financial relationships that could be construed as a potential conflict of interest.
Publisher’s note
All claims expressed in this article are solely those of the authors and do not necessarily represent those of their affiliated organizations, or those of the publisher, the editors and the reviewers. Any product that may be evaluated in this article, or claim that may be made by its manufacturer, is not guaranteed or endorsed by the publisher.
References
Ansari, S., and Zamani, A. (2014). Short-term seismic crustal deformation of Iran. Ann. Geophys. 57. doi:10.4401/ag-6413
Berberian, M. (1979). Earthquake faulting and bedding thrust associated with the Tabas-e-Golshan (Iran) earthquake of September 16, 1978. Bull. Seismol. Soc. Am. 69, 1861–1887. doi:10.1785/bssa0690061861
Berberian, M. (1981). Active faulting and tectonics of Iran. Zagros Hindu Kush Himalaya Geodyn. Evol. 3, 33–69. doi:10.1029/gd003p0033
Berberian, M. (1995). Master blind thrust faults hidden under the Zagros folds: active basement tectonics and surface morphotectonics. Tectonophysics 241, 193–224. doi:10.1016/0040-1951(94)00185-C
Berberian, M., Jackson, J. A., Qorashi, M., Khatib, M. M., Priestley, K., Talebian, M., et al. (1999). The 1997 May 10 Zirkuh (Qa’enat) earthquake (Mw 7.2): faulting along the Sistan suture zone of eastern Iran. Geophys J. Int. 136, 671–694. doi:10.1046/j.1365-246x.1999.00762.x
Berberian, M., and Papastamatiou, D. (1978). Khurgu (north Bandar Abbas, Iran) earthquake of March 21, 1977: a preliminary field report and a seismotectonic discussion. Bull. Seismol. Soc. Am. 68, 411–428. doi:10.1785/BSSA0680020411
Brune, J. N. (1970). Tectonic stress and the spectra of seismic shear waves from earthquakes. J. Geophys Res. 75, 4997–5009. doi:10.1029/jb075i026p04997
Bus, Z., Grenerczy, G., Tóth, L., and Mónus, P. (2009). Active crustal deformation in two seismogenic zones of the Pannonian region—GPS versus seismological observations. Tectonophysics 474, 343–352. doi:10.1016/j.tecto.2009.02.045
Derakhshani, R., and Eslami, S. S. (2011). A new viewpoint for seismotectonic zoning. Am. J. Environ. Sci. 7, 212–218. doi:10.3844/ajessp.2011.212.218
Derakhshani, R., Zaresefat, M., Nikpeyman, V., GhasemiNejad, A., Shafieibafti, S., Rashidi, A., et al. (2023). Machine learning-based assessment of watershed morphometry in makran. Land (Basel) 12, 776. doi:10.3390/land12040776
Dewey, J. W., and Grantz, A. (1973). The Ghir earthquake of April 10, 1972 in the Zagros Mountains of southern Iran: seismotectonic aspects and some results of a field reconnaissance. Bull. Seismol. Soc. Am. 63, 2071–2090. doi:10.1785/bssa0636-12071
Ezati, M., Gholami, E., Mousavi, S. M., Rashidi, A., and Derakhshani, R. (2022a). Active deformation patterns in the northern Birjand mountains of the sistan suture zone, Iran. Appl. Sci. 12, 6625. doi:10.3390/app12136625
Ezati, M., Gholami, E., Mousavi, S. M., Rashidi, A., and Ezati, M. (2023). Structural style and kinematic analysis of the northern birjand mountain range, sistan suture zone, Eastern Iran. Arabian J. Geosciences 16, 389. doi:10.1007/s12517-023-11504-z
Ezati, M., Rashidi, A., Gholami, E., Mousavi, S. M., Nemati, M., Shafieibafti, S., et al. (2022b). Paleostress analysis in the Northern Birjand, East of Iran: insights from inversion of Fault-slip data. Minerals 12, 1606. doi:10.3390/min12121606
Ghanbarian, M. A., and Derakhshani, R. (2022). The folds and faults kinematic association in Zagros. Sci. Rep. 12, 8350. doi:10.1038/s41598-022-12337-8
Ghanbarian, M. A., Yassaghi, A., and Derakhshani, R. (2021). Detecting a sinistral transpressional deformation belt in the Zagros. Geosci. (Basel) 11, 226. doi:10.3390/geosciences11060226
Gutenberg, B., and Richter, C. F. (1956). Earthquake magnitude, intensity, energy, and acceleration. Bull. Seismol. Soc. Am. 46, 105–145. doi:10.1785/bssa0460020105
Hanks, T. C., and Kanamori, H. (1979). A moment magnitude scale. J. Geophys Res. Solid Earth 84, 2348–2350. doi:10.1029/JB084iB05p02348
Hatzfeld, D., Tatar, M., Priestley, K., and Ghafory-Ashtiany, M. (2003). Seismological constraints on the crustal structure beneath the Zagros Mountain belt (Iran). Geophys J. Int. 155, 403–410. doi:10.1046/j.1365-246X.2003.02045.x
Hessami, K., Jamali, F., and Tabassi, H. (2003). Map of major Active Faults of Iran. Tehran, Iran: International Institute of Earthquake Engineering and Seismology.
Hollingsworth, J., Jackson, J., Walker, R., Reza Gheitanchi, M., and Javad Bolourchi, M. (2006). Strike-slip faulting, rotation, and along-strike elongation in the Kopeh Dagh mountains, NE Iran. Geophys J. Int. 166, 1161–1177. doi:10.1111/j.1365-246X.2006.02983.x
Jackson, J., Haines, J., and Holt, W. (1995). The accommodation of Arabia-Eurasia plate convergence in Iran. J. Geophys Res. Solid Earth 100, 15205–15219. doi:10.1029/95JB01294
Jackson, J., and McKenzie, D. (1988). The relationship between plate motions and seismic moment tensors, and the rates of active deformation in the Mediterranean and Middle East. Geophys J. Int. 93, 45–73. doi:10.1111/j.1365-246X.1988.tb01387.x
Jenny, S., Goes, S., Giardini, D., and Kahle, H. G. (2004). Earthquake recurrence parameters from seismic and geodetic strain rates in the eastern Mediterranean. Geophys J. Int. 157, 1331–1347. doi:10.1111/j.1365-246X.2004.02261.x
Jordan, T. H., and Juarez, A. (2021). Stress-strain characterization of seismic source fields using moment measures of mechanism complexity. Geophys J. Int. 227, 591–616. doi:10.1093/gji/ggab218
Khorrami, F., Vernant, P., Masson, F., Nilfouroushan, F., Mousavi, Z., Nankali, H., et al. (2019). An up-to-date crustal deformation map of Iran using integrated campaign-mode and permanent GPS velocities. Geophys J. Int. 217, 832–843. doi:10.1093/gji/ggz045
Khoshkholgh, S., Orozova-Bekkevold, I., and Mosegaard, K. (2022). Evolution of the stress and strain field in the tyra field during the Post-Chalk Deposition and seismic inversion of fault zone using informed-proposal Monte Carlo. Appl. Comput. Geosciences 14, 100085. doi:10.1016/j.acags.2022.100085
Kostrov, V. V. (1974). Seismic moment and energy of earthquakes, and seismic flow of rock. Izv. Acad. Sci. USSR Phys. Solid Earth 1, 23–44.
Lund, B., and Townend, J. (2007). Calculating horizontal stress orientations with full or partial knowledge of the tectonic stress tensor. Geophys J. Int. 170, 1328–1335. doi:10.1111/j.1365-246X.2007.03468.x
Masson, F., Chéry, J., Hatzfeld, D., Martinod, J., Vernant, P., Tavakoli, F., et al. (2005). Seismic versus aseismic deformation in Iran inferred from earthquakes and geodetic data. Geophys J. Int. 160, 217–226. doi:10.1111/j.1365-246X.2004.02465.x
Mohammadi Nia, A., Rashidi, A., Khatib, M. M., Mousavi, S. M., Nemati, M., Shafieibafti, S., et al. (2023). Seismic risk in Alborz: insights from geological moment rate estimation and fault activity analysis. Appl. Sci. 13, 6236. doi:10.3390/app13106236
Molnar, P. (1979). Earthquake recurrence intervals and plate tectonics. Bull. Seismol. Soc. Am. 69, 115–133. doi:10.1785/bssa0690010115
Navabpour, P., and Barrier, E. (2012). Stress states in the Zagros fold-and-thrust belt from passive margin to collisional tectonic setting. Tectonophysics 581, 76–83. doi:10.1016/j.tecto.2012.01.011
Nemati, M. (2014). An appraisal of aftershocks behavior for large earthquakes in Persia. J. Asian Earth Sci. 79, 432–440. doi:10.1016/j.jseaes.2013.10.015
Nemati, M. (2019). Seismotectonic and seismicity of Makran, a bimodal subduction zone, SE Iran. J. Asian Earth Sci. 169, 139–161. doi:10.1016/j.jseaes.2018.08.009
Nemati, M., and Derakhshani, R. (2021). Short-term seismicity patterns along the most active faults in Iran. J. Iber. Geol. 47, 441–459. doi:10.1007/s41513-020-00133-0
Nemati, M., Hatzfeld, D., Gheitanchi, M. R., Sadidkhouy, A., and Mirzaei, N. (2011). Microseismicity and seismotectonics of the firuzkuh and astaneh faults (east Alborz, Iran). Tectonophysics 506, 11–21. doi:10.1016/j.tecto.2011.04.007
Nemati, M., and Tatar, M. (2015). Relations between source parameters for large Persian earthquakes. Ann. Geophys. 58. doi:10.4401/ag-6665
Neri, G., Barberi, G., Orecchio, B., and Mostaccio, A. (2003). Seismic strain and seismogenic stress regimes in the crust of the southern Tyrrhenian region. Earth Planet Sci. Lett. 213, 97–112. doi:10.1016/S0012-821X(03)00293-0
Pondrelli, S., Morelli, A., and Boschi, E. (1995). Seismic deformation in the Mediterranean area estimated by moment tensor summation. Geophys J. Int. 122, 938–952. doi:10.1111/j.1365-246X.1995.tb06847.x
Raeesi, M., Zarifi, Z., Nilfouroushan, F., Boroujeni, S. A., and Tiampo, K. (2017). Quantitative analysis of seismicity in Iran. Pure Appl. Geophys 174, 793–833. doi:10.1007/s00024-016-1435-4
Rashidi, A. (2021). Geometric and kinematic characteristics of the khazar and north Alborz faults: links to the structural evolution of the north alborz-south caspian boundary, northern Iran. J. Asian Earth Sci. 213, 104755. doi:10.1016/j.jseaes.2021.104755
Rashidi, A., and Derakhshani, R. (2022). Strain and moment rates from GPS and seismological data in northern Iran: implications for an evaluation of stress trajectories and probabilistic fault rupture hazard. Remote Sens. (Basel) 14, 2219. doi:10.3390/rs14092219
Rashidi, A., Khatib, M. M., Nilfouroushan, F., Derakhshani, R., Mousavi, S. M., Kianimehr, H., et al. (2019). Strain rate and stress fields in the West and South Lut block, Iran: insights from the inversion of focal mechanism and geodetic data. Tectonophysics 766, 94–114. doi:10.1016/j.tecto.2019.05.020
Rashidi, A., Kianimehr, H., Yamini-Fard, F., Tatar, M., and Zafarani, H. (2022). Present stress map and deformation distribution in the NE Lut block, eastern Iran: insights from seismic and geodetic strain and moment rates. Pure Appl. Geophys 179, 1887–1917. doi:10.1007/s00024-022-03015-x
Rashidi, A., Nemati, M., Shafieibafti, S., Pourbeyranvand, S., Derakhshani, R., and Braitenberg, C. (2023a). Structure and kinematics of active faulting in the northern domain of Western and Central Alborz, Iran and interpretation in terms of tectonic evolution of the region. J. Asian Earth Sci. 255, 105760. doi:10.1016/J.JSEAES.2023.105760
Rashidi, A., Shafieibafti, S., Nemati, M., Ezati, M., Gholami, E., Mousavi, S. M., et al. (2023b). Flexural-slip folding in buckling phases of orogenic belts: insight into the tectonic evolution of fault splays in the East Iran orogen. Front. Earth Sci. (Lausanne) 11, 1169667. doi:10.3389/feart.2023.1169667
Stein, S., and Wysession, M. (2009). An introduction to seismology, earthquakes, and earth structure. John Wiley and Sons.
Talebian, M., and Jackson, J. (2004). A reappraisal of earthquake focal mechanisms and active shortening in the Zagros mountains of Iran. Geophys J. Int. 156, 506–526. doi:10.1111/j.1365-246X.2004.02092.x
Tesauro, M., Hollenstein, C., Egli, R., Geiger, A., and Kahle, H. G. (2006). Analysis of central western Europe deformation using GPS and seismic data. J. Geodyn. 42, 194–209. doi:10.1016/j.jog.2006.08.001
Vernant, P., Nilforoushan, F., Hatzfeld, D., Abbassi, M. R., Vigny, C., Masson, F., et al. (2004). Present-day crustal deformation and plate kinematics in the Middle East constrained by GPS measurements in Iran and northern Oman. Geophys J. Int. 157, 381–398. doi:10.1111/j.1365-246x.2004.02222.x
Woessner, J., and Wiemer, S. (2005). Assessing the quality of earthquake catalogues: estimating the magnitude of completeness and its uncertainty. Bull. Seismol. Soc. Am. 95, 684–698. doi:10.1785/0120040007
Zarifi, Z., Nilfouroushan, F., and Raeesi, M. (2014). Crustal stress map of Iran: insight from seismic and geodetic computations. Pure Appl. Geophys 171, 1219–1236. doi:10.1007/s00024-013-0711-9
Keywords: tectonic movements, vertical velocity, regional geodynamics, Kostrov and Molnar methods, seismotectonics
Citation: Nemati M, Rashidi A, Ezati M and Derakhshani R (2024) Quantitative analysis of crustal deformation, seismic strain, and stress estimation in Iran via earthquake mechanisms. Front. Earth Sci. 12:1408873. doi: 10.3389/feart.2024.1408873
Received: 28 March 2024; Accepted: 05 June 2024;
Published: 20 June 2024.
Edited by:
Fan Yang, Lanzhou University, ChinaReviewed by:
Hong Xie, Lanzhou Institute of Seismology, ChinaShaoxing Hui, Shaanxi Earthquake Agency, China
Copyright © 2024 Nemati, Rashidi, Ezati and Derakhshani. This is an open-access article distributed under the terms of the Creative Commons Attribution License (CC BY). The use, distribution or reproduction in other forums is permitted, provided the original author(s) and the copyright owner(s) are credited and that the original publication in this journal is cited, in accordance with accepted academic practice. No use, distribution or reproduction is permitted which does not comply with these terms.
*Correspondence: Reza Derakhshani, ci5kZXJha2hzaGFuaUB1dS5ubA==