 Sanjukta Dhar
 Mason N. Frucci1,2
 James M. Fulton
- 1Microbial Biogeochemistry Lab, Department of Geosciences, Baylor University, Waco, TX, United States
- 2Applied Petroleum Studies Lab, Department of Geosciences, Baylor University, Waco, TX, United States
The Devonian-Carboniferous (D-C; 359 Ma) boundary is marked by widespread deposition of organic-matter-rich black shales associated with the Hangenberg mass extinction event. The Exshaw Formation spans the D-C boundary in the Western Canada Sedimentary Basin (WCSB) and includes the basal Exshaw Shale deposited under broadly anoxic waters. The sediments at the base of the Exshaw Shale were deposited synchronously during a transgressive event across the WCSB, spanning the geographic variability of the basin. The variable Corg content of the shale was affected by local nutrient upwelling and paleotectonic features impacting water depth and circulation. To characterize the link between paleogeography and nutrient cycling, geographic (N = 20 locations) and stratigraphic (N = 6 locations) trends of δ13Corg and δ15Nbulk were examined throughout the WCSB, representing a range of depositional settings. The δ15Nbulk values range between 0.0 and 6.3‰ and δ13Corg from −29.5 to −26.8‰. Phytoplankton production in focused upwelling zones acquired a relatively 15N-depleted signature through isotopic fractionation during nutrient assimilation, and the residual nutrient pool was 15N-enriched. The advection of surface waters away from the location of upwelling supported additional phytoplankton growth and the deposition of sediments with higher δ15N values. The stratigraphic sections include black laminated and burrowed mudrock sequences that record changes in paleoredox conditions, water depth, and tectonism over time. Up-core from the base of the Exshaw, the Corg content decreases and simultaneously δ15Nbulk increases, suggesting a decrease in eutrophic conditions. Variable δ13Corg and δ15Nbulk trends demonstrate that there is no “type” isotopic profile spanning the D-C boundary in the WCSB.
1 Introduction
Understanding biogeochemical nutrient cycles in past oceans is pivotal in reconstructing the impact of microbial life on the evolution of the earth system. Recent efforts modeling nitrogen cycling in ancient anoxic oceans have identified spatial separation in the relative contributions of NH4+ and NO3− assimilation, N2 fixation, and denitrification to export production, all controlled by ocean circulation and local paleogeography (Higgins et al., 2012; Naafs et al., 2019). Phytoplankton populations typically draw on the pool of bioavailable nutrient-N consisting of mainly NO3− in oxygenated waters and NH4+ where anoxia occurs in the photic zone. Where the water is suboxic, the NH4+ pool is upwelled to overlying oxygenated waters where it is nitrified (Fernandez and Farias, 2012; Dalsgaard et al., 2012). Nitrogen fixation is focused in regions where N-nutrients (NO3− and NH4+) are depleted, and bioavailable phosphorus remains. This study applies these findings of global-scale nutrient dynamics modeling to a regional examination of N utilization in the Western Canada Sedimentary Basin (WCSB) during the Devonian-Carboniferous (D-C) transition.
Atmospheric N2 fixed by diazotrophic cyanobacteria maintains phytoplankton growth in the ocean, compensating for bioavailable nutrient-N lost to denitrification and anaerobic ammonium oxidation (anammox) processes (Zehr and Ward, 2002; Altabet, 2005; Kuypers et al., 2018; Pajares and Ramos, 2019). The N isotopic composition of phytoplankton generally reflects the balance between assimilation of nutrient-N that is 15N-enriched by denitrification and anammox, and N2 fixation that results in low δ15N values in biomass. Complete uptake of available N-nutrients will transfer the isotopic composition of the initial nutrient pool to plankton biomass. However, partial utilization of available nutrients results in N isotopic fractionation, wherein the biomass is relatively 15N depleted and the residual nutrient pool enriched in 15N. This is due to the preferential incorporation of lighter nitrogen (14N) into the phytoplankton cells. Subsequent phytoplankton growth using the residual nutrient pool yields biomass that is 15N enriched relative to the initial biomass, and advective surface water currents can cause spatial separation of low and high δ15N OM (e.g., De Pol-Holz et al., 2009). Applying Rayleigh fractionation, we can explain the spatial trends in δ15N across different productivity regimes in WCSB.
In modern oceans, the deep nutrient pool forms through decomposition of sinking particulate organic matter (OM), with NH4+ produced by ammonification and NO3− by nitrification under oxidizing conditions (Stief, 2013). Deep waters are brought up to the surface where meridional winds promote advection, surface water divergence, and equatorial and coastal upwelling. Thus, nutrient-rich waters are upwelled near the equator and on the tropical/subtropical western margins of continents such as the Peruvian margin, California coast, southern and northwest Africa, and Arabian Sea in the modern ocean (Kumar et al., 2001; Altabet et al., 2002; Kienast et al., 2002; Altabet, 2005; Elfi Mollier-Vogel et al., 2012). The upwelled nutrients support phytoplankton growth in the photic zone (Carbonel and Valentin, 1999; Reyes-Mendoza et al., 2019). Enhanced primary production and export on continental margins leads to oxygen consumption by respiration below the photic zone, and slow ventilation of subsurface water creates oxygen minimum zones (OMZs) that can expand into widespread ocean anoxia (Karstensen et al., 2008; Jenkyns et al., 2010; Schönfeld et al., 2015). Bottom water anoxia/suboxia promotes the preservation of phytoplankton δ15N values, especially in relatively shallow water and adjacent to continental margins (Calvert et al., 1996).
Broad shifts in nutrient speciation and concentration during the Paleozoic were closely tied to changes in delivery from terrestrial sources, marine primary production, OM decomposition, and deep-water ventilation (Saltzman, 2005; Liu et al., 2016; Naafs et al., 2019; Pajares and Ramos, 2019). Major changes in ocean biogeochemistry were linked to excursions in carbon and nitrogen isotopic compositions, identifiable through geochronologic analyses of sedimentary records. The biogeochemical shifts associated with the D-C boundary (359 Ma) have been connected to the Hangenberg mass extinction. This event has been recognized globally, including end-Devonian sediments from the Rhenish Massif in the Rhenohercynian Basin, Germany (Kaiser et al., 2006), Carnic Alps in Carnic Basin, Italy (Bábek et al., 2016), Namur-Dinant Basin in Belgium and northern France (Kumpan et al., 2015), Holy Cross Mountains in the Polish Basin (Matyja et al., 2021), Witpoort Formation, South Africa (Scholze and Gess, 2017), and Cat Ba Island in Vietnam (Komatsu et al., 2014). In North America, End-Devonian black shales from Iowa, Missouri, Illinois, North Dakota, and Ohio in the United States and the WCSB in Alberta are correlated chronostratigraphically with other global Hangenberg intervals (Schmoker and Hester, 1983; Robison, 1995; Caplan and Bustin, 1998; Myrow et al., 2011; Martinez et al., 2019). At most locations, the D-C boundary features a succession of OM-rich black shales, calcareous shales, and limestones related to glacioeustatic sea-level oscillation (Pisarzowska et al., 2020).
The stratigraphic correlation of Late-Devonian OM-rich black shales from epicontinental basins suggests a link between marine export production and mass extinction (Caplan and Bustin, 1999; Kaiser, 2005; Becker et al., 2016a). Paleontological data from these sediments indicates the loss of >50% of marine biodiversity, including ammonoid, trilobite, conodont, fish, acritarch, and foraminifera taxa (Becker et al., 2016b). The extensive black shale record representing the Late-Devonian mass extinction is indicative of a gradual and episodic environmental transformation rather than a cataclysmic one, resulting in a series of extinction events over a period of ∼15 Ma. The proliferation of vascular land plants was a bioevolutionary mechanism that triggered a cascading effect of associated environmental changes during the Devonian Period. With increased root biomass that penetrated greater depths into the soil, the rates of continental weathering and nutrient flux to the ocean were exacerbated and led to nutrient cycle perturbations in the ocean (Algeo and Scheckler, 2010; Marynowski et al., 2012; Liu et al., 2016; Zhang et al., 2020). This eventually led to expanded marine anoxia, which caused a global marine mass extinction event. The enhanced continental weathering and high rates of carbon burial were also responsible for a shift from a greenhouse climate of the Devonian to an icehouse climate in the Carboniferous (Kaiser et al., 2016; Rakociński et al., 2020; Heath et al., 2021).
During the D-C transition, the WCSB was a shallow epicontinental sea along the tropical western margin of the North American Craton (Blakey, 2008). The sediments deposited during this time comprise the Banff Assemblage. The WCSB was bounded by the Peace River Arch to the north, the North American Cratonic margin to the east, the Prophet Trough to the west, and the Sweetgrass Arch to the southeast. The Sweetgrass Arch also separated the WCSB from the contemporaneous Williston Basin (WB, Figure 1). North of the Antler orogenic belt and west of PT, the Cariboo mountains formed due to Mid-Devonian contractional deformation in the Cordilleran margin (Smith et al., 1993; Barclay et al., 1994). Post deposition, the Banff Assemblage was truncated to the east by the Lower Carboniferous erosional edge and to the west by the Laramide Orogeny fold and thrust belt (Figure 1). The tropical location of the WCSB on the western margin of the North American Craton promoted surface water divergence and coastal and equatorial upwelling of nutrient-rich waters that supported elevated primary productivity and export production to the sediments (Parrish, 1982; Robison, 1995).
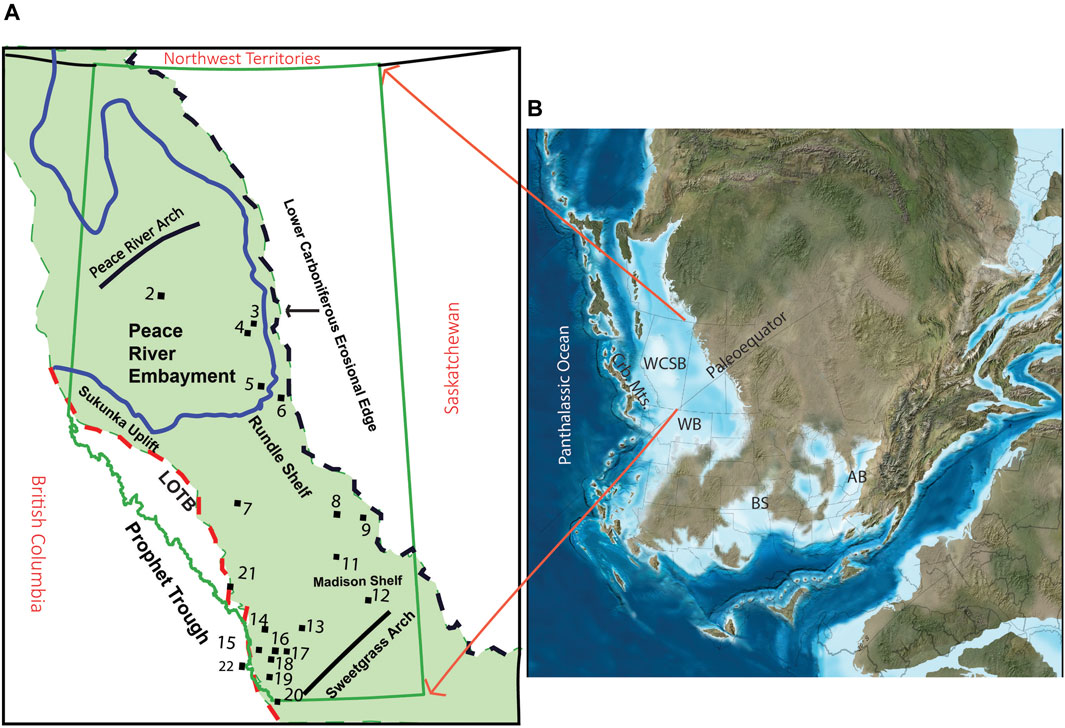
Figure 1. (A) Geographic extent of the Banff Assemblage shaded in green and sample locations. LOTB = Laramide Orogeny Thrust Belt (B) Devonian paleogeography: WCSB, Western Canada Sedimentary Basin; WB, Williston Basin; Crb. Mts., Cariboo Mountains; BS, Burlington Shelf; AB, Appalachian Basin [Modified from Blakey (2008) and Barclay et al. (1994)].
Nitrogen isotope records from oceanic anoxic events (OAEs) commonly register low δ15N signals, usually attributed to diazotrophy and NH4+ assimilation. This study uses δ13Corg, δ15Nbulk, Corg weight percent, and redox-sensitive trace element enrichment factors to assess variable nutrient dynamics across an epicontinental basin. Regional tectonism and global eustasy led to basin-wide spatial heterogeneity in water depth and sedimentation rates (Robison, 1995; Caplan and Bustin, 1999). The interaction between upwelling zones supporting high primary productivity and regions of stable density stratification inhibiting mixing affected variable OM export to the sediments (Caplan and Bustin, 1998; 2001; Murphy et al., 2000; Werne et al., 2002; Ross and Bustin, 2008; Tuite et al., 2019; Kabanov and Jiang, 2020). For the WCSB, we hypothesize that the incomplete utilization of nutrients in upwelling zones and variable utilization of nutrients and N2 fixation along the flow path of advected surface waters resulted in progressively lower export production and increasing δ15N values. These variations make the WCSB an ideal setting to study the effects of local paleogeography on marine biogeochemical cycle processes and OM accumulation. It further establishes a mechanism for local variability in nutrient cycling and primary productivity from the WCSB that captures the dynamics of the global marine N cycle during periods of intense ocean anoxia.
2 Methods
2.1 Preparation of samples
Fresh specimens for geochemical analysis were collected from sediment cores at the Alberta Energy Regulator Core Research Centre (Calgary, Alberta, Canada). Cores were described to identify sedimentary facies and formation unit boundaries, which were differentiated based on ichnology, bioturbation intensity, grain size, fossil prevalence, reactivity to 10% HCl, fracture frequency, sedimentary structures, and color (Frucci, 2021). The cores were then depth-corrected to match log depth by comparing core-observed rock attributes and gamma-ray, induction, and neutron/density log response (Visy, 2022). Additional samples from two outcrop exposures of the Exshaw Formation at Jura Creek and Crowsnest Pass (Locations 21 and 22, Figure 1) were also analyzed in this study. For each outcrop sample, exposed/weathered surfaces were removed using a grinder before being broken into small chips using a rock hammer and powdered in a shatterbox (SPEX Industries Inc., Catalog No. 8500). For C and N isotopic analysis, the powdered samples were decarbonated using 10% HCl (v/v) for 48 h and centrifuged at 3000 RCF for 4 min. The supernatant was then decanted, and acid was added to test for effervescence that indicates residual inorganic carbon. After decarbonation, samples were rinsed three times or until pH neutral with deionized water, centrifuged, and the supernatant discarded. The solid residue was dried using a freeze drier for 24–48 h.
2.2 Bulk stable isotope analyses
For determination of bulk δ13Corg and δ15Nbulk, 10–30 mg decarbonated samples were weighed into tin capsules and loaded into a zero-blank auto-sampler on an elemental analyzer (EA; Costech, ECS 4010) coupled with an isotope ratio mass spectrometer (IRMS; Thermo-Electron Delta V Advantage) in the Baylor Geosciences Stable Isotope Lab. We analyzed the N isotopic composition of a set of 8 non-acidified Exshaw Shale samples to examine the effect of acidification on δ15N values. On average the acidified samples were 15N-enriched by 0.68 ± 0.69‰. While this difference is not trivial, the geographic and stratigraphic trends are captured by the δ15N values of acidified samples. The N2 and CO2 produced in the EA passed through a thermal conductivity detector for total nitrogen and organic carbon determination prior to transfer to the IRMS. Samples were analyzed in batches of 10 bracketed by blanks and an internal standard acetanilide calibrated to international isotope standards (USGS 40: δ13C = −26.39‰, δ15N = −4.52‰; USGS 41: δ13C = +37.63‰, δ15N = +47.57‰). Isotopic composition is reported in conventional δ notation relative to Vienna Pee Dee Belemnite (VPDB) for carbon and atmospheric N2 for nitrogen. Standard deviations range between 0.01 and 0.1‰ for δ13Corg and 0.12–0.24‰ for δ15N.
2.3 Trace element analysis
Trace and major element concentrations were measured using a portable Bruker TRACER 5i X-Ray Fluorescence (XRF) spectrometer. To assess redox conditions, vanadium, molybdenum, uranium, nickel, chromium, and cobalt concentrations are reported and normalized to aluminum to account for terrigenous inputs of the trace elements (TE). Four standards, Zentrales Geolosches Institut Black Shale (ZGI TS), Mintek Carbonaceous Shale (SARM 41), Geological Survey of Japan Black forest soil (JSO-1), and Geological Survey of Japan Porites sp. Coral (Jcp-1), were analyzed before and after each batch of samples for a total of 10 replicates. These values were used to determine accuracy and precision of analyses and calculate response factors to assess the stability of the internal “Mudrock” calibration. For ZGI TS, the relative uncertainty (1σ standard deviation) calculated during analysis was 10.5% for Al, 3.8% for V, 3% for Mo, 18.7% for U, 5.8% for Ni, 13% for Co, and 5.3% for Cr. Trace element enrichment factors (EF) were calculated relative to the reference elemental concentration values reported for the global average Post-Archean Australian Shale (PAAS) (Taylor and McLennan, 1985; Tribovillard et al., 2006; Algeo and Liu, 2020).
3 Results
The Corg concentration for decarbonated sediments ranged between 0.3% and 19.9%, with a maximum typically at or near the base of the Exshaw Fm. (Figure 2). We report stratigraphic profiles of δ13Corg and δ15Nbulk for three depositional provinces: the Peace River Embayment (PRE; Loc. 3 and 4 on Figures 1, 2A,B), the Madison Shelf (Loc. 9 and 11 on Figures 1, 2C,D) and the eastern margin of the Prophet Trough (Loc. 21 and 22 on Figures 1, 2E,F). The Exshaw Fm. consists of shale and siltstone members that unconformably overlie earlier Famennian carbonate rocks (Caplan and Bustin, 1998; Vernon, 2001; Stoyles et al., 2011). The study interval stratigraphically comprises five units: (1) the Big Valley or Palliser Fms. at the base (carbonate skeletal packstone or laminated nodular sediments), (2) the Exshaw Lower Shale (fine-grained laminated or burrowed black mudstone), (3) the Exshaw Upper Shale (mechanically laminated mudstone or burrowed mudstone), (4) the Exshaw Siltstone (mechanically laminated siltstone), and (5) the Banff Fm. (variable components of black laminated mudstone, interbedded carbonate/black mechanically laminated mudstone, or skeletal packstone; Frucci, 2021; Visy, 2022). The Exshaw Lower Shale unit is Corg-rich with little carbonate content, and the Upper Shale is calcareous with decreased Corg content (Richards and Higgins, 1988; Savoy, 1990; Smith et al., 1995; Vernon, 2001).
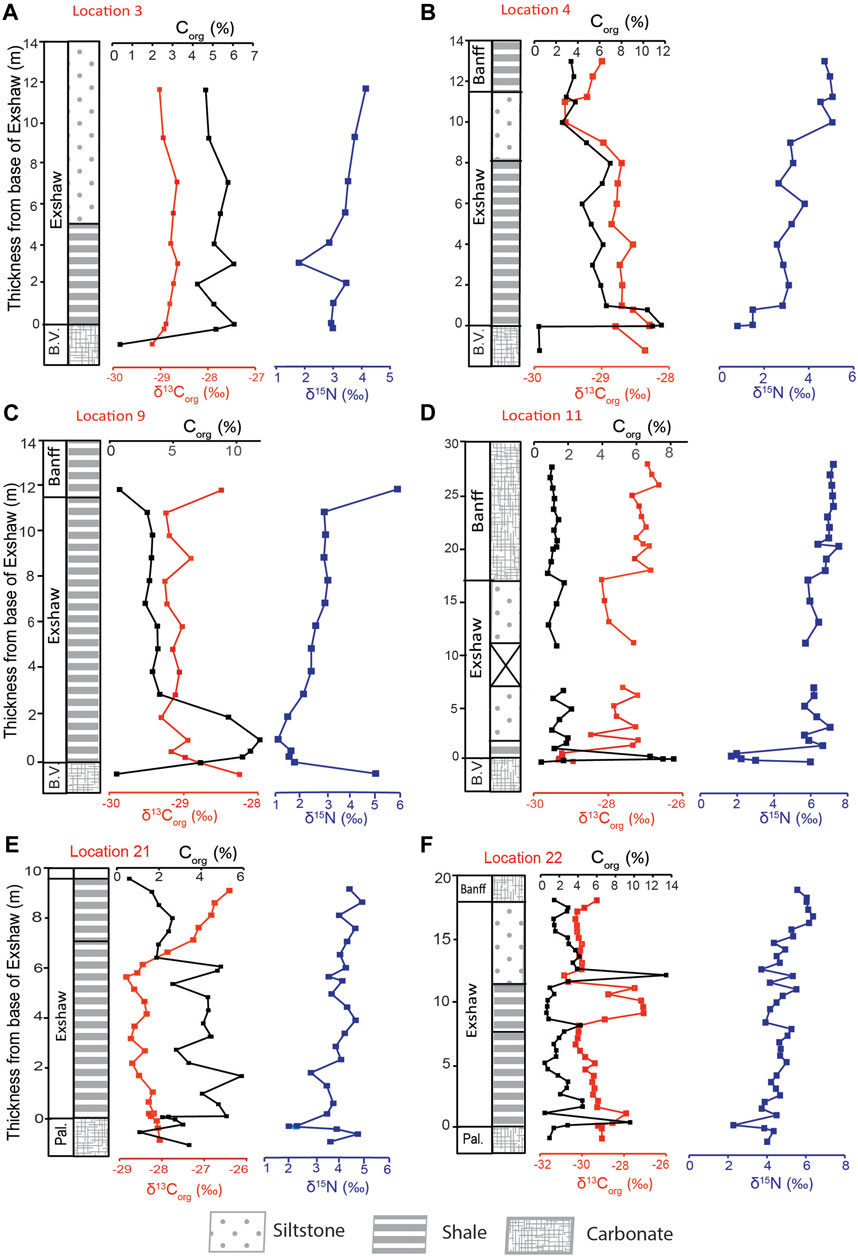
Figure 2. Stratigraphic profiles of Corg and bulk N isotopic compositions for Banff Assemblage sediments from the Peace River Embayment [(A) Loc. 3; (B) Loc. 4], Rundle Shelf [(C) Loc. 9; (D) Loc. 11], and Prophet Trough [(E) Loc. 21; (F) Loc. 22]. Abbreviations: Pal., Palliser Formation; B.V., Big Valley Formation.
3.1 Carbon profiles
The Peace River Embayment was a prominent bathymetric feature of the WCSB at the end of the Devonian and served as a relatively deep-water connection between the open ocean and Prophet Trough to the basin’s interior (Robison, 1995). At Loc. 3 and 4, the Corg content increased from ∼0.4% in the Big Valley (BV) Fm. to 6.1% and 11.7%, respectively, at the base of the Exshaw Fm. (Figures 2A,B). The average Corg content at Loc. 4 decreased up-core from 5.7% ± 1.6% in the Exshaw Shale to 3.3% ± 0.2% in the Banff Fm. The δ13Corg values decreased from −28.4‰ in the BV to −28.6 ± 0.2‰ in the Exshaw Shale, −29.2 ± 0.4‰ in the Siltstone, and −29.1 ± 0.1‰ in the Banff Fm. At Loc. 3, a consistent Corg content of 5.2% ± 0.7% and δ13Corg of −28.8‰ was maintained throughout the shale and siltstone units. A similar published profile for the Peace River Embayment near Loc. 2 (Figure 1) reported δ13Corg values between −28.2 and −28.5‰ across the Exshaw interval (Caplan and Bustin, 1998).
The Loc. 11 core includes the Big Valley carbonate at the base, a very thin layer of Exshaw Shale (∼1.25 m) overlain by siltstone and Banff carbonate (Figure 2D). In comparison, the Exshaw Shale at Loc. 9 is 10.75 m thick without a siltstone member above it (Figure 2C). These two locations occur on the Madison Shelf, which was a shallow marine setting compared to the Peace River Embayment in the north and the Prophet Trough in the west (Smith and Bustin, 2000; Vernon, 2001). At Loc. 11, Corg increased from 0.4% just below the Exshaw Fm. to a maximum of 8.2% in the Exshaw shale. The average Corg content decreased rapidly thereafter, to < 2% in both the Exshaw Siltstone and Banff Fm. Average δ13Corg value increased from −29.3 ± 0.1‰ in the Exshaw Shale to −27.7 ± 0.4‰ to −27.0 ± 0.2‰ in the Banff Fm. At Loc.9, Corg increased from 0.5% in the BV Fm. to a maximum of 10.5% near the base of the Exshaw Shale. It then decreased to 0.8% in the Banff Fm. The δ13Corg values of Exshaw Shale at Loc.9 were similar to Loc. 11 despite differences in unit thickness. At Loc. 9, average δ13Corg values of Exshaw Shale was −29.1 ± 0.1‰ and rose to −28.5‰ in the Banff Shale.
The Banff Fm. sediments at Jura Creek (Loc. 21) and Crowsnest Pass (Loc. 22) were deposited along the eastern margin of the Prophet Trough. Here, the Palliser Fm. underlies the Exshaw Fm., and the Exshaw Shale is formally divided into Lower Shale and Upper Shale members based on their Corg richness, microfossil abundance and mineral content (Vernon, 2001). Both shale members consist of black laminated mudrocks, but the Lower Shale had a higher Corg content. At Loc. 21, the average Corg concentration for the Lower Shale was 3.9% ± 1.1% and the Upper Shale was 1.9% ± 0.7%. There was a drop in δ13Corg values from −28.3‰ to −28.9‰ in the Lower Shale, followed by a13C enrichment to −26.5‰ in the Upper Shale (Figure 2E). At Loc. 22, the Corg content for the Lower Shale ranged between 0.5% – 9.6%, with a mean Corg of 2.8% ± 2.4%, whereas for the Upper Shale, it ranged between 1.4% and 4.3%, and a mean Corg of 2.6% ± 1.1% was recorded. There was a notable maximum of 13.4% at the base of the siltstone unit (Figure 2F). δ13Corg values ranged from −29.4‰ at the base of the Exshaw to −27.2‰ in the siltstone member. The occurrence of a ∼3‰13C-enrichment at the transition from the Lower to Upper Shale at both Loc. 21 and 22 is notable, as this is the most significant carbon isotopic excursion detected in the WCSB.
3.2 Nitrogen profiles
Banff Assemblage δ15N profiles were broadly similar at all locations, exhibiting relatively low values (0.1–2.9‰) at or near the base of Exshaw Shale associated with high Corg content (Figure 2). The maximum δ15N values ranged between 4.5‰ and 7.2‰, corresponding with lower Corg near the top of the cored intervals. In the Peace River Embayment at Loc. 4, the δ15N minimum of 1.5‰ was at the base of the Exshaw Shale, and the average was 2.8 ± 0.6‰ for the Shale and 4.0 ± 0.9‰ for the Exshaw Siltstone. The overlying Banff Fm. had an average δ15N value of 4.9 ± 0.2‰. A previous investigation by Caplan and Bustin (1998) at a site close to Loc. 2 reported δ15N with a stratigraphic trend similar to that at Loc. 4, with a minimum of 0.5‰ at the base of Exshaw and increasing upward to a maximum of 5.1‰. At Loc. 3, there was a gradual increase in δ15N from 2.9‰ at the Exshaw base to a maximum of 4.2‰ in the siltstone unit. The average δ15N value was 3.2 ± 0.6‰ for Exshaw Shale and 3.7 ± 0.2‰ for Siltstone.
The two Madison Shelf locations recorded 3–4‰ negative δ15N excursions across the Big Valley/Exshaw Boundary and positive excursions of similar magnitude at the top of the Exshaw Shale (Figures 2C,D). Loc. 9 had a minimum δ15N value of 1.6‰ near the base of the Exshaw Fm., an up-core increase to 3.0‰ near the Exshaw top, and a maximum of 5.9‰ at the bottom of Banff Fm. The average δ15N for the Exshaw Shale was 2.4 ± 0.7‰. There was a positive trend in δ15N values up-core at Loc. 11 from 1.9 ± 0.3‰ in the Exshaw Shale to 7.0 ± 0.3‰ in the Banff Fm.
Locations 21 and 22 also had positive up-core trends in δ15N (Figures 2E,F), recording a ∼2‰ negative excursion at the Exshaw base, with a minimum of 2.1 and 2.2‰, respectively. Loc. 21 had an average δ15N of 3.7 ± 1.1‰ for the Lower Shale and 4.5 ± 0.8‰ for the Upper Shale. At Loc. 22, average δ15N values increased from 4.6 ± 0.3‰ for the Lower Shale to 6.2‰ for one sample in the Banff Fm.
3.3 Carbon and nitrogen at the base of the Exshaw
Sediments from the base of the Exshaw Shale had an average Corg concentration of 7.9% ± 5.9% across 20 locations. There was significant variability among sites, with the greatest Corg content at Loc. 2 (19.9%) in the Peace River Embayment, Loc. 5 (18.6%) on the northern edge of the Rundle Shelf, and Loc. 17 (18.4%) on the Madison Shelf (Figure 3). Low Corg content was found at Loc. 6 (0.7%) on the Rundle Shelf and Locs. 15 (0.3%), 16 (0.2%), and 18 (2.0%) on the southwestern edge of the Madison Shelf adjacent to the Prophet Trough. The δ13Corg values ranged between −29.5 and −26.8‰ across the basin, with low Corg locations having relatively 13C-enriched (−27.8 ± 0.7‰) OM compared with the moderate (−28.9 ± 0.4‰) and high (−28.6 ± 0.6‰) Corg locations (Figure 4). The δ15N values at the base of the Exshaw Shale ranged from 0.0 to 6.3‰ and were inversely correlated with Corg content (Figures 3, 4). Locations with low Corg content were most 15N-enriched (δ15N = 6.0 ± 0.5‰) compared with locations with moderate (2.4 ± 1.1‰) and high (0.5 ± 0.1‰) Corg content.
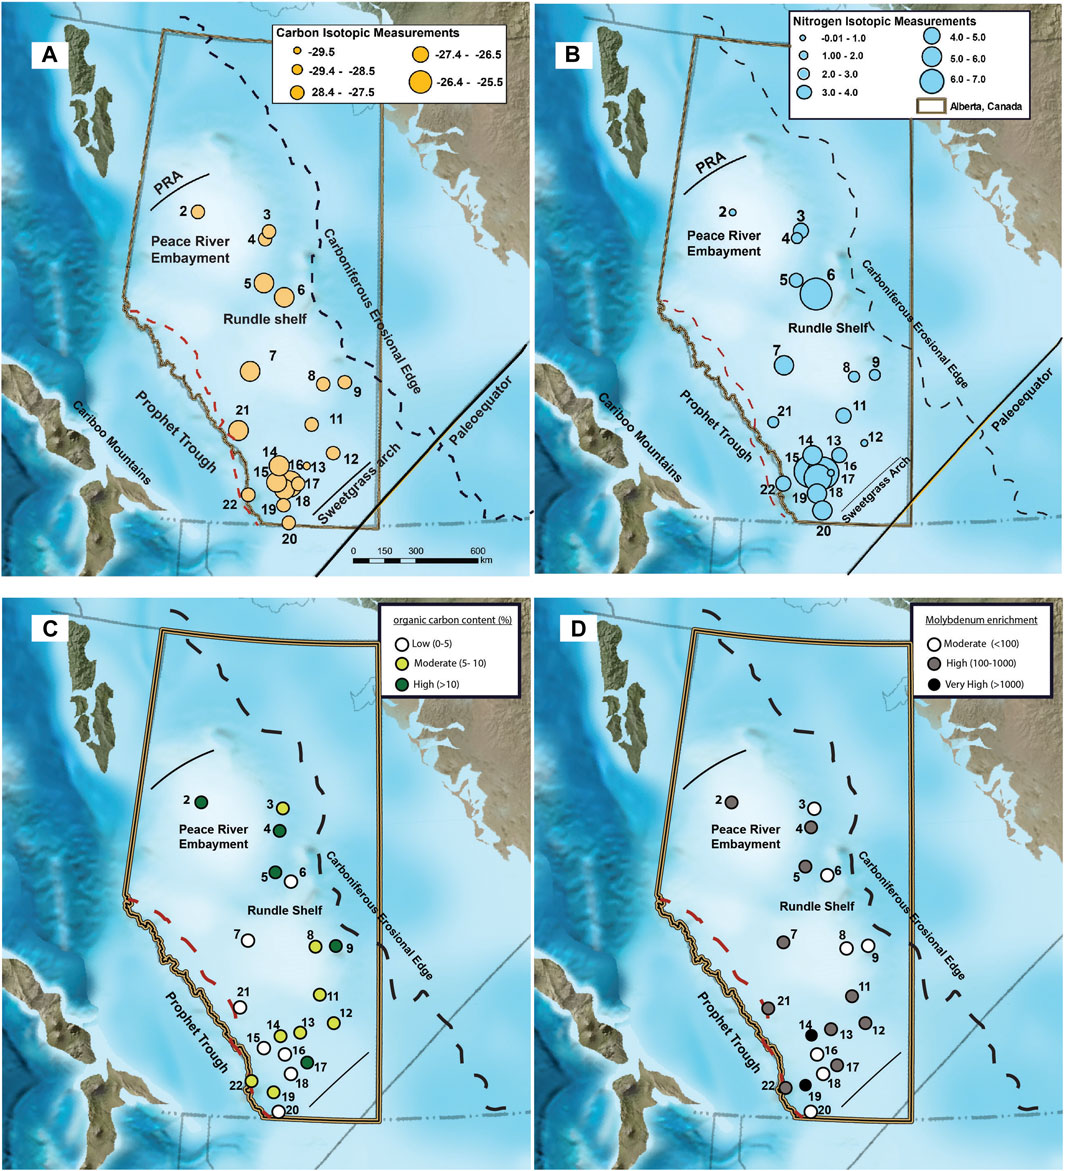
Figure 3. Spatial distribution of (A) δ13Corg, (B) δ15N, (C) Corg (%), and (D) Mo enrichment at the Exshaw base across the Western Canada Sedimentary Basin [Modified from Blakey (2008)].
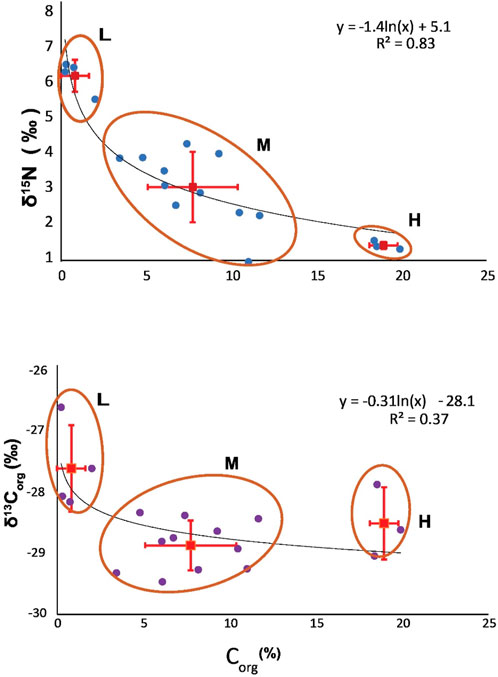
Figure 4. Three groups of locations with high (H: 19.0% ± 0.8%), moderate (M: 7.7% ± 2.6%), and low (L: 0.8% ± 0.8%) Corg at the base of the Exshaw and an inverse relationship between Corg content and δ15Nbulk. A natural logarithmic curve to the δ15N vs. Corg data (R2 = 0.83) indicates Rayleigh fractionation of N isotopes between the highly productive regions and nutrient-limited distal locations. Error bars indicate standard deviation (1σ) from the mean values of Corg, δ15N, and δ13C.
3.4 Trace element enrichment at the base of the Exshaw
The Exshaw Shale member has consistently higher concentrations of redox-sensitive TEs relative to the underlying and overlying strata (Supplementary Figure S1; Frucci, 2021). Trace elements are relatively immobile irrespective of the level of catagenesis (Ross and Bustin, 2008), so spatial trends in their enrichments reflect geographic variability in redox conditions during deposition and early burial (Pi et al., 2014; Algeo and Liu, 2020). We focused our analysis on samples from the base of the Exshaw Shale to compare spatial patterns in redox conditions with C and N stable isotope distributions during a single time interval when transgression created sediment accommodation space throughout the depositional basin (Figure 3). We found greater than two orders of magnitude difference in EFs across the basin (Table 1). The ratios of Mo, U, and Ni to Al for all sampled locations were greater than those of the reference PAAS, with maximum EFs of 3.0 × 10³ for Mo, 4.5 × 10² for U, and 1.3 × 10³ for Ni at Loc. 14 and similarly high EFs at Loc. 19 (Figure 3; Table 1). The ZnEF and CoEF were also elevated at Locs. 14 and 19, but at many locations ZnEF and CoEF was <1.0 indicating content similar to and below that of PAAS (Table 1). The VEF was >1.0 at all locations except one, and it was greatest at Locs. 14 and 17. The CrEF ranged only between 0.52 and 3.14, and the Cr concentration was below the level of detection at Locs. 13, 14, 16, 18, and 19 in the south of the WCSB.

Table 1. Trace metal EFs for samples from the base of Exshaw Fm. for 20 locations across WCSB.
There is a general pattern of covariance among the TEs at the base of the Exshaw Shale as shown by the positive Spearman rank order correlation coefficients (r; Figure 5). Elevated MoEF and UEF in black shales are commonly used to infer bottom water anoxia (Algeo and Li, 2020), and are strongly correlated at the base of the Exshaw Shale (r = 0.84, p < 0.001). Strong correlation with MoEF was also observed for NiEF, ZnEF, and VEF (Figure 5; Supplementary Figure S2), all with p < 0.001). The CrEF was weakly correlated with MoEF (r = 0.57, p = 0.033), and CoEF was not significantly correlated with MoEF (p > 0.05). Devonian-Carboniferous black shales deposited in other North American basins are also highly enriched in Mo and U, with molar ratios of Mo to U ranging from 0.4 to 2 times the seawater molar ratios (Algeo and Tribovillard, 2009), and variable sedimentation rate and dilution by detrital minerals can explain variable enrichment of TEs deposited at that time (Algeo and Liu, 2020). The thickness of the Exshaw Shale interval in the WCSB, however, was not significantly correlated with any TE enrichment factors (Figure 5). Considering shale member thickness as a proxy for sedimentation rate, with a greater rate inferred for thicker intervals, the spatial variation in the degree of enrichment likely reflects differences in ocean redox conditions or circulation patterns across the basin. Paleogeographic reconstructions indicate that shallower regions on the eastern boundary of the Peace River Embayment, the eastern Rundle Shelf, and the southwestern Madison Shelf generally experienced lower TE enrichment (Figure 3D). Locations with greater enrichment of TEs, especially V and Mo (Figure 5), typically corresponded to greater Corg content (Figures 3C,D), though the relationship was relatively weak suggesting other controls such as primary productivity were more influential on Corg.
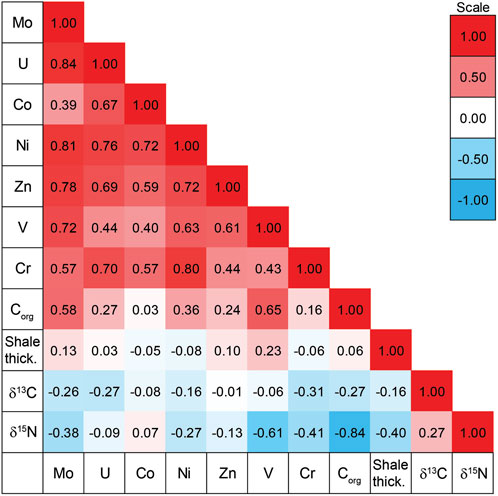
Figure 5. Spearman rank order correlation coefficients for trace element enrichment factors, organic carbon content (%), Exshaw Shale thickness (m), δ13Corg (‰) and δ15Ntot (‰).
4 Discussion
4.1 Geographic variability in biogeochemical cycling processes in the WCSB
The onset of Exshaw Shale deposition was tied to the first of three transgressive events recorded in the Famennian-Tournaisian Banff assemblage (Smith and Bustin, 2000), which spans the D-C boundary in the WCSB (Macqueen and Sandberg, 1970). Crustal deformation associated with the Antler Orogeny, active during the Late Devonian and Carboniferous, produced the relatively complex seafloor bathymetry of the WCSB (Jewell, 1994; Robison, 1995). The intense tectonic activity affected the entire western extent of the North American craton, and in the WCSB it caused deepening of the Prophet Trough and parts of the cratonic platform and shelf margin (Poole, 1973; Savoy, 1990; Barclay et al., 1994; Smith et al., 1995). Crustal extension and vertical fault block movement also resulted in deepening of the Peace River Embayment (Caplan and Bustin, 2001; O'Connell et al., 1990). Thicker deposits of the Exshaw Shale accumulated on descending blocks as deeper locations had greater depositional accommodation (Smith et al., 1995; Smith and Bustin, 2000; Zaitlin, 2011; Visy, 2022). The difference in shale thickness and therefore sediment accumulation rate, for example, at Loc. 9 compared with Loc. 11, did not result in a dilution effect on geochemical characteristics (Figures 2, 5).
The complex bathymetry of the WCSB, which extended from the paleo-equator to ca. 10° N, likely affected the location of bottom water currents and regions of upwelling (Caplan and Bustin, 1998). On modern tropical western continental margins, interactions among wind stress, Ekman transport, and basin geometry can produce focused regions of surface water divergence and upwelling (Brandt et al., 2023). The WCSB likely included regions within the Peace River Embayment where upwelling was favored. As a modern geographical analog to the WCSB, the tropical seas between Indonesia and Australia have similar complex bathymetry. A study of the Arafura Sea modeled subsurface currents and related the complex bathymetry with the upwelling of nutrient-rich water near the shelf break, where there is elevated primary productivity (Kämpf, 2016). Subsequently, the newly upwelled waters become relatively nutrient-depleted, and these residual waters advect via surface currents to less productive regions.
Similar effects of bathymetry, currents, and upwelling on primary productivity can explain the spatial variability in Corg content of the Exshaw Shale. Greater Corg content is associated with eutrophic locations, and relatively oligotrophic (or less eutrophic) locations have lower Corg content (O’Connell et al., 1990; Richards, 1989). Based on Rock-Eval pyrolysis hydrogen index (Supplementary Table S1), OM in the Exshaw Fm. at all locations throughout the WCSB was principally derived from marine organisms. Short chain alkanes basin-wide also indicate the dominance of marine-derived OM (Frucci, 2021). The greater Corg content at the base of the Exshaw Fm. reflects increased primary productivity and export production coinciding with the transgressive stratal succession at the onset of black shale deposition (Caplan and Bustin, 2001; Visy, 2022). The broad distribution of marine sourced OM agrees with the previous analysis of biomarkers in oils derived from the Exshaw Fm. (Allan and Creaney, 1991). Further, accumulation of Corg-rich sediments in the Peace River Embayment has been previously connected to enhanced marine productivity in an upwelling zone (Caplan and Bustin, 1998; 2001). Previous geochemical analyses, however, focused on locations where the Exshaw Shale was most Corg rich, and our results expand this finding to show that sedimentary OM at all locations including those with relatively low Corg content has a marine origin.
The extent of bottom water anoxia during the deposition of Exshaw Shale at each location was assessed based on sedimentary facies classification and relative concentrations of trace elements. Trace fossil burrows in the Exshaw shale at Locs. 5, 15, 16, and 18 indicate greater oxygen exposure at the sediment surface during or soon after deposition on the Rundle Shelf adjacent to the Peace River Embayment and on the Madison Shelf adjacent to Prophet Trough (Visy, 2022). These locations also have elevated oxygen index values consistent with organic matter oxidation during early burial (Supplementary Table S1). Burrowing is interpreted to occur in shallower water environments where oxygenated conditions occur more frequently throughout the water column (Barclay et al., 1994; Richards et al., 1994; Smith et al., 1995; Smith and Bustin, 2000; Aretz and Corradini, 2021). Similarly, the TE enrichment factors were lowest at Locs. 3, 6, 8, 9, 16, 18, and 20, also indicating bottom waters in regions with burrows were more frequently oxygenated (Figures 3D, 5). While the entire basin was relatively shallow, the occurrence of subsidence by extensional faulting formed bathymetric lows that experienced more persistent stratification, thus those regions behaved as silled basins and were less prone to mixing between surface and bottom waters, similar to the modern Cariaco Basin (Thunell et al., 2004). Redox sensitive TE enrichment factors indicate that the deeper waters of the Peace River Embayment and Prophet Trough experienced oxygen depletion, whereas the paleobathymetric highs of the Rundle and Madison Shelf were comparatively oxygenated (Figure 5).
4.2 Nutrient cycle
The nitrogen isotopic composition of marine sediments depends on the isotopic composition of phytoplankton and microbial transformations during transport to the ocean floor. Sinking particles are 15N-enriched by ca. 0.15‰/200 m, so the N isotopic composition of sediments in shallow basins with anoxic bottom water broadly reflects average phytoplankton (Uveges et al., 2019). The inverse relationship between δ15N and Corg at the base of the Exshaw Shale is intriguing (Figure 4), and the natural logarithmic fit (R2 = 0.83) suggests the possible influence of Rayleigh fractionation of N isotopes during phytoplankton uptake (Okhouchi and Takano, 2014). The data can be explained by advection of surface waters from upwelling locations with high nutrient concentration, productivity, and OM accumulation to locations with low nutrient concentration, productivity, and OM accumulation. Thus, the low δ15N values associated with higher sedimentary Corg would result from isotopic fractionation during incomplete assimilation of upwelled nutrients, leaving the residual nutrient pool 15N-enriched. The higher δ15N values associated with lower sedimentary Corg would derive from phytoplankton growth on the advected residual nutrient pool. The 15N enrichment of the residual nutrient pool might also be affected by dissimilatory nitrification/denitrification and anammox, with the cumulative effect of assimilatory and dissimilatory processes contributing to the shape of the Rayleigh fractionation curve (Waser et al., 1998; Sigman et al., 2001; Altabet, 2005).
Collectively, phytoplankton populations preferentially draw on available NH4+ or NO3 pools before N2 fixation becomes widespread (Howarth et al., 1988). During oceanic anoxic events (OAEs), the global “Nitrostat” augments bioavailable N with increased N2 fixation to replace N lost from the system due to increased denitrification and anammox (Kuypers et al., 2004). The concentrations of NH4+, NO3−, and NO2− (used as an electron acceptor in the anammox process) vary in the marine water column, depending on circulation, uptake by phytoplankton, ammonification during OM decomposition, and redox controls on microbial transformations (Sigman et al., 2001; Ohkouchi and Takano, 2014). In redox-stratified waters, nitrification, denitrification, and anammox are associated with the interface between reducing and oxidizing conditions and collectively diminish the nutrient-N pool. In deep waters below the photic zone, nutrient-N accumulates as NH4+ in anoxic waters and NO3− where O2 ventilation supports nitrification (Junium et al., 2018). The anoxic/suboxic conditions that predominated in the WCSB favored bottom-water NH4+, which would constitute an internal N source that could support primary productivity when upwelled to the photic zone (Domingues et al., 2011; Peng, 2015; Naafs et al., 2019; Du et al., 2023).
In modern anoxic basins, the isotopic composition of bottom water NH4+ is similar to that of surface sediments. In the Cariaco Basin, deep NH4+ (δ15N = 4.6‰) is 15N enriched by 1.2‰ compared with surface sediments (δ15N = 3.4‰; Thunell et al., 2004). In the Black Sea, deep NH4+ (δ15N = 1.7 ± 0.2‰; Velinsky et al., 1991) is 15N depleted by ∼1.2‰ compared with surface sediments (δ15N = 2.9 ± 0.6‰; Fulton et al., 2012). Smaller stratified basins like Framvaren Fjord (δ15N = 1.7‰ for deep NH4+ and 2.2‰ for surface sediments; Velinsky and Fogel, 1999) and Fayetteville Green Lake (δ15N = 1.7‰ for deep NH4+ and 3.2‰ for surface sediments; Fulton et al., 2018) have similar relationships. The average isotopic difference (δ15NNH4+ - δ15Nsed) for these four representative stratified anoxic basins is −0.5 ± 1.2‰, and we apply this value in the calculation of δ15N of deep NH4+ for the WCSB during the onset of Exshaw Shale deposition. For 20 locations, the average δ15N value for the base of the Exshaw Shale was 1.7‰ (weighted by Corg content). Therefore, the calculated average deep water δ15NNH4+ value was 1.2 ± 1.2‰.
Unlike nutrient-N that can be fixed in situ from dissolved N2, new phosphorus is mainly delivered to the ocean via continental weathering (Arthur and Sageman, 1994; Algeo and Scheckler, 2010). Sinking particulate matter transfers P along with N to deep waters and sediments. In the presence of O2, N:P is typically close to the Redfield Ratio (16:1) for both particulate and dissolved components (Redfield, 1958; Falkowski et al., 1998; Tyrrell, 1999). In changing redox conditions, dissolved PO43- concentration is regulated by adsorption and desorption from mineral phases (Furumai et al., 1989; Van Cappellen and Ingall, 1996; Ingalls et al., 2022). Under anoxic bottom waters, sedimentary P burial efficiency is reduced, leading to increased PO43- concentration and decreased nutrient N:P, as has been observed in the Black Sea (Brewer and Murray, 1973; Fulton et al., 2012). Denitrification and anammox further contribute to lower N:P nutrient ratios. In such systems, upwelling of water with low N:P to the photic zone supports cyanobacterial N2 fixation after nutrient-N has been exhausted.
For OAEs, modeled elevated PO43- concentrations and enhanced denitrification contribute to elevated N2 fixation. With a 2-fold increase in PO43−concentration associated with OAE 2, the modeled global contribution to export includes 55% N2 fixation, 35% NO3− assimilation, and 10% NH4+ assimilation (Naafs et al., 2019). Regions of high primary productivity were focused in upwelling zones where NH4+ assimilation dominated, whereas N2 fixation was prominent in locations receiving a low supply of bioavailable N. Martinez et al. (2019) reported 15N-enrichment throughout the Cleveland Shale interval in the Appalachian Basin for the D-C boundary, which they associated with increased denitrification rates during a transgressive event. Other D-C boundary sections reported negative δ15N excursions interpreted as indicative of increased N2 fixation (Caplan and Bustin, 1998; Liu et al., 2016), following the common interpretation for similar 15N-depleted black shales in Cretaceous marine sediments (Kuypers et al., 2004; Ohkouchi et al., 2006; Junium and Arthur, 2007; Monteiro et al., 2012; Fujisaki et al., 2016; Ruebsam and Schwark, 2023).We propose spatial variability in nutrient availability within the WCSB could drive the observed differences in the N isotopic composition of Exshaw Shale sediments (Figure 3). Similar variability in N cycling has also been proposed for the D-C boundary associated with complex paleogeography and location-specific differences in the extent of denitrification across a shallow marine basin in South China (Liu et al., 2016). We consider the role of surface water advection as the primary driver of divergent sedimentary δ15N values.
4.3 Nutrient advection model
The variability of δ15N within the WCSB (Figure 3), and its inverse relationship with Corg (Figure 4) may be most directly related to isotopic fractionation during incomplete assimilation of upwelled nutrients and subsequent surface water advection. This differs from the common interpretation that isotopic fractionation during denitrification and N2 fixation is the direct cause of higher and lower δ15N values, respectively. Kinetic isotopic fractionation is quantified by the isotope enrichment factor, denoted by epsilon (ε). For N, 15ε reflects the ratio of the reaction rate constants (k) of light (14N) and heavy (15N) isotopes.
This calculation yields a positive 15ε value for a normal kinetic isotope effect with 14N reacting faster than 15N. Isotopic fractionation between nutrient-N and biomass depends on the N source, which is affected by redox conditions. The 15ε for NH4+ assimilation can vary widely from 4 to 27‰ depending on its concentration. In NH4+ replete conditions as would be expected for OAEs, partial uptake with 15ε ≥ 20‰ can produce phytoplankton biomass with exceptionally low δ15N, leaving behind an exceptionally 15N-enriched NH4+ pool (Waser et al., 1998; Higgins et al., 2012). The 15ε value for NO3− assimilation in modern sea surface water is ∼5‰ (Sigman et al., 1999).
The isotopic composition of phytoplankton biomass can be calculated by applying the Rayleigh equation for isotopic fractionation:
where δorg is the δ15N value for biomass N, δinit is the δ15N value for the nutrient source, 15ε is the isotope enrichment factor, and f is the fraction of unutilized nutrient-N in the system after assimilation, i.e., the ratio of NH4+/NH4+-initial, and NO3-/NO3--initial. For high Corg (δ15N = 6.0‰), moderate Corg (δ15N = 2.4‰), and low Corg (δ15N = 0.5‰) locations (Figure 4), we assessed the range of potential δinit values as a function of residual nutrient-N (0 ≤ f ≤ 1) for 15ε = 20‰ (a relatively conservative value for NH4+ assimilation, Figure 6A) and 15ε = 5‰ (NO3− assimilation; Figure 6D).
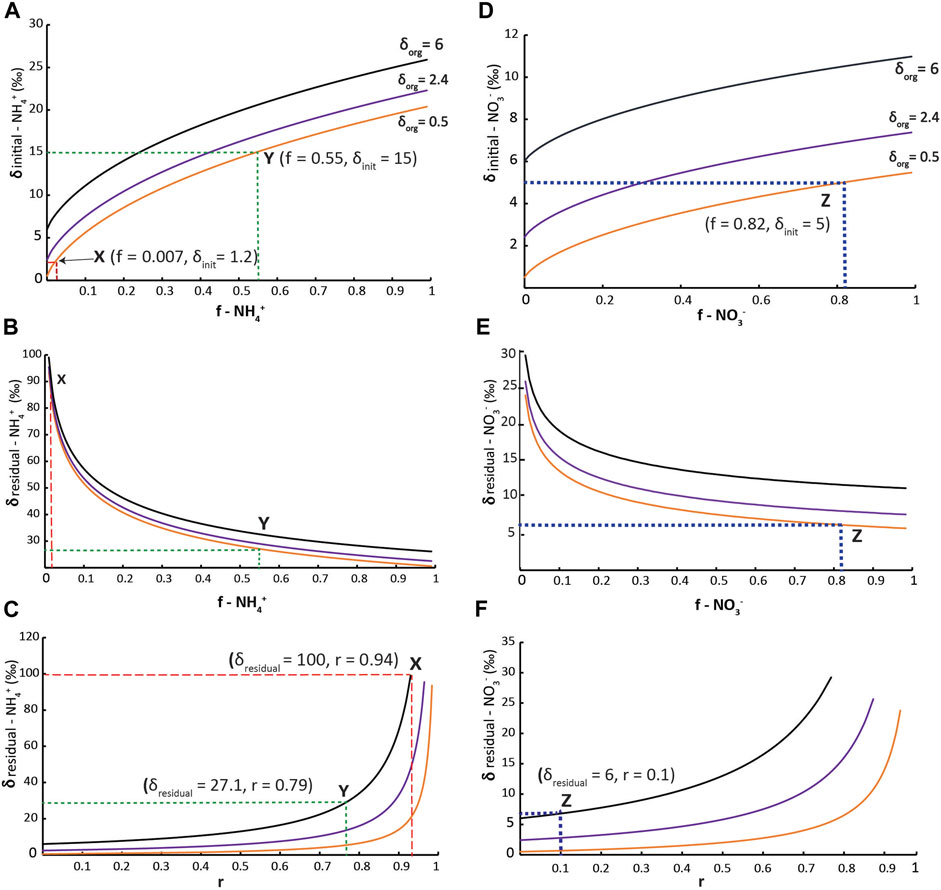
Figure 6. Upwelling and advection model. Panels (A,D) show the relationships between δorg, δinit, and f from Eq. 2 for 15ε = 20‰ (A) and 15ε = 5‰ (D). Panels (B,E) show the distribution of δresid values for δorg and f values from (A,D), respectively, calculated by Eq. 3. Panels (C,F) show the ratios (r) of N2 fixation to total N assimilation required to yield δorg = 6.0, 2.4, and 0.5‰ for the δresid values in (B,E), respectively. (A–C) (1) Point X shows ammonium replete conditions, upwelling and almost complete consumption resulting in very high residual isotope values. Point Y has a lower isotopic fractionation due to relatively higher δ15Ninit values, followed by advection of residual nutrient pool to N limited regions. N2 fixation brings the very heavy residual ammonium to ambient values. (D–F) Point Z shows nitrate assimilation and advection of the residual nutrient pool.
Using Eq. 2 and isotope mass balance, δ15N of the residual nutrient pool (δresid) as a function of δinit, δorg, and f is determined as follows:
The δresid values increase dramatically with greater assimilation of the initial nutrient pool, resulting in δ15N values much greater than any observed in the Exshaw sediments (Figures 6B,E). Assuming that the residual nutrient pool was advected away from the upwelling source and supported phytoplankton growth in less productive locations, the residual nutrient-N concentrations would decrease and the δ15N would increase even more. However, if the initial upwelled nutrient pool had an N:P ratio lower than the Redfield ratio as expected for anoxic bottom waters, and PO43- was advected in the surface waters along with nutrient-N, then the nutrient N:P ratio of advected waters would become progressively lower (assuming uptake close to the Redfield ratio). Thus, the advected water mass would have excess P that could ultimately support N2 fixation distant from the initial upwelling region. Given the maximum δ15N value near 6.0‰ for the base of the Exshaw Fm., cyanobacterial N2 fixation in locations distal to upwelling would be required to lower the very high phytoplankton δ15N values predicted for assimilation of advected nutrient-N (δresid).
The ratio of N2 fixation to total N assimilation (r) can be defined as:
where 0 ≤ r ≤ 1 and δfix = −1‰ for N2 fixation. (Modified from Eqs 2 and 3; Ohkouchi and Takano, 2014). The range of values for r required to produce observed δorg values for the Exshaw Fm. are shown in Figures 6C,F.
We consider three example scenarios to evaluate nutrient utilization based on the advection model for the WCSB (Figure 7). All three scenarios feature deep NH4+ as the primary N-nutrient source in the WCSB and allow for N2 fixation after NH4+ has been consumed.
1. Deep-water with δ15N-NH4+ = 1.2‰ is upwelled or mixed directly to the surface, where it is assimilated by phytoplankton. Residual NH4+ is advected away from the region of focused upwelling to less productive locations (Figure 7A).
2. Near the chemocline, NH4+ diffuses or slowly upwells from deep waters and is partially oxidized by anammox or nitrification/denitrification to N2, leaving behind a 15N-enriched NH4+ pool that supports phytoplankton growth above or at the top of the chemocline (Figure 7B).
3. Above the chemocline, upwelled NH4+ is nitrified, resulting in a NO3− pool with a δ15N value that is lower than that of NH4+ at the chemocline, but more 15N-enriched than deep-water NH4+ (Figure 7C).
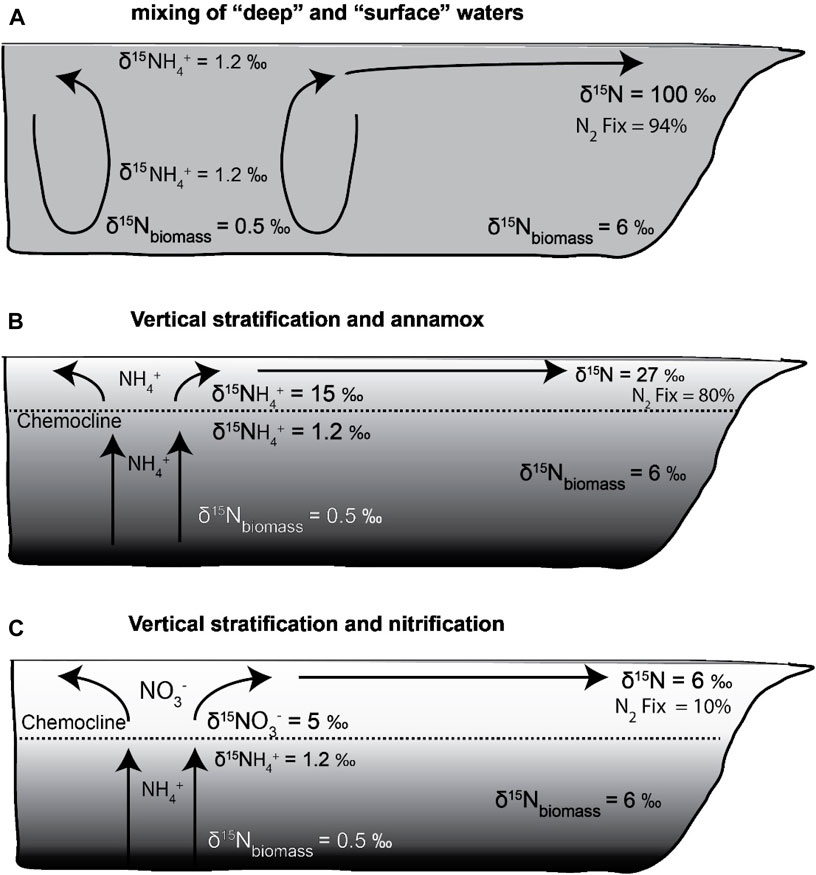
Figure 7. (A) Scenario 1: Low δ15N- NH4+ rich deep waters were upwelled and mixed with surface waters. They are almost completely assimilated by phytoplankton, followed by advection of residual high δ15N-NH4+ away from the region of upwelling. Distal locations experienced very high N2 fixation to maintain productivity. (B) Scenario 2: Diffusion or gradual upwelling of NH4+ resulted in partial oxidation to N2, leaving behind a 15N-enriched NH4+ pool that supported phytoplankton growth near the chemocline. (C): Scenario 3: Above the chemocline, upwelled NH4+ gets nitrified, resulting in a NO3− pool with a δ15N value that is lower than that of NH4+ at the chemocline, but more 15N-enriched than deep-water NH4+. Low N2 fixation in distal areas as most of nutrient-N gets advected.
With the three scenarios, we estimated the initial δ15N values of nutrient-N that would support the production of biomass. We considered three characteristic locations in the WCSB with high (19.0% ± 0.8%), moderate (7.7% ± 2.6%), and low (0.8% ± 0.8%) Corg and average δ15N values of 0.5‰, 2.4‰, and 6.0‰, respectively, based on Figure 4. Using the advection model parameters, our goal was to determine which scenario fits best with our observed δ15N and Corg data and calculate a range of expected values for proportion of N fixation: assimilation (r). The lowest δ15N values corresponded to productive upwelling locations with minimal N2 fixation.
Scenario 1: Using the weighted average δ15Nsed value of 1.7‰, the calculated δ15N of deep water NH4+ in the WCSB is 1.2‰. In this scenario deep-water NH4+ is upwelled to the surface with minimal isotopic fractionation and supplied a nutrient-N source to phytoplankton with a low initial δ15N value (Figure 7A). This scenario is analogous to the whole water-column mixing model of Uveges and Pearson (2023), which shows that low sedimentary δ15N values are a result of periodic overturning of a stratified water column in an anoxic ocean. Assuming a high concentration of upwelled NH4+ was partially utilized, the resulting 15ε would be high. The most productive locations with highest Corg would require f < 0.01 to produce δorg = 0.5‰ with δ15Ninit = 1.2‰ and 15ε = 20‰ (Point X in Figure 6A), implying near complete consumption of NH4+ at the site of upwelling. Thus, the advected residual NH4+ pool would be very small and 15N-enriched (Point X in Figure 6B). To produce a maximum δ15Nsed value of 6.0‰, phytoplankton production would require 94% of N to be derived from N2 fixation (Point X in Figure 6C).
Scenario 2: In a strongly stratified basin that inhibits deep mixing, NH4+ diffuses to the chemocline and is utilized by annamox and nitrifying/denitrifying bacteria (Konovalov et al., 2008; Romaniello and Derry, 2010). This would increase the NH4+ δ15N value of the residual pool. With strong stratification, the concentration of NH4+ decreases upward through the chemocline, and NH4+ δ15N values can range up 10–20‰ at and above the chemocline (Fulton et al., 2018). In scenario 2, we assume a δ15N value of 15‰ for NH4+ that is assimilated by phytoplankton at the top of the chemocline (Figure 7B). At the most productive locations with the highest Corg, this would require f = 0.55 to produce δorg = 0.5‰ with 15ε = 20‰ (Point Y in Figure 6A). The δ15N value of the residual NH4+ pool would be predicted to be 27.1‰ (Point Y in Figure 6B). Using Eq. 4, complete assimilation of the residual NH4+ along with additional 79% N2 fixation would account for δresid = 27.1‰ and δorg = 6‰ (Point Y in Figure 6C). This means that the advected NH4+ residual pool would provide 21% of the N requirement in the most oligotrophic locations, and 79% N2 fixation could make up for the N-deficit.
Scenario 3: During upward mixing of chemocline water, NH4+ might be nitrified and partially denitrified as it is mixed into oxygenated surface waters, thereby producing a NO3− pool with relatively high δ15N (Figure 7C). We apply a value of 5‰, which is similar to observed surface water NO3− δ15N values in modern oxygen-limited basins (Brandes et al., 1998; Voss et al., 2001). In the WCSB, with δinit = 5‰, the most productive locations with highest Corg would require f = 0.18 (Point Z in Figure 6D), i.e., 82% of the initial NO3− would be transported away from the upwelling/mixing region by advection. Consequently, the advected nutrients could support greater primary productivity, as most of the NO3− (82%) would be laterally advected. This could explain progressively higher phytoplankton δ15N values away from the source region, but not decreasing Corg. This scenario does not permit the introduction of significant N2 fixation with r = 0.10 (Point Z in Figure 6F); thus, there is not a mechanism to replace nutrient-N lost to denitrification/anammox near the chemocline.
The advection model investigates the spatial variability of nitrogen isotopic distributions in the WCSB, assuming NH4+ and NO3− as potential sources of bioavailable nitrogen in upwelling and stratified systems to account for a range of mixing scenarios. A component of N2 fixation is present in all scenarios, but its extent varies with δ15N initial and uptake ε values. Scenarios 1 and 2 represent the two end members of NH4+ utilization by phytoplankton. The former depicts a scenario of mixing of surface and deep waters due to a “chemocline collapse” and therefore upwelled NH4+ is isotopically light, whereas the latter demonstrates a situation of vertical stratification that results in a15N-enriched NH4+pool being consumed by phytoplankton (Figures 7A,B). During stable periods, NH4+ accumulates under the chemocline. When this stratification breaks down, the NH4+gets released rapidly into the upper water layers. The third scenario holds true for modern OMZs, where the dissolved nitrogen pool is predominantly NO3 formed by nitrification of NH4+ as it reaches the surface (Figure 7C). Models predicting nutrient utilization during OAEs record effects of both NH4+ and NO3− assimilation at different stages of redox stratification, contributing towards the final δ15N of exported biomass (Naafs et al., 2019; Uveges and Pearson, 2023). In the WCSB, an upwelling zone within the Peace River Embayment supported assimilation of a15N depleted nutrient pool (NH4+). Portions of the Prophet Trough region and locations adjacent to the Sweetgrass Arch also have evidence for upwelled NH4+. Across the interior parts of the epicontinental basin, on the Rundle and Madison Shelf, higher sediment δ15N values with low to moderate primary productivity suggest that N2 fixation provided a greater portion of bioavailable nitrogen to sustain productivity. Without the influence of N fixation, the δ15N values would be even higher in the low-productivity continental shelf regions.
At the six locations with stratigraphic profiles representing shallow shelf and deeper Prophet Trough and Peace River Embayment provinces, there was a general relationship between δ15N values and Corg content (Figure 2). Low δ15N values are recorded in association with Corg maxima at the base of the Exshaw and gradually increase across the lower shale and upper siltstone deposits. An overall positive shift of 4–6‰ in δ15N is observed from the base of the Lower Shale to the contact between the upper siltstone and Banff Fm., possibly due to a redox switch from basin-wide anoxia during the onset of Exshaw deposition, to more oxygenated environments towards the upper Exshaw and Banff interval (Savoy, 1992). The End-Devonian OAE primarily sustained suboxic to anoxic conditions, based on TE data, and was probably more oxygenated relative to other major OAEs in the Phanerozoic. The decreasing TE enrichment up-core above the Exshaw Shale (Supplementary Figure S1) confirms more frequent oxygenation of bottom waters. Nitrogen isotope values, however, are primarily influenced by primary production, rather than by redox conditions as suggested by the strong correlation between δ15N and Corg and weak correlation with redox-sensitive trace elements from the base of the Exshaw Shale (Figure 5). This suggests that preservation or post-depositional bottom-water redox conditions have relatively little impact on nitrogen isotope signals.
4.4 Carbon cycle
The range of δ13Corg values at the base of the Exshaw Fm. (−26.8 to −29.5‰; Figure 4). indicates that the isotopic composition of OM was influenced by local factors in addition to the global atmospheric signature. A similar range of values was distributed stratigraphically through the Exshaw Fm., and δ13Corg was not correlated strongly with Corg either spatially or stratigraphically (Figures 2, 5). This range of values for the D-C boundary interval has been reported globally, including in the English River Formation in southeastern Iowa (Heath et al., 2021); the Kronhofgraben section in the Carnic Alps and Rhenish Massif in Germany (Kaiser et al., 2006; Agnieszka et al., 2020; Hartenfels et al., 2022); the Holy Cross mountains in Poland (Marynowski and Filipiak, 2007; Malec, 2013; Matyja et al., 2021), and the Cat Ba Island in Vietnam (Komatsu et al., 2014; Paschall et al., 2019; Shizuya et al., 2020). At the initiation of the black shale deposition, a shift towards lower δ13Corg values was observed in many D-C successions, including in the WCSB. Heath et al. (2021) reported an abrupt negative Corg isotope excursion at the onset of shale deposition, and a coincident increase in Corg content from the Burlington Shelf in southeastern Iowa. This is consistent with our sections at Loc. 9 and 11 on the Madison Shelf but not the deeper water locations in Prophet Trough, where δ13Corg decreased gradually in the shale, or in the Peace River Embayment, where there was no C isotope excursion in the shale unit (Figure 2).
Broadly, δ13Corg signals are a function of the isotopic composition of dissolved inorganic carbon (DIC), biological productivity, and growth temperatures. Local variations in the concentration and δ13C of the source DIC are especially influential, as δ13Corg values are sensitive to changes in the partitioning of 13C and 12C between organic carbon and carbonate (Velinsky and Fogel, 1999; Uveges et al., 2019). Microbially respired DIC that is 13C-depeleted when upwelled in epicontinental margins and assimilated by primary producers can influence the isotopic composition of the exported OM, causing lower δ13Corg values of marine sediment (Paschall et al., 2019; Pisarzowska et al., 2020). A broad trend of increasing carbonate δ13C values across the D-C boundary has also been recognized in association with the Hangenberg event (Brand et al., 2004; Kaiser et al., 2006; Myrow et al., 2013; Kumpan et al., 2015; Martinez et al., 2019; Heath et al., 2021). It has been interpreted as a global signal resulting from increased burial of 13C-depleted Corg and concomitant 13C enrichment of residual CO2 in the atmosphere and DIC in the ocean (Buggisch and Joachimski, 2006; Bojar et al., 2013; Qie et al., 2016; Heath et al., 2021).
Lithologic variability within the Exshaw-Banff succession records variability in sea level during the D-C transition. An initial episode of transgression coincided with deposition of the Corg-rich Lower Shale of the Exshaw and a subsequent sea level fall and deposition of the upper siltstone (Macqueen and Sandberg, 1970). The siltstone unit was in turn followed by a second episode of transgression, and deposition of the calcareous Banff Shale. (Savoy, 1992; Robison, 1995; Figure 3, Supplementary Figure S4). This lithological sequence can potentially affect the occurrence of C isotope excursions associated with the Hangenberg event and/or the D-C boundary. In the WCSB, the D-C boundary occurs within the Exshaw Fm. (Caplan and Bustin, 1998). However, given the complex bathymetry of the WCSB, eustatic sea level change, and active tectonism at the time of deposition, it might not be definitively in the same lithologic unit at all locations. For example, at Loc. 21 and 22, the positive C isotope excursion appears to coincide with the Lower Shale/Upper Shale transition (Figure 2). At Loc. 11, there is a similar excursion at the Exshaw shale/siltstone transition. At Loc. 4, 9, and 11 there is a δ13Corg increase at the Exshaw/Banff boundary (Figure 2). The Corg content in all six locations with stratigraphic profiles record a decreasing trend within the Exshaw to the Banff succession (Figure 2). Carbon isotope values are generally stable in the shale or Lower Shale intervals; however, a shift to higher values and a correlative decrease in Corg is observed across the Exshaw-Banff boundary (Figure 2). A paleoclimatic shift from a greenhouse to icehouse climate may have been responsible for the observed trend in δ13Corg across the Exshaw-Banff boundary, since perturbations in the global carbon cycle are primarily related to atmospheric CO2 levels (Becker et al., 2016a; Tuite et al., 2019; Zhang et al., 2021).
4.5 Relationship to modern coastal eutrophication
Nutrient cycling in past oceans might be analogous to the future, offering clues about how ocean ecosystems respond to shifts in nutrient availability. Environmental forcings that are currently causing coastal eutrophication and formation of oxygen minimum zones in modern oceans are mechanistically similar to forcings associated with some of the major marine biotic disruptions in the past (Paulmier and Ruiz-Pino, 2009; Zhou et al., 2016). The Devonian OAE was connected with the evolution of land plants and their extended root systems penetrating into the soil and amplifying the rates of continental weathering (Algeo and Scheckler, 2010). Consequently, there was an increase in the nutrient flux to the epicontinental seas, and globally widespread anoxia ensued. In modern oceans, warmer temperatures have intensified ocean stratification, which coupled with anthropogenic nutrient discharge in shallow seas has resulted in local stimulation of primary productivity and impinging coastal anoxia in many major continental margins and some restricted basins as well (De Pol-Holz et al., 2009; Domingues et al., 2011; Elfi Mollier-Vogel et al., 2012; Fulton et al., 2012; Brandt et al., 2023). Since continental margins are hotspots for marine biodiversity, prediction of nutrient circulation and transport pathways can help identify areas of the modern ocean that are particularly sensitive to nutrient imbalances. From this study we infer that high primary productivity is spatially tied to upwelling zones, with minimal local requirement for N2 fixation. As with modern upwelling zones, the primary producers were likely eukaryotic algae. The parts of the basin distant from upwelling were more oligotrophic and required a greater contribution of N2 fixation by cyanobacteria to balance the “nitrostat”.
Nitrogen isotope gradients in modern low oxygen environments like the western coasts of Peru and Ecuador suggest that advection patterns in nutrient utilization are characteristic of upwelling systems. The subsurface waters of the Eastern South Pacific coast host intensified OMZs due to high primary productivity and slow ventilation. As upwelling intensity varies spatially across the continental margin, it is reflected in sedimentary N isotope gradients that can be traced to different degrees of oxygen limitation (Elfi Mollier-Vogel et al., 2012). The Chilean margin also documents a strong latitudinal variability in sedimentary δ15N values, due to the lateral transport of 15N-enriched waters from an upwelling zone in the south of the OMZ towards higher latitudes (De Pol-Holz et al., 2009). The N-dynamics from modern upwelling zones confirm our interpretations of nutrient circulation across the D-C boundary in the WCSB. This phenomenon is not confined to the Devonian period alone, as anoxic oceans were prevalent throughout Earth’s history, and similar marine transgressive events have played a role consistently in facilitating the development of stratification and anoxia (Arthur and Sageman, 2004). Our interpretations of the influences of advection and upwelling on nitrogen isotopes in various depositional settings are not only applicable to past anoxic events but also enhance our understanding of nutrient circulation patterns in modern oxygen minimum zones. This knowledge is crucial for predicting how current and future changes in oceanographic conditions might impact marine ecosystems, particularly in regions susceptible to low oxygen levels. By integrating spatial variations in nitrogen fixation rates with nutrient transport and utilization models, we could potentially predict niche partitioning of eukaryotic algae versus cyanobacterial communities, allowing for a more comprehensive understanding of the interplay between nutrient availability and marine productivity patterns.
5 Conclusion
The Devonian-Carboniferous transition was a period of widespread deoxygenation in the oceans, associated with the Hangenberg mass extinction event that led to large-scale evolutionary transformations in the marine ecosystem. Temporal and spatial isotopic and Corg variability were observed in black shales deposited during the Hangenberg OAE in the Western Canada Sedimentary Basin.
The degree of anoxia varied across the WCSB between the deep embayment and shallower cratonic shelf, due to proximity to the upwelling zone. This resulted in local differences in nutrient-N availability and a disparity in the balance between NH4+ assimilation and N fixation rates. Spatial variability of bioavailable N across an anoxic shallow marine basin generated large differences in the distribution of primary productivity, which is evident from sedimentary δ15N records. A negative excursion in δ15N at the base of the Exshaw Fm. corresponding to a Corg maximum indicates high primary productivity was connected to decreased δ15N values. Up-core, increasing δ15N values were associated with lower productivity in surface waters. Carbon isotopic compositions, however, are relatively consistent at the D-C boundary across the basin and comparable to other D-C black shale successions globally.
Our model depicts nutrient utilization and advection scenarios across different productivity regimes. Using a modified Rayleigh isotopic fractionation equation, the δ15N value of the initial nutrient-N pool consumed by phytoplankton is determined from the observed δ15N values, and the corresponding amounts of N2 fixation predicted for both high and low-productivity areas. Through this study, it can be inferred that during the End-Devonian OAE, Western Canada experienced anoxic conditions across the basin with NH4+ as the predominant bioavailable source of nitrogen, and periodic collapse of stratification resulted in mixing of surface and deep waters. The effects of NH4+ and NO3− assimilation at different stages of redox stratification contributed to final δ15N values of exported biomass.
Data availability statement
The original contributions presented in the study are publicly available. This data can be found in the Texas Data Repository: hhttps://doi.org/10.18738/T8/NAA3M9
Author contributions
SD: Conceptualization, Data curation, Formal Analysis, Investigation, Methodology, Software, Writing–original draft, Writing–review and editing. MF: Data curation, Investigation, Methodology, Validation, Writing–review and editing. SA Funding acquisition, Investigation, Project administration, Resources, Supervision, Validation, Writing–review and editing. JF: Conceptualization, Funding acquisition, Investigation, Methodology, Project administration, Resources, Supervision, Validation, Visualization, Writing–original draft, Writing–review and editing.
Funding
The author(s) declare financial support was received for the research, authorship, and/or publication of this article. Financial support for this research and publication was provided by Baylor University Faculty Development fund and Baylor University Applied Petroleum Studies program.
Acknowledgments
We acknowledge the Alberta Energy Regulator Core Research Centre for access to core material. We thank Ren Zhang of the Baylor Stable Isotope Lab for C and N isotope analyses. Julia Visy (Baylor Department of Geosciences) assisted in sample collection and core descriptions and Jillian Sturtevant (Baylor Department of Environmental Science) contributed to spatial correlations using ArcGIS. Christopher K. Junium from Syracuse University provided helpful feedback on an earlier draft of the manuscript, and comments from three reviewers improved the final version.
Conflict of interest
The authors declare that the research was conducted in the absence of any commercial or financial relationships that could be construed as a potential conflict of interest.
Supplementary material
The Supplementary Material for this article can be found online at: https://www.frontiersin.org/articles/10.3389/feart.2024.1407639/full#supplementary-material
References
Agnieszka, P., Michał, R., Leszek, M., Marek, S., Marie, T., Mariusz, P., et al. (2020). Large environmental disturbances caused by magmatic activity during the Late Devonian Hangenberg Crisis. Glob. Planet. Change 190, 103155. doi:10.1016/j.gloplacha.2020.103155
Algeo, T. J., and Li, C. (2020). Redox classification and calibration of redox thresholds in sedimentary systems. Geochim. Cosmochim. Acta. 287, 8–26. doi:10.1016/j.gca.2020.01.055
Algeo, T. J., and Liu, J. (2020). A re-assessment of elemental proxies for paleoredox analysis. Chem. Geol. 540, 119549. doi:10.1016/j.chemgeo.2020.119549
Algeo, T. J., and Scheckler, S. E. (2010). Land plant evolution and weathering rate changes in the Devonian. J. Earth Sci. 21 (1), 75–78. doi:10.1007/s12583-010-0173-2
Algeo, T. J., and Tribovillard, N. (2009). Environmental analysis of paleoceanographic systems based on molybdenum–uranium covariation. Chem. Geol. 268 (3-4), 211–225. doi:10.1016/j.chemgeo.2009.09.001
Allan, J., and Creaney, S. (1991). Oil families of the western Canada basin. Bull. Can. Pet. Geol. 39 (2), 107–122. doi:10.35767/gscpgbull.39.2.107
Altabet, M. A. (2005). Isotopic tracers of the marine nitrogen cycle: present and past. Hdb Env. Chem. 2, 251–293. doi:10.1007/698_2_008
Altabet, M. A., Higginson, M. J., and Murray, D. W. (2002). The effect of millennial-scale changes in Arabian Sea denitrification on atmospheric CO2. Nat. Geosci. 415, 159–162. doi:10.1038/415159a
Aretz, M., and Corradini, C. (2021). Global review of the Devonian-Carbonifereous boundary: an introduction. Palaeobiodiv. Palaeoenv. 101 (2), 285–293. doi:10.1007/s12549-021-00499-8
Arthur, M. A., and Sageman, B. B. (1994). Marine black shales: depositional mechanisms and environments of ancient deposits. Annu. Rev. Earth Planet. Sci. 22 (1), 499–551. doi:10.1146/annurev.ea.22.050194.002435
Arthur, M. A., and Sageman, B. B. (2004). Sea-Level control on source-rock development: perspectives from the Holocene Black Sea, the Mid-Cretaceous western interior basin of north America, snd the Late Devonian Appalachian Basin. SEPM (Society for Sedimetary Geology, 35–59. ISBN 1-56576-110-3.
Bábek, O., Kumpan, T., Kalvoda, J., and Matys Grygar, T. (2016). Devonian/Carboniferous boundary glacioeustatic fluctuations in a platform-to-basin direction: a geochemical approach of sequence stratigraphy in pelagic settings. Sediment. Geol. 337, 81–99. doi:10.1016/j.sedgeo.2016.03.009
Barclay, J., Richards, B. C., Bryant, D., Henderson, C., Hartling, A., and Trollope, F. (1994). Carboniferous strata of the western Canada sedimentary Basin in geological atlas of the western Canada. Chapter 14.
Becker, R. T., Kaiser, S. I., and Aretz, M. (2016b). Review of chrono, litho and biostratigraphy across the global Hangenberg crisis and Devonian–Carboniferous boundary. Geol. Soc. Lond. Spec. Pub. 423 (1), 355–386. doi:10.1144/sp423.10
Becker, R. T., Königshof, P., and Brett, C. E. (2016a). Devonian climate, sea level and evolutionary events: an introduction. Geol. Soc. Lond. Spec. Pub. 423 (1), 1–10. doi:10.1144/SP423.15
Blakey, R. (2008). Gondwana paleogeography from assembly to breakup—a 500 m.y. odyssey. Geol. Soc. Am. Special Pap. 441, 1–28. doi:10.1130/2008.2441(01
Bojar, A. V., Neubauer, F., and Koeberl, C. (2013). Geochemical record of Late Devonian to Early Carboniferous events, Palaeozoic of graz, eastern Alps, Austria. Geol. Soc. Lond. Spec. Pub 376 (1), 87–108. doi:10.1144/SP376.15
Brand, U., Legrand-Blain, M., and Streel, M. (2004). Biochemostratigraphy of the Devonian− Carboniferous boundary global stratotype section and point, Griotte Formation, La serre, montagne noire, France. Palaeogeogr. Palaeoclimatol. Palaeoecol. 205 (3-4), 337–357. doi:10.1016/j.palaeo.2003.12.015
Brandes, J. A., Devol, A. H., Yoshinari, T., Jayakumar, D. A., and Naqvi, S. W. A. (1998). Isotopic composition of nitrate in the Central Arabian Sea and eastern tropical North Pacific: a tracer for mixing and nitrogen cycles. Limnol. Oceanogr. 43 (7), 1680–1689. doi:10.4319/lo.1998.43.7.1680
Brandt, P., Alory, G., Awo, F. M., Dengler, M., Djakouré, S., Imbol Koungue, R. A., et al. (2023). Physical processes and biological productivity in the upwelling regions of the tropical Atlantic. Ocean. Sci. 19 (3), 581–601. doi:10.5194/os-19-581-2023
Brewer, P. G., and Murray, J. W. (1973). Carbon, nitrogen, and phosphorus in the Black Sea. Deep-Sea Res. Oceanogr. Abstr. 20 (9), 803–818. doi:10.1016/0011-7471(73)90003-x
Buggisch, W., and Joachimski, M. M. (2006). Carbon isotope stratigraphy of the Devonian of central and southern Europe. Palaeogeogr. Palaeoclimatol. Palaeoecol. 240 (1), 68–88. doi:10.1016/j.palaeo.2006.03.046
Calvert, S. E., Bustin, R. M., and Ingall, E. D. (1996). Influence of water column anoxia and sediment supply on the burial and preservation of organic carbon in marine shales. Geochim. Cosmochim. Acta 60 (9), 1577–1593. doi:10.1016/0016-7037(96)00041-5
Caplan, M. L., and Bustin, R. M. (1998). Palaeoceanographic controls on geochemical characteristics of organic-rich Exshaw mudrocks: role of enhanced primary production. Org. Geochem. 30 (2-3), 161–188. doi:10.1016/s0146-6380(98)00202-2
Caplan, M. L., and Bustin, R. M. (1999). Devonian–Carboniferous Hangenberg mass extinction event, widespread organic-rich mudrock and anoxia: causes and consequences. Palaeogeogr. Palaeoclimatol. Palaeoecol. 148 (4), 187–207. doi:10.1016/s0031-0182(98)00218-1
Caplan, M. L., and Bustin, R. M. (2001). Palaeoenvironmental and palaeoceanographic controls on black, laminated mudrock deposition: example from Devonian–Carboniferous strata, Alberta, Canada. Sediment. Geol. 145 (1-2), 45–72. doi:10.1016/s0037-0738(01)00116-6
Carbonel, C., and Valentin, J. L. (1999). Numerical modelling of phytoplankton bloom in the upwelling ecosystem of Cabo Frio (Brazil). Ecol. Model. 116 (2), 135–148. doi:10.1016/S0304-3800(98)00201-4
Dalsgaard, T., Thamdrup, B., Farías, L., and Revsbech, N. P. (2012). Anammox and denitrification in the oxygen minimum zone of the eastern South Pacific. Limnol. Oceanogr. 57 (5), 1331–1346. doi:10.4319/lo.2012.57.5.1331
De Pol-Holz, R., Robinson, R., Hebbeln, D., Sigman, D., and Ulloa, O. (2009). Controls on sedimentary nitrogen isotopes along the Chile margin. Deep-Sea Res. II Top. Stud. Oceanogr. 56, 1042–1054. doi:10.1016/j.dsr2.2008.09.014
Dhar, S. (2024). Bulk geochemical data of black shales in Western Canada: End-Devonian Period. Tex. Data Repos. V1. doi:10.18738/T8/NAA3M9
Domingues, R. B., Barbosa, A. B., Sommer, U., and Galvão, H. M. (2011). Ammonium, nitrate and phytoplankton interactions in a freshwater tidal estuarine zone: potential effects of cultural eutrophication. Aquat. Sci. 73, 331–343. doi:10.1007/s00027-011-0180-0
Du, Y., Song, H., Grasby, S. E., Xing, T., Song, H., Tian, L., et al. (2023). Recovery from persistent nutrient-N limitation following the Permian–Triassic mass extinction. Earth Planet. Sci. Lett. 602, 117944. doi:10.1016/j.epsl.2022.117944
Elfi Mollier-Vogel, E. R., Philippe, M., Wallace, D., Altabet, M. A., Schneider, R., and Schneider, R. (2012). Nitrogen isotope gradients off Peru and Ecuador related to upwelling, productivity, nutrient uptake and oxygen deficiency. Deep-Sea Res. 1, 14–25. doi:10.1016/j.dsr.2012.06.003
Falkowski, P. G., Barber, R. T., and Smetacek, V. (1998). Biogeochemical controls and feedbacks on ocean primary production. Science 281 (5374), 200–206. doi:10.1126/science.281.5374.200
Frucci, M. (2021). Regional elemental and organic geochemical character of the devonian/mississippian Exshaw Formation across Alberta. Canada: Baylor University. [Master’s Thesis].
Fujisaki, W., Sawaki, Y., Yamamoto, S., Sato, T., Nishizawa, M., Windley, B. F., et al. (2016). Tracking the redox history and nitrogen cycle in the pelagic Panthalassic deep ocean in the Middle Triassic to Early Jurassic: insights from redox-sensitive elements and nitrogen isotopes. Palaeogeogr. Palaeoclimatol. Palaeoecol. 449, 397–420. doi:10.1016/j.palaeo.2016.01.039
Fulton, J. M., Arthur, M. A., and Freeman, K. H. (2012). Black Sea nitrogen cycling and the preservation of phytoplankton δ15N signals during the Holocene. Glob. Biogeochem. Cycles 26 (2). doi:10.1029/2011GB004196
Fulton, J. M., Arthur, M. A., Thomas, B., and Freeman, K. H. (2018). Pigment carbon and nitrogen isotopic signatures in euxinic basins. Geobiology 16 (4), 429–445. doi:10.1111/gbi.12285
Furumai, H., Kondo, T., and Ohgaki, S. (1989). Phosphorus exchange kinetics and exchangeable phosphorus forms in sediments. Water Res. 23 (6), 685–691. doi:10.1016/0043-1354(89)90200-5
Hartenfels, S., Becker, R. T., Herbig, H.-G., Qie, W., Kumpan, T., De Vleeschouwer, D., et al. (2022). The Devonian-Carboniferous transition at Borkewehr near Wocklum (northern Rhenish Massif, Germany) – a potential GSSP section. Palaeobio. Palaeoenv 102 (3), 763–829. doi:10.1007/s12549-022-00531-5
Heath, M. H., Bradley, D. C., Brittany, M. S., Gwen, L. B., Ryan, J. C., James, E. D., et al. (2021). Chemoautotrophy as the driver of decoupled organic and carbonate carbon isotope records at the onset of the Hangenberg (Devonian-Carboniferous Boundary) Oceanic Anoxic Event. Palaeogeogr. Palaeoclimatol. Palaeoecol. 577, 110540. doi:10.1016/j.palaeo.2021.110540
Higgins, M. B., Robinson, R. S., Husson, J. M., Carter, S. J., and Pearson, A. (2012). Dominant eukaryotic export production during ocean anoxic events reflects the importance of recycled NH4+. Proc. Nat. Acad. Sci. 109 (7), 2269–2274. doi:10.1073/pnas.1104313109
Howarth, R. W., Marino, R., and Cole, J. J. (1988). Nitrogen fixation in freshwater, estuarine, and marine ecosystems. 2. Biogeochemical controls1. Limnol. Oceanogr. 33 (4part2), 688–701. doi:10.4319/lo.1988.33.4part2.0688
Ingalls, M., Grotzinger, J. P., Present, T., Rasmussen, B., and Fischer, W. W. (2022). Carbonate-associated phosphate (CAP) indicates elevated phosphate availability in neoarchean shallow marine environments. Geophys. Res. Lett. 49 (6), e2022GL098100. doi:10.1029/2022GL098100
Jenkyns, H. C. (2010). Geochemistry of oceanic anoxic events. Geochem. Geophys. Geosys. 11 (3). doi:10.1029/2009GC002788
Jewell, P. W. (1994). Paleoredox conditions and the origin of bedded barites along the Late Devonian north American continental margin. J. Geol. 102 (2), 151–164. doi:10.1086/629660
Junium, C. K., and Arthur, M. A. (2007). Nitrogen cycling during the Cretaceous, Cenomanian-Turonian oceanic anoxic event II. Geochem. Geophys. Geosys. 8(3). doi:10.1029/2006GC001328
Junium, C. K., Dickson, A. J., and Uveges, B. T. (2018). Perturbation to the nitrogen cycle during rapid Early Eocene global warming. Nat. Comm. 9 (1), 3186. doi:10.1038/s41467-018-05486-w
Kabanov, P., and Jiang, C. (2020). Photic-zone euxinia and anoxic events in a Middle-Late Devonian shelfal sea of Panthalassan continental margin, NW Canada: changing paradigm of Devonian ocean and sea level fluctuations. Glob. Planet. Change 188, 103153. doi:10.1016/j.gloplacha.2020.103153
Kaiser, S. I. (2005). Mass extinctions, climatic and oceanographic changes at the Devonian/Carboniferous boundary. Available at: http://www-brs.ub.ruhr-uni-bochum.de/netahtml/HSS/Diss/KaiserSandraIsabella/diss.pdf.
Kaiser, S. I., Aretz, M., and Becker, R. T. (2016). The global Hangenberg Crisis (Devonian–Carboniferous transition): review of a first-order mass extinction. Geol. Soc. Lond. Spec. Pub. 423 (1), 387–437. doi:10.1144/sp423.9
Kaiser, S. I., Steuber, T., Becker, R. T., and Joachimski, M. M. (2006). Geochemical evidence for major environmental change at the Devonian–Carboniferous boundary in the carnic Alps and the Rhenish Massif. Palaeogeogr. Palaeoclimatol. Palaeoecol. 240 (1-2), 146–160. doi:10.1016/j.palaeo.2006.03.048
Kämpf, J. (2016). On the majestic seasonal upwelling system of the Arafura Sea. J. Geophys. Res. Oceans 121 (2), 1218–1228. doi:10.1002/2015JC011197
Karstensen, J., Stramma, L., and Visbeck, M. (2008). Oxygen minimum zones in the eastern tropical Atlantic and Pacific oceans. Prog. Oceanogr. 77 (4), 331–350. doi:10.1016/j.pocean.2007.05.009
Kienast, S. S., Calvert, S. E., and Pedersen, T. F. (2002). Nitrogen isotope and productivity variations along the northeast Pacific margin over the last 120 kyr: surface and subsurface paleoceanography. Paleoceanogr 17 (1055). doi:10.1029/2001PA000650
Komatsu, T., Kato, S., Hirata, K., Takashima, R., Ogata, Y., Oba, M., et al. (2014). Devonian-Carboniferous transition containing a Hangenberg black shale equivalent in the Pho Han Formation on Cat Ba Island, northeastern Vietnam. Palaeogeogr. Palaeoclimatol. Palaeoecol. 404, 30–43. doi:10.1016/j.palaeo.2014.03.021
Konovalov, S. K., Fuchsman, C. A., Belokopitov, V., and Murray, J. W. (2008). Modeling the distribution of nitrogen species and isotopes in the water column of the Black Sea. Mar. Chem. 111, 106–124. doi:10.1016/j.marchem.2008.01.006
Kumar, S. P., Madhupratap, M., Dileepkumar, M., Muraleedharan, P. M., Souza, S. N., Gauns, M., et al. (2001). High biological productivity in the central Arabian Sea during the summer monsoon driven by Ekman pumping and lateral advection. Curr. Sci. 81, 1633–1638.
Kumpan, T., Bábek, O., Kalvoda, J., Grygar, T., Fryda, J., Becker, T. R., et al. (2015). Petrophysical and geochemical signature of the Hangenberg events: an integrated stratigraphy of the Devonian-Carboniferous boundary interval in the northern Rhenish Massif (Avalonia, Germany). Bull. Geosci. 90 (3), 667–694. doi:10.3140/bull.geosci.1547
Kuypers, M. M. M., Marchant, H. K., and Kartal, B. (2018). The microbial nitrogen-cycling network. Nat. Rev. Microbio. 16 (5), 263–276. doi:10.1038/nrmicro.2018.9
Kuypers, M. M. M., van Breugel, Y., Schouten, S., Erba, E., and Damsté, J. S. S. (2004). N2-fixing cyanobacteria supplied nutrient N for Cretaceous oceanic anoxic events. Geology 32 (10), 853–856. doi:10.1130/G20458.1
Liu, J., Qie, W., Algeo, T. J., Yao, L., Huang, J., and Luo, G. (2016). Changes in marine nitrogen fixation and denitrification rates during the End-Devonian mass extinction. Palaeogeogr. Palaeoclimatol. Palaeoecol. 448, 195–206. doi:10.1016/j.palaeo.2015.10.022
Macqueen, R. W., and Sandberg, C. A. (1970). Stratigraphy, age, and interregional correlation of the Exshaw Formation, Alberta rocky mountains. Bull. Can. Pet. Geol. 18, 32–66. doi:10.35767/gscpgbull.18.1.032
Malec, J. (2013). The Devonian/Carboniferous boundary in the holy Cross mountains (Poland). Geol. Qtly. 58 (2). doi:10.7306/gq.1142
Martinez, A. M., Boyer, D. L., Droser, M. L., Barrie, C., and Love, G. D. (2019). A stable and productive marine microbial community was sustained through the End-Devonian Hangenberg Crisis within the Cleveland Shale of the Appalachian Basin, United States. Geobiology 17 (1), 27–42. doi:10.1111/gbi.12314
Marynowski, L., and Filipiak, P. (2007). Water column euxinia and wildfire evidence during deposition of the Upper Famennian Hangenberg event horizon from the Holy Cross Mountains (central Poland). Geol. Mag. 144 (3), 569–595. doi:10.1017/S0016756807003317
Marynowski, L., Zatoń, M., Rakociński, M., Filipiak, P., Kurkiewicz, S., and Pearce, T. J. (2012). Deciphering the upper Famennian Hangenberg Black Shale depositional environments based on multi-proxy record. Palaeogeogr. Palaeoclimatol. Palaeoecol. 346, 66–86. doi:10.1016/j.palaeo.2012.05.020
Matyja, H., Woroncowa-Marcinowska, T., Filipiak, P., Brański, P., and Sobień, K. (2021). The Devonian/Carboniferous boundary interval in Poland: multidisciplinary studies in pelagic (Holy Cross Mountains and Sudetes) and ramp (Western Pomerania) successions. Palaeobio. Palaeoenv. 101 (2), 421–472. doi:10.1007/s12549-020-00442-3
Monteiro, F. M., Pancost, R. D., Ridgwell, A., and Donnadieu, Y. (2012). Nutrients as the dominant control on the spread of anoxia and euxinia across the Cenomanian-Turonian oceanic anoxic event (OAE2): model-data comparison. Paleoceanogr 27 (4). doi:10.1029/2012PA002351
Murphy, A. E., Sageman, B. B., Hollander, D. J., Lyons, T. W., and Brett, C. E. (2000). Black shale deposition and faunal overturn in the Devonian Appalachian Basin: clastic starvation, seasonal water-column mixing, and efficient biolimiting nutrient recycling. Paleoceanogr 15 (3), 280–291. doi:10.1029/1999PA000445
Myrow, P., Strauss, J., Creveling, J., Sicard, K., Ripperdan, R., Sandberg, C., et al. (2011). A carbon isotopic and sedimentological record of the latest Devonian (Famennian) from the Western U.S. and Germany. Palaeogeogr. Palaeoclimatol. Palaeoecol. 306, 147–159. doi:10.1016/j.palaeo.2011.04.013
Myrow, P. M., Hanson, A., Phelps, A. S., Creveling, J. R., Strauss, J. V., Fike, D. A., et al. (2013). Latest Devonian (Famennian) global events in western Laurentia: variations in the carbon isotopic record linked to diagenetic alteration below regionally extensive unconformities. Palaeogeogr. Palaeoclimatol. Palaeoecol. 386, 194–209. doi:10.1016/j.palaeo.2013.05.021
Naafs, B. D. A., Monteiro, F. M., Pearson, A., Higgins, M. B., Pancost, R. D., and Ridgwell, A. (2019). Fundamentally different global marine nitrogen cycling in response to severe ocean deoxygenation. Proc. Nat. Acad. Sci. 116 (50), 24979–24984. doi:10.1073/pnas.1905553116
O'Connell, S. C., Dix, G., and Barclay, J. (1990). The origin, history, and regional structural development of the Peace River Arch, western Canada. Bull. Can. Pet. Geo. 38, 4–24. doi:10.35767/gscpgbull.38a.1.004
Ohkouchi, N., Kashiyama, Y., Kuroda, J., Ogawa, N., and Kitazato, H. (2006). The importance of diazotrophic cyanobacteria as primary producers during Cretaceous Oceanic Anoxic Event 2. Biogeosc 3, 467–478. doi:10.5194/bg-3-467-2006
Ohkouchi, N., and Takano, Y. (2014). “12.10 - organic nitrogen: sources, fates, and chemistry,” in Treatise on geochemistry. Editors H. D. Holland, and K. K. Turekian Second Edition, 251–289.
Pajares, S., and Ramos, R. (2019). Processes and microorganisms involved in the marine nitrogen cycle: knowledge and gaps. Front. Mar. Sci. 6. doi:10.3389/fmars.2019.00739
Parrish, J. T. (1982). Upwelling and petroleum source beds, with reference to Paleozoic. AAPG Bull. 66 (6), 750–774. doi:10.1306/03b5a30e-16d1-11d7-8645000102c1865d
Paschall, O., Carmichael, S. K., Königshof, P., Waters, J. A., Ta, P. H., Komatsu, T., et al. (2019). The Devonian-Carboniferous boundary in Vietnam: sustained ocean anoxia with a volcanic trigger for the Hangenberg Crisis? Glob. Planet. Change 175, 64–81. doi:10.1016/j.gloplacha.2019.01.021
Paulmier, A., and Ruiz-Pino, D. (2009). Oxygen minimum zones (OMZs) in the modern ocean. Prog. Oceanogr. 80 (3), 113–128. doi:10.1016/j.pocean.2008.08.001
Peng, X. N. (2015) “Nitrogen cycling in strong redox gradients of marine environments,” in Oceanic oxygen minimum zones and salt marsh sediments [Dissertation: pub. No. 3737408]. Princeton University.
Pi, D. H., Jiang, S. Y., Luo, L., Yang, J. H., and Ling, H. F. (2014). Depositional environments for stratiform witherite deposits in the Lower Cambrian black shale sequence of the Yangtze Platform, southern Qinling region, SW China: evidence from redox-sensitive trace element geochemistry. Palaeogeogr. Palaeoclimatol. Palaeoecol. 398, 125–131. doi:10.1016/j.palaeo.2013.09.029
Pisarzowska, A., Rakociński, M., Marynowski, L., Szczerba, M., Thoby, M., Paszkowski, M., et al. (2020). Large environmental disturbances caused by magmatic activity during the Late Devonian Hangenberg Crisis. Glob. Planet. Change 190, 103155. doi:10.1016/j.gloplacha.2020.103155
Poole, F. G. (1973). Flysch deposits of antler foreland basin, western United States: abstract. AAPG Bull. 57 (4), 800–801. doi:10.1306/83d90c32-16c7-11d7-8645000102c1865d
Qie, W., Wang, X.-D., Zhang, X., Ji, W., Grossman, E. L., Huang, X., et al. (2016). Latest Devonian to earliest Carboniferous conodont and carbon isotope stratigraphy of a shallow-water sequence in South China. Geol. J. 51 (6), 915–935. doi:10.1002/gj.2710
Rakociński, M., Marynowski, L., Pisarzowska, A., Bełdowski, J., Siedlewicz, G., Zatoń, M., et al. (2020). Volcanic-related methylmercury poisoning as the possible driver of the End-Devonian mass extinction. Sci. Rep. 10 (1), 7344. doi:10.1038/s41598-020-64104-2
Redfield, A. C. (1958). The biological control of chemical factors in the environment. Am. Sci. 46 (3), 230A–221A. Available at: http://www.jstor.org/stable/27827150.
Reyes-Mendoza, O., Herrera-Silveira, J., Mariño-Tapia, I., Enriquez, C., and Largier, J. L. (2019). Phytoplankton blooms associated with upwelling at Cabo Catoche. Cont. Shelf Res. 174, 118–131. doi:10.1016/j.csr.2018.12.015
Richards, B. C. (1989). Uppermost Devonian and Lower Carboniferous stratigraphy sedimentation and diagenesis in the southwestern district of Mackenzie and southeastern Yukon territory. En. Mines, Res. Can. doi:10.4095/127662
Richards, B. C., and Higgins, A. C. (1988). Devonian-Carboniferous boundary beds of the palliser and Exshaw formations at Jura Creek, Rocky mountains, southwestern Alberta. Geol.
Richards, B. C. B., E, W., Henderson, C. M., Higgins, A. C., Johnston, D. I., Mamet, B., et al. (1994). Uppermost Devonian (Famennian) and lower Carboniferous (Tournaisian) at Jura Creek and mount Rundle, southwestern Alberta. Geol. Sur. Can. Open File, 2866.
Robison, V. D. (1995). “The Exshaw Formation: a Devonian/Mississippian hydrocarbon source in the western Canada basin,” in Petrol. Source rocks. Editor B. J. Katz (Springer Berlin Heidelberg), 9–24.
Romaniello, S., and Derry, L. (2010). Validation of an intermediate-complexity model for simulating marine biogeochemistry under anoxic conditions in the modern Black Sea. Geochem. Geophys. Geosyst. 11. doi:10.1029/2009GC002712
Ross, D. J. K., and Bustin, R. M. (2008). Characterizing the shale gas resource potential of Devonian–Mississippian strata in the Western Canada sedimentary basin: application of an integrated formation evaluation. AAPG Bull. 92 (1), 87–125. doi:10.1306/09040707048
Ruebsam, W., and Schwark, L. (2023). Phytoplankton dynamics and nitrogen cycling during Oceanic Anoxic Event 2 (Cenomanian/Turonian) in the upwelling zone of the NE proto-North Atlantic. Glob. Planet. Change 224, 104117. doi:10.1016/j.gloplacha.2023.104117
Saltzman, M. R. (2005). Phosphorus, nitrogen, and the redox evolution of the Paleozoic oceans. Geology 33 (7), 573–576. doi:10.1130/g21535.1
Savoy, L. E. (1990). Sedimentary record of Devonian-Mississippian carbonate and black shale systems, southernmost Canadian Rockies and adjacent Montana: facies and processes. [Dissertation]. Syracuse University.
Savoy, L. E. (1992). Environmental record of Devonian-Mississippian carbonate and low-oxygen facies transitions, southernmost Canadian Rocky Mountains and northwesternmost Montana. GSA Bull. 104 (11), 1412–1432. doi:10.1130/0016-7606(1992)104<1412:ERODMC>2.3.CO;2
Schmoker, J. W., and Hester, T. C. (1983). Organic carbon in Bakken Formation, United States portion of Williston Basin. AAPG Bull. 67 (12), 2165–2174. doi:10.1306/AD460931-16F7-11D7-8645000102C1865D
Scholze, F., and Gess, R. W. (2017). Oldest known naiaditid bivalve from the high-latitude Late Devonian (Famennian) of South Africa offers clues to survival strategies following the Hangenberg mass extinction. Palaeogeogr. Palaeoclimatol. Palaeoecol. 471, 31–39. doi:10.1016/j.palaeo.2017.01.018
Schönfeld, J., Kuhnt, W., Erdem, Z., Flögel, S., Glock, N., Aquit, M., et al. (2015). Records of past mid-depth ventilation: Cretaceous Ocean Anoxic Event 2 vs. recent oxygen minimum zones. Biogeosc 12 (4), 1169–1189. doi:10.5194/bg-12-1169-2015
Shizuya, A., Oba, M., Ando, T., Ogata, Y., Takashima, R., Nishi, H., et al. (2020). Variations in trace elements, isotopes, and organic geochemistry during the Hangenberg Crisis, Devonian–Carboniferous transition, northeastern Vietnam. Isl. Arc 29 (1), e12337. doi:10.1111/iar.12337
Sigman, D. M., Altabet, M. A., McCorkle, D. C., Francois, R., and Fischer, G. (1999). The δ15N of nitrate in the southern ocean: consumption of nitrate in surface waters. Glob. Biogeochem. Cycles 13 (4), 1149–1166. doi:10.1029/s1999GB900038
Sigman, D. M., Casciotti, K. L., Andreani, M., Barford, C., Galanter, M., and Böhlke, J. K. (2001). A bacterial method for the nitrogen isotopic analysis of nitrate in seawater and freshwater. Anal. Chem. 73 (17), 4145–4153. doi:10.1021/ac010088e
Smith, M. G., and Bustin, R. M. (2000). Late Devonian and Early Mississipian Bakken and Exshaw black shale source rocks, Western Canada Sedimentary Basin: a sequence stratigraphic interpretation. AAPG Bull. 84, 94–960. doi:10.1306/a9673b76-1738-11d7-8645000102c1865d
Smith, M. G., Bustin, R. M., and Caplan, M. L. (1995). Sequence stratigraphy of the Bakken and Exshaw formations: a continuum of black shale formations in the Western Canada Sedimentary Basin. Seventh Int. Willist. Basin Symp. MTGS-AAPG, 399–409.
Smith, M. T., Dickinson, W. R., and Gehrels, G. E. (1993). Contractional nature of Devonian-Mississippian Antler tectonism along the North American continental margin. Geology 21 (1), 21–24. doi:10.1130/0091-7613(1993)021<0021:Cnodma>2.3.Co;2
Stief, P. (2013). Stimulation of microbial nitrogen cycling in aquatic ecosystems by benthic macrofauna: mechanisms and environmental implications. Biogeosc. Discuss. 10, 7829–7846. doi:10.5194/bg-10-7829-2013
Stoyles, K. C., Davies, G. R., and Spila, M. V. (2011). Regional stratigraphic study of the exshaw/bakken formations: insights from sedimentology and ichnology recovery –cspg CSEG CWLS convention.
Taylor, S. R., and McLennan, S. M. (1985). The Continental Crust; its composition and evolution; an examination of the geochemical record preserved in sedimentary rocks. Oxford: Blackwell, 312.
Thunell, R. C., Sigman, D. M., Muller-Karger, F., Astor, Y., and Varela, R. (2004). Nitrogen isotope dynamics of the Cariaco Basin, Venezuela. Glob. Biogeochem. Cycles 18 (3). doi:10.1029/2003GB002185
Tribovillard, N., Algeo, T. J., Lyons, T., and Riboulleau, A. (2006). Trace metals as paleoredox and paleoproductivity proxies: an update. Chem. Geol. 232, 12–32. doi:10.1016/j.chemgeo.2006.02.012
Tuite, M. L., Williford, K. H., and Macko, S. A. (2019). From greenhouse to icehouse: nitrogen biogeochemistry of an epeiric sea in the context of the oxygenation of the Late Devonian atmosphere/ocean system. Palaeogeogr. Palaeoclimatol. Palaeoecol. 531, 109204. doi:10.1016/j.palaeo.2019.05.026
Tyrrell, T. (1999). The relative influences of nitrogen and phosphorus on oceanic primary production. Nature 400 (6744), 525–531. doi:10.1038/22941
Uveges, B. T., Junium, C. K., Boyer, D. L., Cohen, P. A., and Day, J. E. (2019). Biogeochemical controls on black shale deposition during the Frasnian-Famennian biotic crisis in the Illinois and Appalachian Basins, USA, inferred from stable isotopes of nitrogen and carbon. Palaeogeogr. Palaeoclimatol. Palaeoecol. 531, 108787. doi:10.1016/j.palaeo.2018.05.031
Uveges, B. T., and Pearson, A. (2023). Ammonium “nutrient capacitor” model for δ15N signatures associated with marine anoxic events. Geology 51, 1132–1136. doi:10.1130/G51527.1
Van Cappellen, P., and Ingall, E. D. (1996). Redox stabilization of the atmosphere and oceans by phosphorus-limited marine productivity. Science 271 (5248), 493–496. doi:10.1126/science.271.5248.493
Velinsky, D. J., and Fogel, M. L. (1999). Cycling of dissolved and particulate nitrogen and carbon in the Framvaren Fjord, Norway: stable isotopic variations. Mar. Chem. 67 (3), 161–180. doi:10.1016/S0304-4203(99)00057-2
Velinsky, D. J., Fogel, M. L., Todd, J. F., and Tebo, B. M. (1991). Isotopic fractionation of dissolved ammonium at the oxygen-hydrogen sulfide interface in anoxic waters. Geophys. Res. Lett. 18 (4), 649–652. doi:10.1029/91GL00344
Vernon, M. R. (2001). Petrology, geochemistry, diagenesis and depositional environment of the upper devonian - lower carboniferous Exshaw Formation, northwestern Alberta [dissertation: pub. No. 3077]. University of Windsor.
Visy, J. M. (2022). Stratigraphic partitioning and reservoir distribution of the late devonian to early mississippian Exshaw Formation, western Canada Sedimentary Basin. Baylor University. [Master’s Thesis].
Voss, M., Dippner, J. W., and Montoya, J. P. (2001). Nitrogen isotope patterns in the oxygen-deficient waters of the eastern tropical north Pacific Ocean. Deep-Sea Res. 48 (8), 1905–1921. doi:10.1016/S0967-0637(00)00110-2
Waser, N. A. D., Harrison, P. J., Nielsen, B., Calvert, S. E., and Turpin, D. H. (1998). Nitrogen isotope fractionation during the uptake and assimilation of nitrate, nitrite, ammonium, and urea by a marine diatom. Limnol. Oceanogr. 43 (2), 215–224. doi:10.4319/lo.1998.43.2.0215
Werne, J. P., Sageman, B. B., Lyons, T. W., and Hollander, D. J. (2002). An integrated assessment of a “type euxinic” deposit: evidence for multiple controls on black shale deposition in the middle Devonian Oatka Creek formation. Am. J. Sci. 302 (2), 110–143. doi:10.2475/ajs.302.2.110
Zaitlin, B. A. (2011). The Alberta bakken: a potential new, unconventional tight oil resource play recovery - 2011 cspg cseg cwls convention.
Zehr, J. P., and Ward, B. B. (2002). Nitrogen cycling in the ocean: new perspectives on processes and paradigms. Appl. Environ. Microbio. 68(3), 1015–1024. doi:10.1128/AEM.68.3.1015-1024.2002
Zhang, F., Dahl, T. W., Lenton, T. M., Luo, G., Shen, S.-z., Algeo, T. J., et al. (2020). Extensive marine anoxia associated with the late devonian Hangenberg crisis. Earth Planet. Sci. Lett. 533, 115976. doi:10.1016/j.epsl.2019.115976
Zhang, X., Joachimski, M. M., and Gong, Y. (2021). Late Devonian greenhouse-icehouse climate transition: new evidence from conodont δ18O thermometry in the eastern Palaeotethys (Lali section, South China). Chem. Geol. 581, 120383. doi:10.1016/j.chemgeo.2021.120383
Keywords: ocean anoxia, advection model, trace element enrichment, nitrogen isotopes, black shales, nutrient cycling, Devonian, Hangenberg event
Citation: Dhar S, Frucci MN, Atchley SC and Fulton JM (2024) Spatial heterogeneity in nutrient utilization during the end-Devonian ocean anoxic event: a case study of the Western Canada sedimentary basin. Front. Earth Sci. 12:1407639. doi: 10.3389/feart.2024.1407639
Received: 27 March 2024; Accepted: 05 June 2024;
Published: 10 July 2024.
Edited by:
Jens Kallmeyer, GFZ German Research Centre for Geosciences, GermanyReviewed by:
Jeremy D. Owens, Florida State University, United StatesDaniel Smrzka, University of Vienna, Austria
William Patrick Gilhooly III, Indiana University Indianapolis, United States
Copyright © 2024 Dhar, Frucci, Atchley and Fulton. This is an open-access article distributed under the terms of the Creative Commons Attribution License (CC BY). The use, distribution or reproduction in other forums is permitted, provided the original author(s) and the copyright owner(s) are credited and that the original publication in this journal is cited, in accordance with accepted academic practice. No use, distribution or reproduction is permitted which does not comply with these terms.
*Correspondence: Sanjukta Dhar, U2FuanVrdGFfRGhhcjFAYmF5bG9yLmVkdQ==