 Xianyang Yan1
 Rui Xu
 Kai Zhan
- 1Yankuang Energy Group Co., Ltd., Jining, China
- 2Chengdu University of Technology, Chengdu, China
- 3Shandong Keyue Technology Co., LTD, Jinan, China
- 4China University of Mining and Technology, Xuzhou, China
Microseismic monitoring is pivotal for mine safety, offering early warnings for coal mining operations. By introducing the MTfit and MSATSI inversion methods to study the focal mechanisms of microseismic events and the stress field in coal mines, we applied these techniques for the first time to the 63upper06 working face in the Dongtan Coal Mine. We selected 107 high-quality microseismic events during the mining process and used MTfit to invert their focal mechanisms. Moreover, we used MSATSI to determine the direction of the maximum horizontal principal compressive stress in the region. This allowed us to establish a connection between mining activities, focal mechanisms, and rock strata fractures. Results show the predominance of normal and reverse faulting with significant CLVD components, underlining tensile and compressive failures as dominant in the mine’s seismicity. Further, the study subdivides the research area into three subregions for detailed stress analysis: Subregion 1 is located below the working face with a maximum principal stress of 20.3 MPa, oriented between N60°E and N75°E; Subregion 2 is above the working face and exhibits more complex stress conditions with a maximum principal stress of 30.1 MPa; and Subregion 3 is situated at the roof’s right side of the working face, with a maximum principal stress of 20.3 MPa, oriented at 30°northwest. It provides an important reference for seismic risk assessment and disaster prevention and control during mining.
Key points
• The seismic focal mechanism inversion method MTfit and stress field inversion method MSATSI are applied to the coal mine for the first time.
• The study determined dominant factors in seismicity, such as normal and reverse faulting with substantial CLVD components, through P-wave first-motion polarity technique.
• Research area was divided into three distinct subregions with unique stress conditions, revealing complex tectonic stress fields.
• Study findings indicated that tensile and compressional fractures predominantly impact the mine’s seismic focal mechanism, crucial for future hazard prevention.
1 Introduction
Due to the gradual increase in the depth and intensity of extraction in deep coal mines, strong mining-induced earthquakes have become increasingly frequent, and the mechanism behind these strong mining seismic events has become a focus and challenge for the safe and efficient production in deep mines. During the mining process in the No. 6 mining area of the Dongtan Coal Mine, on the 63upper06 working face, dozens of strong mining seismic events (MW≥1.0) occurred, resulting in significant economic losses and intense social panic. The evolution of the mining-induced stress field is indicative of the mode of strata movement and the dynamic disaster of rock mass, and it serves as a guide for dynamically adjusting mining operations and controlling mining pressure. The inversion of the seismic focal mechanism to infer the mining-induced stress field has also been applied (Li et al., 2016).
Focal mechanism solution analysis is a pivotal technique in seismology and monitoring research, offering critical insights into the focal mechanisms and the character, mechanisms, and potential impacts of seismic activities. The study of McGarr (1984) shows that there are no systematic and essential differences between the focal mechanisms of natural earthquakes and mine earthquakes, and most of the mechanisms of natural earthquake mechanisms can be used in mine earthquakes. Stress field inversion, a deep analysis based on the moment tensor, allows for the determination of the orientations of the principal stress axes on the horizontal plane, including the direction of maximum compressive stress, intermediate compressive stress, and minimum compressive stress (maximum tensile stress direction). The direction of the maximum compressive stress, in particular, plays a leading role in guiding safety measures and mining operations within coal mines. The application scope of focal mechanism is very broad in engineering, including guiding hydraulic fracturing work (Li et al., 2023), water injection-induced earthquakes (Liang et al., 2016; 2021), reservoir-induced seismicity (Zhao R. et al., 2023), rockburst (Bai, 2023), and mining-induced stress (Li and Qu, 2018). The focal point of this article is the inversion of the mining-induced stress field using the focal mechanism.
The investigation conducted by Li and Yin (2006) underscores the pivotal role of mine seismic source mechanisms in demystifying the underpinnings of seismic activity within mines and serves as a cornerstone for the prognostics and mitigation of such seismic calamities. Complementary to their earlier work, Li et al. (2005) highlighted the salient role exerted by the release of gravitational stress due to mining activities. Similarly, Šílený J and Milev A (2008) adeptly delineated several distinct fracture modes of rock masses by inverting the focal mechanisms pertaining to a quintet of seismic occurrences at South Africa’s Driefontein gold mine. Shan et al. (2013) infer from their inquiries into the seismic source mechanisms within mines that the seismic disturbances are a direct consequence of both the redistribution of stresses across the full expanse of the mining domain as well as the influence of regional stress fields. Expanding on this theme, Wu et al. (2016) provided an insightful summary of the moment tensor inversion methodology and its adept application to the fracturing of rock masses. Li and Qu, 2018 implemented reversals of seismic source mechanisms to elucidate variations within the pristine rock stress fields caused by mining turbulence. Recently, Wu et al. (2023) delved into the seismic intricacies of the Dongtan Coal Mine, elucidating that the marked activity and abrupt rupture of the superjacent dense and rigid rock layers due to coal extraction concomitant with the resultant release of considerable strain energy stands as the primary instigator for the heightened incidence of powerful mining-related seismic events. Collectively, these scholarly contributions have highlighted the effective implementation and significant impact of seismic focal mechanism inversion techniques in the realm of mining.
The elucidation of microseismic rupture mechanisms and the identification of the maximum horizontal principal stress direction and focal stress concentration locales are fundamental and crucial for safety early-warning systems in coal mines. Therefore, we attempt to examine the microseismic focal mechanisms and stress fields in coal mines utilizing MTfit (Pugh and White, 2018) and MSATSI(Martínez-Garzón et al., 2014). This paper presents, for the first time, an analysis of the focal mechanisms and local stress field using microseismic data recorded from August 24 to 30 September 2023, at the 63upper06 working face of the currently mined Dongtan Coal Mine. The conventional methods for measuring principal stress orientations, though commonly adopted in coal mines, are high-cost and time-consuming. In contrast, the inversion of microseismic events to infer focal mechanisms and stress fields offers a cost-effective and expedient alternative, providing robust theoretical and practical support for coal mine safety.
2 Data and methods
In this study, we analyzed seismicity induced at the 63upper06 longwall face of the Dongtan Coal Mine over the period from August 24 to September 7, 2023. The investigation employed the KJ1222 microseismic location system, developed by Keyue Technology (Shandong) Group Co., Ltd., to pinpoint a total of 553 seismic events as illustrated in Figure 1, utilizing our monitoring system which includes 12 single-component sensors (WDZ1-WDZ12) with a sampling frequency of 500 Hz and a dynamic range of 138 dB. The microseismic event locations predominantly occur in the areas subjected to advanced support pressure during the mining process. In the location results, the minimum moment magnitude (Mw) was −0.25, and the maximum moment magnitude (Mw) was 1.13 (The Mw are shown in Supplementary Table S1). The distribution of magnitudes included 183 events with negative magnitudes, 359 events ranging from 0 to 1 in magnitude, and 11 events with magnitudes greater than 1. Microseismic activity within coal mines can generally be classified into two distinct categories based upon their locational genesis. The initial category comprises events emanating from the goaf, which is situated at a considerable distance from the active mining face. These events are typically characterized by high energy levels and result from the fracturing of overlying strata due to lateral shifts toward the goaf. Despite their energy, these events are not typically detrimental to operational safety. The second category, which is the focus of this paper, consists of events that occur in proximity to the mining face, often within a span of 100 m. These are intimately associated with ongoing mining activities, manifesting as fresh fractures in rock layers in response to the advancing mining face, and represent a form of induced seismicity near the excavation zone.
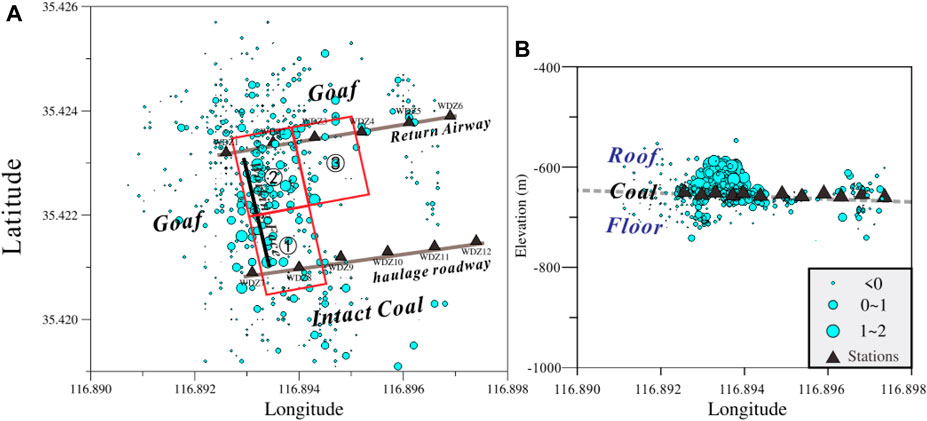
Figure 1. Distribution of microseismic events: (A) Top view, (B) Side view. In the side view, the gray dashed line represents the coal seam, with the roof above and the floor below. Blue dots indicate the monitored microseismic events, with the dot size corresponding to the magnitude. Black triangles denote the microseismic sensors. The study area is divided into three regions, labeled ①-③.
As shown in Figure 1A, microseismic events are mostly concentrated within 100 m in front of the working face. Although the working face has advanced beyond the monitoring range of sensors WDZ1 and WDZ7, the remaining 10 sensors still form a good coverage, achieving high location accuracy. Based on the calibration blasts in the research area, we obtained an average horizontal location error of 5.73 m and an average depth location error of 7.58 m. Figure 1B provides a side view of the monitored microseismic events, indicating that most events occur in the coal seam and the roof, with fewer events occurring in the floor.
We conducted data quality assessment and analysis for each event. Prior to this, the standard we set for high-quality events was: clear waveform and clear polarity. We evaluated the waveforms of all events with energy magnitudes greater than 1,000 J, and it is undeniable that the larger the energy (the greater the magnitude), the clearer the event waveform, and the waveforms captured by three-component microseismic probes are clearer than those from single-component probes. Due to the fact that mining-induced seismic events contain a large number of informational elements and have a broad waveform frequency band, there can often be some waveforms superimposition; however, on the whole, the recorded waveforms quality in the Dongtan research area stations is relatively good.
For polarity signs, there are “up” (U), “down” (D), and “uncertain” (x). For clarity signs, there are “impulsive” (I), “emergent” (E), and “uncertain” (−) (Zhao M. et al., 2023). Among the 553 events mentioned, we selected those with good station envelopes and small station azimuth gaps. Specifically, we focused on events within ±150 m of the channels where the WDZ1-WDZ12 microseismic detectors are located, and we identified events with impulsive or emergent polarity. We have selected an example of high-quality event waveforms, as shown in Figure 2. Then, the MTfit (Pugh and White, 2018) method was then used to invert for the focal mechanism with polarities, followed by the application of the MSATSI (Martínez-Garzón et al., 2014) inversion for the regional maximum principal stress.
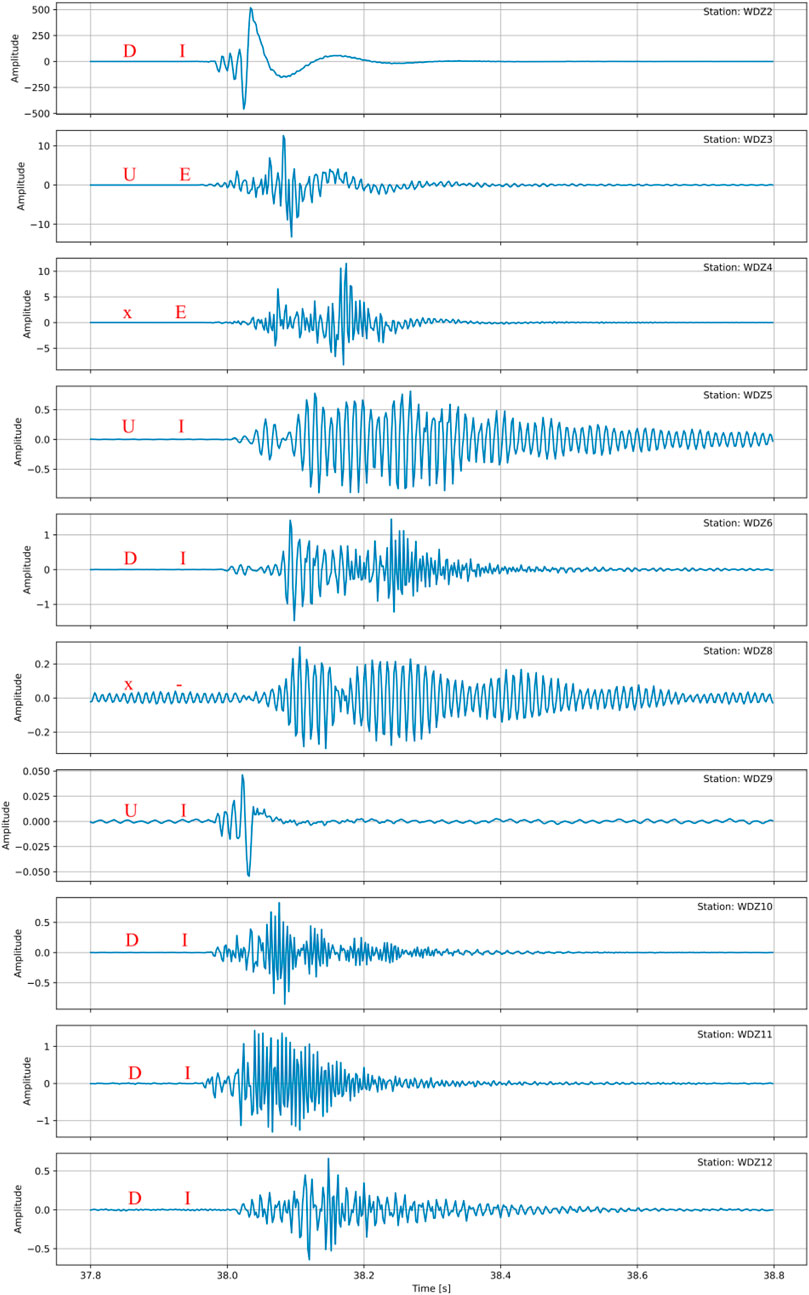
Figure 2. Example of high quality waveforms, with polarity signs and clarity signs indicated in red text.
2.1 MTfit
MTfit, an innovative moment tensor inversion tool devised by Pugh (2015), Pugh et al. (2016), harnesses a Bayesian paradigm, setting it apart from traditional techniques such as FPFIT (Reasenberg and Oppenheimer, 1985), HASH (Hardebeck and Shearer, 2002), and FOCMEC (Snoke et al., 2003). This program transcends conventional methodologies by incorporating both polarities and amplitude ratio data to compute the probability density function across the expansive moment tensor model space relevant to the double-couple mechanism, thereby facilitating a more nuanced characterisation of seismic source parameters (Pugh and White, 2018).
The fit of the moment tensor can be determined by comparing the observed P wave polarities for different receivers with the modelled values.
For a sophisticated velocity model featuring a defined hypocentre, it is possible to determine the departure angles and orientations of the rays between the source and receiver based on their trajectories. The theoretical polarities, denoted as Y, are determined by the signs of the uniform isotropic radiation elements, R, associated with the departure angles and orientations of these source-receiver rays.
If the moment tensor, M, is written in six-vector notation, normalising it is consistent with the Frobenius norm of the matrix:
As a result, the components of radiation are determined by the dot product of the angular coefficients, a, associated with the path of the source-receiver ray, as specified in Eq. 4, and the six-vector of the moment tensor.
By replacing the radiation components with their six-vector form in Eq. 1, we obtain an expression for polarity that relies on the moment tensor:
This introduces a non-linearity due to the function sgn(x), which defines the polarity. Consequently, to address polarity inversions, it becomes essential to assess the forward problem and ascertain the degree of fit. Eqs 1–5 referred to Pugh (2015).
An accurate determination of the focal mechanism is fundamental to the study of the stress field. Therefore, it is essential to validate the correctness and accuracy of the methods used. For validation, we chose a roof-blasting event monitored in the Dongtan Coal Mine. Coal mine blasting events are considered external explosion incidents, and their theoretical seismic mechanism is represented by a completely black beach ball, indicative of tensile forces (Stein and Wysession, 2002). We utilized eight microseismic probes (with four probes having fallen off as the working face was mined), solely employing the initial P-wave polarity for moment tensor inversion in geophysics. Since the explosion source is located above the microseismic probe, according to Supplementary Figure S1, all polarities recorded by the probe must be reversed. The outcomes are presented in Figure 3.
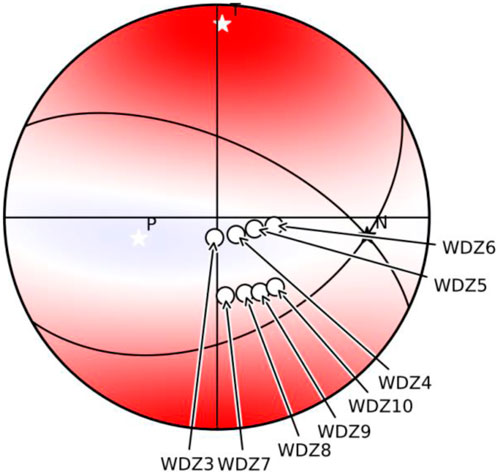
Figure 3. MTfit moment tensor inversion results, the red areas in the figure correspond to the black area on the theoretical beach ball, and white dots indicate upward polarities.
The results from the figure generally agree with the theoretical beach ball model. If the polarities were not reversed here, the inversion result would indicate an implosion event, which would be inconsistent with the actual scenario. This also demonstrates the applicability of the MTfit for the moment tensor inversion in the study area. Using only the initial polarities, the data preparation is straightforward, and the rapid inversion calculation provides feasible conditions for the future real-time inversion of seismic focal mechanisms.
2.2 MSATSI
MSATSI (Martínez-Garzón et al., 2014) is a tool based on SATSI that combines traditional methods with a novel user interface and intuitive visualization tools. The inversion technique of SATSI is designed to find the optimal stress tensor that corresponds to the sequence of focal mechanisms.
Michael (1984) established the foundational principles of the SATSI inversion approach, Jeanne Hardebeck and Andy Michael (2006) wrote SATSI algorithm for regional scale stress field inversion by adding damping factors. The tool MSATSI, aimed at determining the stress tensor by reconciling the variances between the observed slip vectors across fault planes and the corresponding solved shear stress vectors. The governing equation to resolve is succinctly expressed as (Eq. 6) (Michael, 1984):
The vector m represents the stress tensor, while the vector d is composed of the slip vectors obtained from solving the earthquake source mechanism. The data kernel matrix G is derived from the normal vectors of the fault planes of various source mechanisms. The solution is obtained using the Gaussian elimination method. The uncertainty is estimated by bootstrap resampling of the data. If there is uncertainty in the actual fault plane, it may involve randomly choosing one of the two nodal planes from the earthquake source mechanisms.
The inversion process elucidates the orientations of the principal stress axes and quantifies their relative magnitude, (R), represented by the ratio (ϕ):
Here, σ1 through σ3 correspond to the magnitudes of the principal stress axes as deduced from the deviatoric stress tensor. The metric (ϕ) gauges the proximity of the intermediate principal stress (σ2) to either the maximum (σ1) or minimum (σ3) compressive stress magnitudes.
3 Result
3.1 Focal mechanism and stress field inversion
According to research by Qian et al. (2018), during the advancement of working faces in coal mining, numerous microseismic events are generated not only front the mining face and in the corner between the mining face and the return airway roof, but also near the return airway roof. These findings are consistent with the distribution of microseismic events we have actually monitored. Hence, based on the above circumstances, and referencing the study by Wu et al. (2023), the stress field in this research area is complex and may exhibit heterogeneity. Therefore, to enable the application of MSATSI, we selected three key sub-areas within the study region, designated as Areas ①, ②, and ③ shown in Figure 1. We conducted regional stress field inversions separately for each area to fulfill the fundamental requirement for using MSATSI: based on the basic property that the transition between two different stress states must be continuous.
We further filtered events within the study area that had clear waveforms and unambiguous polarities. From the field data (August 24 to September 7, 2023), we selected 107 seismic events that met the criteria and conducted polarity picking and polarity inversion for these 107 events, thereby inverting the focal mechanisms for the region (Figure 4), with an earthquake catalog provided in Supplementary Table S1.
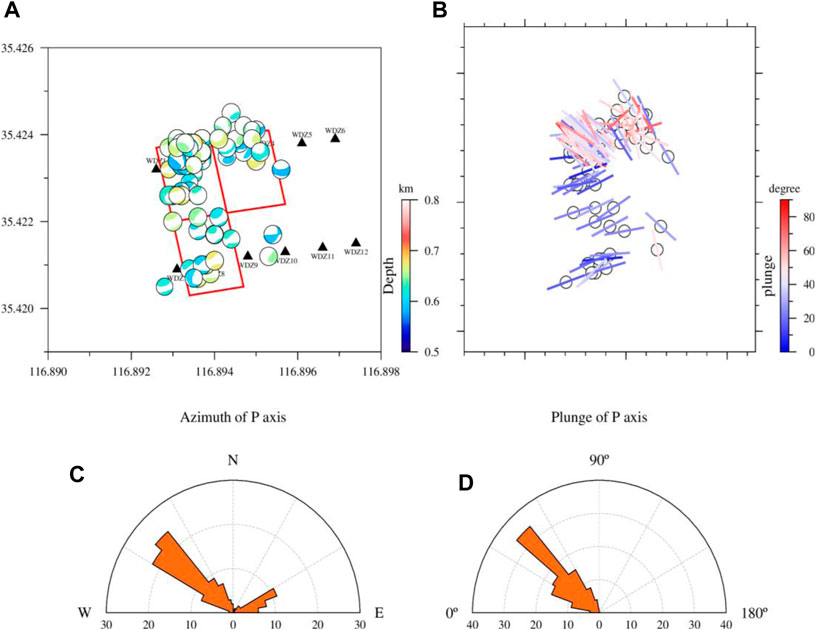
Figure 4. (A) Shows a high-quality solution of the focal mechanism of the full moment tensor for 107 earthquakes, the depth of the event is represented by the color of the beach ball, (B) shows the P-axis determined from the focal mechanism, the direction of the short rod represents the azimuth of the P-axis, and the color represents the plunge of the P-axis. And (C) and (D) provide rose plots indicating the azimuth and plunge of the P-axis respectively.
From Figure 4A, it is apparent that the microseismic events in the entire study area mainly display characteristics of normal and reverse faulting, with some events exhibiting strike-slip rupture. These events occur at depths between −600 m and −700 m and contain a significant component of CLVD (Compensated Linear Vector Dipole, a seismic source model describing earthquake mechanisms involving complex deformation, not just shear dislocations), suggesting that the high CLVD component mechanisms in the area might be attributed to the fracturing of the compacted coal seam caused by the mining activities and the advancement of the working face, similar to cracks opening under tensile stress. The results obtained by our inversion are similar to those obtained by Wu et al. (2023).
In areas ① and ②, which are directly above the working face, the events are primarily influenced by pressures parallel to the direction of the mining panel, while events in the upper left corner of area ② and in area ③ are largely subjected to pressures from N45°W to N60°W. By analyzing the P-axis azimuths and plunge angles of each event (Figures 4B–D), we identified two distinct dominant directions: N45°W and N75°E, with gentler plunge angles at the working face and steeper ones along the direction of the return airway.
The software MSATSI (Martínez-Garzón et al., 2014) automatically determines the optimal damping parameter based on the provided input data. Additionally, it generates the associated trade-off plot. As illustrated in Figure 5, the chosen damping parameter is 2.0. To determine the principal stress orientations in each subregion, we performed an inversion of the damped stress tensor using the selected focal mechanism solutions (Figure 6), with a damping factor of 2.0.
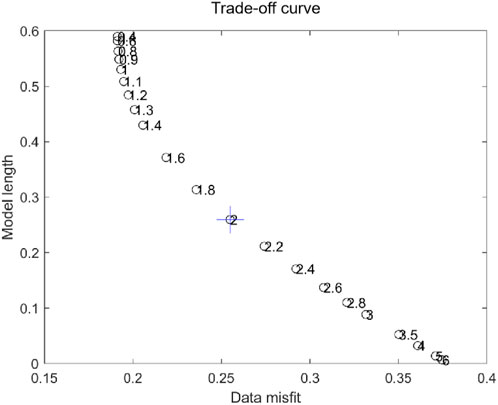
Figure 5. Dependence between data misfit and model length, calculated from a discreet set of damping parameters (damping values are indicated beside each point). The selected damping parameter is shown with a cross.
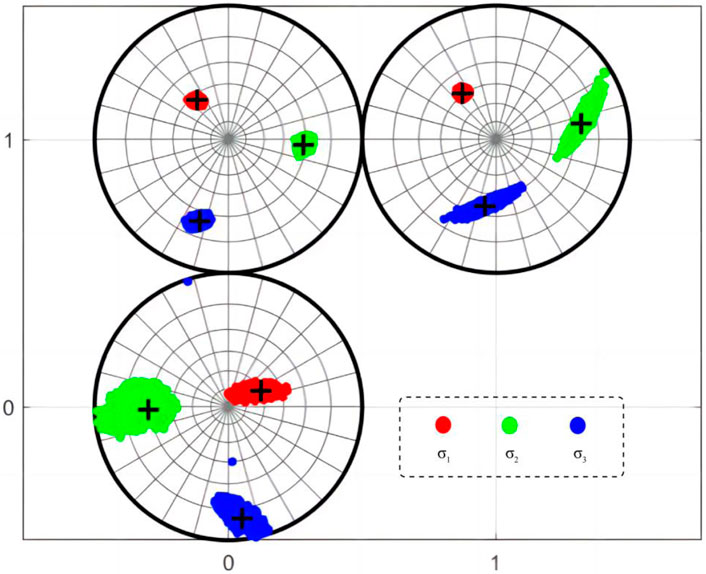
Figure 6. Inversion results of zonal stress. The red, green, and blue dots represent the inversion results of σ1, σ2, and σ3, respectively, from bootstrap resampling within 95% confidence intervals. The subfigure at coordinates (0,0) represents the stress inversion results for area ①, the subfigure at coordinates (0,1) represents the stress inversion results for area ②, and the subfigure at coordinates (1,1) represents the stress inversion results for area ③.
The regional stress distribution is complex. In area ①, which corresponds to the lower half of the working face, the stresses are predominately from an N60°E-E direction (nearly perpendicular to the working face). Based on the focal mechanism, the principal stress direction in this region is inferred to be between N60°E and N75°E. The stress in area ② is more complicated; focal mechanisms indicate the presence of both N60°E-E directional stress and NW directional stress. Therefore, the principal stress direction in this area depends on the proportional weighting of working face or corner event occurrences. In our field data, the NW directional stress has a greater weighting, resulting in a σ1 direction between N30°W and N45°W. In area ③, the primary stress direction is from the NW, with the σ1 direction based on focal mechanism inversion being N30°W to N45°W.
3.2 Fracture type
The decomposition of the moment tensor can be visualized and interpreted using a diamond plot, as shown in Figure 7 (See Supplementary Table S1 for the specific proportion of each component). This diagram illustrates the epicenter location within the CLVD-ISO coordinate system, with the DC component indicated by varying shades of color (CLVD (Compensated Linear Vector Dipole) models earthquake mechanisms involving complex deformation beyond shear dislocations. ISO (Isotropic) represents pure volumetric changes during an earthquake. DC (Double-Couple) describes pure shear dislocation). Epicenters of pure shear fracturing or predominantly shear fracturing are situated at or near the origin of the coordinates. Explosions and implosions are located at the top and bottom vertices of the diamond, respectively. Pure tensile fractures and pure compression fractures are plotted along the edges of the diamond diagram. Points along the CLVD axis correspond to fracturing on non-planar faults, while points in the first and third quadrants of the diamond diagram are indicative of shear-tensile and shear-compression sources, respectively.
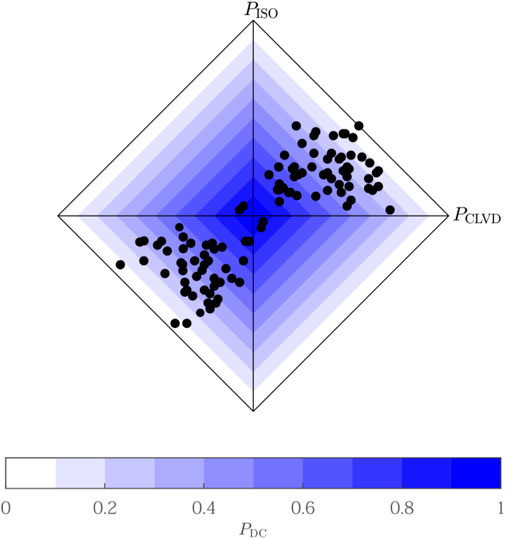
Figure 7. CLVD-ISO diamond diagram.
It can be seen from Figure 7 that the events are primarily distributed in the first and third quadrants, with a majority being tensile and compressional fractures, as well as a mix of tensile-shear and compressive-shear fractures, alongside a fraction of shear fracturing events. The hypocenters should not fall into the second and fourth quadrants of the diamond plot, however, there are four events located within these quadrants, which may be due to errors in moment tensor inversion caused by noise or other factors. Refer to the rock mass fracture criteria by Liu et al. (2021), shear fractures account for 14.02%, tensile fractures make up 28.04%, compressional accounts for 32.71%, tensile-shear mixed fractures constitute 11.21%, and compressive-shear waveforms represent 14.02%. The results indicate that compressive and tensile fractures play a dominant role in the focal mechanisms of Dongtan Coal Mine seismic events. A small amount of shear rupture should not be neglected. In the context of coal mining, the vertical stress on the goaf roof are transferred to the solid coal side through the rock beams, leading to the compressive stress on the coal body exceeding its compressive strength and causing rupture. The tensile stress on the rock beams above the coal body exceeds its tensile strength, resulting in rupture. Meanwhile, the originally relatively stable rock block twist structure in adjacent goafs is damaged, causing the roof to slip and become unstable, leading to strike-slip faulting.
4 Discussion
4.1 Numerical simulation verification of stress field in study area
To validate the accuracy of the stress field orientation inversion in the study area, this paper utilizes numerical modeling software to construct a numerical model based on the geological conditions of the No. 6 mining area of the Dongtan Coal Mine. The simulation predicted the magnitude and direction of the principal stresses in the roof and surrounding rock of the 63upper06 working face. Referencing the comprehensive stratigraphic columnar diagram for the Dongtan 63upper06 fully-mechanized working face (Supplementary Figure S2) and the compiled table of mechanical testing parameters for coal and rock bodies (Supplementary Table S2), a three-dimensional numerical model is established. The dimensions of the model are 500 m in length, 500 m in width, and 100 m in height. The model features grids of various sizes in the XYZ directions, as shown in Supplementary Figures S3, S4. The overall meshing strategy focuses on the coal seam area with dense grids, while using sparse grids in other regions to concentrate computational resources and ensure faster convergence of the numerical model. The model’s zoning also follows the principles outlined earlier in the text, dividing the research area into three regions A, B, and C. The front view and top-down view of the model are shown in Supplementary Figures S3, S4, respectively.
According to related reports, the maximum horizontal stress in the Dongtan No. 6 mining area ranges from 24.96 to 27.12 MPa, with an orientation of 148.93°–150.00°(Wu et al., 2023). The layout orientation of the 63upper06 working face is N79°, with the maximum principal stress forming an angle of 71° with the direction of the working face’s advancement. The average depth of burial for the working face is 687 m, with the model’s upper surface burial depth being 627 m and the lower surface burial depth being 727 m. Using the average density of the overlying strata which is 2,700 g/cm3, the vertical stress on the upper and lower boundaries of the model are calculated to be 16.9 MPa and 19.6 MPa, respectively. To simulate a real stress field environment, stress boundary conditions are applied to all boundaries of the model. Ultimately, the solved model yields a spatial stress distribution cloud diagram in the basal sandstone.
The model is divided into regions (Figure 8) according to the partitioning method shown in Figure 1. The magnitude of stress components of stress fields in each region is counted, and the stress field matrix is shown in the following format.
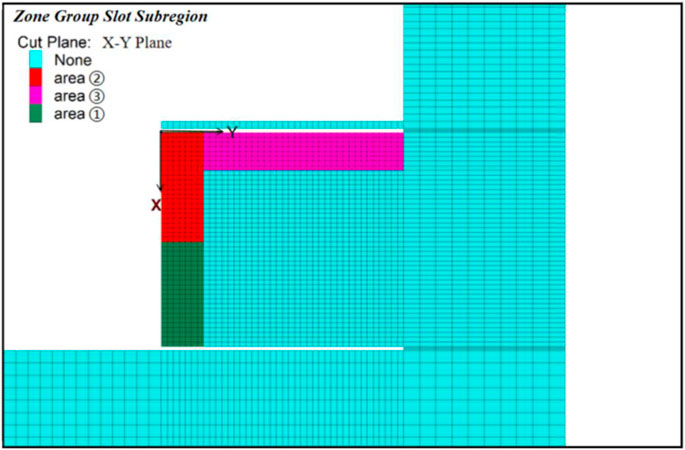
Figure 8. Schematic diagram of model partitioning.
The statistical results of the stress field matrix for regions ①, ② and ③ are as follows, Eq. 8, and the unit is MPa.
Calculate the eigenvalues and eigenvectors of the top-left 2×2 matrix of the stress field matrix to obtain the magnitude and direction of the principal stresses in the X-Y plane. The calculation results are as follows:
(1) For area ①, the maximum principal stress is 20.3 MPa, with a direction of (0.97, 0.23), and the minimum principal stress is 9.96 MPa, with a direction of (−0.23, 0.97).
(2) For area ②, the maximum principal stress is 30.1 MPa, with a direction of (−0.54, −0.84), and the minimum principal stress is 24.6 MPa, with a direction of (−0.54, 0.84).
(3) For area ③, the maximum principal stress is 20.3 MPa, with a direction of (−0.43, −0.9), and the minimum principal stress is 17.2 MPa, with a direction of (−0.9, 0.43).
According to numerical simulations, the simulated direction of maximum principal compressive stress at area ① is N66°E, at area ② is N22°W, and at area ③ is N16°W. When compared with actual inversion data, areas ① and ② show some discrepancies with the simulation, while area ③ matches the simulation results. The divergence between the numeric simulation outcomes for area ① and the inversion results is attributable to characteristics of the numerical modeling numerical simulation software. Since numerical modeling operates on the finite difference method, the stress transfer between the adjacent mined-out area’s main roof and the current working face is not interrupted, thus resulting in this deviation. As for area ②, the simulation reflects chiefly the direction of change of the stress concentration area, whereas the actual data segmentation possesses both the upper part of the working face and the stress concentration area; therefore, the overall area’s stress field inversion is subject to interference from forces in other directions, suggesting the structural stress field is not singular but a composite stress field. Hence, there are some differences between the actual data and the simulation, yet they fall within reasonable bounds.
4.2 Stress factor analysis
R-value is a stress factor, which represents the relative stress magnitude of the principal stress in the three directions, mainly reflected in whether the intermediate stress axis is more inclined to compressive stress or tensile stress, and can also explain the stability and certainty of the maximum principal compressive stress axis and the maximum principal tension axis. The calculation formula is as Eq. 7.
The stress intensity factor (R-value, Eq. 7) in two regions of the working face, area ①② and area ③, are 0.44, 0.13, and 0.67 respectively, as shown in Figure 9. This indicates that on the working face, the intermediate stress axis is gradually approaching the axis of the maximum principal compressive stress. The intermediate stress axis also exhibits the characteristics of compressive stress. Furthermore, this confirms that the tectonic stress field in the working face area is fairly complex and might be influenced by various structural forces. It is affected by pressures from both the northwest and northeast to east directions, resulting in a lower R-value on the working face. However, the R-value at area ③, which corresponds to the top of the upper gateway, is 0.67. This suggests that the axes of maximum principal compressive stress, intermediate stress, and maximum principal tensile stress are relatively stable and certain at the return airway roof. The tectonic stress encountered at the return air roof is comparatively simplistic. Existing research (Li et al., 2016) suggests that the orientation of roadways should be parallel to or intersect at a small angle with the direction of the maximum horizontal principal stress, to avoid perpendicular orientations as much as possible. However, according to the results mentioned above, the direction of the roadways intersects at a large angle with the direction of the maximum principal compressive stress, inevitably resulting in the upheaval and impact on the roof and floor of the roadways.
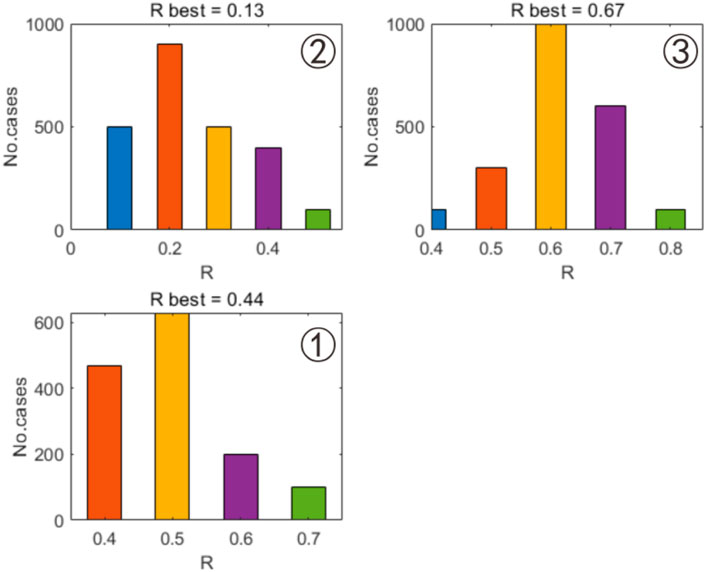
Figure 9. R-values of stress field inversion for each subregion.
5 Conclusion
We have applied the MTfit source mechanism inversion method and the MSATSI stress field inversion method to the 63upper06 working face, and successfully calculated the source mechanisms of microseismic events for the 63upper06 working face of the Dongtan Coal Mine: normal and reverse faulting, with some oblique-slip faulting components and a significant CLVD (Compensated Linear Vector Dipole) component. Consequently, it is inferred that the cause of the seismicity is due to the coal seam being subjected to a pressure that exceeds its compressive strength, the roof being subjected to a tensile force that exceeds its tensile strength, and slippage failure of the roof. We have computed the directions of the maximum horizontal principal compressive stress for different areas. For area ③ and area ②, σ1 is approximately N30°W, while for area ①, σ1 is between N60°E and N75°E, almost perpendicular to the working face, which is generally consistent with the results from numerical simulation. Additionally, the types of fractures within the study area are primarily compressional and tensional fractures, as well as their mixed forms with shear fractures, reflecting the redistribution of rock stress caused by coal mining. The calculation of the stress intensity factor (R value) reveals the relative complexity and stability of the principal stresses in different areas. To sum up, this study provides an important reference for the assessment of seismic hazards and disaster prevention and control during the mining process. The following preventive measures can be taken:
• Strengthen roadway support based on the specific stress values at the location of the roadways; for new mines in deep coal seams, measure the geostress during geological exploration to inform the design of the mining layout.
• Implement roof pre-splitting blasting and caving blasting to effectively relieve the vertical stress on the roof caused by mining.
• Implement drilling and slotting at the bottom to alter the rock environment that causes disasters due to the maximum principal compressive stress.
• Based on the prediction results, implement induced blasting measures in dangerous areas to direct and better control the release of mining pressure.
Data availability statement
The raw data supporting the conclusions of this article will be made available by the authors, without undue reservation.
Author contributions
XY: Funding acquisition, Writing–review and editing. RX: Software, Writing–original draft. KZ: Validation, Writing–review and editing. XW: Data curation, Writing–review and editing. CW: Validation, Writing–review and editing. ZL: Formal Analysis, Resources, Writing–review and editing. QZ: Resources, Visualization, Writing–review and editing.
Funding
The author(s) declare that no financial support was received for the research, authorship, and/or publication of this article.
Conflict of interest
Authors XY, ZL, and QZ were employed by Yankuang Energy Group Co., Ltd. Authors RX and CW were employed by Shandong Keyue Technology Co., LTD.
The remaining authors declare that the research was conducted in the absence of any commercial or financial relationships that could be construed as a potential conflict of interest.
Publisher’s note
All claims expressed in this article are solely those of the authors and do not necessarily represent those of their affiliated organizations, or those of the publisher, the editors and the reviewers. Any product that may be evaluated in this article, or claim that may be made by its manufacturer, is not guaranteed or endorsed by the publisher.
Supplementary material
The Supplementary Material for this article can be found online at: https://www.frontiersin.org/articles/10.3389/feart.2024.1405154/full#supplementary-material
References
Bai, X. X., Cao, A. Y., Liu, Y. Q., Wang, C. B., Yang, X., Zhao, Y. C., et al. (2023). Mine earthquake mechanism of extremely thick strata based on focalmemchanism analysis. J. China Coal Soc. 48 (11), 4024–4035. doi:10.13225/j.cnki.jccs.2022.1731
Hardebeck, J. L., and Shearer, P. M. (2002). A new method for determining first-motion focal mechanisms. Bull. Seismol. Soc. Am. 92 (6), 2264–2276. doi:10.1785/0120010200
Li, Q. C., Wang, L. J., Xu, W. H., Yang, Y. B., Xie, X. L., Chen, J., et al. (2023). Inversion of crustal stress based on source mechanism[J/OL]. Prog. Geophys. 1-10. [In Chinese]. doi:10.6038/pg2023GG0241
Li, S. F., and Qu, Y. (2018). Inversion analysis of principal stress field of coal mining based on focus mechanism. Min. Saf. Environ. Prot. 45 (03), 90–93. [In Chinese].
Li, S. L., and Yin, X. G. (2006). A preliminary research on microseism source mechanism in mines. Min. Res. Dev. (S1), 141–146. [In Chinese]. doi:10.13827/j.cnki.kyyk.2006.s1.037
Li, T., Cai, M. F., Sun, L. J., and Zuo, Y. (2016). Inversion of mining-induced stress field and its application based on focal mechanism solution. Chin. J. Rock Mech. Eng. (09), 1747–1753. [In Chinese]. doi:10.13722/j.cnki.jrme.2016.0002
Li, T., Cai, M. F., Zuo, Y., and Liu, Y. Q. (2005). Features of focal mechanisms of ming-induced earthquakes: a case study of the Fushun Laohutai coal mine, Liaoning Province. Geol. Bull. China (02), 136–144. [In Chinese].
Liang, C., Yu, Y., Wu, F., Kang, L., and Tang, J. (2021). Local stress field inverted for a shale gas play based on focal mechanisms determined from the joint source scanning algorithm. Earthq. Sci. 34, 222–233. doi:10.29382/eqs-2021-0003
Liang, C., Yu, Y., Yang, Y., Kang, L., Yin, C., and Wu, F. (2016). Joint inversion of source location and focal mechanism of microseismicity. GEOPHYSICS 81 (2), KS41–KS49. doi:10.1190/geo2015-0272.1
Liu, Y. C., Li, S. L., and Tang, C. (2021). Improvement and application of focal mechanism solution type criterion for rock mass fracture. Rock Soil Mech. 42 (5), 1335–1344. [In Chinese]. doi:10.16285/j.sm.2020.1228
Martínez-Garzón, P., Kwiatek, G., Ickrath, M., and Bohnhoff, M. (2014). MSATSI: a matlab package for stress inversion combining solid classic methodology, a new Simplified user-Handling, and a visualization tool. Seismol. Res. Lett. 85 (4), 896–904. doi:10.1785/0220130189
McGarr, A. (1984). Some applications of seismic source mechanism studies to assessing underground hazard. GAY N. C. WAINWRIGHT E H ed. [S. l.] Rockbursts Seismicity Mines, 199–208.
Michael, A. J. (1984). Determination of stress from slip data: faults and folds. J. Geophys. Res. 89 (11), 11517–11526. doi:10.1029/jb089ib13p11517
Pugh, D. J. (2015). Bayesian source inversion of microseismic events, PhD Thesis, Department of Earth Sciences. University of Cambridge. Doctoral thesis.
Pugh, D. J., and White, R. S. (2018). MTfit: a Bayesian approach to seismic moment tensor inversion. Seismol. Res. Lett. 89, 1507–1513. doi:10.1785/0220170273
Pugh, D. J., White, R. S., and Christie, P. A. F. (2016). A Bayesian method for microseismic source inversion. GJI 206 (2), 1009–1038. doi:10.1093/gji/ggw186
Qian, J., Zhang, H., and Westman, E. (2018). New time-lapse seismic tomographic scheme based on double-difference tomography and its application in monitoring temporal velocity variations caused by underground coal mining. Geophys. J. Int. 215 (3), 2093–2104. doi:10.1093/gji/ggy404
Reasenberg, P. A., and Oppenheimer, D. (1985). FPFIT, FPPLOT and FPPAGE: Fortran computer programs for calculating and displaying earthquake fault-plane solutions OFR 85-739. Tech. Rep. USGS. doi:10.3133/ofr85739
Shan, C. L., Li, X., Fan, P. L., Yu, C., and Li, Y. J. (2013). Study on mine tremors focal mechanism in Zibo coal mine. Seismol. Geomagnetic Observation Res. 34 (3), 29–34.
Šílený, J., and Milev, A. (2008). Source mechanism of mining induced seismic events — Resolution of double couple and non double couple models. Tectonophysics 456 (Issues 1–2), 3–15. doi:10.1016/j.tecto.2006.09.021
Snoke, J. A., Chou, T., and Woodhouse, J. H. (2003). FOCMEC: FOCal MEChanism determinations, Tech. rep. source parameters from waveform data for studies of global and regional seismicity. J. Geophys. Res. 86 (B4), 2825–2852. doi:10.1029/jb086ib04p02825
Stein, S., and Wysession, M. E. (2002). An introduction to seismology, earthquakes, and Earth structure.
Wu, K. B., Zou, J. P., Jiao, Y. Y., and Hu, X. Y. (2023). Study on the internal relationship of source parameters and focal mechanism of strong mine tremors in deep coal mines. Chin. J. Rock Mech. Eng. (10), 2540–2551. doi:10.13722/j.cnki.jrme.2022.1213
Wu, S. C., Huang, X. Q., Chen, F., Cai, J. F., and Wu, H. Y. (2016). Moment tensor inversion of rock failure and its application. Article 37 (S1), 1–18. [In Chinese]. doi:10.16285/smj.r.2016.S1.001
Zhao, M., Xiao, Z., Zhang, M., Yang, Y., Tang, L., and Chen, S. (2023b). DiTingMotion: a deep-learning first-motion-polarity classifier and its application to focal mechanism inversion. Front. Earth Sci. 11, 1103914. doi:10.3389/feart.2023.1103914
Keywords: MTfit, MSATSI, microseismic monitoring, focal mechanism, stress field inversion
Citation: Yan X, Xu R, Zhan K, Wen X, Wang C, Li Z and Zhang Q (2024) Inversion of mining-induced stress field based on focal mechanism solutions: a case study of the 63upper06 working face in Dongtan Coal Mine. Front. Earth Sci. 12:1405154. doi: 10.3389/feart.2024.1405154
Received: 22 March 2024; Accepted: 17 June 2024;
Published: 04 July 2024.
Edited by:
Thibault Candela, Netherlands Organisation for Applied Scientific Research, NetherlandsReviewed by:
Andreas Nikolaos Karakonstantis, Hellenic Mediterranean University, GreeceZhiyong Zhang, Liaoning Technical University, China
Copyright © 2024 Yan, Xu, Zhan, Wen, Wang, Li and Zhang. This is an open-access article distributed under the terms of the Creative Commons Attribution License (CC BY). The use, distribution or reproduction in other forums is permitted, provided the original author(s) and the copyright owner(s) are credited and that the original publication in this journal is cited, in accordance with accepted academic practice. No use, distribution or reproduction is permitted which does not comply with these terms.
*Correspondence: Kai Zhan, zhankai@stu.cdut.edu.cn