 Botao Xie1*
 Hang Sun
- 1CNOOC Research Institute Co. Ltd, Beijing, China
- 2Ocean College, Zhejiang University, Zhejiang, China
In the western South China Sea, the diversity and complex genesis of sand waves lead to difficulties in measuring the actual scour depth of offshore wind turbine foundations. The present study employs methods such as in-situ multibeam echo sounding along with numerical simulation techniques, combined with regional hydrological and geological data, to reveal the scour depth of pile foundations under seabed sand wave migration conditions (SPF-SWM). Unlike previous studies, this study examines pile foundation scour depth from both macroscopic and microscopic perspectives, and proposes a method for risk assessment and safety zoning during the service life of pile foundations (RASZ). Our findings demonstrate that the dominant flow directions in the modern hydrodynamic environment play a crucial role in shaping and migrating sand waves, providing guidance for macro-level offshore wind project siting. Moreover, the study quantifies the changes in pile foundation elevations during sand wave migration and assesses their impact on safety throughout the service life of various pile foundations. Additionally, by utilizing Flow3D’s numerical model and combining it with sampling data, the maximum scour depth likely to be experienced by pile foundations was calculated, establishing a micro-perspective on the range of pile foundation scour and analytically examining the coupling mechanism between sand wave migration and pile foundation scour in stages. By considering SPF-SWM, we estimated the actual depth variations of pile foundations in the study area, enabling effective assessment of scour conditions during their service life. This also provides ideas for delineating safety and risk zones, thereby offering precise locational analysis for the construction planning of offshore wind farm pile foundations.
1 Introduction
Submarine sand waves are geomorphological features on the seabed characterized by a regular rhythmic morphology, formed under the influence of hydrodynamic activity and sediment movement. The migration of these sand waves can result in scouring beneath subsea pipelines, leading to long-term suspension and eventual fracture (Morelissen et al., 2003). Additionally, the bases of offshore structures are susceptible to current-induced scour, which increases the span length of pile foundations and reduces their natural frequencies, further compromising their stability. Zhao et al. (2010) found that the scouring process is dominated by horseshoe vortices and vortex shedding. Moreover, the slope of the scour pits in front of single piles is nearly equivalent to the angle of repose of sediments. In the western South China Sea study area, diverse and variously derived sand waves are present. Hulscher (1996) postulated that the periodicity and regularity of sand wave shapes are caused by the spatial uniformity and temporal symmetry of tidal currents. Waves also contribute to sand wave formation, as Cataño-Lopera and García (2006) observed in experiments where initial planar bedforms gradually developed into sand waves, with decreasing rates of vertical growth at the crests and troughs, followed by migration in the direction of wave propagation. In practice, sand wave formation is often driven by the combined effects of tidal currents and waves. Li and Amos (1999) discerned wave-form sand waves, that exhibit more rounded crests and uniform shapes, clearly distinguishable from those formed under tide-dominated conditions, through the analysis of seabed image data. Van der Meer et al. (2008) noted that the combined impact of wind waves and tidal currents is significant and complex, contributing to the increase in sand wave size during suspended sediment deposition under wave action, while the waves accelerate the transport of bed load material, inducing a reduction in sand wave height. Liu et al. (1998) elucidated the formation of crescent-shaped sand waves under tidal influence, finding a marked effect of wave-current interactions on sand wave growth and migration. Internal waves, a special wave action, were identified by Xia (2009) in the northern South China Sea as the dominant cause of sediment movement in areas with sand wave distributions, where both tidal currents and ocean currents were too weak to initiate sediment transport. Ma et al. (2016) hypothesized that internal waves generate sand waves as they shoal and their polarity reverses, leading to the formation of oscillatory flow beneath the waves. Shan et al. (2017) recognized the capacity of internal waves to move sediment, but noted that research into internal waves as a hydrodynamic condition for sand wave formation remains scarce, with further study needed on how the strong currents induced by internal wave action generate submarine sand waves. As for the role of extreme storms like typhoons in sand wave migration, researchers generally concur that typhoons can cause substantive changes to sand waves in the short term, but over the long-term impacts of tidal action, sand waves tend to revert to a state of equilibrium. Li (2010) asserted that extreme marine conditions, such as typhoons and tropical storms, could temporarily enhance bottom currents and affect sand wave migration. Cao et al. (2021) discovered significant sand wave migration instigated by single typhoons, yet over longer periods, the movements induced by multiple typhoons appeared to offset each other in field data. Campamans et al. (2018) discussed the roles of mixed sediments, biology, and storm tides in the evolution of sand waves, pointing out that under the influence of typhoons, rapid sand wave migration occurs. Zang et al. (2023) found that the evolution of seabed sand waves is influenced by both normal and extreme weather conditions through their research in the Beibu Gulf region north of Hainan Island. These variably caused sand waves present a considerable safety risk to engineering structures like offshore wind farms in the study area. As sand waves migrate below pile foundations, causing scour around these structures, the actual depth of scour becomes difficult to predict, posing significant challenges to forecasting actual scour depths and implementing targeted protection measures.
At present, numerous scholars have conducted extensive research on scour around pile foundations of offshore structures. Yong et al. (2011) proposed a physical model applicable to small-scale sand waves and established a formula to predict the migration rate of small sand waves, but this method only predicted sand wave migration without discussing changes in pile foundation scour depth. Chiew (2004) observed that when sand wave crests migrate to scour pits, the pits become shallower, whereas when troughs move to scour pits, scouring around the pile foundation deepens further, with the arrival of crests and troughs reflecting the instantaneous horizontal seabed surface. Chavan (2018) studied the influence of downward seepage on the bed morphology around circular bridge piers in alluvial channels, finding that the scour depth at the pier was greatest without seepage and decreased as the percentage of seepage increased, while the height of sand dunes on the leeward side of the piers was relatively small without seepage and increased as seepage percentage increased. Overall, previous studies have tended to overlook the impact of scour depth caused by sand wave migration or have focused solely on the mechanics of sand wave formation and evolution, lacking analysis of the coupling effect with offshore pile foundations. To address the issues in previous research, this paper provides a detailed analysis of changes in pile foundation embedding depth from both macroscopic and microscopic levels. It considers changes in pile foundations’ embedment depth caused by sand wave migration as well as changes in scour due to the pile foundation itself, and calculates the potential maximum scour depth faced by the pile foundations. In this paper, the elevation changes caused by sand wave migration over the lifespan of the pile foundation are computed using the profile analysis method, based on the sand wave movement speed. At the same time, simulation of the scour depth of the pile foundation is conducted using the CFD software Flow3D. By integrating the elevation changes of the sand waves over the service period of the pile base, this study estimates SWM-SPF within the operational timeframe of the offshore wind turbine. This RASZ approach allows for a safety evaluation of offshore wind power pile foundations during their life cycle and provides reference for the construction of offshore wind projects as well as for the prevention of geohazards in marine environments.
2 Materials and methods
2.1 Data collection and analysis tools
Two comprehensive surveys were conducted from October to December 2021 and from November 2022 to January 2023 to explore the seabed sand waves, obstructions, and shallow geological features of the research area. Fifteen stations were established across the area to collect hydrographic data, which also included tidal measurements, wave observations, and data acquisition regarding water levels, wave heights, wave periods, and wave directions.
The survey equipment included a Kongsberg EM710 multibeam echosounder system, which provided bathymetric data at a resolution of 5 m x 5 m; and an IXSEA ECHOES 3500 subbottom profiler to collect geological data up to 30 m deep. Data interpretation and processing were performed using software such as MATLAB, Fledermaus, and Origin.
2.2 Background of the study area
The research area is situated in the southeastern waters of Beibu Gulf in the western South China Sea, adjacent to the southwestern coast of Hainan Island in China (Figure 1). The diversity and complexity of subaqueous sand wave formations in this area are influenced by a variety of factors. The regional water depth ranges from 10 to 44 m, with tidal currents flowing predominantly in the N to S direction. The hydrodynamic environment under wave-induced flow conditions is complex. Influenced by coastal sediment transport, sand waves are extensively distributed across the area.
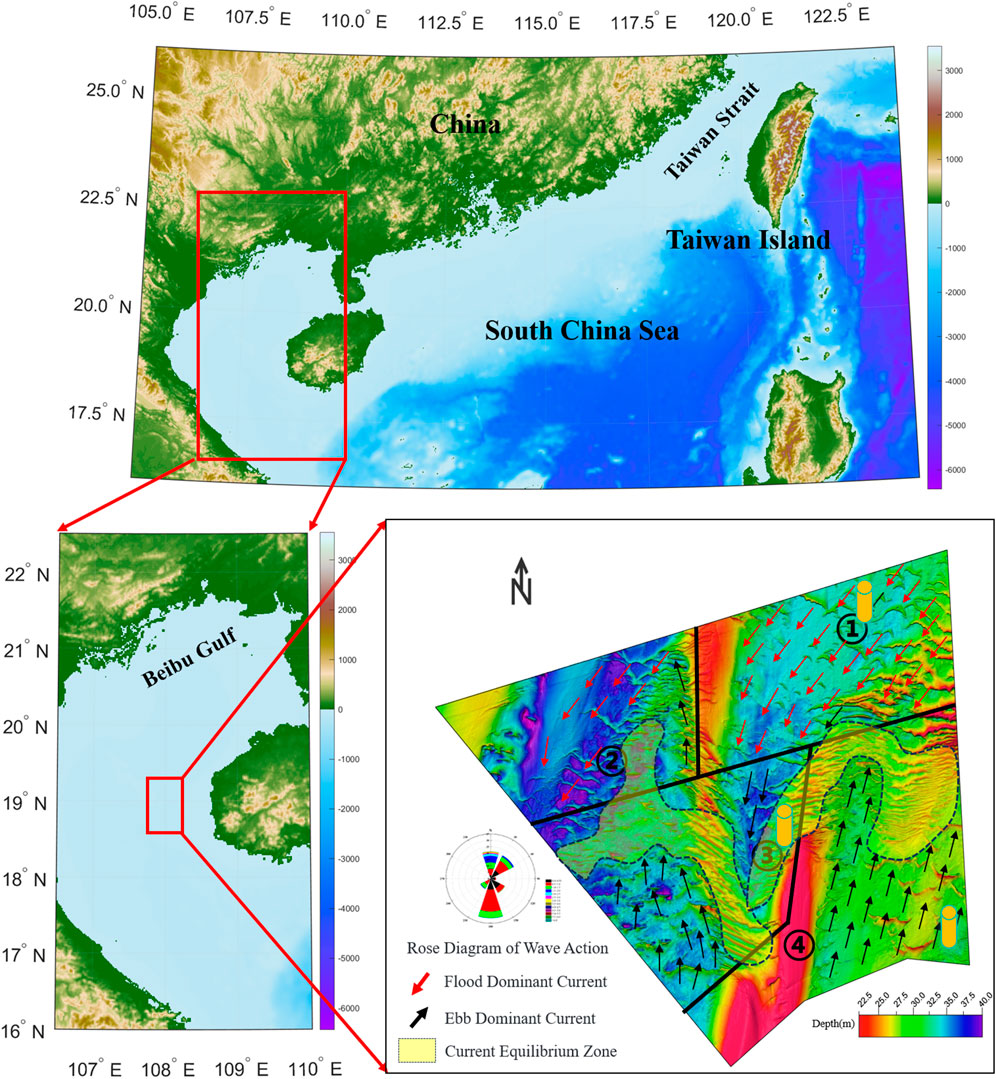
Figure 1. Schematic diagram of the study area in the western south China sea with bottom current and sand wave distribution.
Based on the analysis of Figure 1C, it was discerned that in the northeastern crescentic sand wave area of the study region, the bottom ebb tide flow is stronger than the flood tide flow, promoting the movement of the sand wave area and the symmetrical sand wave area in the northeast towards the southwest. Due to the absence of large-scale sand ridges serving as barriers, the bottom ebb tide flow develops in the SSW direction. In the troughs of sand ridges, the flow velocity is greater, exhibiting a stronger sediment transport capability. Loose sediments are transported along the troughs of less movable sand ridges, and in the central symmetrical sand wave area, they tilt towards the south, reaching a state of dynamic equilibrium and developing into linear sand waves. In the central region, the flood and ebb tide flows are comparable, resulting in very slow rates of sand wave migration, accompanied by extensive NW-SE-directed sand waves and sand ridges with regular cross-sectional morphology, symmetric or near-symmetric shapes, and steeper slopes. In the eastern part of the study area, a wide distribution of linear sand waves is observed. The western study region is characterized by an extensive underdeveloped sand wave area with limited supply of materials and absence of large sand ridges as barriers. In the southwest, scattered crescentic formations are developing northward, with the flood tide flow stronger than the ebb, causing the scattered sand wave areas to move northeastward. The southern area of the study region consists of large sand ridges with surface residual sediments and non-migratory sand ridges. The study indicates that the southern part once served as an ancient coastline, with the residual topography being reshaped during low water periods into stable deposition formations; the large sand ridge area is non-migratory (Ma et al., 2016). Integrating previous research, it was found that the mobility of the sand waves in this area was weak, exerting insignificant impact on the construction of offshore engineering structures.
In conclusion, the morphology, orientation, and distribution of the sand waves in the study area are closely linked to the hydrodynamic conditions and sediment supply circumstances of their respective regions, with dominant currents playing a pivotal role in shaping the seabed sand wave patterns. The characteristics of the sand waves vary by area, and the morphological features of the seabed sand waves can further reveal details such as the flow speed and direction of the bottom currents. For instance, in areas with dense, crescentic sand waves where flow speeds are faster, the impact of sand wave migration on the scour of wind turbine pile foundations and calculations of elevations cannot be neglected; whereas, in linear sand wave areas where sand wave flow is slower, the region can be considered stable for engineering construction. To accurately comprehend the evolutionary trend of sand waves and their environmental impact, we have divided the study area into four sections for further research, whilst also conducting detailed field observations and studies.
2.3 SPF-SWM calculation methods
2.3.1 Sediment transport calculation
The essence of seabed sand wave migration is sediment movement, primarily occurring through bed load transport and suspended load transport. In the sea bed, sediments that are not in motion are referred to as bed sediments. When wave or current flow velocities exceed the critical entrainment velocity, sediments move along the bottom through rolling, sliding, and saltation, and these sediments are considered bed load. Under conditions of low flow velocity or larger sediment particles, bed load transport is the predominant mode. However, when the intensity of waves and currents significantly exceeds the critical conditions for sediment entrainment, sediment particles are lifted off the bed and enter a suspended state, classified as suspended load. For fine sands under strong currents, the proportion of sediment carried in suspension is much greater than that carried as bed load. In this study, the migration rate of the sand waves can be calculated using the results from the multibeam surveys at the two time points, further allowing an assessment of elevation changes in the sand waves from a macroscopic perspective. (Figure 2).
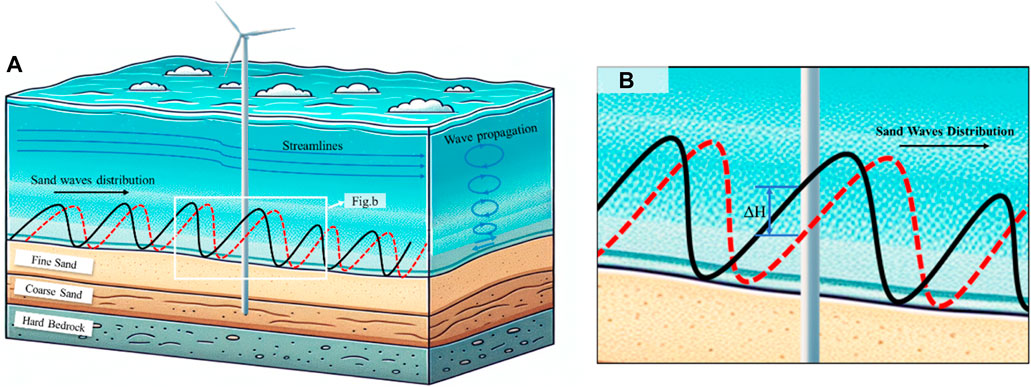
Figure 2. (A) Schematic diagram of sand wave migration and elevation changes. (B) Elevation change local magnification diagram.
The transport of bed load sediment is calculated using the empirical formula of Soulsby (1997):
where,
The calculation of suspended sediment transport adopts the advection-diffusion equation (Warner et al., 2008):
In the equation,
The elevation changes of the sand waves are based on the sediment mass conservation equation. The sediment transport calculation can be conducted in accordance with the actual circumstances of the three-dimensional flow field. The elevation changes of the sand wave seabed can be deduced using the sediment mass conservation equation.
2.3.2 Pile foundation scour numerical model
2.3.2.1 Model descriptions
In practical research, offshore wind turbine foundations are inevitably subjected to scouring effects, which manifest on a microscopic level. The front side of an offshore wind turbine foundation undergoes a horseshoe-shaped scour due to the impact of oncoming flows, leading to a depression. Part of the flow is accelerated as it contracts around the foundation’s large diameter, increasing the adverse pressure gradient and intensifying scouring at the sides. Vortices carrying sediment form behind the foundation, and as these vortices shed, the maximum scour depth can reach 1 to 1.5D (D being the diameter of the foundation), highlighting that scouring under large diameter piles remains significant (Figure 3). Currently, the CFD software Flow3D demonstrates good performance and convenience in handling micro-scale scour. Borsje et al. (2013) compared a constant vertical eddy viscosity model with a spatiotemporally variable k-ε turbulence model, and matched model results with field data on the length scale of sand waves. It was found that the vertical eddy viscosity model significantly overestimated the wavelength of the sand waves, whereas the k-ε turbulence model showed much better agreement with field data. This study establishes the RANS equations using the RNG k-ε turbulence model for closure, serving as the governing equations for the motion of incompressible viscous fluid around adjacent piles; thereby modeling the flow field more precisely.
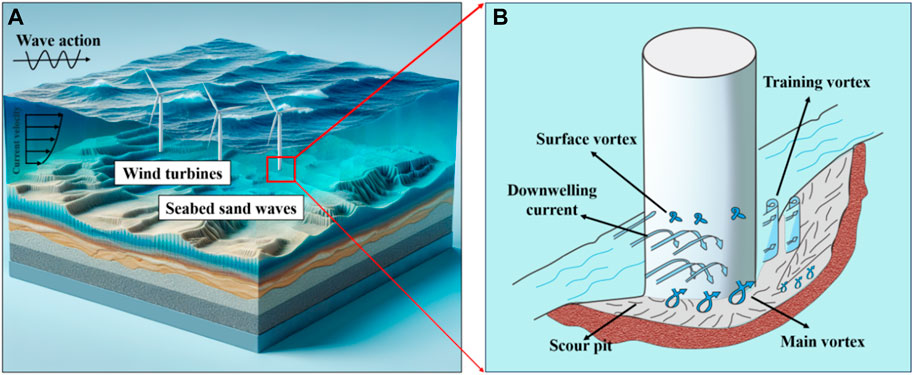
Figure 3. (A) Schematic diagram of offshore wind power distribution. (B) Schematic diagram of local scouring of pile foundation.
Continuity Equation:
Momentum Equation:
In the equation:
where,
2.3.2.2 Boundary conditions settings
The handling of free surfaces in the Flow3D software employs the Volume of Fluid (VOF) method for free surface tracking according to the Euler approach. The VOF method is widely used due to its excellent stability, simplicity, and clear distinction of tracked interfaces. It encompasses various boundary conditions, including non-flux Symmetry, Continuative, Specified Pressure, Grid Overlay, Wave, Wall, Periodic, Specified Velocity, Outflow, and Volume Flow Rate boundaries.
The Symmetry boundary is the default condition in Flow3D, indicating that there is neither flux nor shear at that boundary. This is particularly effective for simulating problems with symmetrical flow patterns, significantly reducing computational demand, and the results can be mirrored to represent the whole system. This condition can be applied to the side walls of both two-dimensional numerical wave flumes and three-dimensional numerical wave tanks, assuming the presence of fluid on both sides of the boundary and applying zero-gradient conditions with velocity perpendicular to the boundary set to zero. In our experiment, symmetrical boundaries are set before and after the model’s refined section. The Pressure boundary can be applied to both inflow and outflow boundaries and includes both hydrostatic and viscous boundaries. The specified boundary pressure is equal to the sum of dynamic and hydrostatic pressures at that location. A Viscous boundary assumes a large reservoir beyond the computational domain with pressure very close to that within the domain’s fluid, requiring the inflow fluid to start from zero velocity. This boundary condition is considered the most reasonable and representative of actual conditions. When the model includes a free surface, the dynamic boundary condition can be expressed as p-pa (where Pa is the atmospheric pressure). We set symmetrical boundaries before and after the model’s refined section for experiments. When establishing a “hot start” model, the Grid Overlay boundary is used; this condition takes the existing grid variable values at the boundary during a hot start, enabling the model to continue computations using existing results. A Wave boundary involves selecting a wave type at the interface and setting up a velocity field linked to that wave type. For experiments, we set wave boundaries at the wave flow inlet. At Wall boundaries, the fluid cannot pass through, and wall shear stress can be computed under given viscosity conditions. In our experiment, wall boundaries are set by default on both sides of the flow. A Volume Flow Rate boundary implies a specified flow rate at the boundary, while Periodic boundaries must be used in pairs, with fluid exiting one boundary reintroduced at its counterpart. A Specified Velocity boundary sets flow velocities in all directions and water surface elevations at the boundary, with velocity evenly distributed over the entire section, allowing for different velocities over time. Volume Flow Rate boundaries are also convenient to use; they primarily calculate the compressible flow by specifying the flow at the inlet.
The physical model boundary conditions set in our experiment are as shown in Figure 4. Besides specifying the boundary conditions, it is also necessary to define the initial values for all flow variables at each computational point within the flow domain. When setting the initial conditions, initial values are specified for all computational variables across the entire computational domain for each unit.
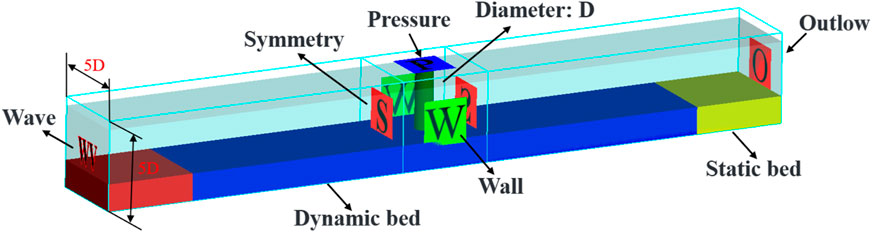
Figure 4. Model boundary conditions.
2.3.2.3 Grid and geometric condition division
Finite element simulation studies are conducted on the research area. To meet the requirements of space, time, and accuracy, employing a direct simulation that mirrors reality would significantly reduce computational efficiency. As a result, a method of nested grids and local refinement is used, employing coarser grids in larger areas and finer grids in areas of focus to ensure computational efficiency and accuracy. The study area utilizes a 1:50 scale ratio, and the Shields number is employed to ensure that the simulation experiments are consistent with the marine environment.
In the simulation experiments, numerical calculations of the pile foundation models in the study area were conducted under environmental conditions of wave and current, utilizing a nested grid size ratio of 1:50. The size of the outer grids is 8×1×1 m, with a grid count of 216,000, while the size of the inner grids is 1×1×1 m, with a refined grid count of 216,000, accumulating to a total grid count of 432,000. The fixed bed section is 1×1×0.3 m, and the moving bed section is 6×1×0.3 m.
2.3.2.4 Specific parameter settings
Four modules are activated in Physics: Sediment Scour, Gravity and Non-Inertial Reference Frame, Viscosity and Turbulence, and Density Evaluation.
Considering the lengthy coupled fluid-structure interaction computation time and the complexity of the structure itself, for simplicity, the soil is modelled as a uniform soil layer with a particle size of 0.1 mm and a density of 2,650 kg/m³. The critical Shields number is calculated to be 0.05 for this particle size and density, the drag coefficient and bedload coefficient are set at 0.018 and 8, respectively, the natural angle of repose is set at 32°, and the maximum deposition volume fraction is set at 64%. The bed roughness is set to a ratio of 2.5 times the median particle size d50.
The fluid is considered seawater, treated as a viscous fluid with a density of 1,050 kg/m³ and a viscosity of 0.00298; the compressibility coefficient is set at 5×10⁻¹⁰ (incompressible), and the turbulence model is set to the Renormalized Group model. The Wall Shear boundary is set to No-slip or Partial Slip. In the Output, the data interval is set at 5 s. In Numerics, the initial time step is set at 0.001 s, with a minimum time step of 1×10⁻⁷s and the computation time is set to 3600 s in the General section.
2.4 Model validation
Based on the physical model experiments by Roulund (2005), we established a sediment scour numerical model using the Flow3D software. In this model, the pile diameter is set at 0.1 m, the water depth at 0.4 m, and the flow velocity at 0.46 m/s, with a runtime of 60 min. The simulation results in the 90°direction in front of the pile correspond well with the actual physical model, reflecting the accuracy of the model calculations (Figure 5).
For model validation, we also utilized the measured data from the given region, setting the numerical model’s flow velocity at 0.92 m/s, wave height at 1 m, and the period at 7 s (refer to Table 1); concurrently, the wave length was set at 112 m. The approach flow direction in front of the pile was set at 90°, with the maximum scour depth at 90°, 135°, and 180°considered the pile’s own maximum scour depth (Figure 6).

Table 1. Comparison of real and simulated parameters and results.
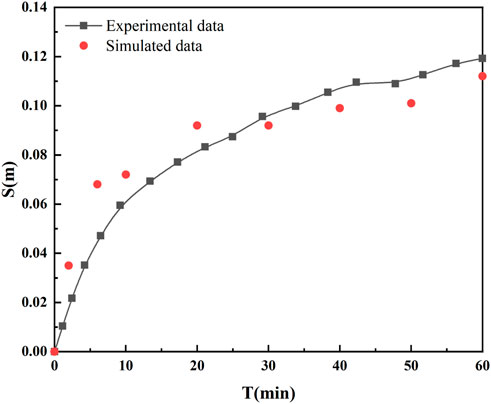
Figure 5. Comparison of physical model and numerical simulation results for scour depth in the 90° direction of the pile foundation.
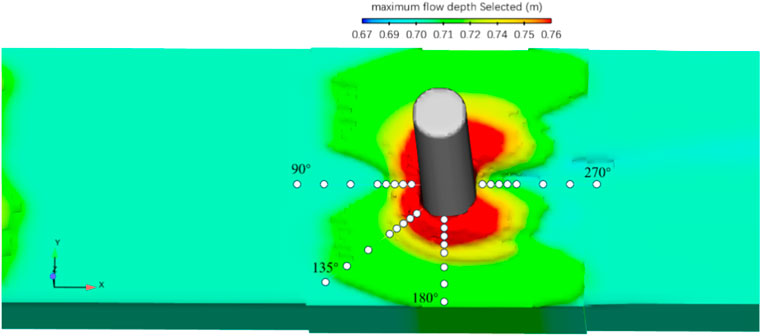
Figure 6. Diagram of Pile foundation scour simulation.
Extensive research has been conducted by predecessors on pile scour depths, yielding a plethora of formulas. Jones and Sheppard (2002) provided a scouring formula under tidal current conditions, which mainly applied to small-diameter cylindrical piles in fine-grained bottom sediments. Sumer and Fredsge (1992) established an empirical relationship between the equilibrium scour depth around cylindrical piles and the KC number through extensive measured data and linear fitting. They noticed that horseshoe vortices and wake vortices increase with higher KC numbers. However, this formula is unsuitable for the large-diameter piles in our study area. Li et al. (1994) examined large-diameter cylinders installed on a relatively fine sandy seabed in shallow seas where 0.07<h/L<0.28, or when the sediment size D50≤(0.04–0.05)D, and concluded that sediment size does not significantly affect the maximum equilibrium scour depth of local scour. Under these conditions, the authors provided a predictive formula for the maximum scour depth at the base seabed of isolated large-diameter cylinders (0.3≤D/L≤0.7) under the combined action of waves and currents. The proposed formula can predict the experimental values within a 30% margin of error. The scour formula is as follows:
where,
The scour depth result obtained using the above formula is 10.02 m, which is consistent with the simulated calculation results in Table 1, indicating the reliability of the numerical simulation calculations.
2.5 Actual scour depth calculation of Pile foundation
In their study, Hong et al. (2017) discovered that the scour depth at pile foundations under sand wave migration consists of two independent components: one resulting from the pile’s pier effect and the other from the elevation changes due to the movement of sand waves. In this paper, for calculating the actual scour depth of the pile foundation, on one hand, we define the inflow direction in the Flow3D software model at 90°and determine the final scour depths at 90°, 135°, and 180°directions by drawing three tangents and taking the maximum scour depth values found on these tangents. On the other hand, based on the operational period of offshore wind turbine pile foundations in the research area, we calculate the migration distance of sand waves and their elevation changes. Subsequently, we combine the sand wave elevation changes with the pile’s maximum scour depth to compute the temporal variation of the scour depth over time (Figure 7). Generally speaking, when the seabed material in the research area is dense coarse sand or clay, it is considered the maximum scour depth that the pile foundation itself can achieve.

Figure 7. Sand wave migration induced changes in pile foundation depth.
3 Results and discussion
3.1 Analysis of sand wave elevation changes
This paper utilizes a high-precision profile measurement method to determine the migration speed of sand waves. Taking the northeastern region of the study area as an example, a water depth profile of the northeastern part of the study area is extracted (Figure 8). The migration speed of the sand waves is measured by their displacement distance and time, yielding a calculated migration speed of 17 m/a at Profile A.
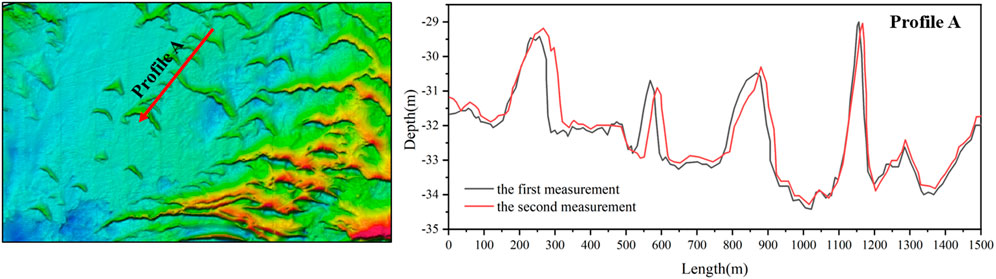
Figure 8. Calculation of sand wave migration speed in the northeastern part of the study area. (The red lines are survey results from November 2022 to January 2023. The blue lines are survey results from October to December 2021.)
The changes in sand wave elevation are closely related to the initial position, migration direction and speed of the sand waves, as well as the operational period of the pile foundation. Calculating the migration distance of sand waves within the operational timescale can effectively determine the risk zones and safe zones, which also influence the choice of the initial position of the sand waves. The migration direction and speed of sand waves are associated with the dominant currents and geological types at the bottom layer. In our study area, we selected three representative pile foundations for an actual measurement analysis of sand wave elevation changes (Figure 9), which mainly differ in the following aspects: 1) the direction of the dominant bottom layer current, which can be completely opposite; 2) the types of bottom layer sediments; 3) the maximum scour depths of the pile foundations. Through these three pile foundations, we calculated the changes in elevation due to the migration of sand waves under complex hydrodynamic conditions on offshore wind turbine pile foundations. The service life of offshore wind turbines in this research area is 25 years. Pile foundation No. 1 (Figure 9A), located in the central symmetrical sand wave zone of the study area and affected by giant sand ridges, experiences faster channel flow rates. The sand waves here migrate quickly to the southeast at a speed of 10.7 m/a, covering a horizontal distance of 227.5 m over the service period, with the water depth at the pile foundation increasing by 7.4 m. Pile foundation No. 2 (Figure 9B) is situated in the northeast part of the research area within the crescent-shaped sand wave zone; it is primarily affected by ebb-dominated current and migrates quickly toward the southwest at a speed of 13.1 m/a, travelling a horizontal distance of 402.5 m over the service period, and the water depth at the pile foundation decreases by 3.5 m. Pile foundation No. 3(Figure 9C) is located in the southeast part of the research area within the crescent-shaped sand wave zone; it is primarily influenced by flood-dominated current, with the sand waves migrating quickly to the northeast at a speed of 6.3 m/a, covering a horizontal distance of 77.5 m over the service period, and the water depth decreases by 1.7 m. Over this service period, the change in elevation is negligible.
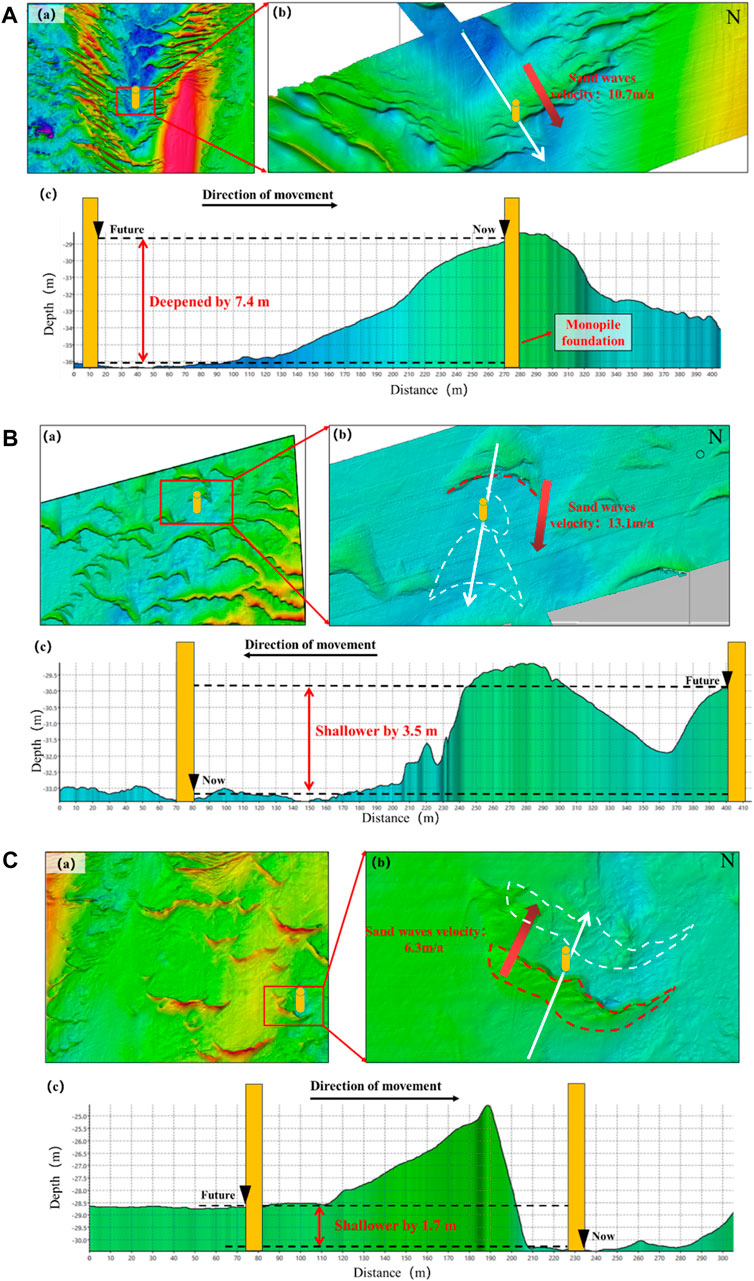
Figure 9. (A) Sand wave elevation changes in the middle of the study area. (B) Sand wave elevation changes in the northeast of the study area. (C) Sand wave elevation changes in the southeast of the study area.
Macroscopically, through calculations over the pile foundation’s service period, the elevation changes in these three sand wave affected areas within the study zone can potentially lead to three scenarios: a decrease in water depth, an increase in water depth, or no change in water depth. A decrease in water depth can have a protective effect on the pile foundation; an increase in water depth greatly extends the suspended length of the pile foundation, reducing its natural frequency, which can jeopardize the safety during its service life; no change in water depth represents the ideal conditions for the location and arrangement of the pile foundation.
3.2 Pile foundation scour analysis
Due to the constant occurrence of scouring at the pile foundation itself, the actual conditions of scour become complex and difficult to predict. With an average water depth of 30 m and a pile diameter of 10 m in the research area, based on the established numerical model, considering the symmetrical characteristics of the pile scour model, observation points are placed in different directions to observe the trend of scour depth changes over time (Figure 6; Figure 10).
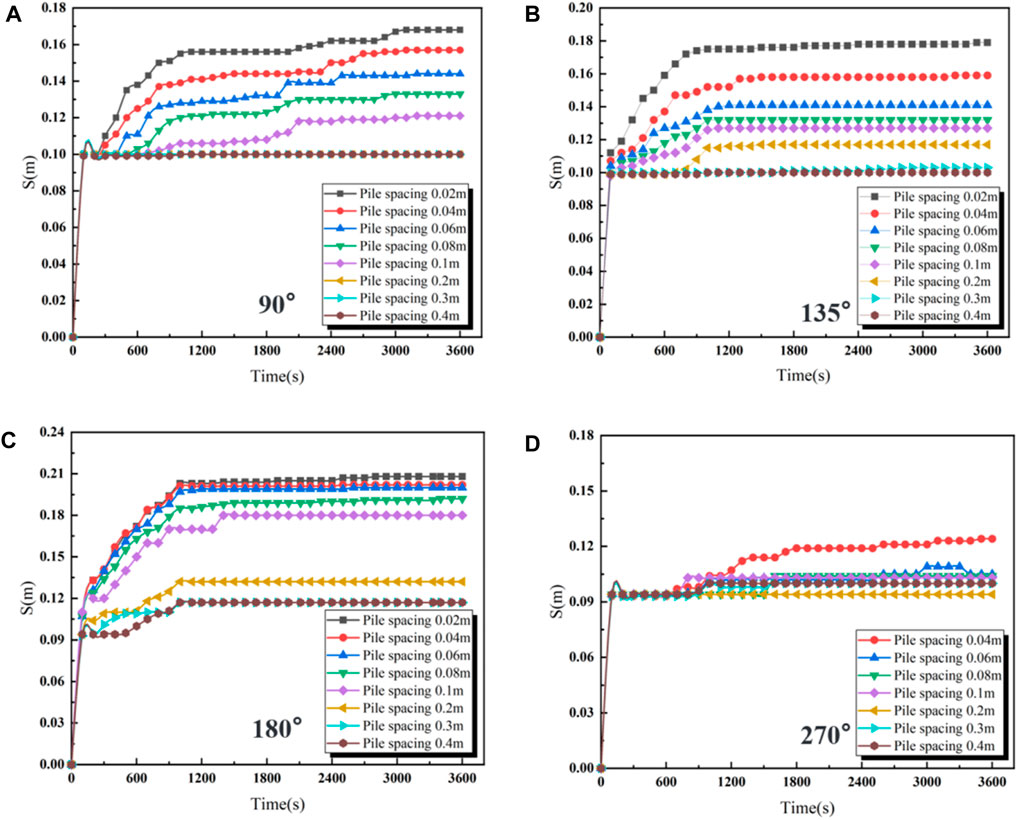
Figure 10. Schematic diagram of scour depth development under wave flow conditions ((A–D) correspond to the scour depth variations in the 90°, 135°, 180°, and 270° directions, respectively).
Upon observation (Figure 11), it was found that for the pile foundation at the angles of 90°, 135°, and 180°, the closer the distance to the pile, the more intense the scour and the deeper the depth, taking a longer time to reach equilibrium. Under the experimental conditions at 90°in front of the pile, the scour influence range is 0.5D from the pile, with negligible scour effect observed beyond this distance. The stages of scour development were divided as follows: a rapid development stage from approximately 0–900 s, a slow development stage from 900 to 3,000 s, and an equilibrium stage of scour from 3,000 to 3,600 s, with the time to reach a stable scour depth in front of the pile being the longest and scour depth changes noticeably tiered by pile distance. At 135°on the side of the pile, the influence range of scour is 1D, with a rapid development stage lasting about 0–1,000 s, followed quickly by a transition to a slow scour stage and then to an equilibrium stage. At 180°on the side of the pile, the impact range is the largest, with the deepest scour depth, with a lesser scour effect observed beyond 1D from the pile, extending to 2D; here too, the rapid development stage occurs around 0–1,000 s and quickly transitions to an equilibrium stage. At 270°behind the pile, overall scour is relatively unpronounced and less severe, suggesting that the transporting capacity of the wake vortex is limited. Scour reaches a slow and equilibrium state around 1800 s at a 0.2D distance from the pile, and beyond 0.3D, scour is quite stable overall.

Figure 11. Variations in maximum scour depth under wave-current conditions in different directions.
In summary, under experimental conditions at 90°, 135°, and 180°from the pile foundation, the rapid development stage of scour occurs around 0–1,200 s, where intense scouring happens within a short time frame before the scour reaches a stable equilibrium. The deepest scour is at 180°to the side of the pile, reflecting that the shear forces are stronger under a large diameter; the shallowest scour is at 270°behind the pile, indicating limited sediment transport by the wake vortex for large diameters. Based on Chiew (1984) and combined with the results of numerical simulation experiments, we qualitatively analyzed the different stages of sand wave migration and pile foundation scour (Figure 12). As a sand wave approaches the scour pit, the middle part first enters the pit, affected by the downdraft scour; the sand wave enters the scour pit and is rapidly scoured by the flow around the pile, moving forward quickly; the middle section of the sand wave enters the tailwater area where the flow rate is smaller, while the remaining parts of the sand wave continue moving at normal speed; the sand wave speed returns to normal as the waves on both sides catch up with the middle wave. According to our calculations, the maximum scour depth simulated in the study area is at the 180° direction from the pile side. Applying a numerical simulation and considering the actual 1:50 scale conversion relationship, the actual scour depth reaches 10.5 m. Consequently, by incorporating Figure 12, we can determine the overall maximum scour depth of pile foundations in the study area, with the deepest scour being 2 m in the northeast, 6.3 m in the northwest, 5.8 m in the southwest, and 4.0 m in the southeast.
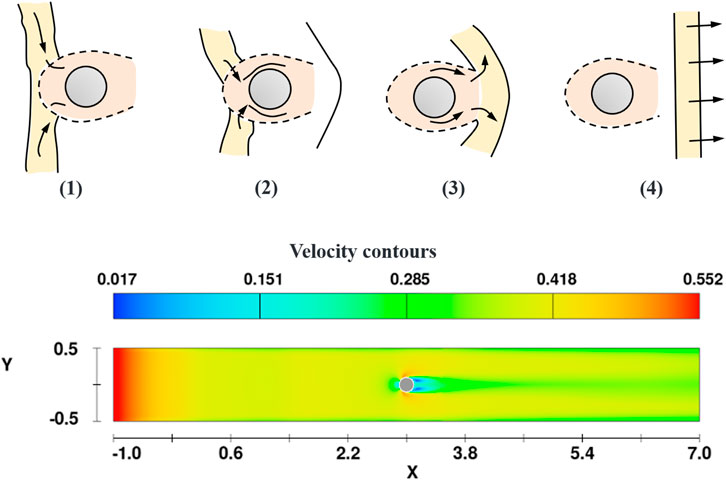
Figure 12. Different developmental stages of the coupled action of scouring on pile foundations under sand wave migration.
3.3 Analysis of Pile foundation scour under sand wave migration
In this section, by computing the migration distances and scour depth changes of the seabed sand waves in the wind farm area, we defined the hazard index for the pile foundations and demarcated hazardous areas around the different pile foundations, performing a risk assessment for all pile foundations in the study area.
The actual scour depth of the pile foundation is composed of the elevation changes due to sand wave migration as well as the inherent scour of the pile foundation itself. When the top layer of the sea bed consists of loose sandy soils, this layer can experience localized scour and sand wave movement under the action of sea currents; whereas, if the underlying layer consists of hard clay or dense coarse sand, it would be difficult for erosion to take place under the current sea current velocities, and can be considered the maximum depth reachable by localized scour. Assuming the service period of the pile foundation is N years, and N ≥ 1, we define the actual scour depth calculation formula as follows:
We delineate risk intervals in the research area and represent them with a risk coefficient
where:
Based on the distribution of topography and bottom current directions in the research area, it is considered to divide the area principally into four regions for sampling studies (Figure 13). Drilling samples of sediments reveal that the northeast of the study area (Region I) is predominantly covered by loose medium sand, with a strong sedimentary dynamic influence on the surface layer and a maximum scour depth of 2 m; the northwest part of the study area (Region II) mainly comprises silty clay and fine to coarse sand, with very hard brown-grey silt clay located below 6.3 m depth, hence this region’s maximum scour depth that can be reached is 6.3 m; the southwestern and central parts of the study area (Region III) consist of loosely to medium-dense fine to coarse sand, with a maximum achievable scour depth of 5.8 m; and the southeastern part of the research area (Region IV) characterized by dense to very dense fine to coarse sand marks the maximum scour depth at 4.0 m. In view of the rapid development of scour depth around pile foundations, over long time scales with N > 1, the abrupt scouring process time can be disregarded and considered as if the pile foundation has reached its maximum scour depth. Based on the aforementioned formula, a coupled analysis was conducted for the service period of three pile foundations—termed as Piles 1, 2, and 3, in the central, northeast, and southeast regions respectively—the results demonstrate: Pile 1’s actual deepening by 13.2 m, Pile 2’s actual reduction by 1.5 m; and Pile 3’s actual deepening by 2.3 m. Therefore, in the actual layout of offshore wind turbine foundations, further accurate amendments were made concerning the pile foundation embedment depths caused by changes in the sand wave elevations within the study area, necessitating targeted protection measures for different scouring conditions.
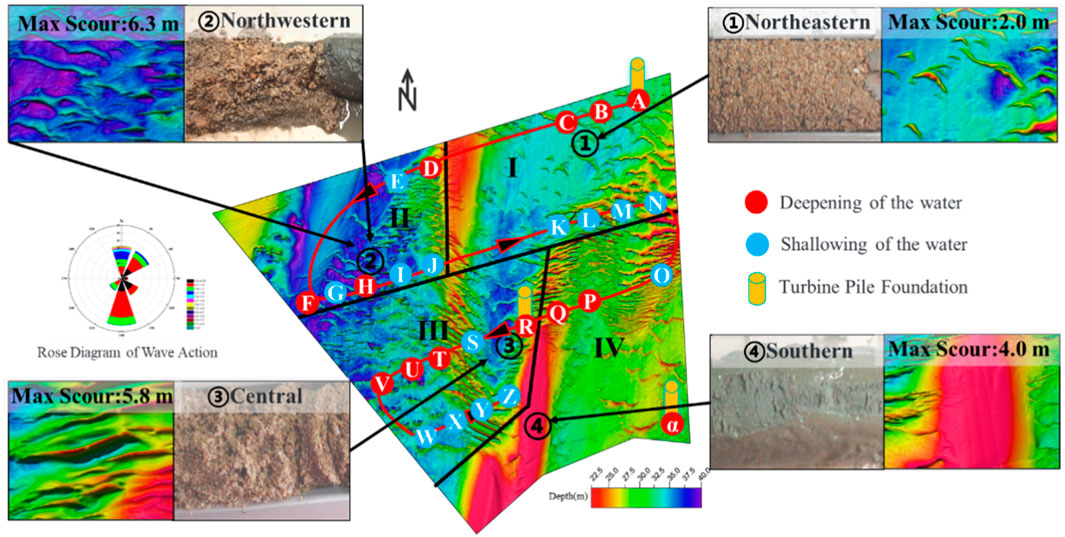
Figure 13. Research area zoning and changes in pile foundation water depth.
Prior to pile foundation construction, we conducted a risk assessment of the study area and delineated safe zones and risk zones based on the level of risk, implementing targeted protection for the pile foundations. Pile foundations 1 to 3 were taken as the subjects of our study, and we coupled the analysis of changes in sand wave elevation with the scour depth of the pile foundations themselves (Figure 14). Through coupled calculations, we discovered that at pile foundation 1, the risk coefficient is greater than 0, hence within the range of 268–435 m, there exist risk zones for the installation of wind turbine pile foundations. In practice, it is necessary to adopt conservative protective measures; at pile foundation 2, the regions from 0 to 10 m and from 50 to 80 m are within the safe zone, where protective measures may not be required, but the area from 10 to 50 m is a risk zone, which is unsuitable for constructing offshore wind turbine pile foundations. For pile foundation 3, within the range of 158–332 m, the risk coefficient is greater than 0, necessitating protective measures, whereas between 332 and 352 m, the risk coefficient is less than 0, and protective measures may not be necessary.
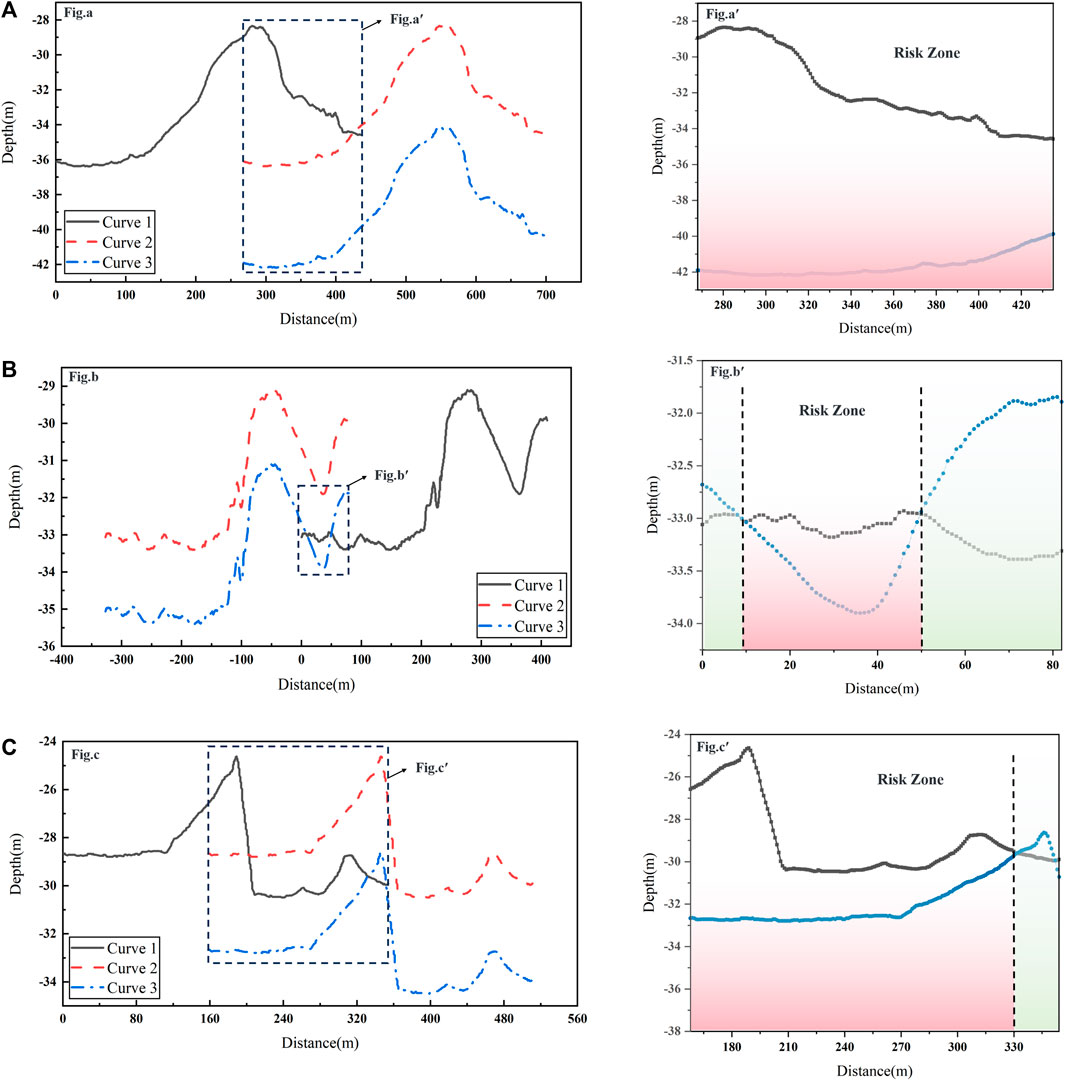
Figure 14. (A) Scour risk situation under the coupled effect for Pile 1 (Curve 1: initial sand wave profile; Curve 2: elevation change diagram of sand wave migration during the pile foundation’s service period; Curve 3: sand wave migration profile under pile foundation scour; the red color indicates risk zones, whereas the green color denotes safe zones.; the same below). (B) Scour risk situation under the coupled effect for Pile 2. (C) Scour risk situation under the coupled effect for Pile 3.
Through targeted analysis of the three pile foundations, we found that this calculation method not only can perform safety assessments of the pile foundations during their service life but also provides us with accurate and secure regional selection and delineation for our proposed study area. Based on this method of analysis, we conducted coupled calculations on all the pile foundations shown in Figure 15. This allows us to more accurately predict the changes in water depth in the study area during the service life of the pile foundations under the SWM-SPF conditions (Figure 15). It also enables us to specifically examine the safety of the pile foundations under the coupled conditions, which will be highly beneficial for the targeted protection of pile foundations during their service life.
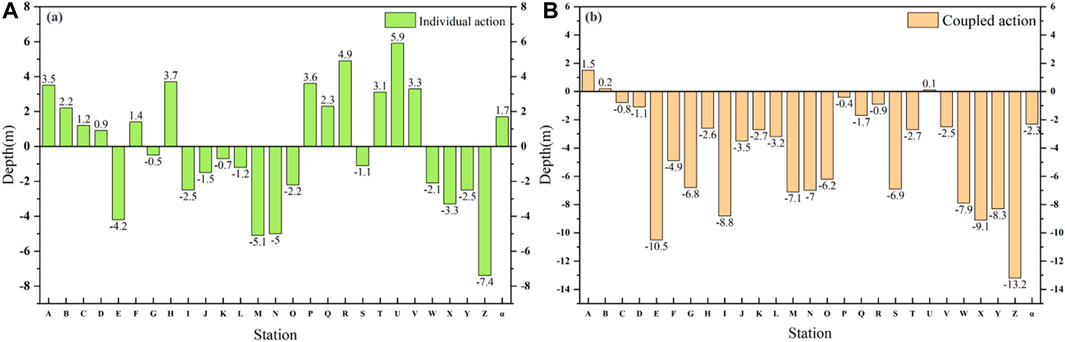
Figure 15. Comparative analysis of pile foundations in the research area before and after coupling (A) shows the changes in pile foundation elevation under sand wave migration; (B) depicts the changes in pile foundation elevation under SWM-SPF.).
4 Conclusion
In the research presented in this paper, the analysis of pile foundation scour under sand wave migration conditions was conducted mainly through the assessment of elevation changes associated with pile foundation scour and sand wave movement, utilizing data collection and analysis in the study area, along with numerical simulations and other research methods. The conclusions drawn from this study encompass the following aspects:
(1) Based upon the comprehensive data collected from sand waves in the research area of the western South China Sea, this paper analyzes the migration characteristics of the sand waves in the area. It was found that the morphology, direction of migration, and the distribution of the underlying current are intrinsically linked to the hydrodynamic conditions and sediment supply of the location. The dominant underlying flow plays a principal role in shaping the seabed sand waves in this region, which has led to the macroscopic delineation of engineering zones for site selection.
(2) Changes in elevation due to the migration of sand waves have resulted in variations in the burial depth of pile foundations within the study area. Using three pile foundations as examples, this text quantitatively illustrates the different elevation changes caused by migrating sand waves and analyzes the impact of these migrations on the safety over the life-span of various pile foundations, under macro conditions.
(3) The accuracy of scouring on pile foundation models was validated through numerical simulation computations. Based on in-situ measurements and geological data, the maximum scour depth of marine wind turbine pile foundations within the study area was calculated, establishing the range of influence of pile foundation scour. Additionally, the paper presents a qualitative analysis of the different stages of coupled interaction between sand wave migration and pile foundation scour.
(4) By coupling the analysis of sand wave migration elevation changes with pile foundation scour, the actual variations in the burial depth of pile foundations in designated areas were computed. This approach enables targeted risk assessments of the actual extent of scour during the service period of established pile foundations and facilitates the segmentation of risk zones and safe zones for pile foundation construction within the study area. It provides precise and informed site selection analysis for the construction of offshore wind turbine pile foundations.
Moreover, there are some shortcomings in this study. For instance, the local scouring mechanism under the combined action of waves and currents is complex, and theoretical research is still not mature, with empirical formulas still exhibiting some errors. It is recommended that monitoring of the local scour around the foundations of wind turbine units should be intensified before and after actual project construction, with protective measures taken in a timely manner. At the same time, the risk coefficient of the pile foundation is an important evaluation parameter. Due to the lack of long-term monitoring data on pile foundation scour depth, a more specific definition requires further study, but it still reflects to a certain extent the relationship between SWM-SPF and safe regions. Therefore, the establishment of SWM-SPF risk zoning system requires more objective and quantitative extensive field surveys and experiments on the coupling mechanisms. The work in this paper will provide new research ideas for the field of marine engineering.
Data availability statement
The raw data supporting the conclusion of this article will be made available by the authors, without undue reservation.
Author contributions
BX: Formal Analysis, Funding acquisition, Project administration, Supervision, Writing–review and editing. HS: Conceptualization, Data curation, Investigation, Writing–original draft. TL: Data curation, Project administration, Writing–review and editing. HT: Investigation, Software, Visualization, Writing–review and editing.
Funding
The author(s) declare that financial support was received for the research, authorship, and/or publication of this article. This study was supported by the “14th Five-Year Plan” Major Scientific and Technological Project of CNOOC, “Deep Sea Marine Environment Monitoring and Data Platform Research (KJGG 2022-0202)”.
Conflict of interest
Authors BX, HS, TL, and HT were employed by CNOOC Research Institute Co. Ltd.
Publisher’s note
All claims expressed in this article are solely those of the authors and do not necessarily represent those of their affiliated organizations, or those of the publisher, the editors and the reviewers. Any product that may be evaluated in this article, or claim that may be made by its manufacturer, is not guaranteed or endorsed by the publisher.
References
Borsje, B. W., Roos, P. C., Kranenburg, W. M., and Hulscher, S. (2013). Modeling tidal sand wave formation in a numerical shallow water model: the role of turbulence formulation. Cont. shelf Res. 60, 17–27. doi:10.1016/j.csr.2013.04.023
Campmans, G. H. P., Roos, P. C., Schrijen, E., and Hulscher, S. (2018). Modeling wave and wind climate effects on tidal sand wave dynamics: a North Sea case study. Estuar. Coast. shelf Sci. 213, 137–147. doi:10.1016/j.ecss.2018.08.015
Cao, G., Jiang, W., and Lin, M. (2021). A physically-modified spectral model for prediction of sand wave migration. Cont. Shelf Res. 230, 104573. doi:10.1016/j.csr.2021.104573
Cataño-Lopera, Y. A., and García, M. H. (2006). Geometry and migration characteristics of bedforms under waves and currents. Part 1: sand wave morphodynamics. Coast. Eng. 53 (9), 767–780. doi:10.1016/j.coastaleng.2006.03.007
Chavan, R., and Kumar, B. (2018). Prediction of scour depth and dune morphology around circular bridge piers in seepage affected alluvial channels. Environ. Fluid Mech. 18, 923–945. doi:10.1007/s10652-018-9574-z
Chiew, Y. M. (1984). Local scour at bridge piers. Ph.D. dissertation. Auckland, New Zealand: Univ. of Auckland.
Chiew, Y. M. (2004). Local scour and riprap stability at bridge piers in a degrading channel. J. Hydraul. Eng. 130, 218–226. doi:10.1061/(ASCE)0733-9429(2004)130:3(218)
Hong, J. H., Chiew, Y. M., Yeh, P. H., and Chan, H. C. (2017). Evolution of local pier-scour depth with dune migration in subcritical flow conditions. J. Hydraulic Eng. 143 (4), 04016098. doi:10.1061/(ASCE)HY.1943-7900.0001261
Hulscher, S. J. M. H. (1996). Tidal-induced large-scale regular bed form patterns in a three-dimensional shallow water model. J. Geophys. Res. 101 (C9), 20727–20744. doi:10.1029/96JC01662
Jones, J. S., and Sheppard, D. M. (2000). “Scour at wide bridge piers,” in Building partnerships, 1–10. doi:10.1061/40517(2000)408
Li, J. (2010). Research on seafloor sand wave migration and shallow stratigraphic structure analysis offshore dongfang. Hainan: Graduate School of the Chinese Academy of Sciences Institute of Oceanography. (in Chinese).
Li, L., Chen, S., Wang, W. C., Li, Y., Liang, H., and Yi, C. (1994). Experimental study on scouring of large-diameter cylindrical foundations under the joint action of waves and currents. China Offshore Platf., 159–164. (in Chinese).
Li, M. Z., and Amos, C. L. (1999). Field observations of bedforms and sediment transport thresholds of fine sand under combined waves and currents. Mar. Geol. 158, 147–160. doi:10.1016/S0025-3227(98)00166-2
Liu, Z. X., Xia, D. X., Bernè, S., KuiYang, W., Marsset, T., YuXiang, T., et al. (1998). Tidal deposition systems of China’s continental shelf, with special reference to the eastern Bohai Sea. Mar. Geol. 145 (3–4), 225–253. doi:10.1016/S0025-3227(97)00116-3
Ma, X., Yan, J., Hou, Y., Lin, F., and Zheng, X. (2016). Footprints of obliquely incident internal solitary waves and internal tides near the shelf break in the northern South China Sea. J. Geophys. Res. Oceans 121 (12), 8706–8719. doi:10.1002/2016JC012009
Max, C. (2013). Formation, evolution, and engineering significance of seabed sand wave sand ridges in the southwest sea area of Hainan Island. Qingdao, Shandong: Graduate School of Chinese Academy of Sciences Institute of Oceanology.
Meyer-Peter, E., and Müller, R. (1948). “Formulas for bed-load transport,” in IAHSR 2nd meeting, Stockholm, appendix 2. IAHR.
Morelissen, R., Hulscher, S. J. M. H., Knaapen, M. A. F., Németh, A. A., and Bijker, R. (2003). Mathematical modelling of sand wave migration and the interaction with pipelines. Coast. Eng. 48 (3), 197–209. doi:10.1016/s0378-3839(03)00028-0
Roulund, A., Sumer, B. M., Fredsøe, J., and Michelsen, J. (2005). Numerical and experimental investigation of flow and scour around a circular pile. J. Fluid Mech. 534, 351–401. doi:10.1017/S0022112005004507
Shan, H., Shen, Z., Liu, X., Wen, M., Zhu, C., and Jia, Y. (2017). Progress in research on classification and evolution of seafloor sand waves. J. China Ocean Univ. 47 (10), 73–82. doi:10.16441/j.cnki.hdxb.20160471
Soulsby, R. L. (1997). Dynamics of marine sands: a manual for practical applications. Oceanogr. Lit. Rev. 9 (44), 947.
Sumer, B. M., Fredsøe, J., and Christiansen, N. (1992). Scour around vertical pile in waves. J. Waterw. port, Coast. ocean Eng. 118 (1), 15–31. doi:10.1061/(ASCE)0733-950X(1992)118:1(15)
Van der Meer, F., Hulscher, S. M. J. H., and Dodd, N. (2008). On the effect of wind waves on offshore sand wave characteristics. Mar. River Dune Dyn. 1-3, 227–233.
Warner, J. C., Sherwood, C. R., Signell, R. P., Harris, C. K., and Arango, H. G. (2008). Development of a three-dimensional, regional, coupled wave, current, and sediment-transport model. Comput. geosciences 34 (10), 1284–1306. doi:10.1016/j.cageo.2008.02.012
Xia, H., Liu, Y., and Yang, Y. (2009). Features of internal waves in the submarine strong current of the northern South China Sea sand wave area and their effects on sand wave movement. J. Trop. Oceanogr. 28 (06), 15–22. (in Chinese).
Yong, L., Mian, L. I. N., Jiang, W., and Fan, F. x. (2011). Process control of the sand wave migration in Beibu Gulf of the south China sea. J. Hydrodynamics, ser. B 23 (4), 439–446. (in Chinese). doi:10.1016/s1001-6058(10)60134-5
Zang, Z. P., Xie, B. T., Cheng, L., He, F., and Zou, X. (2023). Numerical investigations on the transient behavior of sand waves in Beibu Gulf under normal and extreme sea conditions. China Ocean. Eng. 37 (2), 232–246. doi:10.1007/s13344-023-0015-5
Keywords: western South China Sea, sand wave migration, scour depth, coupling action, site selection analysis
Citation: Xie B, Sun H, Liu T and Tan H (2024) Investigation of the local scour depth of a pile foundation on the migrating sand waves seabed in the western South China Sea. Front. Earth Sci. 12:1404430. doi: 10.3389/feart.2024.1404430
Received: 21 March 2024; Accepted: 10 May 2024;
Published: 30 May 2024.
Edited by:
Bimlesh Kumar, Indian Institute of Technology Guwahati, IndiaReviewed by:
Xiaojing Niu, Tsinghua University, ChinaRutuja Chavan, Maulana Azad National Institute of Technology, India
Copyright © 2024 Xie, Sun, Liu and Tan. This is an open-access article distributed under the terms of the Creative Commons Attribution License (CC BY). The use, distribution or reproduction in other forums is permitted, provided the original author(s) and the copyright owner(s) are credited and that the original publication in this journal is cited, in accordance with accepted academic practice. No use, distribution or reproduction is permitted which does not comply with these terms.
*Correspondence: Botao Xie, eGllYnRAY25vb2MuY29tLmNu