 Pavel Serov
 Karin Andreassen
 Monica Winsborrow
 Rune Mattingsdal3
 Henry Patton
94% of researchers rate our articles as excellent or good
Learn more about the work of our research integrity team to safeguard the quality of each article we publish.
Find out more
ORIGINAL RESEARCH article
Front. Earth Sci. , 11 July 2024
Sec. Interdisciplinary Climate Studies
Volume 12 - 2024 | https://doi.org/10.3389/feart.2024.1404027
This article is part of the Research Topic Natural Methane Emissions in a Changing Arctic - Implications for Climate and Environment View all 16 articles
Due to tectonic uplift in the Cenozoic and numerous shelf-wide glaciations during the Quaternary, ∼1–2.5 km of sedimentary overburden has been eroded from the Barents Sea shelf, leading to the exhumation and partial uncapping of hydrocarbon accumulations. Widespread natural gas and oil leakage from the glacially eroded middle-upper Triassic reservoir directly into the water column has been documented at the Sentralbanken high in the northern Norwegian Barents Sea. However, it remains unclear whether the hydrocarbon leakage occurs only from the middle-upper Triassic reservoir units in geological settings exceptionally conducive to hydrocarbon leakage, or if other reservoir formations contributed to the release of hydrocarbons into the water column. It is also not clear whether complete erosion of the caprock is a prerequisite for widespread liberation of natural gas and oil from glacially eroded reservoirs across Arctic continental shelves. Here we analyze multibeam echosounder data covering ∼5,000 km2 and a suite of high-resolution P-cable seismic lines from a range of geological structures across the northern Norwegian Barents Sea. Our analyses reveal that ∼21,700 natural gas seeps originate from exhumed, faulted and variably eroded structural highs bearing a range of Mesozoic reservoir formations. All investigated structural highs fuel seabed methane release hotspots with no exception. Evident from observations of seismic anomalies, fluid accumulations are pervasive in the subsurface and likely to continue fuelling seabed gas seepage into the future. We also document that gas seepage through faults piercing overburden, caprocks and reaching potential reservoir levels is pervasive at all investigated structural highs. On the Storbanken high and the Kong Karl platform, such fault-controlled seepage is more prevalent than seepage from reservoir formations subcropping below the seafloor. Using a simple parametrization approach, we estimate that seeps identified within our multibeam data coverage produce a seabed methane flux of 61 x 107 mol/yr (9,803 ton/yr), which is one to two orders of magnitude higher than other globally known submarine methane seepage provinces. Fluxes of methane from sea water to the air above the thermogenic gas seep provinces in the northern Norwegian Barents Sea remain to be determined.
Methane (CH4) is the third most abundant greenhouse gas in Earth’s atmosphere after water vapor and carbon dioxide (CO2) and has a ∼25 times stronger greenhouse effect per molecule compared to carbon dioxide on a 100-year timescale. Understanding, quantifying, and mitigating its emissions has attained significant attention in recent decades. The lifetime of methane in the atmosphere is >10 times shorter than that of carbon dioxide, which makes it an increasingly important target for urgent anthropogenic emission reductions (Staniaszek et al., 2022; Shoemaker et al., 2013; Nisbet et al., 2020; Asadnabizadeh, 2022). While reducing anthropogenic emissions may lead to rapid 0.2°C reduction in warming by 2050 (CCAC, 2021), neither precise quantification of natural methane sources, nor discrimination between some categories of anthropogenic and natural sources has been achieved. Furthermore, a ∼30% gap remains between global methane emission assessments following a bottom-up approach, where discrete near-surface emission measurements are upscaled to larger areas, and those following a top-down approach where the contribution of individual sources is parceled from the bulk atmospheric methane reservoir (Saunois et al., 2020). Bottom-up assessments likely overestimate emissions due to the paucity of observational data, the temporal variability of sources, and inherent biases in near-surface measurements (Ruppel and Kessler, 2017; Vaughn et al., 2018). However, bottom-up assessments may provide precise discrimination of geographically overlapping sources or sources with similar isotopic characteristics of the emitted methane, and attempts to improve them remain important. Mapping natural methane emissions and tying them to settings conducive to the liberation of methane with a certain isotopic signature could be an important step towards more precise bottom-up assessments.
The ability of submarine-sourced methane to reach the atmosphere, such as from microbial production in bottom sediments, dissociating methane hydrates, thawing subsea permafrost, leaking petroleum basins, and submarine hot vents, is dampened by the anaerobic oxidation of methane in bottom sediments (Egger et al., 2018) and aerobic oxidation of methane in the water column. Because rates of methane oxidation may change in response to tidal cycles, currents and seasons (Steinle et al., 2015; Gründger et al., 2021) and an existing lack of systematic air measurements above submarine sources of methane, their contribution to the atmospheric budget remains highly uncertain (Masson-Delmotte et al., 2021). Furthermore, the global distribution of seabed methane discharge hotspots is still poorly known. New submarine methane emission sites continue to be discovered, including those in climatically sensitive polar regions in Greenland (Nielsen et al., 2014), offshore Svalbard (Mau et al., 2017) and Antarctica (Thurber et al., 2020). Recently, the formerly glaciated Barents Sea shelf has been documented emitting fossil thermogenic methane into the water column, a small fraction of which reaches the sea surface and is liberated into the air (Serov et al., 2023). Here, gas seepage correlates with structural highs exhumed close to the seafloor due to tectonic uplift in the Cenozoic and >40 highly erosive Quaternary glacial cycles removing ∼1–2.5 km sediments from the shelf (Lasabuda et al., 2021; Patton et al., 2022). Such naturally uncapped hydrocarbon reservoirs may release thermogenic gas with a heavy stable isotopic composition, similar to the composition of methane emitted during hydrocarbon production, refining and transportation yet different from methane microbially produced in bottom sediments and in the water column (Mao et al., 2024) which are depleted in heavy carbon and hydrogen isotopes (Whiticar, 1993, Whiticar, 1999). Thermogenic signature of sediment bound gas (δ13Cmethane = −50.8‰ ± 5.2‰ V-PDB (n=18)) has been revealed in samples from a periphery of a glacially eroded Sentralbanken high in the northern Norwegian Barents sea (Weniger et al., 2019). Paleo seepage of thermogenic gas has also been inferred from analyses of methane-derived authigenic carbonates in several locations in the Norwegian Barents Sea (Himmler et al., 2019). Understanding the geological settings conducive to the release of such thermogenic gas, and quantifying its fluxes to the water column, may be an important step towards deciphering the potential contribution of such natural sources to a total atmospheric pool of isotopically heavy and old methane carbon.
Although the spatial relation of seepage to exhumed structural highs has been shown, the migration pathways of fluids from shallow accumulations to the seafloor are poorly understood. It is also unclear whether seepage occurs through fractured or partly eroded cap rocks, what fraction of seepage is related to faults, and if overlying glacigenic deposits prohibit fluid discharge. A lack of knowledge on how hydrocarbons escape from the shallow subsurface prevents a prognosis of whether other uplifted and formerly glaciated continental margins may also leak thermogenic methane gas.
The northern Norwegian Barents Sea hosts several basins and numerous structural highs that together form an extensive petroleum province (Lundschien et al., 2023). The Norwegian Offshore Directorate in 2024 estimated that it may contain significant 1,125 million standard cubic meters of recoverable oil equivalents of undiscovered resources (Norwegian Offshore Directorate, 2024). However, the area is not open for petroleum activity (Figure 1) and information on its structural settings, stratigraphy, lithological and geochemical properties is scarce compared to the Norwegian Barents Sea south of the current limit for exploration at 74° 30’ N, where 49 hydrocarbon discoveries have so far been found.
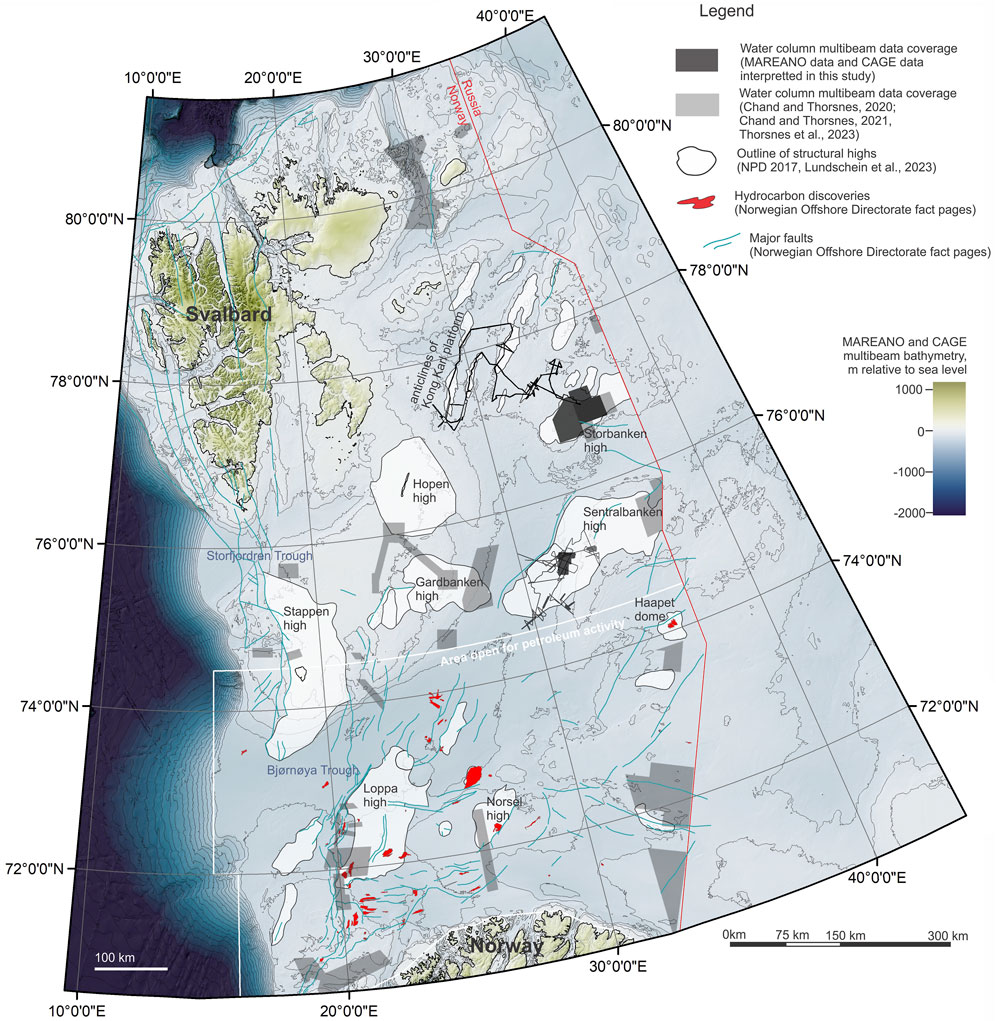
Figure 1. outlines of the main structural elements and relevant multibeam echosounder data coverage in the northern Norwegian Barents Sea. Seafloor and land topography is from GEBCO (Jakobsson et al., 2020). Multibeam echosounder data processed for this study is from the MAREANO program and the following research cruises: CAGE 18–1 (Plaza-Faverola, 2018), CAGE 19–2 (Andreassen et al., 2019), CAGE 20–2 (Patton et al., 2020), CAGE 21–4 (Winsborrow et al., 2021), CAGE 21–6 (Winsborrow and Knies, 2021), CAGE 22–6 (Serov et al., 2022).
Structural outlines of the northern Norwegian Barents Sea are defined by the Timanian and Caledonian Basement (Faleide et al., 2008). Regional extension in the Late Devonian–Carboniferous formed a system of NE-SW oriented rifts (Grogan et al., 1999) that were inverted by several episodes of compressional tectonism forming a suite of structural high and anticline structures. Inversion of the Sentralbanken and Storbanken structural highs, and large (up to 100 km long) anticline structures on the Kong Karl platform started in the Late Jurassic and continued during the Early Cretaceous and Cenozoic tectonic episodes. Due to erosion of Cenozoic and Cretaceous sequences in our study areas, some of the younger tectonic events of potential importance for the development of these structural highs cannot be dated stratigraphically. Nevertheless, more complete sediment successions in the southern Barents Sea (e.g., Fingerdjupet subbasin and Hoop fault complex) reflect systems of faults demonstrating rhomboidal or orthogonal pattern attributed to late Mesozoic–Cenozoic rifting (Collanega et al., 2017; Serck et al., 2017) Two important fault orientation previously reported in these areas are NE-SW inherited from Paleozoic rifting and NW-SE established in Cenozoic (Serck et al., 2017).
Petroleum systems of the northern Norwegian Barents Sea contain a suite of potential source rocks: Lower Carboniferous shales and coal (likely gas generating due to significant burial depth), upper Carboniferous and lower Permian carbonate-rich muds and marine shales (potentially oil-generating), and Olenekian, Anisian and Ladinian shales representing the most significant source rocks of the region. Due to tectonic uplift and glacial erosion in Cenozoic, the Triassic successions are currently located close to the seafloor and are partially visible on our seismic data. In the northern Norwegian Barents Sea, the Triassic strata host both, a potent source rock Steinkobbe formation and a suite of formations with reservoir qualities: Havert, Klappmyss, Kobbe and Snadd.
Sediment deposition in Triassic is largely defined by regional subsidence and progradation of a delta system sourced from the Ural Mountains. The Triassic delta system in the Barents Sea prograded to the northwest and reached the Sentralbanken high in the Induan and Svalbard in the Carnian (Riis et al., 2008; Høy and Lundschien, 2011; Klausen et al., 2019). On the Sentralbanken high and in the Olga basin, four progradational upward coarsening units have been identified: Havert, Klappmyss, Kobbe, and Snadd Formations. The three former of these formations have time equivalent organic rich shales of Seinkobbe formation deposited in marine conditions prevailing close to Svalbard. Deposition of marine shales prevailed when subsidence of the basing over-paced sediment deposition and caused delta front to retract. Thus, in Sentralbanken and Storbanken highs, the middle-upper Triassic succession represents an interbedding of organic-rich marine shales of Steinkobbe formation and coarser-grained Havert, Klappmyss and Kobbe formations. Kong Karl platform has not been significantly affected by the prograding delta and marine shales prevail. Snadd Formation is the most prominent and thick prograding sequence which deposited across the entire basin, including Kong Karl platform. Clastic sedimentation related to the delta system was interrupted by a regional transgression during the Norian, which corresponds to the deposition of shales of the Flatsalen Formation in the Barents Sea (Worsley, 2008).
Potential reservoirs may also occur in lower - middle Jurassic fluvial, deltaic and shallow-marine sandstones (Lundschien et al., 2023). The sandstones are overlain with middle-upper Triassic anoxic black shales of the Fuglen and Hekkingen Formations (Stemmerik and Worsley, 2005; Worsley, 2008). These organic-rich shales are immature in the northern Norwegian Barents Sea due to insufficient burial depth, but demonstrate good cap rock potential.
Outside the Kong Karl and Edgøya platforms and the Olga basin, Cretaceous strata are extensively eroded. Cretaceous successions preserved in these platforms and basins comprise silty shales and mudstones deposited in predominately open-marine conditions with turbidites and debris flows surrounding structural highs. Cenozoic sediments were subaerially eroded from the northern Norwegian Barents Sea shelf during the Neogene and at a faster rate by ice sheets during the Quaternary.
Thus, the elements of the petroleum systems that likely play a significant role in modulating shallow subsurface fluid flow in the northern Norwegian Barents Sea are source rock formation Steinkobbe, reservoirs in Havert, Klappmyss, Kobbe, Snadd formations and in lower-middle Jurassic sandstones. Middle-upper Triassic marine shale units (e.g., Flatsalen formation) and middle-upper Jurassic deep-marine organic reach shales (Fuglen and Hekkingen formations) may act as caprocks.
Due to the high acoustic impedance contrast between gas bubbles and sea water, submarine gas seeps are excellent targets for identification with multibeam echosounder sonars. For identifying gas seeps in the water column and mapping seafloor topography, we used multibeam echosounder data acquired during six research cruises onboard RV Helmer Hanssen and RV G.O. Sars conducted by CAGE–Centre for Arctic Gas Hydrate, Environment and Climate (Plaza-Faverola, 2018; Andreassen et al., 2019; Patton et al., 2020; Winsborrow et al., 2021; Winsborrow and Knies, 2021; Serov et al., 2022) and data provided by the MAREANO seafloor mapping program (Thorsnes et al., 2008).
All CAGE data sets were acquired with Kongsberg EM302 multibeam echosounders operated at 30 kHz nominal signal frequency and 120° opening angle encompassing 432 beams. A 120° opening angle provided off-track coverage of the seafloor ∼3 times greater than the water depth, while maintaining good resolution of the data (Figure 2). The ping rate automatically varied from 0.5 to 2 Hz depending on the water depth. During the research cruises, we regularly collected sound velocity profiles of the water column with an SBE 19plus CTD sensor to convert the acoustic signal travel time to water depth accurately.
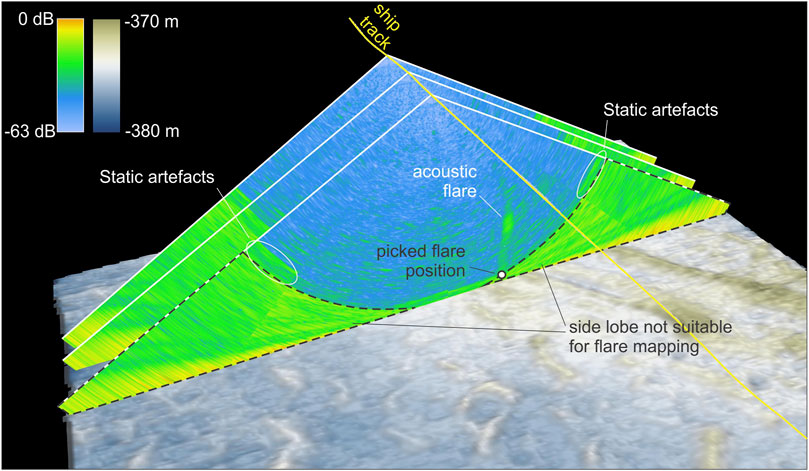
Figure 2. example of swath images acquired with Kongsberg EM302 echosounder.
MAREANO data were acquired by a third-party with Kongsberg EM710 multibeam echosounder system (see https://www.mareano.no/for details on data acquisition).
Backscatter data in the water column has persistent side lobe artefacts due to strong signal reflections from the seafloor on the peripheral sectors of the swath (Figure 2). These artefacts are inherent features of multibeam data regardless of the sonar model or acquisition settings and have been previously reported (Urban et al., 2017; Thorsnes et al., 2023). Parts of the swath affected by the side lobe artefacts are not suitable for reliable gas seep identification. Therefore, the footprint of the swath sector useable for gas seep detection in data acquired with both Kongsberg EM302 and Kongsberg EM710 echosounder systems, is ∼50% of the total footprint (Figure 2). For mapping gas flares across large areas without data gaps, a total swath overlap between parallel survey lines should be at least 30%. In the large MAREANO data set covering the Storbanken structural high, 88.2% of the total insonified area is suitable for gas flare detection. The CAGE 21–4 data set in Sentralbanken high also demonstrates 88.2% water column data coverage (Figure 11). Other CAGE data sets used in this study consist of discrete survey lines and do not intend to provide continuous spatial coverage (Figure 3). Of note, side lobe artifacts do not obstruct mapping seafloor topography and the entire swath width has been used to produce bathymetric maps.
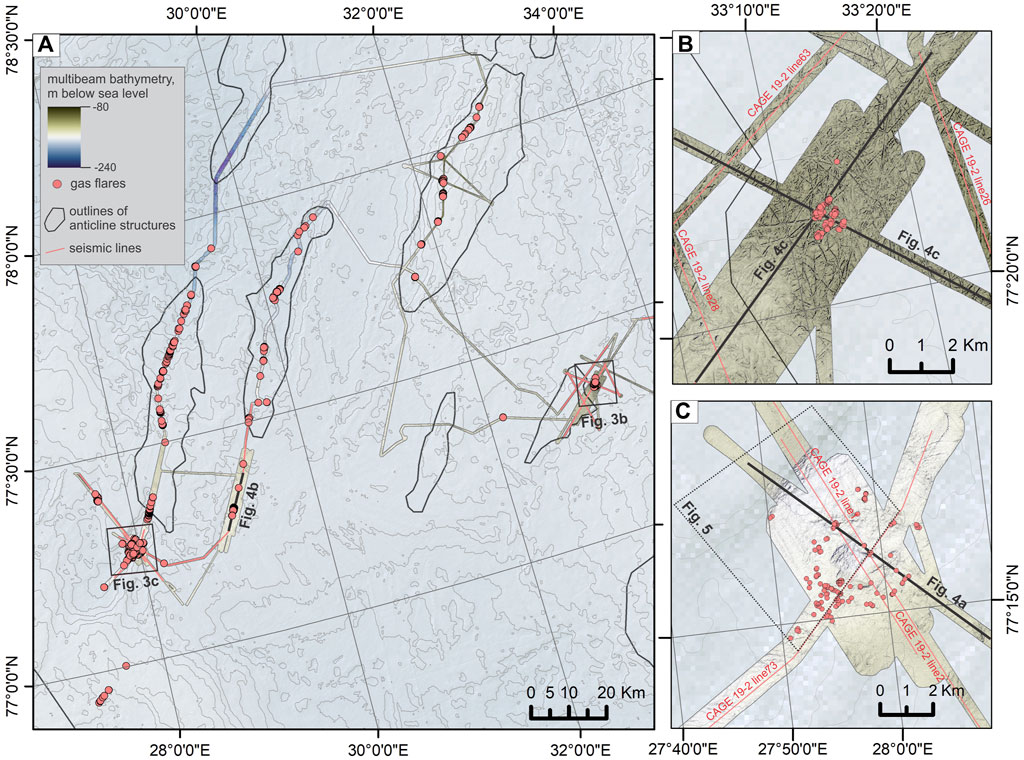
Figure 3. data coverage, gas seepage locations (Andreassen et al., 2019) and structural outlines (Lundschien et al., 2023) within Kong Karl platform. Background seafloor topography is from GEBCO (Jakobsson et al., 2020).
To compensate for ship movements, the transmit fans of the EM302 and EM710 echosounders are split in four sectors with independent steering. Because peripheral sectors have a slight ping offset compared to the central sectors, static artifacts occur near the seafloor (Figure 2). The static artifacts decrease the quality of data in the peripheral sectors of the swath, yet do not obstruct flare identification completely. In EM710 data, static artefacts are weaker and the sectors where they occur are narrower compared to EM302 data.
For processing and interpretation of echosounder data in the water column we used QPS FMMidwater software. To identify locations of gas flares we replayed all acquired lines in a single fan view’ and a fan view showing five consecutive fan images stacked together, which helped identify weaker acoustic signals. The coordinates of where the gas flares originate at the seafloor were picked manually with the geopicking tool (Figure 2). In cases of swath overlaps, flare coordinates were picked only at the first passage. Identified water column anomalies were categorized as weak, medium or strong based on raw amplitude of the anomalies and the appearance of the flares on echograms. All lines and all data sets were processed in the same manner, using uniform color scale and screen settings for better equability of interpretation.
To produce gridded seafloor topography from data acquired during CAGE research cruises, we used QPS Qimera software. During the processing, we applied static shifts, rejected outliers and removed pieces of data with a poor quality, such as data acquired during ship turns and sediment and water column sampling. MAREANO data is available for users in a gridded format already. Gridded seafloor topography data and picked locations of gas flares were subsequently imported to ArcMap software to produce maps.
To identify trends in the orientation of flare clusters we calculated the standard deviation of the flare coordinates x and y from the mean center using the Directional Distribution tool from the ArcMap toolbox (Figure 12).
We estimate the flux of free methane gas using a modified version of the simple upscaling method used by Sahling et al. (2014) and replicated by Ferré et al. (2020). Sahling et al. (2014) used a remotely operated vehicle on the formerly glaciated western Svalbard margin (240 m water depth) to find out that an acoustic gas flare on multibeam echosounder data represents six bubble streams on average. This is because the footprint of the multibeam echosounder at ∼240 m water depth is >4 m (1.7% water depth) and, thus, cannot parcel closely located bubble streams.
Lacking direct quantification of bubble release in our study areas, we rely on average gas flux of 17 ± 8 mmol/min (n = 15) from each bubble stream reported offshore Svalbard by Sahling et al. (2014). This well-known seep cluster has similar size to individual clusters within our study areas, similar seep density and is located at similar water depth of 240 m. In contrast to Sahling et al. (2014), we parametrize the gas fluxes based on a qualitative assessment of acoustic flare strength. Here we assume that a weak gas flare corresponds to one bubble stream, a medium gas flare corresponds to six bubble streams, and a large gas flare–to twelve bubble streams, with each of the bubble streams releasing 17 mmol of methane gas per minute.
We further estimate minimum and maximum methane fluxes accounting for large uncertainties in both the flux at each bubble stream and the number of bubble streams stacked in one acoustic gas flare. The minimum scenario assumes the lowest individual bubble stream flux of 9 mmol/min reported by Sahling et al. (2014) and that the weak, medium and strong flares represent one, two and three streams of gas bubbles, respectively (Table 1). The maximum scenario assumes the upper range of methane flux (25 mmol/min) at each bubble stream and that the weak, medium and strong flares represent two, eight and fifteen bubble streams.
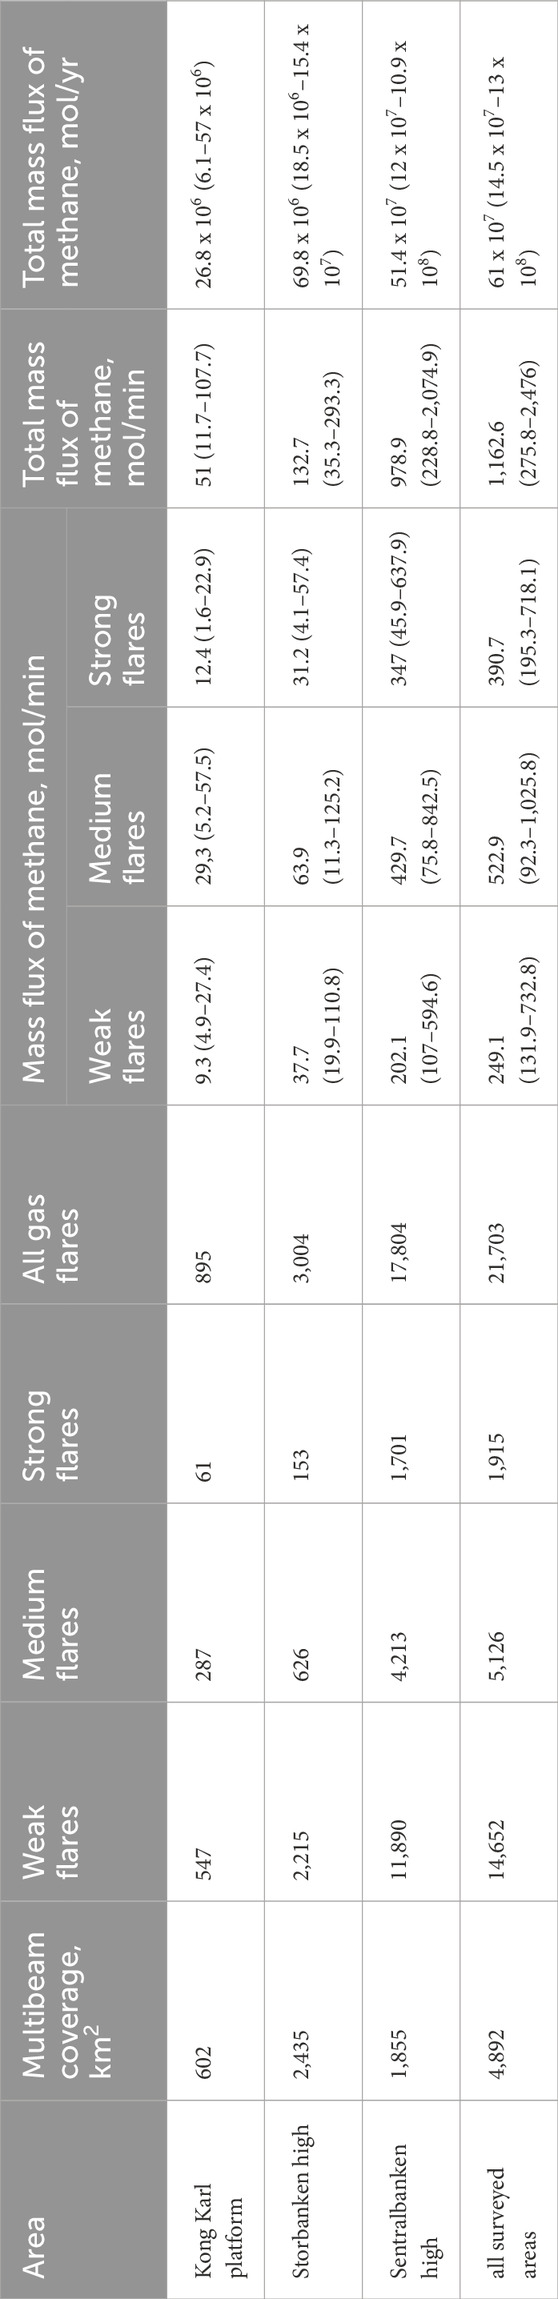
Table 1. tentative mass flux of free methane from the seabed into the water column at three investigated areas in the northern Norwegian Barents Sea.
Reflection seismic data was acquired in three research cruises: CAGE 18–1, CAGE 19–2, and CAGE 22–6. One or two generator-injector air guns were used as the seismic source and a 100 m long streamer with 32 channels separated by 3.125 m as the receiver. Shooting range, sampling rate and the number of guns varied between the surveys and are described in the respective cruise reports in detail (Plaza-Faverola, 2018; Andreassen et al., 2019; Serov et al., 2022).
The data was processed onboard using RadEx Pro software. All data have gone through simple bandpass filtering, bubble removal, normal moveout (NMO) correction and stacking, migration using Kirchhoff Migration Algorithm, post-migration filtering such as band-pass filtering, butterworth filtering, etc. and SEG-Y output (See cruise reports for more detail on seismic processing) (Plaza-Faverola, 2018; Andreassen et al., 2019; Serov et al., 2022). Seismic data was interpreted in Schlumberger Petrel software.
On Kong Karls platform we identified 895 gas flares within a ∼602 km2 seafloor footprint of useable multibeam echosounder data and where the water column was unaffected by side-lobe artifacts (see Methods for details on data acquisition, processing and interpretation) (Figure 3). All data were acquired during the CAGE 19–2 research cruise (Andreassen et al., 2019) in July 2019. The majority of identified gas seeps correlate to the outlines of the anticline structures previously established based on the network of conventional seismic lines (Lundschien et al., 2023) and boundaries identified on our new 2D seismic lines (Figure 4). The study area is located in water depths <200 m which results in a shallow first-seafloor-multiple reflection, limiting the thickness of interpretable seismic cross sections to 200–250 ms. This was sufficient to identify lower-middle Jurassic sandstone formations with reservoir potential, the upper Jurassic Hekkingen and Fuglen formations with good sealing properties, and the Cretaceous overburden (Figures 4, 5). Lower-middle Jurassic sandstone units are problematic to discriminate and correlate because they appear only within short fragments of seismic lines and are otherwise masked by the first-seafloor-multiple reflection (Figure 4).
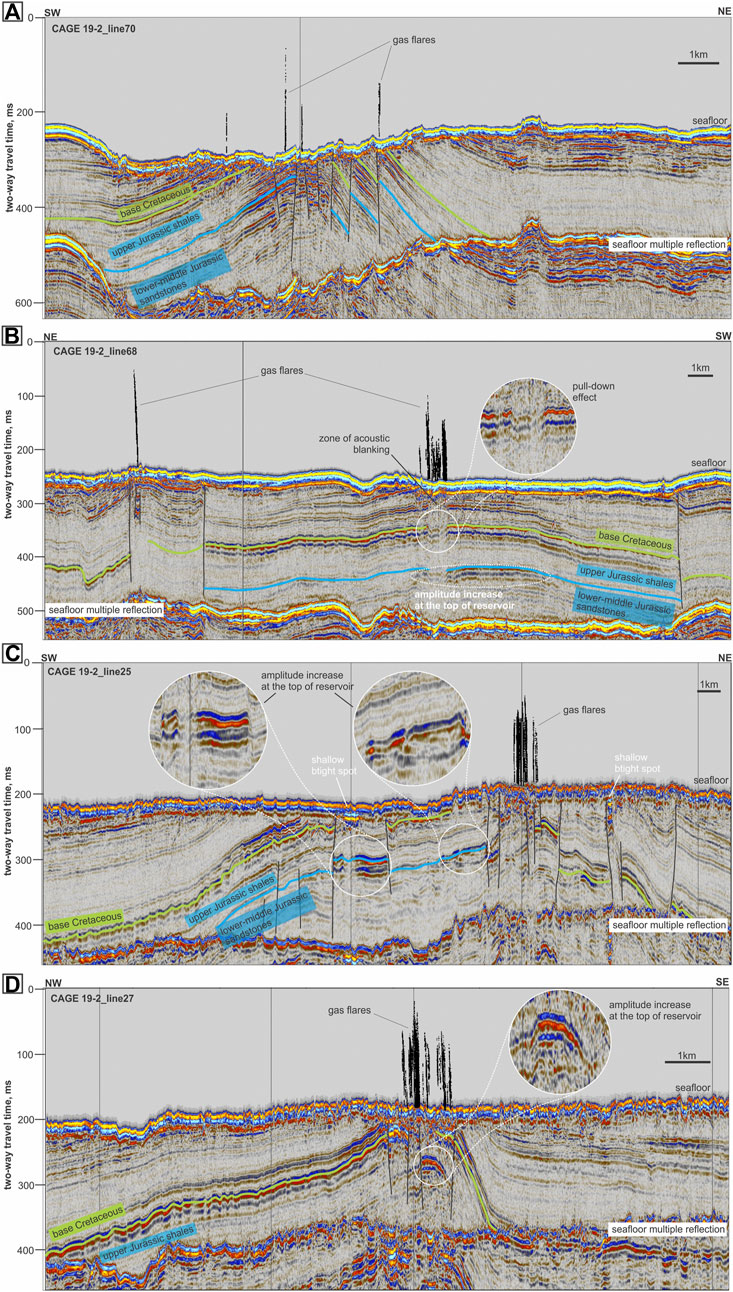
Figure 4. (A–D) P-Cable 2D seismic data and multibeam echosounder data showing evidence of gas accumulations and leakage into the water column on the Kong Karl platform.
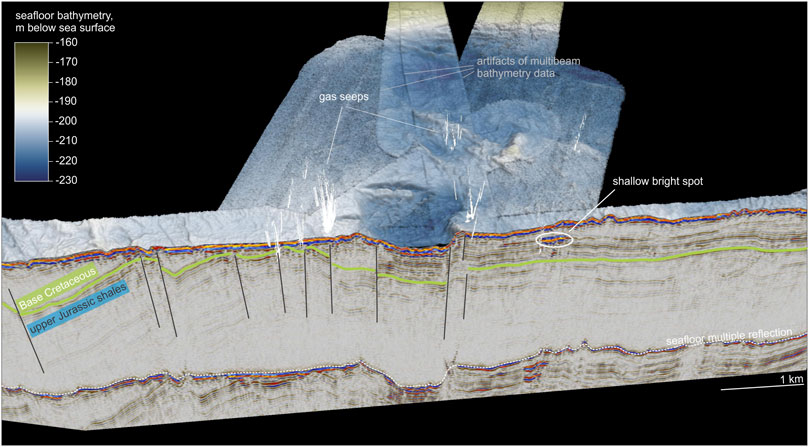
Figure 5. gas seepage surrounding the crater on the Kong Karl platform.
Different from the Sentralbanken structural high described by Serov et al. (2023), where the seismic data show that reservoir intervals of the Kobbe Formation presumably subcrop at the seafloor, on the Kong Karl platform we did not acquire seismic lines at zones where the Upper Jurassic cap rock has been fully eroded. The most prominent gas seepage clusters relate to faults piercing lower-middle Jurassic sandstones overlain by a seal of upper Jurassic shales of Hekkingen and Fuglen formations and Cretaceous overburden (Figures 4, 5). The highest seep density we observed in such settings is at least an order of magnitude lower than in Sentralbanken (Serov et al., 2023).
Within anticlines, upper sections of middle Jurassic sandstones exhibit 0.2–2.5 km wide amplitude enhancement zones (Figures 4B–D) pointing towards fluid accumulations. The enhanced reflectors appear within tilted blocks isolated with juxtaposition seals. Bright spots likely related to fluid accumulations also occur in the overburden at the hinges of the anticline structures (Figure 4C). A suite of shallow faults in the overburden and deeper faults penetrating to the reservoir level correlate well with the seafloor seeps.
The capping potential of upper Jurassic shales and Cretaceous overburden appears to be compromised without visible faulting in at least one location (Figure 4B). Here a 6 km wide anticline structure (potentially a four-way closure structure) containing middle Jurassic sandstone with enhanced reflection fuels a pronounced vertical zone of acoustic blanking, leading to a cluster of seafloor seeps (Figure 4B). The acoustic blanking zone features push-down of the reflectors likely due to the presence of free gas, which lowers the seismic velocity. Available data suggest that the upper Jurassic seal has been breached leading to the escape of fluids from the accumulation in the middle Jurassic sandstone reservoir.
A prominent seafloor depression of ∼1 km in diameter and 20 m deep is located on the southern part of a large NE-SW trending anticline (Figure 3C; Figure 5). The depression has similar dimensions and morphology to the craters in the Bear Island Trough (Andreassen et al., 2017; Waage et al., 2020). Resonating with findings of Waage et al. (2020) and Andreassen et al. (2017), the depression represents a small graben and its walls are delimited by normal faults. Gas seepage corresponds to the faults framing the graben, while no free gas is found liberating from its bottom (Figure 5). The seafloor at the Kong Karl platform is densely scattered with iceberg ploughmarks (Figure 3B) and we see no indications of pockmarks, pingo-like features or any other common seafloor manifestations of fluid release.
Excellent spatial coverage of multibeam echosounder data on the Storbanken high (Figure 1) acquired by MAREANO (Thorsnes et al., 2008; Bøe et al., 2022) allows for precise outlining of gas seep clusters. Here the footprint coverage of multibeam echosounder data suitable for gas seep identification is ∼90% of the total insonified seafloor area. We identified 3,004 gas seeps, most of which form elongated clusters with two orientations normal to each other: NE-SW and NW-SE.
Seismic and multibeam water column data interpretations suggest that NW-SE trending clusters are fault controlled (Figure 7). Notably, MAREANO multibeam data reveals seafloor lineaments which correlate to faults mapped on 2D seismic data and gas seepage occurs along these (Figures 6B,C, 7). The lineaments are unlikely to be mistaken with glacial lineations because the latter have distinctively different orientation evident from both our data (Figure 6D) and literature (Sejrup et al., 2022). Within the NW-SE trending seep clusters, the gas flares correlate well to the fault lineaments. In the absence of such visible lineaments, gas flares often form distinctive linear clusters of the same orientation (Figure 6D). We found that 1,309 gas seeps (43.5% of total number observed in Storbanken) relate to this NW-SE trending generation of faults.
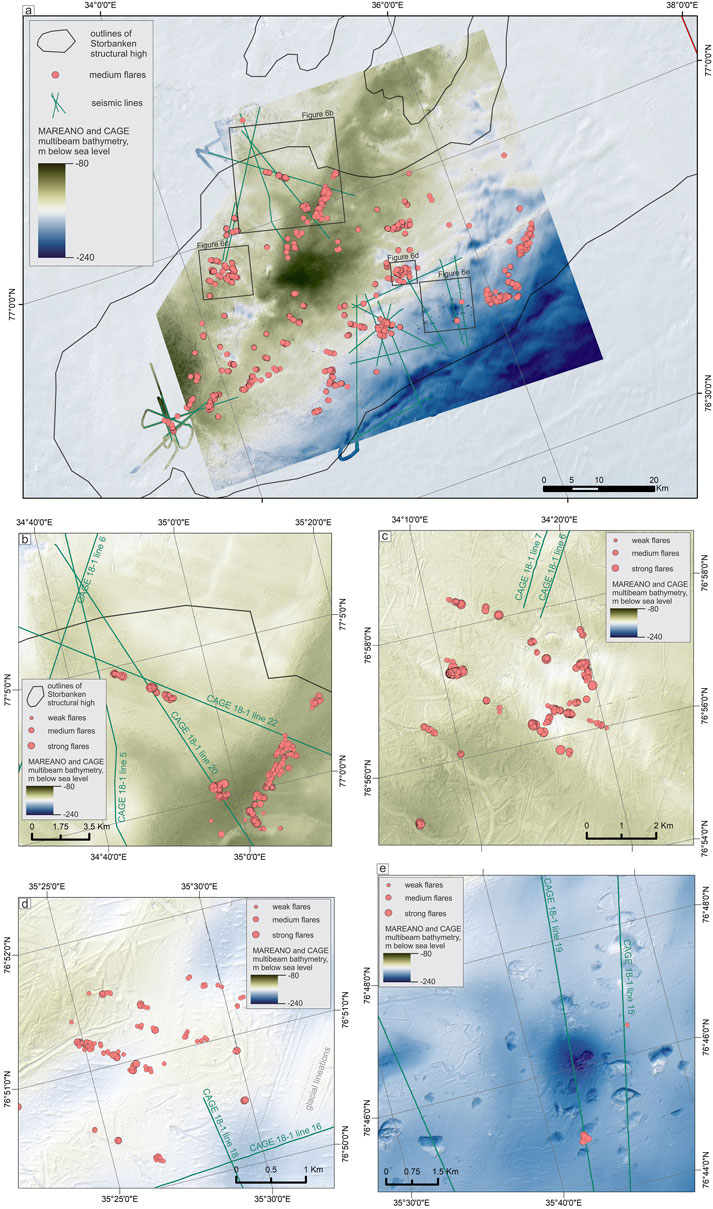
Figure 6. (A) The distribution of gas flares on the Storbanken high and locations of seismic lines. Multibeam echosounder data was acquired by the MAREANO project (Thorsnes et al., 2008) and the CAGE 18–1 research cruise (Plaza-Faverola, 2018).; (B–D) elongated seep clusters on the Storbanken high; (E) gas seeps snd seafloor depressions on the Storbsnken high.
NE-SW oriented seep clusters appear to be controlled by exhumed, and subcropping, lower-middle Jurassic and upper Triassic rocks with potential of bearing hydrocarbons (Stø and Snadd Formation, respectively) (Figure 7; Figure 8A, B). The Jurassic reservoir within several large, uplifted blocks contains a prominent flat spot seismic anomaly extending for >6 km (Figure 7). The flat spot is indicative of a high acoustic impedance contrast on the boundary between gas-saturated porous rocks (above) and liquid-saturated porous rocks (below) (Gluyas and Swarbrick, 2021). Seepage from the faults between the blocks is hampered (Figure 6B; Figure 7) and the shallow fluid accumulation might be sufficiently sealed.

Figure 7. Seismic line ‘CAGE 18–1 line 05’ (Plaza-Faverola, 2018) showing a flat spot seismic anomaly, combined with seafloor topography and gas flares (MAREANO data).
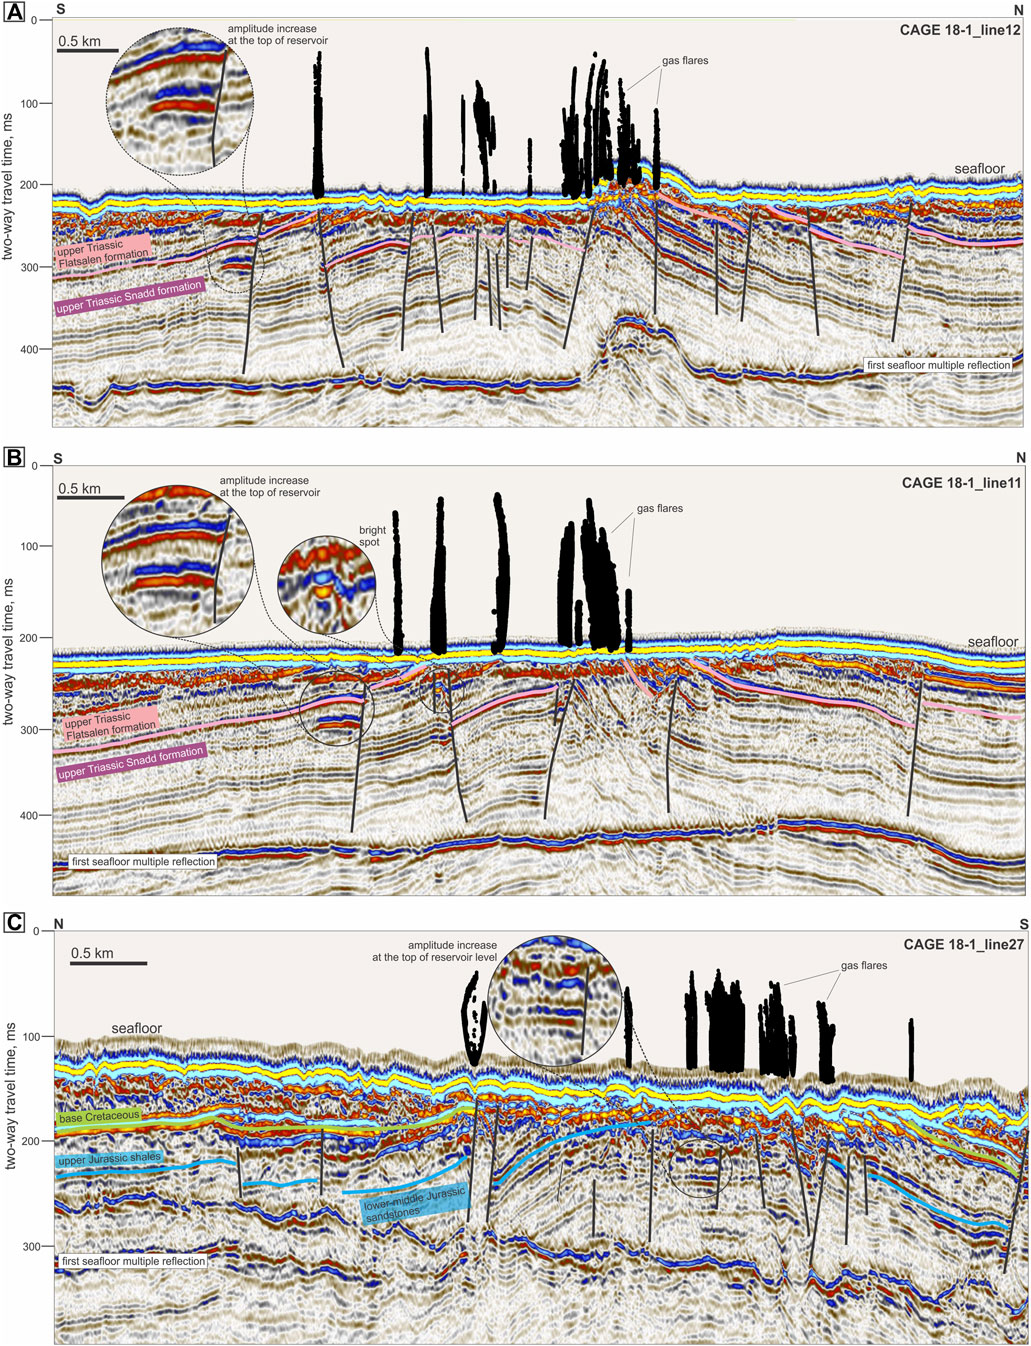
Figure 8. (A–C) P-Cable 2D seismic data and multibeam echosounder data showing evidence of gas accumulations and seepage into the water column at Storbanken high.
In total, we attributed 541 seeps (18% of the total number) to NE-SW oriented clusters associated with subcropping Triassic and Jurassic sandstones with reservoir qualities. Seafloor bathymetry does not reveal any distinctive lineaments or other seabed features associated with subcropping of the lower-middle Jurassic and upper Triassic reservoir units, apart from one occasion where an uplifted block of upper Triassic sandstone strata forms a mound 800 m in diameter and ∼15 m high (Figure 8A). Gas seeps are strictly linked to the flank of the mound, where the upper Triassic sandstone reservoir outcrops. Unlike submarine gas hydrate pingos reported at several locations on the Barents Sea shelf (Andreassen, 2016; Serov et al., 2017; Serov et al., 2023), the mound is composed of lithified sedimentary rocks. As gas seepage is strictly limited to subcropping sandstone reservoirs, and the mound represents an uplifted and tilted block of sedimentary rocks, it is unlikely that its genesis is driven by fluid flow. Both seafloor seepage and the mound itself are likely a result of the tectonic evolution of the area and its erosional history leading to exhumation of gas-bearing strata onto the seafloor.
Southern sectors of the Storbanken high for the first time described in Nixon et al. (2019) exhibit a group of 35 seabed craters (Figure 6A, E; Figure 9) resembling craters in the Bear Island Trough (Andreassen et al., 2017) and a crater we found on the Kong Karl platform. The craters are 200–600 m in diameter and 3–15 m deep. They have sharp edges, steep walls, often flat bottoms, and are engraved in lithified upper Triassic sedimentary rocks. These characteristics make them distinct from seafloor pockmarks occurring in soft sediments, which tend to have smoother edges and gentler walls (Judd and Hovland, 2009). Seven gas seeps forming two groups occur within the Storbanken crater field (Figure 9). The seepage is related to faults piercing the upper Triassic cap rock formation and reaching the sandstone unit of the Snadd formation (Figure 9A). Available seismic data indicate that the crater walls correlate with shallow and deep faults striking through 50 to >300 ms of seismic cross sections (Figure 9A). Blocks of Triassic strata beneath the craters are often subsided and tilted (such as the craters 1, 2,3,6 on Figure 9A), yet on some occasions do not clearly correspond to subsidence and are underlain by flat basal reflectors (crater 5). Nevertheless, shallow faults correlate to the walls of such craters. Our observations alone cannot rule out possible contribution of gas blow-out events upon destabilization of subglacial gas hydrates proposed in Andreassen et al. (2017) But tectonic processes have likely played a major role in crater formation as all craters correlate to faults and some are surface manifestations of deeper graben or half-graben structures. Notably, the entire 55 km2 crater area in Storbanken hosts only seven seeps, which is significantly lower than both the average seep density in the mapped Storbanken area and the seep density in the Bear Island Trough crater area (Andreassen et al., 2017; Waage et al., 2020).
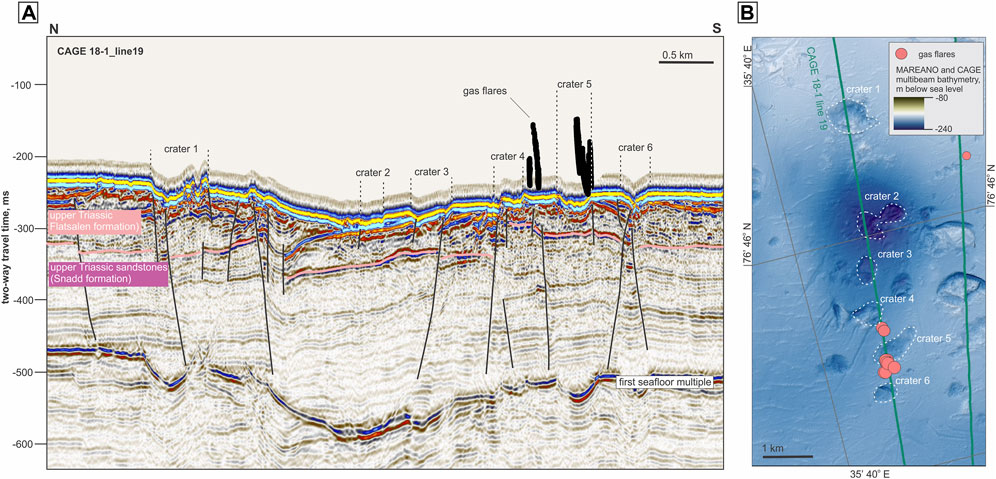
Figure 9. Geological controls of seafloor craters on Storbanken high. (A) fragment of a seismic line CAGE 18–1 line 19 crossing six seafloor craters; (B) location of the seismic line and gas flares on seafloor topographic map.
Serov et al. (2023) reported extensive seafloor hydrocarbon gas and oil release in the central part of the Sentralbanken high. Here we use new multibeam echosounder data with sufficient continuous spatial coverage to estimate the total number of gas seeps and outline seep clusters in detail (Figure 11). We focused our mapping on the central part of the structural high where seismic data previously indicated 2–5 km wide zones where the middle Triassic Kobbe formation with reservoir potential subcrops at the seafloor (Serov et al., 2023). Other zones of the structural high have been characterized with discrete survey lines only and lack continuous spatial data coverage (Figure 10).
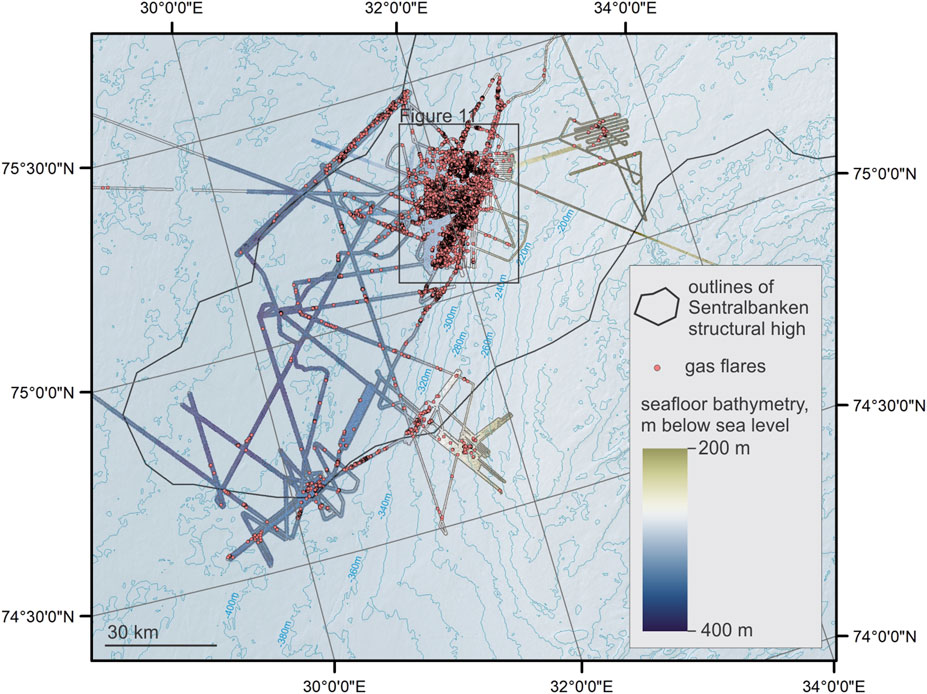
Figure 10. Data coverage and distribution of gas glares in Sentralbanken high. Data were acquired in CAGE 20–2 (Patton et al., 2020), CAGE 21–4 (Winsborrow et al., 2021), CAGE 21–6 (Winsborrow and Knies, 2021) and CAGE 22–6 (Serov et al., 2022).
Our results show that 15,105 acoustic gas flares (73% weak, 23% medium and 4% strong) occur within the 465 km2 polygon at the hinges of the eroded structural high (Figure 11). The entire data set from Sentralbanken (Figure 10) reveals 17,804 acoustic flares within 1,855 km2 of water column multibeam data.
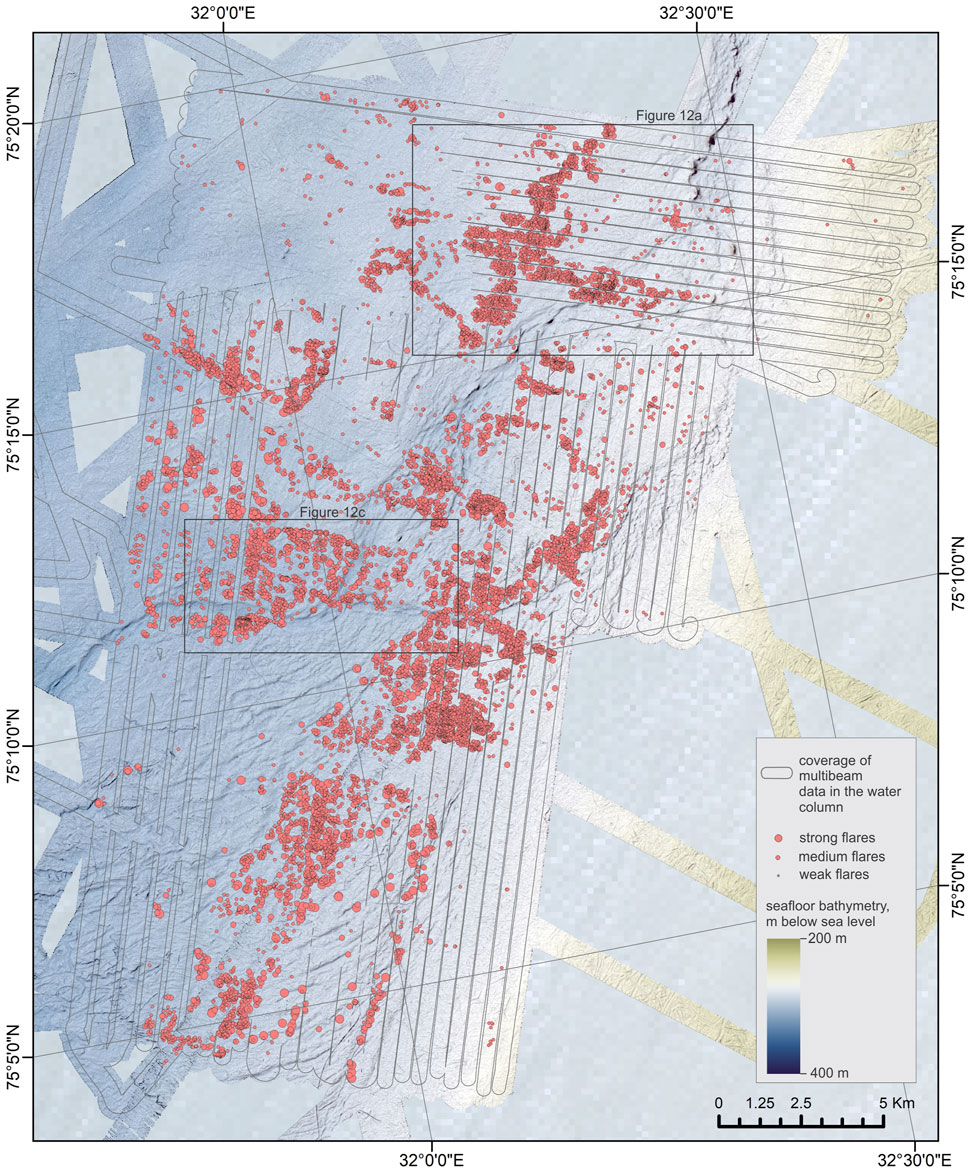
Figure 11. Distribution of weak, medium and strong gas flares in central part of the Sentralbanken gas seep area based on CAGE 21–4 multibeam data (Winsborrow et al., 2021). Total coverage of data suitable for flare mapping is 465 km2.
The majority of flares within the hinges of the structure form densely populated elongated clusters with a NE-SW orientation (Figure 11). Such clusters are often segmented by zones with no gas seepage possibly explained by small grabens which contain internal Kobbe Formation cap rock shales and younger overburden (lower Ladinian shales). Newly acquired high-resolution P-Cable seismic data on the Sentralbanken high (Serov et al., 2022) demonstrated poor signal penetration in areas where acoustically hard Triassic and Jurassic formations subcrop at the seafloor and could not be used to correlate seep cluster boundaries with structural elements on a finer scale than previously done by Serov et al. (2023).
Coupling seafloor bathymetry and gas flare mapping allowed investigation of whether gas seepage correlates with glacial landforms or potential manifestations of seabed fluid flow such as pockmarks, mounds, craters, etc. Geomorphological mapping of the seafloor bathymetry has revealed a prominent tunnel valley and esker system crossing the study site from NE to SW (Figure 12) (Shackleton et al., 2023). Both the tunnel valley and the esker are imprints of subglacial water drainage during the last deglaciation some 15,000 years ago (Patton et al., 2017; Shackleton et al., 2023). Tunnel valleys are erosional features formed by the subglacial flow of meltwater. Overprinted eskers are time-transgressive depositional features that typically form near the former ice-sheet margin and are composed of a wide variety of glaciofluvial facies ranging from sorted silts to boulders (Livingstone et al., 2020).
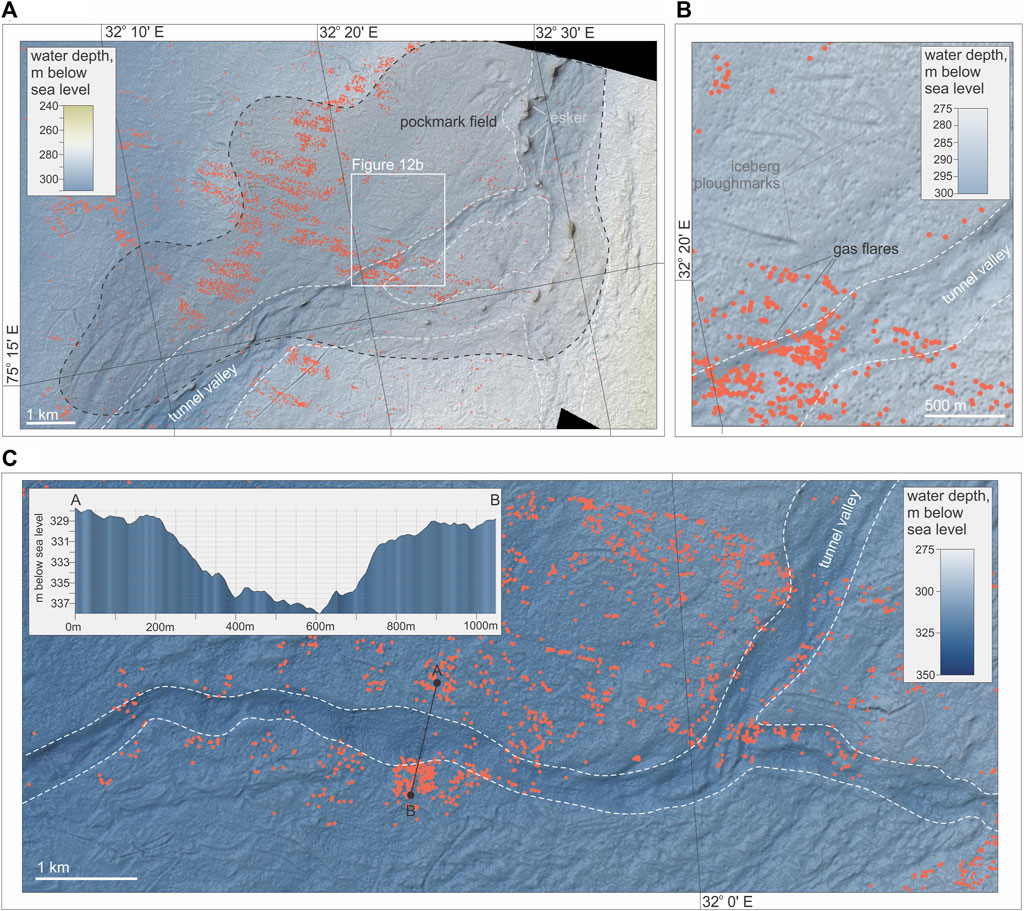
Figure 12. bathymetric features potentially modifying seabed gas leakage, and possibly caused by it. Note that weak, medium and strong gas flares are shown by the same symbol. (A) distribution of gas seeps within the field of pockmarks. See Figure 11 for location; (B) uniformly distributed pockmarks and clusters of gas flares; (C) gas seep distribution around a fragment of the main tunnel valley. See Figure 11 for location.
In our data set, eskers do not correlate with gas flare locations. This may be expected given that the eskers are up to 50 m thick and potentially contain a significant sediment volume unfavorable to fluid migration. However, eskers occupy a small fraction of the total mapped area and happen to lie outside of large flare clusters (Figure 11; Figure 12A). Therefore, it is probable that esker deposits do not emit gas flares due to the absence of fluid source, and not due to their sealing lithological properties.
The network of tunnel valleys demonstrates an erratic relation to gas seepage. In the northern part of the area (Figures 12A, B), the tunnel valley crosscuts a pronounced flare cluster with NE-SW orientation and does not cause an apparent change in flare density compared to surrounding areas. However, in the central part of the area, flare density within the valley is visibly less compared to the surrounding areas (Figure 12C). Locally, edges of the valley coincide with sharp transitions between densely populated flare clusters and areas with no seepage. While widespread gas seepage within the valley is somewhat expected considering its erosional origin, decreased gas seepage and even a complete absence, is surprising. We hypothesize that this section of the meltwater stream followed structural elements of the underlying strata (such as a small graben or the axis of a syncline) which act as a barrier for seepage, and the valley itself does not constrain fluid escape. Alternatively, this section of the valley network might have accumulated a thicker section of glaciofluvial sediments constraining gas leakage.
The northern part of the area features a ∼40 km2 densely populated pockmark field (locally, >40 pockmarks/km2). Seafloor pockmarks are a widespread manifestation of seabed fluid escape formed by gases or fluids mobilizing soft sediments for subsequent removal with currents (Hovland et al., 2002; Forwick et al., 2009). On Sentralbanken, the pockmarks are 0.5–3 m deep and 10–50 m in diameter. The pockmarks are distributed randomly and are abundant within and outside the tunnel valley (Figures 12A, B). Present-day seepage, however, shows no clear correlation with them. While gas flares demonstrate clustering, the pockmarks do not, and are equally widespread within and outside gas seeping areas (Figure 12B). Furthermore, very few gas flares originate from pockmarks. The extensive field of extinct pockmarks whose distribution does not resemble the structurally controlled distribution of seeps may indicate a different nature of fluids forming the pockmarks than thermogenic gas discharge. Escape of sediment pore water (Harrington, 1985), or release of microbial methane gas generated beneath the ice sheet (Wadham et al., 2012) are possible explanations for the pockmark field. While the type of fluid mobilizing sediments is uncertain, the pockmark field and abundant iceberg ploughmarks indicate with certainty that a drape of soft sediments exists in this zone. Gas seepage is abundant in the area despite this sedimentary veneer.
At Storbanken and Sentralbanken structural highs, the excellent spatial coverage of multibeam echosounder data suitable for gas flare detection exhibits two distinct trends in flare cluster orientation (Figures 13A, B): NE-SW and NW-SE. On Storbanken, elongated fault-controlled NW-SE clusters dominate (27 clusters), while on Sentralbanken the majority of the gas flares appear within five large NE-SW oriented clusters controlled by the subcropping of middle-Triassic reservoirs. A different Jurassic reservoir formation subcrops on Storbanken, yet the orientation of the seep clusters is the same. The NE-SW orientation may be dictated by general structural trend of Paleozoic rift basins elongated in this direction (Faleide et al., 2008), while the NW-SW orientation corresponds to faults likely associated to late Mesozoic - Cenozoic rifting episodes.
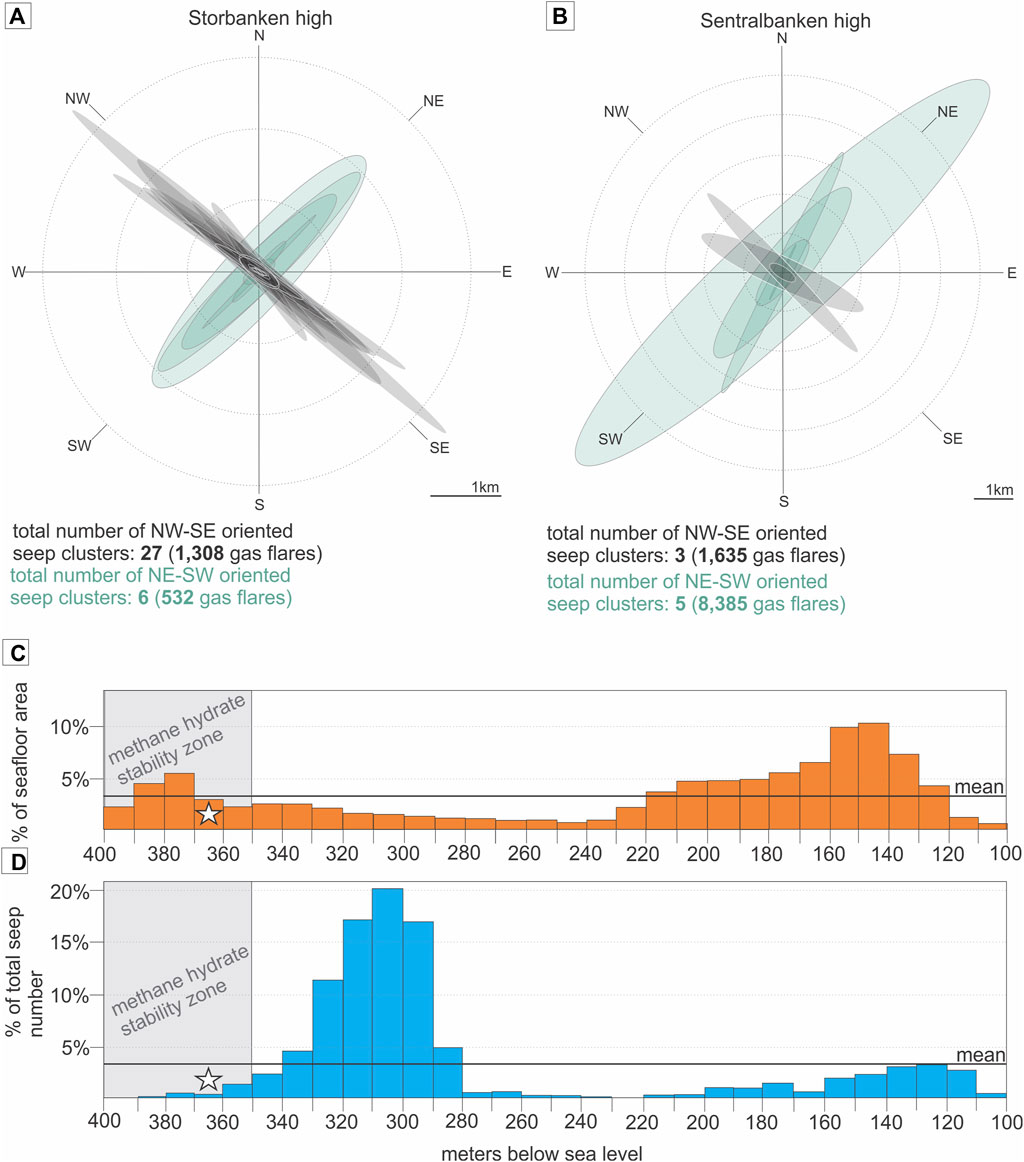
Figure 13. Orientation of seep clusters and distribution of seepage across water depth intervals. (A) orientation of seep clusters at Storbanken high shown as standard deviation of coordinates x and y from the mean center; (B) orientation of seep clusters at Sentralbanken high shown as standard deviation of coordinates x and y from the mean center; (C) distribution of seafloor depth (10 m intervals) at all studied areas. The grey square shows theoretical gas hydrate stability zone calculated assuming pure methane gas composition, a 1.5 C bottom water temperature and 3.5% salinity (Sloan and Koh, 2007). The white star indicates a gas hydrate recovery at 363 m water depth (Patton et al., 2020); (D) distribution of flare numbers at all studied areas (10 m intervals).
The seeps grouped within NW-SE clusters are most frequent near the top of the structure where seismic data point toward fluid accumulations (Figures 4, 7, 8). This suggests that the seeping gas is likely of thermogenic nature and predominantly leaks from the same exhumed reservoir units as in the NE-SW clusters. However, or data alone cannot rule out a possibility that some larger faults may penetrate the shallowest reservoir and reach lower Triassic successions and beyond. Such faults could promote migration of gas of the same thermogenic nature, yet, potentially, different origin. It is also possible that in areas where sedimentary overburden remains, particularly on the Kong Karl platform and Storbanken high (Figures 4, 5, 7), the fault conduits may be exploited by the locally generated microbial gas.
On Storbanken the fault-controlled clusters prevail, while on Sentralbanken clusters outlining eroded cap rock dominate. This reflects a variable state of exhumation and erosion of the structural highs. While on Storbanken, younger middle Jurassic successions subcrop locally (Figure 7), on Sentralbanken large patches (>5 km across) of older Triassic succession appear at, or very close to, the seafloor (Serov et al., 2023). It is possible that the fault-related seepage trend is also widespread on Sentralbanken but is masked within large, densely populated seep clusters (Figure 11).
Fault lineaments visible on multibeam bathymetry data on Storbanken show a close correlation to seepage. Other landforms prevalent across the northern Norwegian Barents Sea shelf generally show less apparent or no relation to free gas release. Only 9% of all seabed craters on Storbanken high and Kong Karl platform show seepage from their edges and no gas release was observed at the bottoms of the craters. Pockmarks on Sentralbanken do not correlate with today’s seepage (Figures 12A, B). Glacial landforms such as beaded esker, glacial lineations, and iceberg plougmarks do not control free gas release, apart from the tunnel valley system in the Sentralbanken area, some sections of which demonstrate a negative correlation with seepage density (Figure 12C). Therefore, we suggest that the distribution of free gas release within glacially eroded structural highs in the northern Norwegian Barents Sea is not largely modulated by seabed geomorphological features, all of which are rather small scale. Structural configuration of the subseafloor (e.g., the subcropping of reservoir formations and faulting) is the dominant factor controlling gas seepage distribution.
Our study areas lie within the 100–400 m water depth interval, though the hypsometry shows a distinct skew towards shallower depths (120–220 m water depth) (Figure 13C). The distribution of acoustic gas flares is, on the contrary, centered around water depths of 290–330 m, primarily due to the extremely large seep abundance on the Sentralbanken high. We did not identify a water-depth control on seepage distribution and the seeps are predominately conjugate to the underlying geology.
The seafloor region deeper than 350 m hosts a gas hydrate stability zone, which is an area where temperature and pressure conditions are appropriate to form a solid crystalline mixture of natural gas and water called gas hydrate. Gas hydrates were also recovered in shallow sediment cores at 363 m water depth on Sentralbanken (Patton et al., 2020; Serov et al., 2023). Within the theoretical gas hydrate stability field, the seepage is less abundant compared to other water depth intervals (Figure 13D). However, this deep-water part of the data sets (mostly within the Sentralbanken high) is also lying outside of the exhumed hydrocarbon reservoir and is not conducive to fluid release. Seismic indications of gas hydrates have not been observed. Therefore, our data alone cannot be conclusive as to whether shallow gas hydrate accumulations capture and preserve a fraction of hydrocarbon gases migrating through the subsurface. Of note, gas hydrate samples were recovered on the Sentralbaken high from an extensively leaking gas-hydrate pingo resembling the ones previously reported at 360–380 m water depth in the Barents Sea (Serov et al., 2017). In this case, stable gas hydrates are not blocking ascending gas entirely.
Quantification of ebullitive fluxes of methane from the seabed into the water column remains challenging because it requires the use of seafloor observatories or remotely operated vehicles conducting visual observations of bubble release, or operating equipment which measures volume of emitted gas over time (flowmeters, gas chambers, etc.). Such investigations are time consuming and costly, leading to very few direct gas-flux measurements acquired worldwide (Römer et al., 2014; Sahling et al., 2014; Weber et al., 2014; Veloso-Alarcón et al., 2022). Flux quantification of large seep regions with direct near-seafloor observations and measurements is practically not possible. Alternatively, fluxes of free gas may be inferred from splitbeam echsounder data through sonar signal inversion (Veloso et al., 2015). However, the footprint of splitbeam systems is narrow (typically <5% of the water depth) leading to >30 times longer time required to achieve the same spatial coverage compared to multibeam echosounders.
Here, we tentatively estimate the flux of free methane gas using a modified version of the simple upscaling method used by Sahling et al. (2014) and replicated by Ferré et al. (2020) (see Methods). Sahling et al. (2014) concluded that, on average, six bubble streams with a methane gas flux of 17 ± 8 mmol/min (n=15) corresponds to one gas flare recorded by the echosounder on the formerly glaciated western Svalbard margin. The total flux from the seep area was estimated by multiplying the number of acoustic gas flares identified on multibeam data by the average number of gas streams 6) and the average flux (17 ± 8 mmol/min). Single seep fluxes of the same order of magnitude, or one order of magnitude higher, are commonly reported worldwide (Römer et al., 2012; Römer et al., 2014; Skarke et al., 2014; Higgs et al., 2019; Razaz et al., 2020; Veloso-Alarcón et al., 2022).
We estimate that the eroded structural highs on the Kong Karl platform, the Sentralbanken and Storbanken highs may release 61 x 107 mol/yr (9,803 ton/yr) (Table 1). This is a rather conservative estimate given that the original upscaling method in Sahling et al. (2014), which does not account for relative strength of the flares and assumes all seeps contain six streams of bubbles, would result in total flux of 11 x 108 mol/yr.
A large range of uncertainty is inherent to the upscaling method primarily dictated by uncertainty in methane fluxes from individual gas seep. Therefore, we further estimate minimum and maximum methane fluxes accounting for possible variations of the flux at each bubble stream and the number of bubble streams appearing as one acoustic gas flare on echosounder data. The resulting minimum total flux is 14.5 x 10⁷ mol/yr and a maximum estimated flux of 13 x 108 mol/yr.
The base scenario seabed flux of 61 x 107 mol/yr generated by > 21,700 seeps within a <5,000 km2 study area might be one to two orders of magnitude higher compared to other vast seep provinces, primarily due to a large total number of seeps (Serov et al., 2023). For comparison, Skarke et al. (2014) estimated that the 94,000 km2 area of the northern US Atlantic margin hosts 512 seeps which produce a seabed methane flux of 0.95–5.66 x 10⁶ mol/yr. On the Makran continental margin offsore Pakistan, an area similar in size to our study areas in the Barents Sea, has been estimated to release 40 ± 32 x 106 mol/yr of methane gas (Römer et al., 2012). Ferré et al. (2020) used both inversion of split beam echosounder data and upscaling of few in situ measurements to a larger area to find out that the flux from a ∼8 km2 localized seep area offshore western Svalbard varies from 17.3 to 40.4 x 10⁶ mol/yr depending on the season.
Previously published measurements of methane concentrations in surface seawater in the Sentralbanken region revealed that a flux of methane from the water column into the air may occur (Serov et al., 2023). Assuming that the average methane flux of 0.2 µmol/(m2 x d) reported by Serov et al. (2023) remains constant throughout a year, and relying on our tentative flux estimate approach (Table 1), we estimate that in this actively seeping region (Figure 11) only 0.05% of methane gas emitted from the seafloor into the water column reaches the air. Repeated sea water sampling campaigns at different seasons and oceanographic conditions as well as air sample analyses are necessary to verify our preliminary estimates. Nevertheless, it is very likely that aerobic oxidation of methane utilizes most of the emitted gas, which has also been repeatedly documented across Arctic continental margins and elsewhere (Valentine et al., 2001; Graves et al., 2015; Steinle et al., 2015; Gründger et al., 2021; Mao et al., 2022).
The last episode of erosion which could contribute to uncapping hydrocarbon-bearing natural geological reservoirs occurred in the northern Barents Sea during the last glaciation (Patton et al., 2017; Patton et al., 2022). Numerical modeling constrained with empirical observations suggests that grounded ice retreated from our study sites ∼14 ka BP (Patton et al., 2017). Several studies have found that hydrocarbon seepage across the Barents Sea started shortly after cryospheric systems (grounded ice, subglacial permafrost and gas hydrates) retreated and warmer submarine conditions prevailed across the shelf (Crémière et al., 2016; Portnov et al., 2016; Himmler et al., 2019; Argentino et al., 2021; Argentino et al., 2022). Assuming the gas discharge rates similar to present were constant since deglaciation, ∼137 (32.6–201.8) million tons of methane from thermogenic sources has been released into the seawater from our <5,000 km2 study sites alone. Putting this into perspective, the production and use of fossil fuels is estimated to emit 108 (91–121) million tons of methane into the atmosphere annually (Saunois et al., 2020).
The wider Norwegian Barents Sea shelf likely host more seepage provinces beyond the ones mentioned in our study. We estimate that echosounder data presented in Thorsnes et al. (2023) (Sahling et al., 2014; Mau et al., 2017; Chand and Thorsnes, 2020; Chand and Thorsnes, 2021), and in our study cover only 10% of the Norwegian sector of the Barents Sea shelf. Excluding data overlaps, ∼27,000 gas flares have been identified within the mapped territories. Notably, only 17% of the structural highs that may be conduced to strong hydrocarbon seepage (Serov et al., 2023) have been mapped. Therefore, it is possible that the total number of seeps actively injecting methane gas in the water column may be up to one magnitude higher than what today’s mapping revealed.
Today, most of the gas released into the seawater from glacially eroded hydrocarbon bearing structures in the northern Norwegian Barents Sea is unlikely to reach the atmosphere (Serov et al., 2023). However, the amount of gas bypassing microbial oxidation in the water column at different seasons, oceanographic and meteorological conditions remains to be quantified precisely. As evident from our geophysical data, large subseafloor hydrocarbon sources are sustaining the water column methane plume, and even a short episode of decreased efficiency of the microbial filtering due to currents or storms (Steinle et al., 2015) may result in potentially significant emissions to the atmosphere. Furthermore, it is important to characterize a stable isotopic signature of the sea-air methane emissions originating from eroded hydrocarbon reservoirs to identify whether such methane gas fluxes are practically distinguishable from other isotopically similar sources, which may be worth considering in future top-down assessments. Finally, understanding the future efficacy of the microbial oxidation filters in bottom sediments and in the water column of the rapidly changing polar regions and, especially at the newly emerging seep sites in Antarctica and Greenland, will be important because it is the single most efficient barrier between active and widespread submarine methane sources, like the ones we have documented in the Barents Sea, and the atmosphere.
1. ∼21,700 methane gas emissions sites occur within ∼5,000 km2 of seafloor area in the northern Norwegian Barents Sea
2. Gas seepage correlates with Triassic and Jurassic formations with potential of bearing hydrocarbons subcropping beneath the seafloor and outcropping at the seafloor.
3. Gas seeps form elongated clusters with two distinct orientations: NW-SE and NE-SW
4. NW-SE clusters correlate with faults located near the top of the hydrocarbon bearing structures, while NE-SW clusters correspond to subcropping of Triassic and Jurassic hydrocarbon-bearing reservoir formations.
5. We estimate that the investigated areas in the northern Norwegian Barents Sea, produce methane flux from the seafloor into the water column of 61 x 107 (14.5 x 10⁷–13 x 108) mol/yr.
The raw data supporting the conclusions of this article will be made available by the authors, without undue reservation.
PS: Writing–review and editing, Writing–original draft, Visualization, Methodology, Investigation, Formal Analysis, Data curation, Conceptualization. KA: Writing–review and editing, Supervision, Resources, Project administration, Funding acquisition, Conceptualization. MW: Writing–review and editing, Supervision, Investigation, Conceptualization. RM: Writing–review and editing, Visualization, Methodology, Investigation, Funding acquisition, Formal Analysis, Data curation, Conceptualization. HP: Writing–review and editing, Investigation, Data curation, Conceptualization.
The author(s) declare that financial support was received for the research, authorship, and/or publication of this article. The research is supported by the Research Council of Norway through its Centres of Excellence funding scheme (Grant 223259), and through the large-scale interdisciplinary project ReGAME (Grant 325610).
We would like to acknowledge Dr. Andreia-Plaza Faverola from CAGE, UiT for leading research cruise CAGE 18-1 and sharing multibeam echosounder and seismic data acquired. We thank the crew of research vessels Helmer Hanssen and G. O. Sars for providing invaluable support for acquisition of the empirical data.
The authors declare that the research was conducted in the absence of any commercial or financial relationships that could be construed as a potential conflict of interest.
All claims expressed in this article are solely those of the authors and do not necessarily represent those of their affiliated organizations, or those of the publisher, the editors and the reviewers. Any product that may be evaluated in this article, or claim that may be made by its manufacturer, is not guaranteed or endorsed by the publisher.
Andreassen, K. (2016). CAGE16-2 cruise report: marine geological cruise to the maud basin and crater area, bjørnøyrenna. CAGE–Centre Arct. Gas Hydrate, Environ. Clim. Rep. Ser. 4. doi:10.7557/cage.6925
Andreassen, K., Hubbard, A., Winsborrow, M., Patton, H., Vadakkepuliyambatta, S., Plaza-Faverola, A., et al. (2017). Massive blow-out craters formed by hydrate-controlled methane expulsion from the Arctic seafloor. Science 356, 948–953. doi:10.1126/science.aal4500
Andreassen, K., Patton, H., Mattingsdal, R., Moser, M., Cooke, F. A., Jansson, P., et al. (2019). CAGE19-2 Cruise Report: hunting gas flares and launching seafloor observatory. CAGE–Centre Arct. Gas Hydrate, Environ. Clim. Rep. Ser. 7. doi:10.7557/cage.6910
Argentino, C., Lee, A., Fallati, L., Sahy, D., Birgel, D., Peckmann, J., et al. (2022). Biogeochemistry and timing of methane-derived carbonate formation at Leirdjupet fault complex, SW Barents sea. Front. Earth Sci. 10. doi:10.3389/feart.2022.1029471
Argentino, C., Waghorn, K. A., Vadakkepuliyambatta, S., Polteau, S., Bünz, S., and Panieri, G. (2021). Dynamic and history of methane seepage in the SW Barents Sea: new insights from leirdjupet fault complex. Sci. Rep. 11, 4373. doi:10.1038/s41598-021-83542-0
Asadnabizadeh, M. (2022). Critical findings of the sixth assessment report (AR6) of working Group I of the intergovernmental panel on climate change (IPCC) for global climate change policymaking a summary for policymakers (SPM) analysis. Int. J. Clim. Change Strateg. Manag.
Bøe, R., Bjarnadóttir, L. R., Elvenes, S., Dolan, M., Bellec, V., Thorsnes, T., et al. (2022). “Revealing the secrets of Norway's seafloor – geological mapping within the MAREANO programme and in coastal areas,” in From continental shelf to slope: mapping the oceanic realm. Editors K. ASCH, H. KITAZATO, and H. VALLIUS (London: Geological Society of).
CCAC, U. (2021). “United nations environment programme and climate and clean air coalition”, in Global methane assessment: benefits and costs of mitigating methane emissions (Nairobi: United Nations Environment Programme).
Chand, S., and Thorsnes, T. (2020). Processing and interpretation of water column data from the polarrev high, Barents Sea.
Chand, S., and Thorsnes, T. (2021). Processing and interpretation of water column data from the gardarbankhøgda, bjarmelandplattformen, sentralbankhøgda and Kong Karls land-plattformen. Barents Sea.
Collanega, L., Massironi, M., Breda, A., and Kjølhamar, B. E. (2017). Onset of N-atlantic rifting in the Hoop fault complex (SW Barents Sea): an orthorhombic dominated faulting? Tectonophysics 706-707, 59–70. doi:10.1016/j.tecto.2017.04.003
Crémière, A., Lepland, A., Chand, S., Sahy, D., Condon, D. J., Noble, S. R., et al. (2016). Timescales of methane seepage on the Norwegian margin following collapse of the Scandinavian Ice Sheet. Nat. Commun. 7, 11509. doi:10.1038/ncomms11509
Egger, M., Riedinger, N., Mogollón, J. M., and Jørgensen, B. B. (2018). Global diffusive fluxes of methane in marine sediments. Nat. Geosci. 11, 421–425. doi:10.1038/s41561-018-0122-8
Faleide, J. I., Tsikalas, F., Breivik, A., Mjelde, R., Ritzmann, O., Engen, O., et al. (2008). Structure and evolution of the continental margin off Norway and the Barents Sea. Episodes 31, 82–91. doi:10.18814/epiiugs/2008/v31i1/012
Ferré, B., Jansson, P. G., Moser, M., Serov, P., Portnov, A., Graves, C. A., et al. (2020). Reduced methane seepage from Arctic sediments during cold bottom-water conditions. Nat. Geosci. 13, 144–148. doi:10.1038/s41561-019-0515-3
Forwick, M., Baeten, N., and Vorren, T. (2009). Pockmarks in spitsbergen fjords. Nor. Geol. Tidsskr. 89.
Graves, C. A., Steinle, L., Rehder, G., Niemann, H., Connelly, D. P., Lowry, D., et al. (2015). Fluxes and fate of dissolved methane released at the seafloor at the landward limit of the gas hydrate stability zone offshore western Svalbard. J. Geophys. Res. - Oceans 120, 6185–6201. doi:10.1002/2015jc011084
Grogan, P., Østvedt-Ghazi, A. M., Larssen, G. B., Fotland, B., Nyberg, K., Dahlgren, S., et al. (1999). “Structural elements and petroleum geology of the Norwegian sector of the northern Barents Sea. Petroleum Geology of Northwest Europe,” in Proceedings of the 5th Conference 5, 247–259.
Gründger, F., Probandt, D., Knittel, K., Carrier, V., Kalenitchenko, D., Silyakova, A., et al. (2021). Seasonal shifts of microbial methane oxidation in Arctic shelf waters above gas seeps. Limnol. Oceanogr. 66, 1896–1914. doi:10.1002/lno.11731
Harrington, P. K. (1985). Formation of pockmarks by pore-water escape. Geo-Marine Lett. 5, 193–197. doi:10.1007/bf02281638
Higgs, B., Mountjoy, J. J., Crutchley, G. J., Townend, J., Ladroit, Y., Greinert, J., et al. (2019). Seep-bubble characteristics and gas flow rates from a shallow-water, high-density seep field on the shelf-to-slope transition of the Hikurangi subduction margin. Mar. Geol. 417, 105985. doi:10.1016/j.margeo.2019.105985
Himmler, T., Sahy, D., Martma, T., Bohrmann, G., Plaza-Faverola, A., Bünz, S., et al. (2019). A 160,000-year-old history of tectonically controlled methane seepage in the Arctic. Sci. Adv. 5, eaaw1450. doi:10.1126/sciadv.aaw1450
Hovland, M., Gardner, J. V., and Judd, A. G. (2002). The significance of pockmarks to understanding fluid flow processes and geohazards. Geofluids 2, 127–136. doi:10.1046/j.1468-8123.2002.00028.x
Høy, T., and Lundschien, B. (2011). “Triassic deltaic sequences in the northern Barents Sea,” in Geological Society, London, Memoirs 35, 249–260.
Klausen, T. G., Nyberg, B., and Helland-Hansen, W. (2019). The largest delta plain in Earth’s history. Geology 47, 470–474.
Jakobsson, M., Mayer, L. A., Bringensparr, C., Castro, C. F., Mohammad, R., Johnson, P., et al. (2020). The international bathymetric chart of the arctic ocean version 4.0. Sci. Data 7, 176. doi:10.1038/s41597-020-0520-9
Judd, A., and Hovland, M. (2009). Seabed fluid flow: the impact on geology, biology and the marine environment. Cambridge University Press.
Lasabuda, A. P. E., Johansen, N. S., Laberg, J. S., Faleide, J. I., Senger, K., Rydningen, T. A., et al. (2021). Cenozoic uplift and erosion of the norwegian barents shelf—a review. Earth Sci. Rev. 217, 103609.
Livingstone, S. J., Lewington, E. L. M., Clark, C. D., Storrar, R. D., Sole, A. J., Mcmartin, I., et al. (2020). A quasi-annual record of time-transgressive esker formation: implications for ice-sheet reconstruction and subglacial hydrology. Cryosphere 14, 1989–2004. doi:10.5194/tc-14-1989-2020
Lundschien, B. A., Mattingsdal, R., Johansen, S. K., and Knutsen, S.-M. (2023). North Barents composite tectono-sedimentary element. Geol. Soc. 57, M57–M2021. doi:10.1144/m57-2021-39
Masson-Delmotte, V., Zhai, P., Priani, A., Connors, S., Péan, C., and Berger, S. (2021). “IPCC, 2021: climate change 2021: the physical science basis,” in Contribution of working group I to the sixth assessment report of the intergovernmental panel on climate change. Cambridge, United Kingdom: Cambridge University Press.
Mao, Y., Lin, T., Li, H., He, R., Ye, K., Yu, W., et al. (2024). Aerobic methane production by phytoplankton as an important methane source of aquatic ecosystems: reconsidering the global methane budget. Sci. Total Environ. 907, 167864.
Mao, S.-H., Zhang, H.-H., Zhuang, G.-C., Li, X.-J., Liu, Q., Zhou, Z., et al. (2022). Aerobic oxidation of methane significantly reduces global diffusive methane emissions from shallow marine waters. Nat. Commun. 13, 7309. doi:10.1038/s41467-022-35082-y
Mau, S., Römer, M., Torres, M. E., Bussmann, I., Pape, T., Damm, E., et al. (2017). Widespread methane seepage along the continental margin off Svalbard - from Bjørnøya to Kongsfjorden. Sci. Rep. 7, 42997. doi:10.1038/srep42997
Nielsen, T., Laier, T., Kuijpers, A., Rasmussen, T. L., Mikkelsen, N. E., Nørgård-Pedersen, N., et al. (2014). Fluid flow and methane occurrences in the Disko Bugt area offshore West Greenland: indications for gas hydrates?. Geo-Mar. Lett. 34, 511–523.
Nisbet, E., Fisher, R., Lowry, D., France, J., Allen, G., Bakkaloglu, S., et al. (2020). Methane mitigation: methods to reduce emissions, on the path to the Paris agreement. Rev. Geophys. 58, e2019RG000675.
Nixon, F. C., Chand, S., Thorsnes, T., and Bjarnadóttir, L. R. (2019). A modified gas hydrate-geomorphological model for a new discovery of enigmatic craters and seabed mounds in the Central Barents Sea, Norway. Geo-Marine Lett. 39, 191–203. doi:10.1007/s00367-019-00567-1
Norwegian Offshore Directorate (2024). Resource Accounts for the Norwegian continental shelf as per 31 December 2023. Norwegian Offshore Directorate.
Patton, H., Hubbard, A., Andreassen, K., Auriac, A., Whitehouse, P. L., Stroeven, A. P., et al. (2017). Deglaciation of the Eurasian ice sheet complex. Quat. Sci. Rev. 169, 148–172. doi:10.1016/j.quascirev.2017.05.019
Patton, H., Hubbard, A., Heyman, J., Alexandropoulou, N., Lasabuda, A. P. E., Stroeven, A. P., et al. (2022). The extreme yet transient nature of glacial erosion. Nat. Commun. 13, 7377. doi:10.1038/s41467-022-35072-0
Patton, H., Mattingsdal, R., Pavel, S., Cooke, F. A., and Alexandropoulou, N. (2020). CAGE20-2 cruise report: hunting flares in hopendjupet and glacigenic sediments in sentralbankrenna. CAGE–Centre Arct. Gas Hydrate, Environ. Clim. Rep. Ser. 8. doi:10.7557/cage.6745
Plaza-Faverola, A. (2018). CAGE18-1 cruise report: marine geophysical cruise to storbanken and Olga basin in the Barents Sea. CAGE–Centre Arct. Gas Hydrate, Environ. Clim. Rep. Ser. 6. doi:10.7557/cage.6846
Portnov, A., Vadakkepuliyambatta, S., Mienert, J., and Hubbard, A. (2016). Ice-sheet-driven methane storage and release in the Arctic. Nat. Commun. 7, 10314. doi:10.1038/ncomms10314
Razaz, M., Di Iorio, D., Wang, B., and Macdonald, I. (2020). Temporal variations of a natural hydrocarbon seep using a deep-sea camera system. J. Atmos. Ocean. Technol. 37, 1737–1751. doi:10.1175/jtech-d-19-0137.1
Riis, F., Lundschien, B. A., Høy, T., Mørk, A. E., and Mørk, M. B. (2008). Evolution of the Triassic shelf in the northern Barents Sea region. Polar Res. 27, 318–338.
Römer, M., Sahling, H., Pape, T., Bohrmann, G., and Spieß, V. (2012). Quantification of gas bubble emissions from submarine hydrocarbon seeps at the Makran continental margin (offshore Pakistan). J. Geophys. Res. Oceans 117. doi:10.1029/2011jc007424
Römer, M., Sahling, H., Pape, T., Dos Santos Ferreira, C., Wenzhöfer, F., Boetius, A., et al. (2014). Methane fluxes and carbonate deposits at a cold seep area of the central nile deep sea fan, eastern mediterranean sea. Mar. Geol. 347, 27–42. doi:10.1016/j.margeo.2013.10.011
Ruppel, C. D., and Kessler, J. D. (2017). The interaction of climate change and methane hydrates. Rev. Geophys. 55, 126–168.
Sahling, H., Römer, M., Pape, T., Bergès, B., Dos Santos Fereirra, C., Boelmann, J., et al. (2014). Gas emissions at the continental margin west of Svalbard: mapping, sampling, and quantification. Biogeosciences 11, 6029–6046. doi:10.5194/bg-11-6029-2014
Saunois, M., Stavert, A. R., Poulter, B., Bousquet, P., Canadell, J. G., Jackson, R. B., et al. (2020). The global methane budget 2000–2017. Earth Syst. Sci. Data 12, 1561–1623. doi:10.5194/essd-12-1561-2020
Sejrup, H. P., Hjelstuen, B. O., Patton, H., Esteves, M., Winsborrow, M., Rasmussen, T. L., et al. (2022). The role of ocean and atmospheric dynamics in the marine-based collapse of the last Eurasian Ice Sheet. Commun. Earth Environ. 3, 119. doi:10.1038/s43247-022-00447-0
Serck, C. S., Faleide, J. I., Braathen, A., Kjølhamar, B., and Escalona, A. (2017). Jurassic to early cretaceous basin configuration(s) in the fingerdjupet subbasin, SW Barents Sea. Mar. Petroleum Geol. 86, 874–891. doi:10.1016/j.marpetgeo.2017.06.044
Serov, P., Mattingsdal, R., Winsborrow, M., Patton, H., and Andreassen, K. (2023). Widespread natural methane and oil leakage from sub-marine Arctic reservoirs. Nat. Commun. 14, 1782. doi:10.1038/s41467-023-37514-9
Serov, P., Patton, H., Mazzini, A., Mattingsdal, R., Shephard, G., Cooke, F. A., et al. (2022). CAGE22-6 cruise report: GEO-3144/8144 Teaching Cruise: geologically controlled hydrocarbon seepage in Hopendjupet and the wider Barents Sea. CAGE–Centre Arct. Gas Hydrate, Environ. Clim. Rep. Ser. 10. doi:10.7557/cage.6769
Serov, P., Vadakkepuliyambatta, S., Mienert, J., Patton, H., Portnov, A., Silyakova, A., et al. (2017). Postglacial response of Arctic Ocean gas hydrates to climatic amelioration. Proc. Natl. Acad. Sci. 114, 6215–6220. doi:10.1073/pnas.1619288114
Shackleton, C., Patton, H., Winsborrow, M., Esteves, M., Bjarnadóttir, L., and Andreassen, K. (2023). Distinct modes of meltwater drainage and landform development beneath the last Barents Sea ice sheet. Front. Earth Sci. 11. doi:10.3389/feart.2023.1111396
Shoemaker, J., Schrag, D., Molina, M., and Ramanathan, V. (2013). What role for short-lived climate pollutants in mitigation policy?. Science 342, 1323–1324.
Skarke, A., Ruppel, C., Kodis, M., Brothers, D., and Lobecker, E. (2014). Widespread methane leakage from the sea floor on the northern US Atlantic margin. Nat. Geosci. 7, 657–661. doi:10.1038/ngeo2232
Staniaszek, Z., Griffiths, P. T., Folberth, G. A., O’Connor, F. M., Abraham, N. L., and Archibald, A. T. (2012). The role of future anthropogenic methane emissions in air quality and climate. npj Clim. Atmos. Sci. 5, 21.
Steinle, L., Graves, C. A., Treude, T., Ferré, B., Biastoch, A., Bussmann, I., et al. (2015). Water column methanotrophy controlled by a rapid oceanographic switch. Nat. Geosci. 8, 378–382. doi:10.1038/ngeo2420
Stemmerik, L., Worsley, D., et al. (2005). 30 years on-Arctic Upper Palaeozoic stratigraphy, depositional evolution and hydrocarbon prospectivity. Norw. J. Geol./Norsk Geologisk Forening, 85.
Thorsnes, T., Buhl-Mortensen, L., and Skyseth, T. (2008). Integrated mapping of the seafloor and ecosystems in the Arctic–the MAREANO programme. Gråsteinen 12, 115–125.
Thorsnes, T., Chand, S., Bellec, V. K., Nixon, C., Brunstad, H., Lepland, A., et al. (2023). Gas seeps in Norwegian waters–distribution and mechanisms.
Thurber, A. R., Seabrook, S., and Welsh, R. M. (2020). “Riddles in the cold: antarctic endemism and microbial succession impact methane cycling in the Southern Ocean,” in Proceedings of the royal society B: biological sciences 287, 20201134.
Urban, P., Köser, K., and Greinert, J. (2017). Processing of multibeam water column image data for automated bubble/seep detection and repeated mapping. Limnol. Oceanogr.: Methods 15, 1–21.
Valentine, D. L., Blanton, D. C., Reeburgh, W. S., and Kastner, M. (2001). Water column methane oxidation adjacent to an area of active hydrate dissociation, Eel River Basin. Geochimica Cosmochimica Acta 65, 2633–2640. doi:10.1016/s0016-7037(01)00625-1
Vaughn, T. L., Bell, C. S., Pickering, C. K., Schwietzke, S., Heath, G. A., Pétron, G., et al. (2018). “Temporal variability largely explains top-down/bottom-up difference in methane emission estimates from a natural gas production region,” in Proceedings of the National Academy of Sciences 115, 11712–11717.
Veloso-Alarcón, M. E., Urban, P., Weiss, T., Köser, K., She, M., and Greinert, J. (2022). Quantitatively monitoring bubble-flow at a seep site offshore Oregon: field trials and methodological advances for parallel optical and hydroacoustical measurements. Front. Earth Sci. 10. doi:10.3389/feart.2022.858992
Veloso, M., Greinert, J., Mienert, J., and Batist, M. (2015). A new methodology for quantifying bubble flow rates in deep water using splitbeam echosounders: examples from the Arctic offshore NW-Svalbard. Limnol. Oceanogr. Methods 13, 267–287. doi:10.1002/lom3.10024
Waage, M., Serov, P., Andreassen, K., Waghorn, K. A., and Bünz, S. (2020). Geological controls of giant crater development on the Arctic seafloor. Sci. Rep. 10, 8450. doi:10.1038/s41598-020-65018-9
Wadham, J., Arndt, S., Tulaczyk, S., Stibal, M., Tranter, M., Telling, J., et al. (2012). Potential methane reservoirs beneath Antarctica. Nature 488, 633–637. doi:10.1038/nature11374
Weber, T. C., Mayer, L., Jerram, K., Beaudoin, J., Rzhanov, Y., and Lovalvo, D. (2014). Acoustic estimates of methane gas flux from the seabed in a 6000 km2 region in the Northern Gulf of Mexico. Geochem. Geophys. Geosystems 15, 1911–1925. doi:10.1002/2014gc005271
Weniger, P., Blumenberg, M., Berglar, K., Ehrhardt, A., Klitzke, P., Krüger, M., et al. (2019). Origin of near-surface hydrocarbon gases bound in northern Barents Sea sediments. Mar. Petroleum Geol. 102, 455–476. doi:10.1016/j.marpetgeo.2018.12.036
Whiticar, M. (1993). “Atmospheric methane: sources, sinks, and role in global change,” in Atmospheric methane: sources, sinks, and role in global change. Berlin: Springer, 138–167.
Whiticar, M. J. (1999). Carbon and hydrogen isotope systematics of bacterial formation and oxidation of methane. Chem. Geol. 161, 291–314.
Winsborrow, M., and Knies, J. (2021). CAGE21-6 cruise report: hydrocarbon leakage in hopendjupet, central Barents Sea. CAGE–Centre Arct. Gas Hydrate, Environ. Clim. Rep. Ser. 9. doi:10.7557/cage.6675
Winsborrow, M., Patton, H., Jakobsen, F., Pau, M., Akinselure, A., and Jensen, A. (2021). CAGE21-4 Cruise Report: oil slicks, gas flares and glacial landforms in Hopendjupet and Sentralbanken. CAGE–Centre Arct. Gas Hydrate, Environ. Clim. Rep. Ser. 9. doi:10.7557/cage.6703
Keywords: methane, hydrocarbons, seepage, Arctic, Barent sea
Citation: Serov P, Andreassen K, Winsborrow M, Mattingsdal R and Patton H (2024) Geological and glaciological controls of 21,700 active methane seeps in the northern Norwegian Barents sea. Front. Earth Sci. 12:1404027. doi: 10.3389/feart.2024.1404027
Received: 20 March 2024; Accepted: 17 June 2024;
Published: 11 July 2024.
Edited by:
Nir Krakauer, City College of New York (CUNY), United StatesReviewed by:
Ang Li, Qingdao Institute of Marine Geology (QIMG), ChinaCopyright © 2024 Serov, Andreassen, Winsborrow, Mattingsdal and Patton. This is an open-access article distributed under the terms of the Creative Commons Attribution License (CC BY). The use, distribution or reproduction in other forums is permitted, provided the original author(s) and the copyright owner(s) are credited and that the original publication in this journal is cited, in accordance with accepted academic practice. No use, distribution or reproduction is permitted which does not comply with these terms.
*Correspondence: Pavel Serov, cGF2ZWwucnVzc2Vyb3ZAdWl0Lm5v
Disclaimer: All claims expressed in this article are solely those of the authors and do not necessarily represent those of their affiliated organizations, or those of the publisher, the editors and the reviewers. Any product that may be evaluated in this article or claim that may be made by its manufacturer is not guaranteed or endorsed by the publisher.
Research integrity at Frontiers
Learn more about the work of our research integrity team to safeguard the quality of each article we publish.