 Wentao Xu
 Qinjun Wang1,2,3,4*
94% of researchers rate our articles as excellent or good
Learn more about the work of our research integrity team to safeguard the quality of each article we publish.
Find out more
ORIGINAL RESEARCH article
Front. Earth Sci., 24 May 2024
Sec. Geohazards and Georisks
Volume 12 - 2024 | https://doi.org/10.3389/feart.2024.1403888
Introduction: Landslides are known to be one of the most frequent types of geological disasters. However, there is not an established method for large-scale, rapid, and high-precision landslide extraction. The quantitative impact of environmental changes on landslide development is also not well understood, which hinders accurate assessments and decision-making in environmental and disaster response. The polar regions, including the Antarctic, the Arctic, and the Tibetan plateau (TP), sensitive to global environmental changes, are significantly affected by global warming. This leads to extensive landslide development, particularly in the southern TP. This research focuses on new landslides in the southern TP, exploring extraction methods and the relationship between landslides and environmental factors.
Methods: Utilizing the Google Earth Engine (GEE) and an improved Otsu threshold segmentation algorithm, we processed remote sensing images with 10 m resolution to identify landslide areas. The proposed Normalized Landslide Bare-soil Separation Index (NDLBSI) achieved an 87% pre-extraction accuracy in extracting landslides from Sentinel-2 images from 2019 to 2023. For the pre-extraction results, manual interpretation and correction were carried out, and a model correlating annual landslide changes with environmental factors was established based on least squares multivariate statistical methods.
Results: Results show that a significant increase in landslide areas in the southern TP over the past 5 years, correlating with the watershed-wide increase in annual average temperature and vegetation cover, along with a decrease in snow cover area.
Discussion: These changes could affect soil and rock moisture, influencing soil stability and landslide occurrence. The study provides valuable insights for large-scale landslide detection and understanding the environmental factors influencing landslides, which is of some significance for landslide hazards early warning.
According to the 2023 report by the Intergovernmental Panel on Climate Change (IPCC), human activities have caused the global surface temperature to rise by 1.1°C between 2011 and 2020 compared to the period from 1850 to 1900. The report projects a potential rise in global average temperature of at least 1.5°C over the next 20 years (IPCC, 2023). Climate change has drawn global attention to the destabilization of slopes in major mountain ranges such as the Alps, Caucasus, Andes, and Himalayas. Climate change, including intensified precipitation, altered temperatures, and the adverse impacts of increased ENSO events, contributes to the occurrence of landslides, particularly in high mountain regions characterized by glaciers, permafrost, and snow cover (Huggel et al., 2012; Moreiras and Dal Pont, 2017). The polar regions, including the Tibetan Plateau (TP), as one of the most unique geological-geographical-resource-ecological coupled systems in the world, have significant impacts on global and regional sustainable development, which are sentinels of global climate change. Particularly under the influence of global warming, the environmental conditions in the TP and its surrounding areas have undergone significant changes. Environmental factors such as temperature, precipitation, land cover, and seismic activity have increased the risk of geological disasters, including landslides and mudflows (Tong et al., 2023). For example, provinces located in the southeastern edge of the TP, such as Tibet and Yunnan, are particularly susceptible to these geological disasters due to their geographical position, distinctive geological structure, climatic conditions, and ecological environment (Zhang, Zhang, and Zhang, 2004).
As we know, temperature and precipitation are crucial indicators in assessing climate changes, which impact geological disasters globally and locally. The rise in temperature intensifies changes weather patterns, resulting in an increased frequency and intensity of extreme weather events. With the increase in temperature, there is a direct impact on glacier retreat and alterations in precipitation patterns, which have made mountain disasters more active (Cui et al., 2010; Gariano and Guzzetti, 2016). For example, in Southern TP, increased soil moisture evaporation due to higher temperature has led to decreased slope stability, which has resulted in the increment of geological disasters, like glacial mudflows and landslides (Zhang et al., 2020). Particularly under the influence of global warming, the TP and its surrounding areas are significantly affected by temperature rise. This increase not only accelerates glacial melting, but also triggers landslides in the TP (Tong et al., 2023).
Then, land cover changes can influence the geological hazards. 1) Vegetation is one of the primary indicators indirectly influencing the occurrence of hazards. The interaction between vegetation roots and soil-rock material can impact the stability of slopes. Factors such as vegetation biomass are directly related to geological disasters (Gao et al., 2017; Shen et al., 2022). 2) Snow cover is a crucial component of the cryosphere and plays a significant role in surface energy-water exchange and mountain hydrology (Wang et al., 2017). In the southern TP, most areas are covered by snow. Snowmelt is one of the triggers for geological disasters. The increased water from melting snow can destabilize slopes that are already in a critical stability state. Additionally, the temperature variations during the snowmelt period can affect the stability of rock cliffs, increasing the risk of hazards.
Finally, the TP is characterized by frequent seismic activity. With multiple seismic fault zones, frequent and intense earthquakes in this region can directly cause landslides, because earthquakes can induce liquefaction in soils with high water content, disrupting the critical conditions of potential disaster sites and increasing the risk of geological hazards.
Besides environmental factors, the landslides complexity induces a lot of advanced monitoring and analysis techniques. 1) In the early stages, scholars used visual interpretation on landslides for quantitative analysis of landslide environments, distributions, and influencing factors (Gao, 1993; Mahdavifar, 2006; Huang, 2008; Sun et al., 2020). 2) With the enrichment of optical satellite band numbers, landslide extraction based on spectral and texture characteristics of regional images has achieved good results (Su et al., 2008; Ma et al., 2016; Liu et al., 2023). Researchers like Cui have conducted risk assessments of mountain disasters in TP (Cui et al., 2015). Yang et al. analyzed the relationship between the geological disasters and influencing factors on the eastern TP edge (Yang et al., 2018). Shen et al. interpreted geological disasters in the Hengduan Mountains and TP using the random forest model, whose results suggest that the main driving forces for medium and small geological disasters in the central and southern TP are vegetation cover, road construction, and river erosion (Shen et al., 2022). 3) The traditional production of landslide maps has relied on a combination of visual interpretation of stereoscopic aerial photographs and field surveys, a methodology constrained by high consumption of human and technical resources, which makes it difficult to scale up (Guzzetti et al., 2012). With the robust development of machine learning, researchers have been able to explore different landslide classification or zoning methods using algorithms such as logistic regression, support vector machines, decision trees, and random forests (Mohan et al., 2021). In recent years, numerous studies have utilized high-resolution imagery and deep learning models based on Convolutional Neural Networks (CNNs) to extract landslides, achieving promising results (Ghorbanzadeh et al., 2019; Sameen and Pradhan, 2019; Shinde et al., 2019; Morales et al., 2022). Although the aforementioned optical remote sensing image analyses for landslide extraction are typically limited to smaller spatial scales, they have provided valuable insights into the distribution and characteristics of landslides. Common challenges in this field, such as small extraction regions, significant preprocessing workload and the high cost of acquiring high-resolution imagery, are still needed to be improved. 4) In recent years, the cloud platforms, like GEE, have significantly developed research into large-area landslide extraction. This development has enabled the wide application of exponential methods for rapid and large-scale landslides extraction using medium-resolution remote sensing images, which improves the efficiency and accuracy.
In total, current TP geological disasters research mainly focuses on its eastern edge (Su et al., 2008; Yang et al., 2018; Dai and Deng, 2020). However, research on landslides in southern TP is few due to its inconvenient transportations. Therefore, the objective of this study is to reveal the distribution of geological disasters and their driving mechanisms in southern TP. Additionally, most studies focus on the disasters causes, while few research indicates the relationship between multi-year environmental changes and landslide occurrence (Gariano and Guzzetti, 2016). Therefore, establishing a quantitative model indicating the relationship between landslide changes with environmental factors are important in understanding landslide patterns in the southern TP, assessing environmental impacts, and improving the precision of geological disasters prevention.
In this study, a variety of feature indices were utilized for the initial extraction of landslide information. This approach not only enhances the efficiency of extraction but also helps in identifying the primary features distinguishing landslides from non-landslide areas. We use indices for the preliminary extraction of landslides, which include the Normalized Difference Vegetation Index (NDVI), Bare Soil Index (BSI), and Normalized Difference Snow Index (NDSI). The calculation methods for these indices are as outlined in Formulas 1–3,
Where
On Sentinel-2A imagery with 10 m resolution, landslides exhibit significant spectral differences from vegetation, water bodies, and snow, but are spectrally similar to bare soil, buildings, and river deposits. The spectral reflectance characteristics of the main land cover types in the study area on Sentinel-2 imagery are shown in Figure 1A.
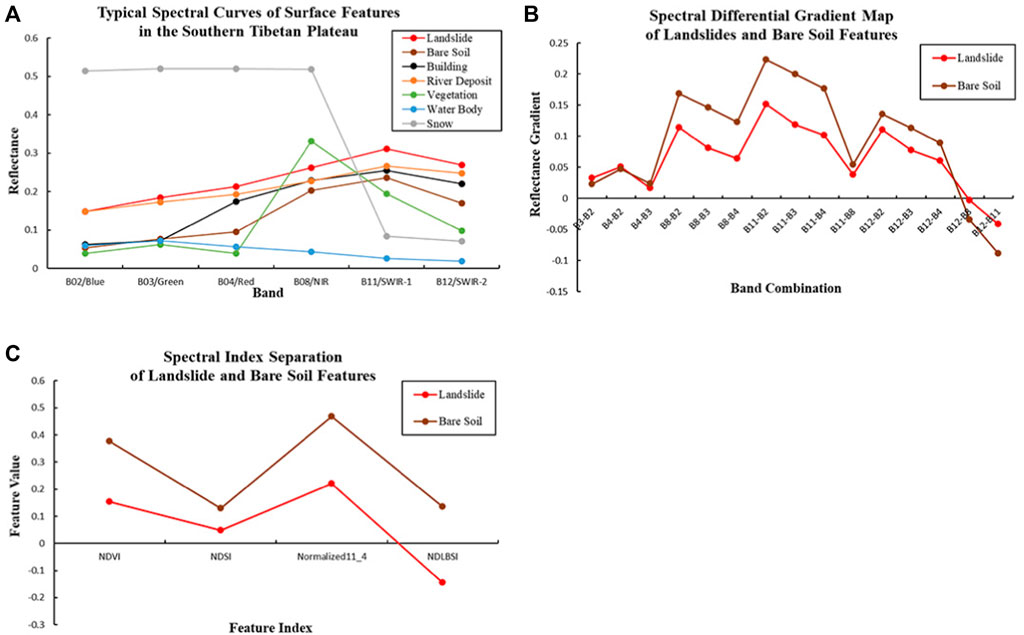
Figure 1. NDBLSI construction schematic figures. (A) Spectral curves of typical land features in the study area. (B) Differential spectral curve chart between bands. (C) NDLBSI separation chart for landslides and bare soil.
The spectral curves of bare soil and landslides show similarities, making it challenging to distinguish between them using soil-related feature indices alone. In this study, based on annual remote sensing images synthesized on the GEE platform and referencing to Google Earth satellite data, approximately 30,000 sample pixels of landslides and bare soil were selected through visual interpretation. During sample selection, principles of uniformity and strong representativeness were applied. Additionally, by comparing imagery from adjacent years, pixels in the composite images were visually assessed to determine whether they represented landslides or bare soil, ensuring the non-migratory nature of the sample points.
Analysis on the spectral data of samples selected from 2019 to 2023 in the study area reveals that although bare soil and landslides have similar spectral trends, there are significant different in the rate of change between certain bands. This is because the surface rock and soil structure of landslides are loose, with higher porosity and moisture content, resulting in a slower increase in reflectance in the near-infrared and short-wave infrared bands compared to bare soil spectra (Wen et al., 2020). By calculating the differences between bands, the red band and short-wave infrared 1 band, which showed the greatest difference, were selected, as shown in Figure 1B. The red band is typically used for observing exposed soil and vegetation, while the short-wave infrared 1 band reduces atmospheric effects and helps distinguish soil and water information (Zhou, 2023).
By stretching and amplifying the differences between the red and short-wave infrared 1 bands, and tuning the stretching factor hyperparameters through sample points, the NDLBSI was calculated for these two bands. The optimal stretching factor was selected based on the principle of maximizing the difference in NDLBSI values between landslides and bare soil, and minimizing the absolute difference in NDLBSI values. The calculation method for NDBLSI is as shown in Formula 4:
Where
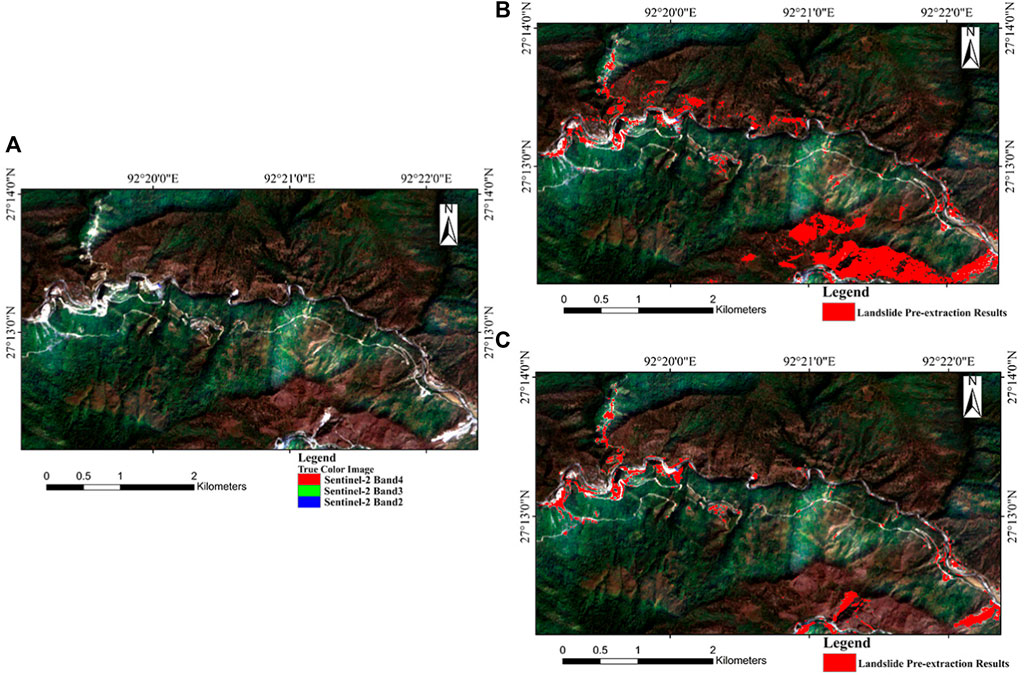
Figure 2. Comparison of landslide extraction results. (A) Original image of a local area in Cuona county. (B) Landslide extraction results using soil index BSI. (C) Landslide extraction results using BSI+NDLBSI.
Additionally, to verify the capability of Sentinel-2 imagery in landslide detection and the accuracy of the extraction method proposed in this study, a field survey was conducted in Linzhi City, Tibet Autonomous Region, at the end of July 2023. Out of 16 pre-identified landslide sites, 14 were confirmed as small-scale landslides, while the remaining 2 were exposed bedrocks, as shown in Supplementary Figure S1A. Furthermore, the landslide extraction algorithm developed in this research was applied to the 2022 Sentinel-2 satellite composite imagery of Linzhi City, accurately identifying all 14 surveyed landslide sites. This field investigation confirmed the effectiveness of Sentinel-2 imagery in identifying small and medium-sized landslides and also validated the accuracy and reliability of the landslide extraction method proposed in this paper (Supplementary Figure S1B).
The Otsu algorithm is a non-parametric, unsupervised method for image threshold segmentation. It calculates all possible thresholds to find the one with the maximum inter-class variance and minimum intra-class variance, suitable for bimodal histograms (Otsu, 1979). Compared to the dependency of the Otsu algorithm on bimodal distribution and its limitation in handling multimodal histograms, where the derived threshold tends to be biased towards the dominant side of the histogram, Yan et al. (2017) proposed an improved Otsu algorithm to address this issue. This algorithm iteratively reduces the number of peaks in the data histogram and narrows the search range for the threshold, approaching the optimal threshold. After each iteration, the current threshold value
Assuming
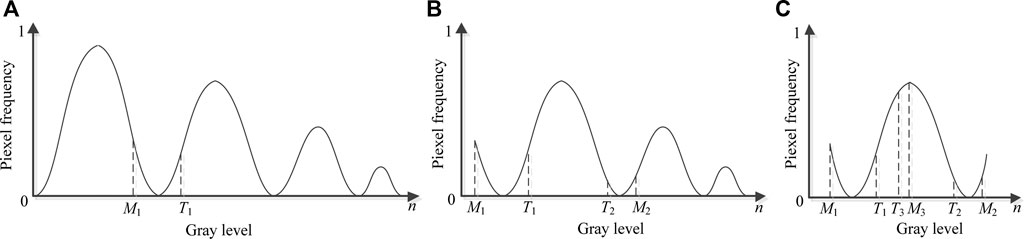
Figure 3. Schematic diagram of threshold determination using the improved Otsu method. (A) First Otsu threshold calculation. (B) Threshold calculation for samples excluding those less than
In the figure, the horizontal axis represents pixel gray levels (0∼n), and the vertical axis represents the frequency of gray level
Multivariate regression analysis is a statistical method used to establish a relationship model between a dependent variable and independent variables. Its basic formula is as shown in Formula 5:
In this equation, Y is the dependent variable,
Taking the mathematical expectation of both sides of the Eq. 6, the equation is as follows:
Where
In this equation,
Parameters can be obtained through least squares estimation using Eq. 8:
Where by taking partial derivatives of
Feature classification assessment is an essential component of remote sensing monitoring, with the most commonly used evaluation method of the confusion matrix approach (Yang et al., 2023). In this study, the confusion matrix is calculated by comparing each visually identified actual land feature element with its corresponding classified element. As shown in Supplementary Table S1, each column data of the confusion matrix represents the actual measured information, and each row data represents the classified information from remote sensing imagery. The performance of the classification extraction method is quantitatively evaluated using sample points, employing metrics such as Precision, Recall, and Overall Accuracy (OA) for a quantitative assessment of the results.
User’s Accuracy (UA) represents the reliability of predictions for each class on the classification map, indicating the proportion of correctly classified instances of a particular category relative to the total instances of that category classified in the classification map refer to Formula 9:
Where
Producer’s Accuracy (PA) indicates how well the classification predicted each class, reflecting the probability that the ground truth reference data of a category is correctly classified refer to Formula 10:
Where
Overall Accuracy (OA) is the percentage of all correctly classified points of land cover categories out of the total number of validation points refer to Formula 11:
Where
The Kappa coefficient is an indicator of how much better the classification results are compared to random classification. The Kappa coefficient generally ranges from 0 to 1, with higher values indicating higher classification accuracy refer to Formula 12:
Where
From 2019 to 2023, over 30,000 landslide and bare soil sample points were selected for extraction result validation in the southern region of the TP by each county.
(1) The Pearson correlation coefficient is a measure of the linear correlation between two variables (He, Long, and Zhu, 2012).
Its formula is defined as Formula 13:
Where
(2) The multiple correlation coefficient reflects the degree of correlation between a dependent variable and a set of independent variables (Jia, He, and Jin, 2015). A higher multiple correlation coefficient indicates a closer linear correlation between the variables. The range of the multiple correlation coefficient is [0,1], with values closer to 1 indicating stronger correlation.
The T-test in multivariate linear regression is used for the significance testing of individual variable coefficients, typically measured by the p-value. Generally, a p-value less than 0.05 is considered statistically significant, and that less than 0.01 is considered highly significant. This implies that the probability of the sample differences due to sampling error is less than the significance level.
After calculating the p-value, compare the given significance level
To establish a model correlating changes of landslide areas with environmental factors, it is first necessary to extract landslide areas for each county, as well as corresponding environmental factors for those regions. Subsequently, single-factor analysis is utilized to identify the environmental factors with relatively strong inter-annual correlation with landslide changed areas.
(1) Landslide extraction: Due to the extensive area of the southern TP, landslides are extracted based on the administrative divisions of Chinese counties. Due to significant cloud cover in the region, making it challenging to obtain complete county imagery in the short term, all images covering the study area within a year are processed for cloud removal and median compositing. The images are then cropped using county vectors, and snow-free areas with high vegetation cover are delineated out. A comprehensive feature index is used to establish river and road network buffer zones, and a slope threshold is set for landslide extraction.
Additionally, post-processing of the landslide extraction results involves removing fragmented pixels and masking out disturbances such as uncertain snow cover at the study area’s boundaries, thin cloud interference, and misclassified river deposits due to DEM precision limitations. Masks from 5 years are overlaid to process annual landslide extraction results, ensuring spatial consistency in landslide area statistics.
(2) Sensitive environmental factors selection: To identify the main environmental factors influencing landslide area changes, single-factor correlation analysis is conducted using their standardized data. By retaining data within three standard deviations and excluding outliers, the correlation coefficients between interannual standardized landslide area changes (s) and each environmental factor are obtained.
(3) Model: Based on the above data, the least squares multivariate statistical analysis method is used to establish a model for standardized landslide area changes (s). Following model establishment, its accuracy is calculated to determine whether the model requires refinement or not. If the precision meets the requirements, the model is outputted. Otherwise, the reasons are analyzed, and the model is reestablished. For example, if the p-value of the factor does not pass the t-test, it needs to be removed and re-established. Figure 4 illustrates the technical flowchart for model construction.
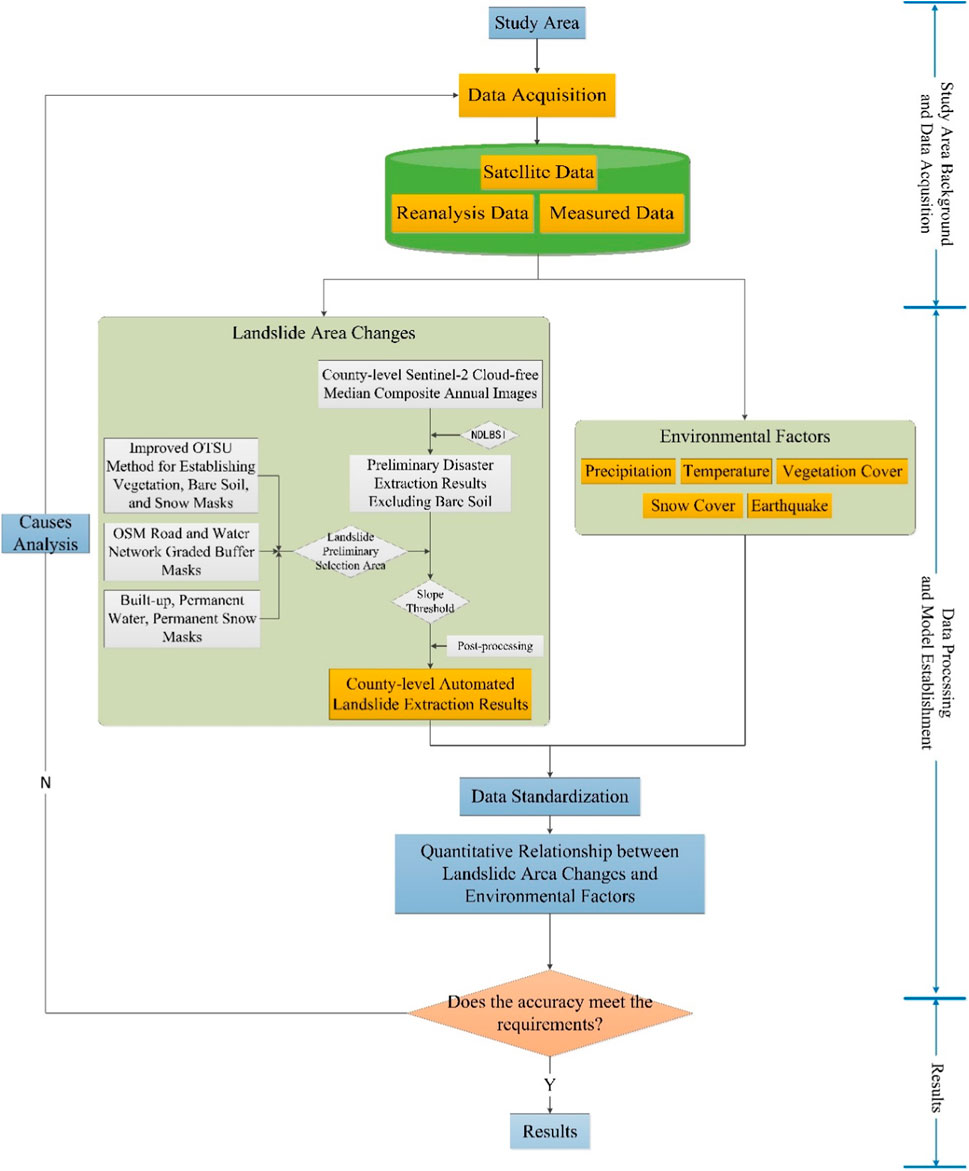
Figure 4. Technical flowchart for establishing a model of annual standardized landslide area changes and environmental factors.
The TP, known as the Earth’s “Third Pole,” is predominantly situated in Qinghai Province and the Tibet Autonomous Region in the southwestern China (Zhang, Li, and Zheng, 2002). In the central and western regions of the TP, the landscape predominantly features deserts and mountains with limited vegetation cover. These areas are characterized by few human activity, and the geological disasters primarily consist of ancient landslides and debris flows, which contribute to relatively minor changes in recent geological disasters.
The southern region of the TP, with the world’s deepest canyon, is recognized for having the richest vertical natural zones in global mountainous areas. Influenced by the southwest monsoon from the Indian Ocean and warm, moist air currents, this region experiences a warm, humid climate with abundant rainfalls. The significant diurnal temperature variation, exacerbated by altitude, intensifies rock weathering, leading to frequent landslide disasters (Shen et al., 2022; Jiang et al., 2023). Additionally, Milin County and Bayi District have higher population densities, particularly Bayi District, which serves as the administrative center of Nyingchi City. It is the main urban and commercial hub in the region, with well-developed transportation and high levels of human activity. Conversely, Longzi County, Cuona County, Motuo County, Zayü County, and Bomi County have lower population densities, with a larger proportion of agricultural and pastoral populations. In these areas, geological disasters are more influenced by natural factors.
As shown in Figure 5, with geographical coordinates of 91°20′- 98°40′E and 26°50′- 30°40′N, the study area are characterized by high vegetation cover and low human activity, including Cuona County, Motuo County, Longzi County, Bomi County, and Chayu County. The region is marked by considerable elevation variations, ranging from 46 m to 7,182 m, with an average elevation of 3,258 m (Figure 5).

Figure 5. Map of the study area (map on the left shows the location of study area in China).
In this study, remote sensing imagery of the research area was collected and analyzed to extract landslide data. Additionally, environmental factors such as temperature, precipitation, vegetation cover, snow cover, and seismic magnitude and distribution data were also collected.
Landslides are among the most frequent and impactful types of geological disasters. They represent a material wastage process affecting natural and engineered slopes, characterized by the movement of large volumes of rock, debris, or soil downslope under the influence of gravity. (Hungr et al., 2014; Gariano and Guzzetti, 2016). According to the national geological disaster report released by China, landslides accounted for approximately 70% of all geological disasters in 2022. In this paper, landslides are broadly defined as recent landslides, which are characterized by exposed debris and bedrock on slopes without vegetation cover, including landslides and debris flows (Zhao et al., 2022). The area of a landslide is determined by the extent of the slope with a certain degree of steepness as observed on the remote sensing imagery. The spatiotemporal variation of landslide areas is a critical indicator for evaluating the characteristics of regional geological disasters. This study utilizes Sentinel-2 remote sensing data with a spatial resolution of 10 m to analyze landslides. The selected image temporal series for the study area are from January 2019 to November 2023.
Utilizing the GEE platform, we acquired a range of datasets covering the study area, including medium-resolution Sentinel-2 imagery, cloud probability data, Digital Elevation Model (DEM), Land Use/Land Cover (LULC), climate reanalysis and satellite precipitation data. Additionally, precipitation satellite data accuracy was verified using actual measurements from meteorological stations. Post-processing of the landslide extraction results was conducted using OpenStreetMap (OSM) road and water network data, and the accuracy of the landslide extraction methods was validated with field survey results. Due to the limitations in image acquisition time, all data are from 2019 to 2023 (Table 1).
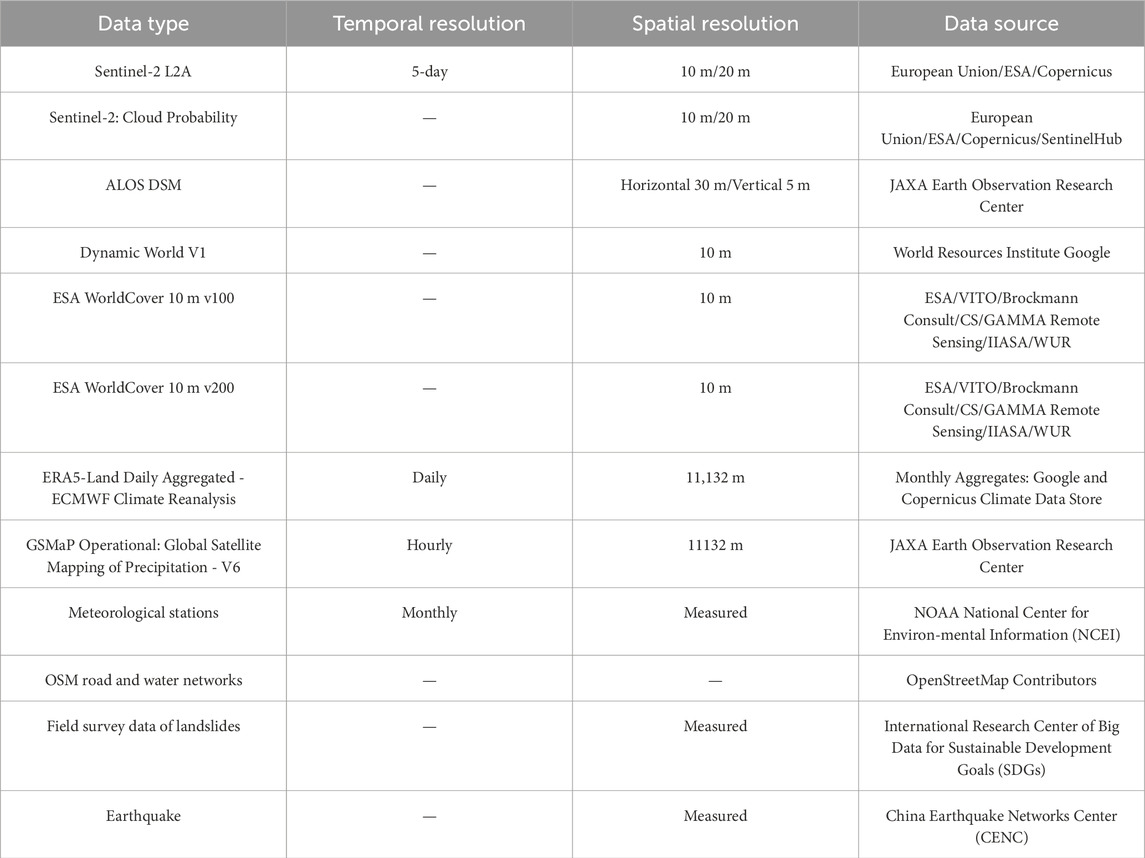
Table 1. Data acquisition for each data type.
Sentinel-2, operating under ESA’s Copernicus program, is a multispectral imaging satellite equipped with 13 spectral bands, primarily used for land monitoring and disaster studies. It features a 2–5 days revisit cycle and provides Level-2A surface reflectance data, processed using the sen2cor algorithm, making it an invaluable free resource for high-resolution imagery (Chen and Hao, 2018). Additionally, the Sentinel-2 cloud probability product, which utilizes Sentinel Hub’s algorithm alongside Google’s computing resources, enables precise cloud masking. This satellite’s imagery is instrumental in extracting detailed vegetation and snow cover data.
For digital surface modeling, the ALOS World 3D - 30 m (AW3D30) is a widely-used global dataset that provides elevation data crucial for various geospatial studies (Takaku, Tadono, and Tsutsui, 2014). Meanwhile, Dynamic World offers near-real-time land use and land cover (LULC) data derived from Sentinel-2 L1C imagery, facilitating timely environmental monitoring (Brown et al., 2022).
ESA WorldCover presents a 10 m resolution global land cover map that integrates data from both Sentinel-1 and Sentinel-2. This resource is particularly useful for comprehensive landscape analyses and is available for the years 2020 and 2021 on the GEE platform (Zanaga et al., 2021; Zanaga et al., 2022).
For meteorological data, the ERA5-Land reanalysis dataset merges model outputs with observational data to offer high-resolution global land variable data spanning nearly 70 years. This dataset includes temperature data, which is crucial for assessing climate impacts on land cover and geological phenomena (Muñoz Sabater, 2019). Additionally, GSMaP provides global hourly rainfall rates, optimized using NOAA/CPC gauge measurements, offering valuable insights into precipitation patterns essential for hydrological studies (Kubota et al., 2020). The measured meteorological data from NOAA align with the standards set by the World Meteorological Organization’s (WMO) World Weather Watch Program Resolution 40.
Lastly, OpenStreetMap (OSM) supplies an open-source mapping database that includes layers such as water systems and transportation networks. These layers are compiled from both community contributions and official surveys, serving as critical tools for urban planning and infrastructure development.
The China Earthquake Networks Center (CENC) utilizes the seismic monitoring network to monitor the propagation and vibration of seismic waves in real-time. It achieves this through a widespread network of seismographic stations and seismic monitoring equipment, providing real-time dissemination of relevant information about seismic events. This includes the magnitude, occurrence time, location, and possible impact range of earthquakes.
(1) GEE is a visualization platform for processing satellite imagery and analyzing geographic data, offering access to Sentinel satellite imagery datasets and rapid image preprocessing algorithms. It significantly reduces the workload of image mosaicking, geometric correction, radiometric correction, atmospheric correction, and cloud masking.
This study utilizes the GEE platform, employing an image median composite strategy. Data from January 2019 to November 2023 were annually composited and then cropped to obtain snow-free vegetated areas. For each year, six bands (blue, green, red, near-infrared, short-wave infrared 1, and short-wave infrared 2) of the Sentinel-2 raw dataset were processed on the GEE platform following these steps.
1) The annual raw Sentinel-2 image dataset L for the study area was extracted.
2) The cloud removal process utilized Cloud Probability data on the GEE platform. This process reconstructed the image with the least cloud cover by selecting pixels with the lowest cloud score.
3) The annual composite images were then cropped using snow-free vegetated areas in each county, resulting in the delineation of the landslide study area.
A total of 24,212 Sentinel-2 L2A images were used in this study (Supplementary Table S2).
(2) In this study, the processed remote sensing data consisted of annual composite images. Coe and Godt found that all carefully considered studies attempting to predict shallow landslides and debris flows triggered by rainfall possess high uncertainties; this is a result of the difficulty in predicting short-term extreme storms. Conversely, studies that attempt to predict landslide activity using temperature and annual/seasonal rainfall show lower uncertainties; this is because temperature and annual/seasonal rainfall can be predicted with less uncertainty (Coe and Godt, 2012). Therefore, the rainfall rate data provided by the GSMaP, measured in mm/h, were converted into annual average precipitation data (in mm/month). Temperature data were based on ERA5-Land daily reanalysis data, representing air temperature at 2 m above the land surface, interpolated between the lowest model height and the Earth’s surface under atmospheric conditions. These temperature data whose unit was in K/day, were converted to °C/day to obtain annual average temperature data, facilitating subsequent analysis.
Environmental factors data for vegetation cover and snow cover area were extracted by unifying the scope of county areas and applying threshold divisions. This involved extracting data from 10 m resolution annual composite images for each specific region.
Snow cover assessment was conducted using the Normalized Difference Snow Index (NDSI) for threshold-based extraction from the composite imagery. Given the predominant distribution of snow in higher elevation areas, snow cover areas within each region were quantified using threshold values.
Vegetation cover was extracted using the Normalized Difference Vegetation Index (NDVI) applied to composite imagery. Validation of NDVI values for landslide and bare land sample points indicated that their NDVI values generally ranged between 0 and 0.4. Therefore, a vegetation extraction threshold of 0.4 was set.
Regarding earthquake frequency, the number of felt earthquakes with magnitude 3 or above was statistically counted for each county from 2019 to 2023, on an annual basis.
(3) Due to the differing nature of each environmental factor, they are very different in data magnitudes and dimensions. When the baseline or variation of magnitudes among factors is significant, parameters with higher numerical values may become more prominent in integrated analysis, while the influence of parameters with lower values may be diminished (Wang et al., 2022). Therefore, it is necessary to standardize each factor to ensure uniformity of dimensions and comparability of data.
Therefore, data can be standardized using Formula 14:
Where
The Producer’s Accuracy of landslide pre-extraction, as well as the Overall Accuracy and Kappa coefficient for the separation of landslides and bare soil were calculated (Supplementary Tables S3–S5).
The pre-extraction results of landslides were corrected through expert experience and visual comparison. The interannual distribution maps of landslides from 2019 to 2023 are shown in Figure 6.
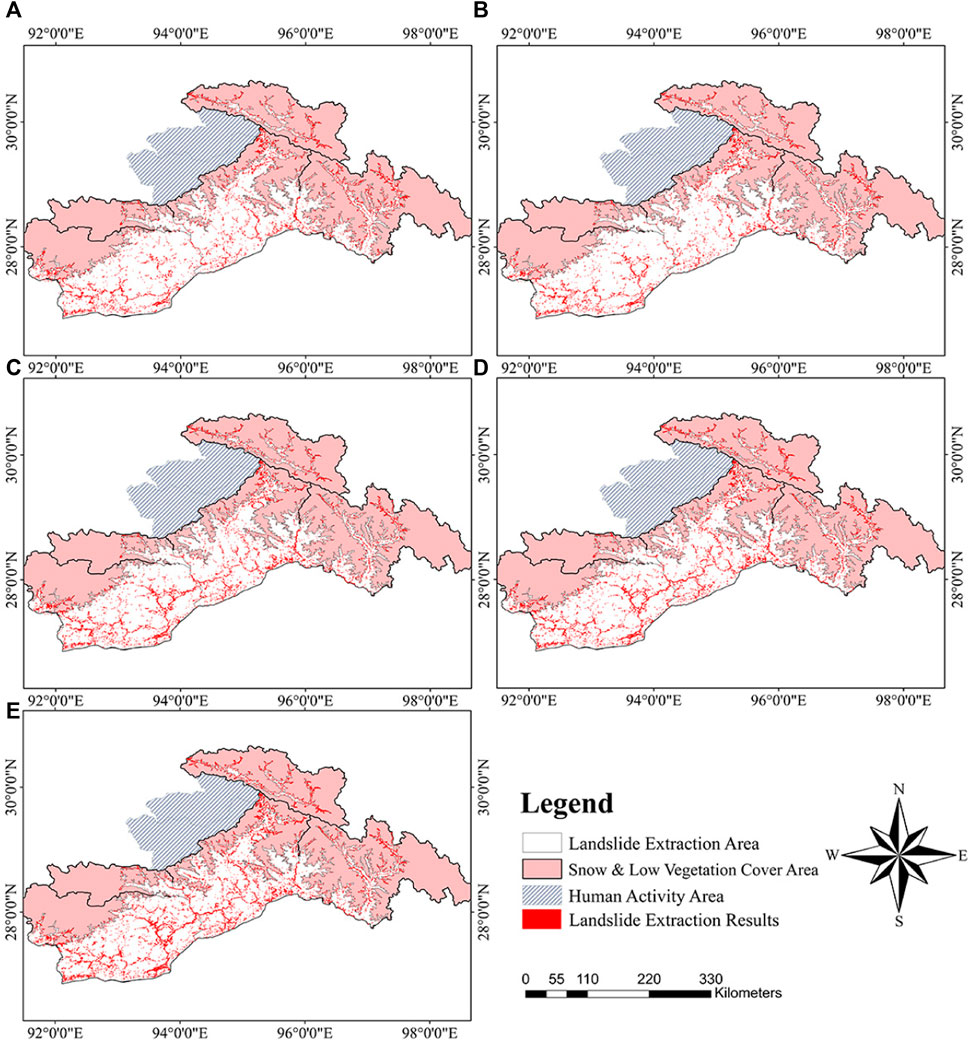
Figure 6. Distribution map of landslides in the southern Tibetan plateau study area from 2019 to 2023. (A) 2019. (B) 2020. (C) 2021. (D) 2022. (E) 2023.
Over the past 5 years, there has been a significant increasing trend in landslide areas across the counties of the southern TP. The growth rate of standardized landslide areas in the study region is almost consistent. The changes in landslide areas and standardized area changes extracted for each county are shown in Figure 7.
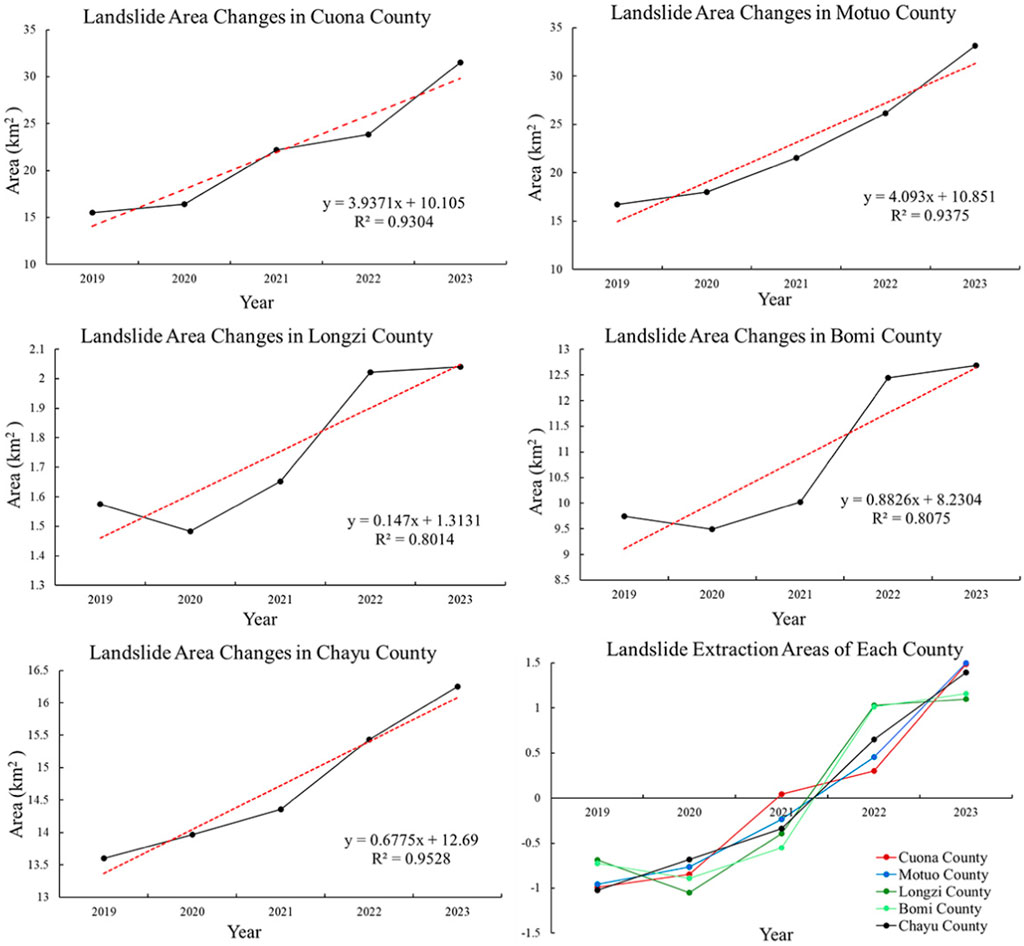
Figure 7. Changes in landslide area and standardized area in the counties of the southern Tibetan plateau.
As can be seen from Figure 8A, from 2019 to 2023, in the low mountainous areas at elevations of 0–500 m, the newly added landslide area accounts for 15.96% of the study area. The mid-mountain areas at elevations of 500–3500 m showed the most significant increase in landslide area, accounting for 80.95%, while the high mountain areas above 3500 m contributed to 3.09% of the new landslide areas. This is mainly because mountainous areas below 3500 m with numerous valleys and steep slopes, are more prone to generate landslides. In contrast, areas above 3500 m, predominantly glaciated, have lower soil moisture under cold and frozen conditions, and the frozen soil and rock are more stable, making landslides less generated. This indicates that the new landslides in the study area are primarily distributed at elevations between 500 and 3500 m.
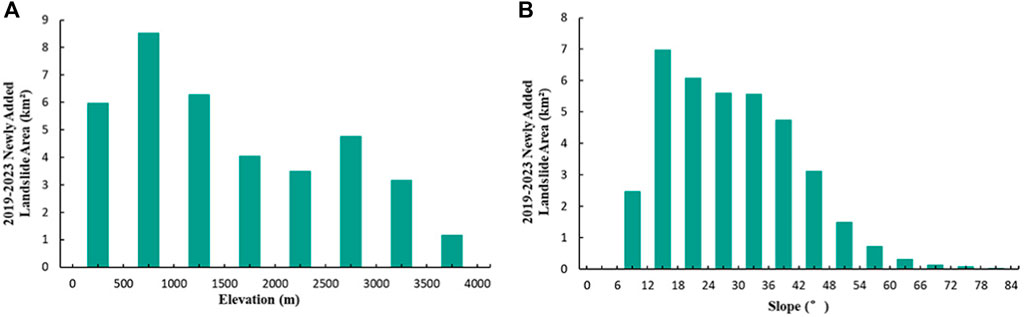
Figure 8. Relationship between newly added landslide areas and topographic elevation and slope in the southern Tibetan plateau region from 2019 to 2023. (A) Elevation. (B) Slope.
Additionally, the spatial distribution of new landslide disasters also shows a certain relationship with slope. As shown in Figure 8B, in areas with slopes of 10°–20°, the newly added landslide area accounts for 25.35% of the total, 58.99% in areas with slopes of 20°–40°, 12.33% in areas with slopes of 40°–50°, and 3.33% in areas with slopes over 50°. Landslides are less likely to occur in plains and hills with slopes less than 10°. In areas with slopes of 10°–50°, due to steep terrain, landslides are more frequent. In contrast, in extremely steep areas with slopes greater than 50°, surface materials struggle to accumulate stably on slopes, making collapses more likely and reducing the possibility of large-scale landslides.
From 2019 to 2023, the southern TP exhibited significant interannual variability in environmental factors such as precipitation, temperature, vegetation cover, and snow cover, which have direct implications for landslide occurrence.
To ensure the accuracy of precipitation data, we compared the monthly precipitation amounts from meteorological stations for the years 2019–2023 with the total monthly precipitation calculated at the station locations using GsMap satellite data. Supplementary Figure S2A shows the distribution of five meteorological stations in the vicinity of the study area. The fitting results in Supplementary Figure S2B demonstrate excellent agreement, validating the feasibility of satellite-derived precipitation measurements. The time series graph of annual average precipitation for the five counties, shown in Supplementary Figure S3, indicates that at the county level, due to differences in county area sizes, there are variations in the magnitude of annual average precipitation. Over the past 5 years, there has been no significant long-term increasing or decreasing trend in annual precipitation in these counties, but rather a fluctuating pattern. Peaks in annual average precipitation were observed in both 2020 and 2022, with an overall weak downward trend.
At the county level, although the annual average temperatures in each county are relatively low, they have shown a significant increasing trend over the past 5 years. The changes in annual average temperature for each county in the southern TP from 2019 to 2023 are shown in Supplementary Figure S4.
At the county level, the vegetation cover area in each county has shown an increasing trend over the past 5 years. In particular, Motuo County has shown a weaker growth trend, with a peak change in 2020. The changes in interannual vegetation cover area for each county in the southern TP from 2019 to 2023 are shown in Supplementary Figure S5.
Considering the limited snow cover areas in the landslide extraction regions of each county and the higher elevations at the boundaries of county-level watersheds with extensive glacier and snow cover, the interannual snow cover area is based on the complete county-level watersheds. Except for Cuona County, which shows a weaker downward trend, the snow cover area in the other counties has shown a significant fluctuating downward trend over the past 5 years. The changes in interannual snow cover area for each county in the southern TP from 2019 to 2023 are shown in Supplementary Figure S6.
At the county level, the frequency of earthquakes over the past 5 years has not shown significant interannual regularity, but the epicenters are widely distributed across the study area (Supplementary Figure S7A). Statistical data indicate that there were 263 occurrences of perceptible earthquakes ranging from magnitude 3 to 4.5, and 48 moderate to large earthquakes of magnitude 4.5 and above.
Create a data grid for the study area, with grid cell dimensions set at 11132 m × 11132 m based on the maximum resolution of environmental factor data. Analyze and display the distribution and variations of landslide areas in relation to environmental factors across each grid (Sun et al., 2020). Importantly, due to the highly dispersed nature of earthquake events annually within the study area, seismic factors were excluded from the analysis.
The correlation coefficient between landslide area and annual average precipitation was calculated, retaining grids with an absolute value greater than 0.3 for significance testing, resulting in the significance map (Figure 9A). As indicated in Supplementary Table S6, the area of landslide positively correlated with precipitation comprises 46.7%, with 0.4% showing significant positive correlation and 0.9% showing highly significant positive correlation. Areas with a negative correlation account for 53.5%, with 2.7% showing significant negative correlation and 1.3% showing highly significant negative correlation. The results reveal that positive correlations are present only in parts of Longzi and Chayu counties, while most areas exhibit negative or no correlation. Therefore, the impact of annual average precipitation over the past 5 years on the changes of landslide area in the southern TP is relatively weak.
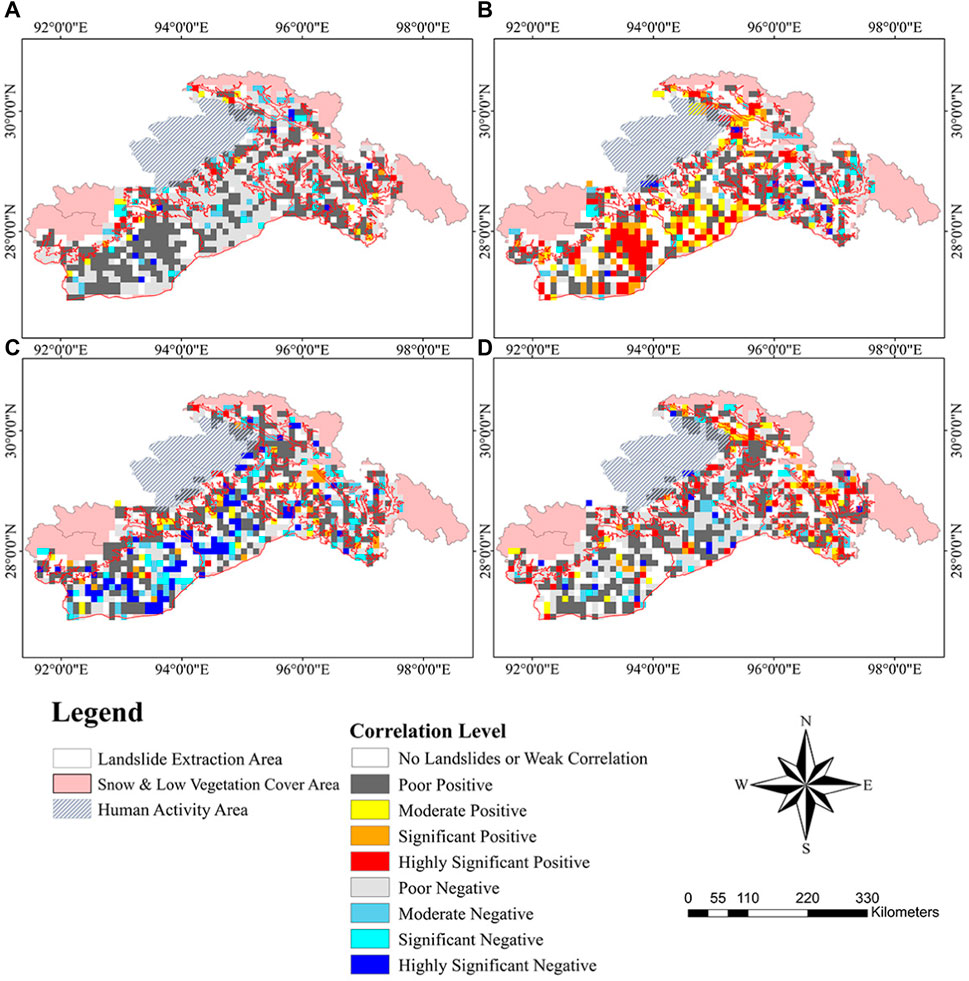
Figure 9. Grid map of correlation between landslide area and different environmental factors in southern Tibetan plateau from 2019 to 2023. (A) Annual average precipitation. (B) Annual average temperature. (C) Interannual vegetation cover area. (D) Interannual snow cover area.
As shown in Figure 9B, in the southern TP, affected by altitude, there is a significant climate variation. The correlation coefficient between landslide area and annual average temperature was calculated, retaining grids with an absolute value greater than 0.3 and using the p-value from the T-test for significance testing. As indicated in Supplementary Table S6, the area where landslide size positively correlates with temperature accounts for 69.2% of the study area, with 8.9% showing significant positive correlation and 14.8% showing highly significant positive correlation, mainly distributed in Cuona, Motuo, and Bomi counties. Areas with a negative correlation account for 30.8%, with 3.3% showing significant negative correlation and 2.3% showing highly significant negative correlation. These results suggest that temperature has a strong impact on the variation of landslide areas in the southern TP.
The landslide area in this paper is located in a region with high vegetation cover. The correlation coefficient between landslide area and interannual vegetation cover area was calculated, retaining grids with an absolute value greater than 0.3 for significance testing, resulting in the significance map (Figure 9C). As shown in Supplementary Table S6, the area of landslide positively correlated with vegetation cover comprises 48%, with 2.7% showing significant positive correlation and 0.9% showing highly significant positive correlation. Areas with negative correlation account for 52%, with 5.9% showing significant negative correlation and 12.3% showing highly significant negative correlation. The results indicate a substantial proportion of significant negative correlation between the increase in landslide area and vegetation cover.
The correlation coefficient between landslide area and the partial interannual snow cover area included in the grid is calculated. Grids with an absolute value greater than 0.3 are retained for significance test, resulting in the significance map shown in Figure 9D. As indicated in Supplementary Table S6, the area where landslide area positively correlated with snow cover comprises 57.8% of the study area, with 3.8% showing significant positive correlation and 5.3% showing highly significant positive correlation. Areas with negative correlation account for 42.2%, with 1.6% showing significant negative correlation and 2.4% showing highly significant negative correlation. These results suggest that the limited snow cover within the study area has a limited direct impact on most of the internal areas of the counties.
Considering the varying impacts of different environmental factors on landslide changes at the grid level, this study conducts overall relationship modeling using county-level watershed environmental data. Analysis was performed on 25 sets of annual data from five counties in the study area from 2019 to 2023. After outlier testing, the correlation coefficients between the annual standardized landslide area and the selected environmental factors are shown in Table 2.
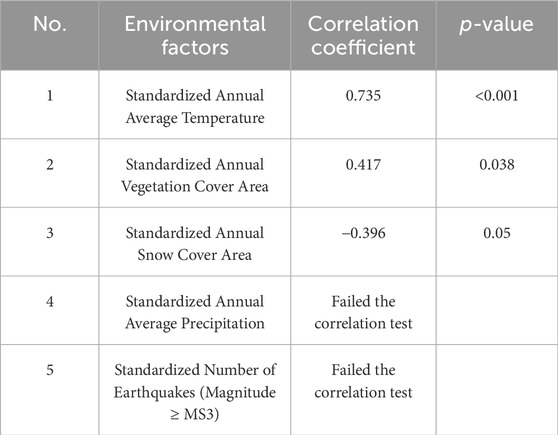
Table 2. Correlation coefficients between standardized annual landslide area and environmental factors.
As shown in Table 2, environmental factors with absolute correlation values greater than 0.3 and passing correlation test were selected for subsequent multivariate regression analysis.
A model was established for the relationship between the annual standardized change in landslide area (s) and the selected environmental factors, excluding factors whose p-values did not pass the t-test. The model is expressed as:
In this model,
The fit between the actual values of standardized landslide area and the model’s predicted values is shown in Figure 10. As can be seen from Figure 10, the determination coefficient (
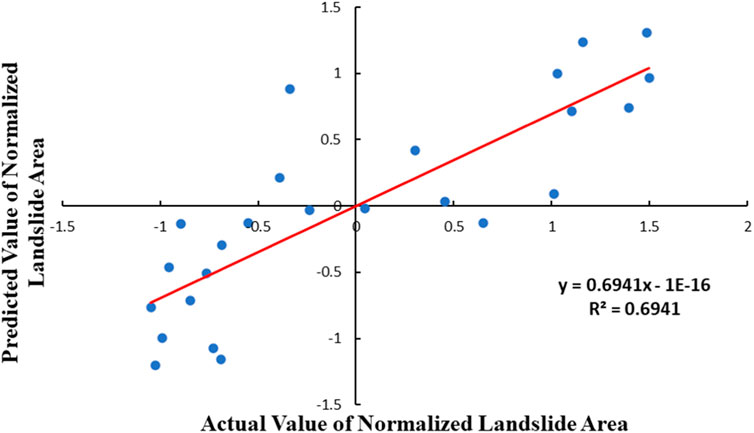
Figure 10. Fitting relationship between actual and predicted values of the model for interannual changes in landslide area and environmental factors in the southern Tibetan plateau.

Table 3. T-test of regression coefficients.
Since 1960, the annual average precipitation in China has shown an overall increasing trend with significant regional variations and fluctuations in rainfall patterns (Tong et al., 2023). Despite this, the observed decrease in precipitation over the short time from 2019 to 2023 in the southern TP is a normal phenomenon. Influenced by the maritime southwest monsoon from the Indian Ocean, this study area experiences abundant moisture, resulting in generally high precipitation levels (Bai, Cuo, and Wang, 2022). Prolonged periods of high precipitation may have already weakened slope stability. However, during this 5-year period, the decrease in precipitation was not the direct driving factor for the increase in landslide areas in the southern TP. The reduction in precipitation could lead to drying and shrinking of soil and rock, thereby reducing soil adhesion and stability. Furthermore, the decrease in regional precipitation may indicate that local precipitation events are becoming more sudden and intense, which can still trigger geological disasters such as landslides. Additionally, global climate change might be leading to an increase in the frequency and intensity of extreme weather events, such as short-duration heavy rainfall. Although these events do not significantly affect the annual average precipitation, they could be key factors in landslide occurrences.
The average annual temperature has a significant and positive influence on the increase in landslides. Over the past 50 years, the glaciers in the TP have experienced a 15% retreat due to warming, and extreme temperature events have not only drastically affected the properties of soil and rock by disrupting the freeze-thaw cycle but have also significantly accelerated the melting of snow, glacier retreat, permafrost degradation, and the occurrence of flood events (Gao et al., 2017; Tong et al., 2023). The unique topography and high-altitude environment of the study area make it more sensitive to temperature fluctuations. Moreover, the rate of warming in the TP is faster than the global average rate (Wei and Fang, 2013; Zhao et al., 2021), leading to more frequent and intense freeze-thaw cycles in the permafrost. Additionally, the rise in temperature exacerbates the evaporation of rainwater, increasing the risk of surface water flow and soil erosion (Gariano and Guzzetti, 2016).
Recent studies analyzing the spatiotemporal trends of NDVI over the past 20 years in the TP have shown a general trend of stable growth in vegetation cover, consistent with the findings of this research (Han et al., 2019; Xue and Lu, 2020; Ding et al., 2021). In areas with gentle slopes and stable terrain, where vegetation cover is extensive, the anchoring effect of plant roots and the reduction in the velocity of falling raindrops by foliage can enhance protection and reduce landslide risk. Conversely, in areas with steep, unstable slopes, the growth process of vegetation, particularly through root extension, can disrupt the mechanical stability of the slope, thereby exacerbating landslide formation (Shen et al., 2022). Although the grid-by-grid analysis in the previous sections revealed a higher proportion of grids showing a significant negative correlation between landslide area and vegetation cover over the past 5 years, the contribution of the remaining extensive vegetation growth areas within the basin to regional climate change, surface runoff, and soil moisture distribution cannot be overlooked. Therefore, at a larger spatial scale and under different environmental conditions, this positive correlation reflects the complex interaction between vegetation cover and landslide risk in the southern TP.
The observed negative correlation between inter-annual changes in snow cover and landslide area can be attributed to the fact that melting snow, induced by higher temperatures, not only increases the water content of the slope but also removes support from the base of the slope, thereby reducing its stability (Chiarle et al., 2007; Legg et al., 2014). The absence of snow cover allows precipitation to flow more freely and infiltrate into the soil and rock, weakening the properties of the geologic materials that have been in a moist environment for an extended period. Additionally, the melting of extensive snow cover in the areas surrounding the counties significantly impacts regional climate and runoff, indirectly affecting the occurrence of geological disasters within the counties.
Furthermore, while there is no direct significant correlation between the earthquake frequencies and landslide changes, the potential impact of seismic activity on slope stability cannot be overlooked for the study area is located in the active Himalayan seismic belt with dense fault zones (Sun et al., 2020). The newly formed landslides between 2019 and 2023 are densely distributed near fault lines (Supplementary Figure S7A). Earthquakes can accelerate the movement of geological strata, especially near fault zones where geological structures are fragile and crustal stress is concentrated. As shown in Supplementary Figure S7B, C, through establishing a 20 km buffer zone around geological faults, a 30 km buffer zone around earthquake epicenters with magnitudes above 4.5, and a 15 km buffer zone around earthquakes with magnitudes between 3 and 4.5 (Chen et al., 2013; Yin et al., 2013), we found that during 2019–2023, the newly added landslide area within the seismic impact zone accounted for over 55% of the total newly added landslide area in the study area, with the proportion reaching 65% near fault zones. Therefore, even if statistical data do not show a clear correlation, we still have reason to believe that landslides in the study area exhibit a high sensitivity near earthquake zones and tectonic belts. It is possible that there may be a temporal lag between the occurrence of landslides and seismic activities. Future research could consider a more detailed comparative analysis of long-term seismic activities and landslide events to better understand the dynamic relationship between them.
Based on the GEE platform, an automated method for large-scale landslide extraction in the southern TP has been established, achieving high accuracy in annual landslide extraction. This study analyzed the patterns of change in landslide area and environmental factors from 2019 to 2023 and conducted grid-by-grid analysis to explore their correlation patterns. Moreover, to explore the relationship between changes in landslide area and regional environmental factors (annual average precipitation, annual average temperature, annual vegetation cover, annual snow cover, and earthquake frequency) in the southern TP over past 5 years, a quantitative model was developed correlating inter-annual standardized changes in landslide area with these environmental factors. The results indicate that data standardization highlights the dynamic characteristics of each parameter and ensures comparability among factors of different dimensions. The main conclusions are as follows.
(1) The proposed NDLBSI, based on spectral information, effectively separates landslides from bare soil, enhancing landslide extraction capabilities with an average extraction precision exceeding 85%.
(2) The landslide area changes in the counties of the southern Tibetan Plateau (Cuona, Motuo, Longzi, Bomi, and Chayu) show a significant increasing trend, with almost consistent growth trends after standardization. Over the past 5 years, new landslides in the study area are mainly distributed at altitudes of 500–3500 m and on slopes between 10° and 50°.
Environmental factors also exhibit certain patterns of change. Except for Longzi County, which shows a weak increasing trend in annual average precipitation, other counties exhibit a decreasing trend. Annual average temperature and annual vegetation cover in all counties show significant increasing trends. Annual snow cover, except for a weak decreasing trend in Cuona County, shows a significant decreasing trend in other counties.
Grid-by-grid analysis of landslide area and environmental factors reveals that temperature has a more significant positive influence on the increase of landslide area; a larger proportion of areas show a significant negative correlation between vegetation cover and landslide growth; limited snow cover in the landslide extraction area results in limited direct impact on most landslides; and annual average precipitation has a weaker influence on landslide area changes in the southern TP.
(3) A model correlating inter-annual standardized landslide area changes with environmental factor changes in the southern TP has been established.
On an annual scale, the most correlated standardized factors are annual average temperature (58.4%), vegetation cover (22.4%), and snow cover (19.2%). The results indicate that from 2019 to 2023, annual average temperature is closely related to changes in landslide area, with snowmelt and vegetation growth also contributing to the increase in landslide area.
The results show a correlation coefficient of 0.833 between model predictions and actual values. All standardized data of environmental factors involved in the modeling passed the T-test. Therefore, the model has a good predictive ability, providing a theoretical basis for the study of landslide area changes in the southern Tibetan Plateau and guiding the establishment of relationships between landslide area changes and regional environmental factors in similar areas.
The raw data supporting the conclusion of this article will be made available by the authors, without undue reservation.
WX: Data curation, Formal Analysis, Investigation, Methodology, Software, Validation, Visualization, Writing–original draft. QW: Conceptualization, Funding acquisition, Investigation, Project administration, Resources, Supervision, Writing–review and editing. JY: Data curation, Validation, Writing–review and editing. BY: Writing–review and editing. CH: Writing–review and editing.
The author(s) declare that financial support was received for the research, authorship, and/or publication of this article. This work was supported by the National Natural Science Foundation of China under Grant (number 42071312); the Innovative Research Program of the International Research Center of Big Data for Sustainable Development Goals under Grant (number CBAS2022IRP03); the Hainan Hundred Special Project under Grant [number 31, JTT (2018)]; the National Key R&D Program under Grant (number 2021YFB3900503); and the Second Tibetan Plateau Scientific Expedition and Research (STEP) under Grant (number 2019QZKK0806).
We extend our gratitude to Associate Professor Li Mingxiao from the China Earthquake Networks Center for the provision of earthquake frequency distribution data spanning 2018 to 2023. Acknowledgement for the data support from China Earthquake Disaster Prevention Center, Seismic Active Fault Survey Data Center. (https://www.activefault-datacenter.cn)
The authors declare that the research was conducted in the absence of any commercial or financial relationships that could be construed as a potential conflict of interest.
All claims expressed in this article are solely those of the authors and do not necessarily represent those of their affiliated organizations, or those of the publisher, the editors and the reviewers. Any product that may be evaluated in this article, or claim that may be made by its manufacturer, is not guaranteed or endorsed by the publisher.
The Supplementary Material for this article can be found online at: https://www.frontiersin.org/articles/10.3389/feart.2024.1403888/full#supplementary-material
Bai, M. Q., Cuo, M., and Wang, T. (2022). Analysis on meteorological early warning model of geological hazards in Motuo county. J. Agric. Catastrophology 12 (02), 82–84. doi:10.3969/j.issn.2095-3305.2022.02.027
Brown, C. F., Brumby, S. P., Guzder-Williams, B., Birch, T., Hyde, S. B., Mazzariello, J., et al. (2022). Dynamic world, near real-time global 10 m land use land cover mapping. Sci. Data 9, 251. doi:10.1038/s41597-022-01307-4
Chen, G., Meng, X. M., Qiao, L., Tan, L., Guo, F. Y., and Zhang, Y. J. (2013). Distribution, characteristics, and associated influential factors of the geohazards induced by Minxian-Zhangxian earthquake on 22 July, 2013, Gansu, China. J. Eng. Geol. 21 (5), 750–760. doi:10.3969/j.issn.1004-9665.2013.05.011
Chen, X., and Hao, Z. H. (2018). Sentinel-2A data products' characteristics and the potential applications. Sci. Technol. Vis. (16), 48–50. doi:10.19694/j.cnki.issn2095-2457.2018.16.021
Chiarle, M., Iannotti, S., Mortara, G., and Deline, P. (2007). Recent debris flow occurrences associated with glaciers in the Alps. Glob. Planet. Change 56 (1-2), 123–136. doi:10.1016/j.gloplacha.2006.07.003
Coe, J. A., and Godt, J. W. (2012). Review of approaches for assessing the impact of climate change on landslide hazards. Landslides Eng. Slopes, Prot. Soc. Through Improv. Underst. 1, 371–377.
Cui, P., Dang, C., Cheng, Z. L., and Scott, K. M. (2010). Debris flows resulting from glacial-lake outburst floods in Tibet, China. Phys. Geogr. 31 (6), 508–527. doi:10.2747/0272-3646.31.6.508
Cui, P., Su, F. H., Zou, Q., Chen, N. S., and Zhang, Y. L. (2015). Risk assessment and disaster reduction strategies for mountainous and meteorological hazards in Tibetan plateau. Chin. Sci. Bull. 60 (32), 3067–3077. doi:10.1360/n972015-00849
Dai, F. C., and Deng, J. H. (2020). Development characteristics of landslide hazards in three-rivers basin of southeast Tibetan plateau. Adv. Eng. Sci. 52 (05), 3–15. doi:10.15961/j.jsuese.202000651
Ding, J., Liu, X. Y., Guo, Y. C., and Ren, H. R. (2021). Study on vegetation change in the qinghai-tibet Plateau from 1980 to 2015. Ecol. Environ. Sci. 30, 288–296. doi:10.16258/j.cnki.1674-5906.2021.02.007
Gao, J. (1993). Identification of topographic settings conducive to landsliding from DEM in nelson county, Virginia, USA. Earth Surf. Process. Landforms 18 (7), 579–591. doi:10.1002/esp.3290180702
Gao, Y., Li, B., Feng, Z., and Zuo, X. (2017). Global climate change and geological disaster response analysis. J. Geomechanics 23 (01), 65–77. doi:10.3969/j.issn.1006-6616.2017.01.002
Gariano, S. L., and Guzzetti, F. (2016). Landslides in a changing climate. Earth-Science Rev. 162, 227–252. doi:10.1016/j.earscirev.2016.08.011
Ghorbanzadeh, O., Blaschke, T., Gholamnia, K., Meena, S. R., Tiede, D., and Aryal, J. (2019). Evaluation of different machine learning methods and deep-learning convolutional neural networks for landslide detection. Remote Sens. 11 (2), 196. doi:10.3390/rs11020196
Guzzetti, F., Mondini, A. C., Cardinali, M., Fiorucci, F., Santangelo, M., and Chang, K. T. (2012). Landslide inventory maps: new tools for an old problem. Earth-Science Rev. 112 (1-2), 42–66. doi:10.1016/j.earscirev.2012.02.001
Han, B. H., Zhou, B. R., Yan, Y. Q., Shi, M. M., Su, J. L., Zhao, H. H., et al. (2019). Analysis of vegetation cover change and its driving factors over Tibetan Plateau from 2000 to 2008. Acta Agrestia Sin. 27, 1651–1658. doi:10.11733/j.issn.1007-0435.2019.06.023
He, C., Long, W., and Zhu, F. (2012). Probability theory and mathematical Statistics. Beijing, China: Higher Education Press.
Huang, R. Q., and Li, W. L. (2008). Research on development and distribution rules of geohazards induced by wenchuan earthquake on 12th may, 2008. Chin. J. Rock Mech. Eng. 27 (12), 2585–2592. doi:10.3321/j.issn:1000-6915.2008.12.028
Huggel, C., Clague, J. J., and Korup, O. (2012). Is climate change responsible for changing landslide activity in high mountains? Earth Surf. Process. Landforms 37 (1), 77–91. doi:10.1002/esp.2223
Hungr, O., Leroueil, S., and Picarelli, L. (2014). The Varnes classification of landslide types, an update. Landslides 11 (2), 167–194. doi:10.1007/s10346-013-0436-y
IPCC (2023). “Sections,” in Climate change 2023: synthesis report. Contribution of working groups I, II, and III to the sixth assessment report of the intergovernmental Panel on climate change (Geneva, Switzerland: IPCC), 35–115.
Jiang, W. X., Li, Y. M., Yang, Y. M., Ji, P. K., and Zhao, Z. F. (2023). Identification of geological hazard in Cuona area, south Tibet based on comprehensive remote sensing identification method. J. Inst. Disaster Prev. 25 (03), 1–9. doi:10.3969/j.issn.1673-8047.2023.03.001
Kubota, T., Aonashi, K., Ushio, T., Shige, S., Takayabu, Y. N., Kachi, M., et al. (2020). “Global satellite mapping of precipitation (GSMaP) products in the GPM era,” in Satellite precipitation measurement (Springer). doi:10.1007/978-3-030-24568-9_20
Legg, N. T., Meigs, A. J., Grant, G. E., and Kennard, P. (2014). Debris flow initiation in proglacial gullies on mount rainier, Washington. Geomorphology 226, 249–260. doi:10.1016/j.geomorph.2014.08.003
Liu, G. C., Xing, W. Z., He, H., Zhang, J. M., Ma, Q. C., Wang, H. T., et al. (2023). Remote sensing monitoring of rainstorm disaster landslide based on multi-source index. J. Liaoning Inst. Sci. Technol. 25 (01), 6–9. doi:10.3969/j.issn.1008-3723.2023.01.002
Ma, H. R., Cheng, X. W., Chen, L. J., Zhang, H. T., and Xiong, H. W. (2016). Automatic identification of shallow landslides based on Worldview2 remote sensing images. J. Appl. Remote Sens. 10, 016008. doi:10.1117/1.Jrs.10.016008
Mahdavifar, M. R., Solaymani, S., and Jafari, M. K. (2006). Landslides triggered by the avaj, Iran earthquake of june 22, 2002. Eng. Geol. 86 (2-3), 166–182. doi:10.1016/j.enggeo.2006.02.016
Mohan, A., Singh, A. K., Kumar, B., and Dwivedi, R. (2021). Review on remote sensing methods for landslide detection using machine and deep learning. Trans. Emerg. Telecommun. Technol. 32 (7). doi:10.1002/ett.3998
Morales, B., Garcia-Pedrero, A., Lizama, E., Lillo-Saavedra, M., Gonzalo-Martín, C., Chen, N. S., et al. (2022). Patagonian Andes landslides inventory: the deep learning's way to their automatic detection. Remote Sens. 14 (18), 4622. doi:10.3390/rs14184622
Moreiras, S. M., and Dal Pont, I. P. V. (2017). “Climate change driving greater slope instability in the central Andes,” in Paper presented at the 4th world landslide forum (Ljubljana: SLOVENIA).
Muñoz Sabater, J. (2019). ERA5-Land monthly averaged data from 1981 to present. Copernic. Clim. Change Serv. (C3S) Clim. Data Store (CDS). doi:10.24381/cds.68d2bb30
Otsu, N. (1979). A threshold selection method from gray-level histograms. IEEE Trans. Syst. Man Cybern. 9 (1), 62–66. doi:10.1109/tsmc.1979.4310076
Sameen, M. I., and Pradhan, B. (2019). Landslide detection using residual networks and the fusion of spectral and topographic information. IEEE Access 7, 114363–114373. doi:10.1109/access.2019.2935761
Shen, Z. X., Zhang, Q., Wu, W. H., and Song, C. Q. (2022). Spatial pattern and attribution analysis of the regions with frequent geological disasters in the Tibetan Plateau and hengduan mountains. Acta Geogr. Sin. 77 (05), 1211–1224. doi:10.11821/dlxb202205012
Shinde, R. C., Potnis, A. V., Durbha, S. S., and Andugula, P. (2019). “Compressive sensing based reconstruction and pixel-level classification of very high-resolution disaster satellite imagery using deep learning,” in Paper presented at the IEEE International Geoscience and Remote Sensing Symposium (IGARSS), Yokohama, JAPAN, July–2. August 2019.
Su, F. H., Liu, H. J., and Han, Y. S. (2008). The extraction of mountain hazard induced by wenchuan earthquake and analysis of its distributing characteristic. Natl. Remote Sens. Bull. (06), 956–963. doi:10.11834/jrs.200806128
Sun, G. Q., Chen, F., Yu, B., and Wang, N. (2020). Landslide change and its influence factors in Central Nepal from 2001 to 2017. J. Univ. Chin. Acad. Sci. 37 (03), 308–316. doi:10.7523/j.issn.2095-6134.2020.03.003
Takaku, J., Tadono, T., and Tsutsui, K. (2014). Generation of high resolution global DSM from ALOS PRISM. Int. Archives Photogrammetry, Remote Sens. Spatial Inf. Sci. XL-4, 243–248. ISPRS. doi:10.5194/isprsarchives-xl-4-243-2014
Tong, B., Qi, G., Zhang, Y. X., Shi, J. S., Ma, X. F., and Xu, Y. (2023). Influence of climate change on geological disaster in our country and thoughts on its prevention and control strategy. City Disaster Reduct. (05), 34–42. doi:10.3969/j.issn.1671-0495.2023.05.008
Wang, G. X., Jiang, L. M., Wu, S. L., Shi, J. C., Hao, S. R., and Liu, X. J. (2017). Fractional snow cover mapping from FY-2 VISSR imagery of China. Remote Sens. 9 (10), 983. doi:10.3390/rs9100983
Wang, Q. J., Xie, J. J., Yang, J. Y., Liu, P., Chang, D. K., and Xu, W. T. (2022). Research on permeability coefficient of fine sediments in debris-flow gullies, southwestern China. Soil Syst. 6 (1), 29. doi:10.3390/soilsystems6010029
Wei, Y. Q., and Fang, Y. P. (2013). Spatio-temporal characteristics of global warming in the Tibetan plateau during the last 50 Years based on a generalised temperature zone-elevation model. Plos One 8 (4), e60044. doi:10.1371/journal.pone.0060044
Wen, G. C., Zhang, Z. W., Xiao, X. J., Xie, H. B., Wang, W. B., Yan, Y., et al. (2020). Method for rapid extraction information for post-disaster landslide based on remote sensing images. Chin. J. Geol. Hazard Control 31 (02), 80–86. doi:10.16031/j.cnki.issn.1003-8035.2020.02.11
Xue, Y. H., and Lu, H. W. (2020). Analysis of vegetation cover change and climate driving factors on the qinghai-tibet plateau. Hubei Agric. Sci. 59, 44–48. doi:10.14088/j.cnki.issn0439-8114.2020.15.008
Yan, Q., Li, H., Jing, L. H., Tang, Y. W., and Ding, H. F. (2017). Automatic extraction algorithm of seismic landslide information based on after-calamity high-resolution remote sensing image. Laser & Optoelectron. Prog. 54 (11), 416–426. doi:10.3788/LOP54.112801
Yang, J. Y., Wang, Q. J., Chang, D. K., Xu, W. T., and Yuan, B. Q. (2023). A high-precision remote sensing identification method on saline-alkaline areas using multi-sources data. Remote Sens. 15 (10), 2556. doi:10.3390/rs15102556
Yang, Z. H., Zhuang, Y. S., Guo, C. B., and Yao, X. (2018). Sensitivity analysis on causative factors of geohazards in eastern margin of Tibetan plateau. J. Eng. Geol. 26 (03), 673–683. doi:10.13544/j.cnki.jeg.2017-165
Yin, Z. Q., Chen, H. Q., Chu, H. L., Xu, Y. Q., and Zhao, W. J. (2013). Analysis on the key controlling factors of geo-hazards triggered by five typical earthquake events in China since 2008. Earth Sci. Front. 20 (6), 289–302.
Zanaga, D., Van De Kerchove, R., Daems, D., De Keersmaecker, W., Brockmann, C., Kirches, G., et al. (2022). ESA WorldCover 10 m 2021 v200. doi:10.5281/zenodo.7254221
Zanaga, D., Van De Kerchove, R., De Keersmaecker, W., Souverijns, N., Brockmann, C., Quast, R., et al. (2021). ESA WorldCover 10 m 2020 v100. doi:10.5281/zenodo.5571936
Zhang, C. S., Zhang, Y. C., and Zhang, L. H. (2004). Danger assessment of collapses, landslides and debris flows of geological hazards in China. J. Geomechanics 1, 27–32. doi:10.3969/j.issn.1006-6616.2004.01.004
Zhang, J. Y., Li, Y., Wang, Y. T., Li, Z. Y., and Huang, C. R. (2020). Impact of climate change on geological disaster in southwest China. Plateau Mt. Meteorology Res. 40 (02), 70–77.
Zhang, Y. L., Li, B. Y., and Zheng, D. (2002). A discussion on the boundary and area of the Tibetan plateau in China. Geogr. Res. (01), 1–8. doi:10.3321/j.issn:1000-0585.2002.01.001
Zhao, D. S., Zhu, Y., Wu, S. H., and Zheng, D. (2021). Projection of vegetation distribution to 1.5°C and 2°C of global warming on the Tibetan plateau. Glob. Planet. Change 202, 103525. doi:10.1016/j.gloplacha.2021.103525
Zhao, J. L., Zhu, H. W., and Yang, W. T. (2022). Research on landslide information extraction from remote sensing images based on support vector machine. Geospatial Inf. 20 (12), 84–88. doi:10.3969/j.issn.1672-4623.2022.12.017
Keywords: landslide extraction, environmental factors, southern Tibetan plateau (TP), Google Earth Engine (GEE), remote sensing
Citation: Xu W, Wang Q, Yang J, Yuan B and He C (2024) A research on the relationship between landslide area changes and environmental factors in the southern Tibetan plateau. Front. Earth Sci. 12:1403888. doi: 10.3389/feart.2024.1403888
Received: 20 March 2024; Accepted: 07 May 2024;
Published: 24 May 2024.
Edited by:
Thomas Oommen, Michigan Technological University, United StatesReviewed by:
Huiran Gao, Ministry of Emergency Management, ChinaCopyright © 2024 Xu, Wang, Yang, Yuan and He. This is an open-access article distributed under the terms of the Creative Commons Attribution License (CC BY). The use, distribution or reproduction in other forums is permitted, provided the original author(s) and the copyright owner(s) are credited and that the original publication in this journal is cited, in accordance with accepted academic practice. No use, distribution or reproduction is permitted which does not comply with these terms.
*Correspondence: Qinjun Wang, d2FuZ3FqQHJhZGkuYWMuY24=
Disclaimer: All claims expressed in this article are solely those of the authors and do not necessarily represent those of their affiliated organizations, or those of the publisher, the editors and the reviewers. Any product that may be evaluated in this article or claim that may be made by its manufacturer is not guaranteed or endorsed by the publisher.
Research integrity at Frontiers
Learn more about the work of our research integrity team to safeguard the quality of each article we publish.