 Yaliang Wang
 Jianjun Cheng*
- College of Water and Architectural Engineering, Shihezi University, Shihezi, China
In order to obtain the optimal geometric structure for sand transport in desert roads, this study fully utilizes the natural sand transport capacity of the desert roads, aiming to reduce occurrences of road damage due to sand burial. The research integrates Computational Fluid Dynamics (CFD) with optimization analysis theory. Various typical geometric structures of desert highway roadbed were modeled using the Design Exploration module in CFD. Optimization analysis methods were employed to model and compute the sediment transport optimization design on both the roadbed and road surface. Then, the initial sample points are obtained by using the Design of Experiments (DOE), and the response surface is established by using the Kriging model to obtain the change trend of the input parameters and the objective function. Finally, the cross-section parameters of the sediment transport subgrade corresponding to different inflow conditions are obtained. The results show that the sediment transport performance of embankment, cutting and semi-filled uphill subgrade is negatively correlated with the height of subgrade. The relationship between slope gradient and sediment transport performance of subgrade depends on the height of subgrade and the type of subgrade section. For embankment and cutting, when the subgrade height is less than 0.5 m, the sediment transport performance of the subgrade is positively correlated with the subgrade slope; however, when the subgrade height exceeds 0.5 m, the sediment transport performance is negatively correlated with the subgrade slope. For the semi-filled uphill flow subgrade, the sediment transport performance of the subgrade is negatively correlated with the subgrade slope. Comprehensive analysis shows that semi-filled and excavated downhill subgrade has the best sand transport performance, embankment subgrade has the second highest sand transport capacity, then cutting subgrades, while semi-filled and excavated uphill subgrade has the worst sand transport performance. The research conclusions provide valuable scientific guidance for the design of sand control embankment structures tailored to local conditions for desert highways. This is of significant importance for enhancing the sediment transport capacity of desert highways and prolonging their service life.
1 Introduction
The hazards of wind and sand flow to desert roads mainly include sand burial and wind erosion (Shi et al., 2014). Sand burial refers to the movement of wind and sand to the vicinity of the roadbed, the roadbed structure impedes the movement of wind and sand to the downwind side, so that the wind and sand flow from an unsaturated state to a saturated state. This results in the accumulation of sand particles at different positions on the roadbed, ultimately forming sand burial. Flowing and semi-flowing sand dunes are prone to sand burial. Wind erosion mainly includes abrasion, hollowing and blowing three kinds of erosion. Blow erosion is the wind and sand flow through the roadbed, take away the loose roadbed filler, so that the roadbed damage. Abrasion is under the action of strong wind sand particles on the pavement to produce a huge impact force, so that the pavement particles to produce displacement and wear. Hollowing mainly occurs on the leeward side of the roadbed, and when the height of the roadbed is high, the vortex formed on the leeward side of the roadbed will dislodge the roadbed fill, which in turn will cause serious damage to the roadbed structure.
In order to reduce the hazards of wind and sand activities on desert highway transportation, many researchers have conducted extensive studies on the wind energy environment and the structural characteristics of wind and sand flows along highways, proposing various sand control measures. In terms of controlling sand hazards on desert highway embankments, there are mainly two methods. One method is to implement “strong obstruction and reinforcement” by installing vegetation and mechanical sand control measures on both sides of desert highways (Wang et al., 2015; Wang et al., 2017; Li et al., 2020). While these sand control measures partially prevent the shifting of sand to the embankments, some sand still manages to reach the embankments, affecting the normal operation of the highways. Additionally, over time, the sand control systems become buried, losing their effectiveness. Another method involves optimizing the geometric parameters of embankments to reduce the deceleration effect of the embankments on sand-carrying winds, allowing sand particles to smoothly pass through the leeward side of the embankments, thereby reducing sand hazards on embankments. Compared to the former method, adjusting embankment section parameters to mitigate embankment sand hazards is a more proactive approach.
Numerous scholars have conducted extensive research on the impact of typical embankment structures on wind and sand disasters, as well as the characteristics of wind and sand flow for different embankment cross-sections, through field observations, wind tunnel experiments, and numerical simulations. Substantial achievements have been made in this regard. Li Chi et al. conducted a study on wind erosion of desert highways using Fluent numerical simulation software (Li and Gao, 2011). The results indicated that as the embankment height increases, the wind erosion damage to the embankment becomes more severe. Yu Yanping et al. investigated the influence of embankment slope angles on the flow field of highway embankments through wind tunnel experiments, revealing that a larger slope angle results in a wider range of sand accumulation on both sides of the embankment (Yu et al., 2018). Li Qiang examined the effects of single orthogonal winds on the wind and sand flow field of embankments, finding that deeper road cuts lead to more sand accumulation (Li, 2018). When the embankment slope angle remains constant, the range of sand accumulation on the leeward side of the embankment may generally increase with increasing wind speed. Dong Haojun conducted wind tunnel experiments to study the variation rate of wind speed and sand-blocking performance of roadbeds with different slope ratios (Dong, 2021). The results showed that the wind speed reduction rate near the surface on the lee side of the roadbed is greater than that on the windward side, resulting in more severe sand accumulation on the lee side. The greater the slope ratio, the greater the sand-blocking performance of the roadbed and the smaller its sand transport capacity. As the slope ratio of the roadbed increases, the range and extent of sand accumulation on both sides also increase accordingly. Currently, research on highway sand damage mainly focuses on the formation mechanism of highway sand damage and the individual protective effects of various sand-blocking and sand-fixation measures. There has been limited exploration into how to effectively utilize the sand transport capacity of highway roadbed surfaces and integrate them with mechanical sand barriers along the route to form a coordinated sand control system for wind and sand fixation.
Based on the theories of computational fluid dynamics and optimization analysis, this paper establishes a numerical calculation model for typical roadbed geometric structures in the desert highway engineering design context. Through optimization analysis, a set of geometric structure parameters for sediment transport roadbeds under various wind and sand environment factors is obtained. Based on this, an optimized sediment transport roadbed geometric structure set coordinated with external wind and sand environments for desert highways is established. This research is significant for improving the sediment transport capacity of the roadbed section itself and extending the service life of desert highways. It also lays the theoretical foundation for ultimately revealing the mechanism of sediment transport on the roadbed surface of desert highways and the coordinated control of sand barriers along the route.
2 Establishment of numerical calculation models
2.1 Background of numerical modeling engineering
Analyzing the causes of sand damage on desert highways from the perspective of formation mechanisms (Figure 1), the range within the roadbed and pavement of desert highways can be viewed as a system, which inherently possesses a certain sand-passing capability (Figure 2). The formation of highway sand damage occurs when the external intensity of wind-blown sand exceeds the capacity of the roadbed and pavement to transport sand. Moreover, the sand transport capacity of the roadbed and pavement is further controlled by the cross-sectional form and geometric parameters (optimizable parameters), attribute parameters (selectable parameters), and assigned parameters (controllable parameters), as shown in Table 1. This paper takes the common roadbed structures found in the construction of the Tazhong-Desert Highway and the Tumxuk-Kunyu Desert Highway in Southern Xinjiang as the engineering background, generalized into five numerical models of roadbed structures. Utilizing optimization analysis theory methods, the paper analyzes the optimal sand transport geometric parameters of each typical roadbed type, providing engineering reference data for selective wind and sand control project construction along the route.
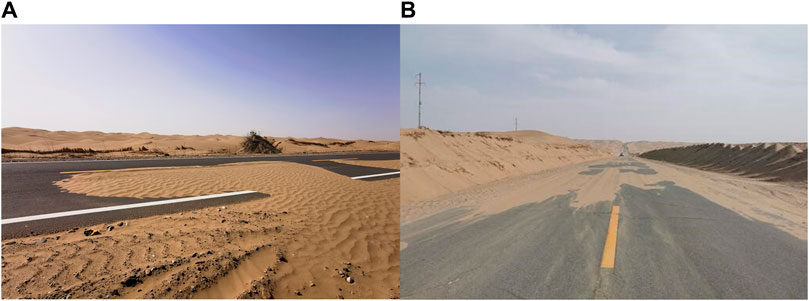
Figure 1. Sand accumulation disaster of desert highway roadbed.
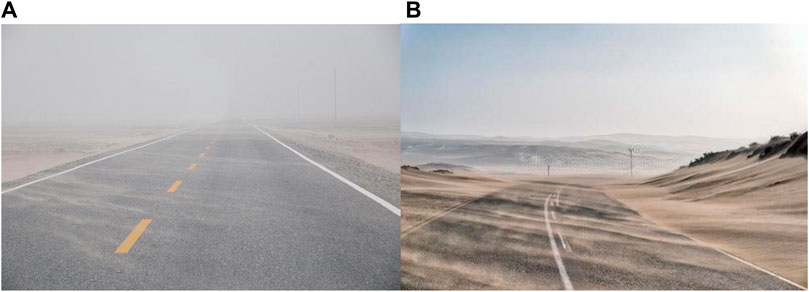
Figure 2. Sand transport phenomenon on Desert highway roadbed. (A) (Photographed by the author): Embankment; (B) (Source: Internet): Road Cut.
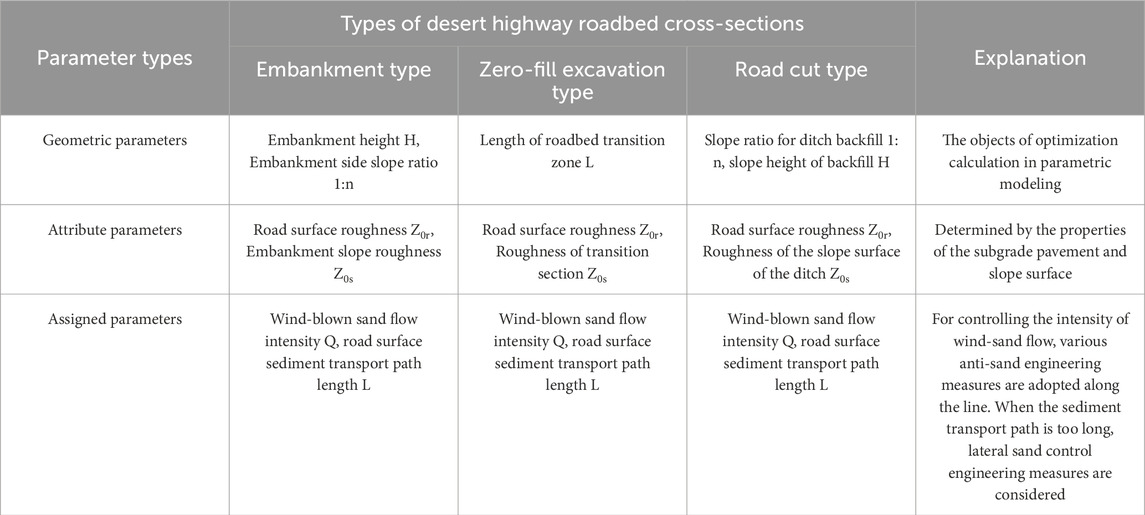
Table 1. Parametric characterization in parametric modeling of desert highway roadbeds.
As shown in Table 1, during the parameterized modeling process of desert highway roadbeds, various parameters are classified, including the geometric parameters, attribute parameters, and assigned parameters of the roadbed model. Attribute parameters are selected based on practical considerations, while both geometric and assigned parameters are variable, serving as targets for modeling optimization and control. The wind-blown sand flow intensity is an assigned parameter in the modeling process. Control of wind-blown sand flow in the parameterized model involves reducing the sand phase percentage or increasing the gradient wind speed value (the sand phase refers to the sand component in two-phase flow with wind and sand). In practical engineering, this corresponds to variations in the sand-capturing effects of anti-sand engineering along the highway. When utilizing the parameterized model for optimization and analysis, with a constant wind-blown sand flow intensity, higher wind speeds result in more effective natural sand transport. In real-world projects, as long as the wind speed exceeds the threshold for sand initiation, the sand-carrying capacity remains in a non-saturated state, allowing it to smoothly pass through the highway pavement.
2.2 Control equation
Using the Computational Fluid Dynamics numerical modeling method, the main focus is on analyzing the transport characteristics of sand particles near the roadbed. Therefore, the Eulerian two-fluid model is chosen for solving the model. In this model, the air phase and the sand phase are calculated separately as fluid and pseudo-fluid, respectively, and are considered as coexisting and mutually permeating continuous media. The gas-solid two-phase flow follows mass conservation equations and momentum conservation equations (Xin et al., 2021; Yu, 2022), which are as follows:
Mass conservation equations such as Eqs 1, 2:
Conservation of momentum equations such as Eqs 3, 4:
The equation for the interaction force between gas phase and sand phase, as represented by Eq. 5:
In the formula, φa and φs represent the volume fractions of the air phase and sand phase, respectively, satisfying the relation φa + φs = 1; t denotes the calculation time; ρa and ρs are the densities of the air phase and sand phase, respectively; ux, uy, and uz represent the velocity components in the x, y, and z directions, respectively; τa and τs are the viscous stress tensors of the air phase and sand phase, respectively; ∇ represents the Hamiltonian operator; ∇p stands for the momentum change; P is the common pressure shared by both phases; Ps is the pressure of the sand phase; g is the acceleration due to gravity; Ua and Us denote the velocities of the gas phase and sand phase, respectively, and Ur represents the relative velocity between the two phases; CD denotes the drag coefficient.
2.3 Parametric modeling and mesh division
The geometric structural types of desert highway subgrades mainly include five categories: non-fill cut subgrade, embankment subgrade, cutting subgrade, and semi-fill cut subgrade (uphill flow, downhill flow). However, from the perspective of parametric modeling, there are only four types, as shown in Figure 3. During parametric modeling, geometric parameters such as cutting depth, embankment height, and subgrade side slope gradient are considered as optimizable parameters; attribute parameters such as road surface roughness and subgrade slope roughness (roughness under the effect of engineering measures like grass squares on cutting and embankment slopes) are considered as selectable parameters; assigned parameters such as wind-blown sand flow intensity and incoming wind speed are considered as controllable parameters. Among these, attribute and assigned parameters remain constant during optimization, while geometric parameters are variable.
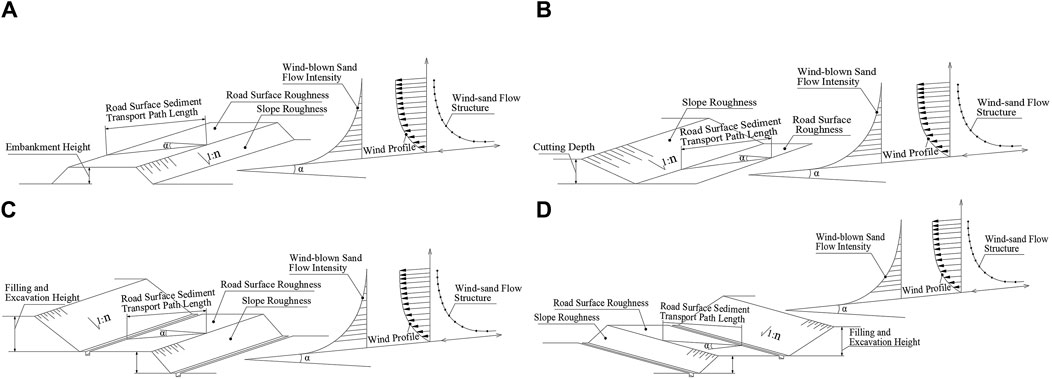
Figure 3. Schematic diagram of subgrade parameter generalization [(A): Embankment subgrade; (B): Cutting subgrade; (C): Semi-filled and excavated uphill subgrade; (D): Semi-filled and excavated downhill subgrade].
Taking the embankment subgrade as an example, a three-dimensional model of the subgrade is established using the Design Modeler in ANSYS Workbench, as shown in Figure 4. With the desert highways in the hinterland of the Taklamakan Desert as the background, the subgrade is designed according to the standards of a secondary highway, with a width of 12 m, an embankment height of H, a slope angle α, and the angle between the incoming flow direction and the embankment orientation as A. To allow the wind-blown sand flow to fully develop, the distance from the inlet to the embankment is set to 40 m, and the distance from the outlet to the embankment is 80 m (Xu et al., 2018; Mehdipour and Baniamerian, 2019). To eliminate the influence of the computational domain size on the structure, the computational domain is set to have a length of (120+2H/tanα) m, a height of 30 m, and a width of 20 m. Mesh division is conducted using ICEM, with a global mesh size of 0.1 m. To improve computational accuracy and more accurately reflect the flow field changes in the near-wall region, a boundary layer is established in the near-wall area to ensure that y+ is within the logarithmic law region, which requires 11.5–30 < Y+ < 200–300 (Choi et al., 2018; Horvat et al., 2021). Therefore, the first layer mesh size is set to 0.02 m, with 10 layers in the boundary layer, resulting in 4.95×10⁶ meshes, a mesh quality of 0.87, skewness of 0.15, indicating good mesh quality and satisfying the requirements for independence.
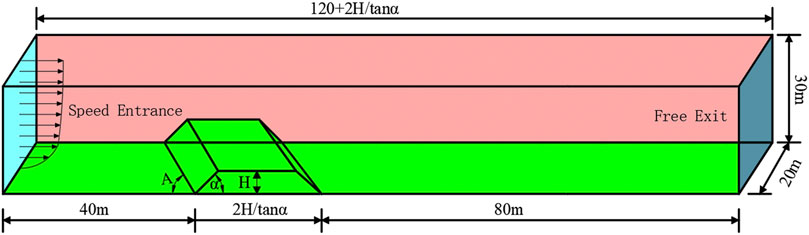
Figure 4. Embankment model and calculation diagram.
2.4 Boundary conditions and computational parameters
Wind-blown sand flow consists of air and sand particles, requiring the setting of model parameters such as material density, particle size, and volume fraction during numerical calculations. Studies have found that the particle size of sand grains in wind-blown sand flow generally ranges from 0.075 to 0.25 mm (Cheng et al., 2017; Ding et al., 2021). For the sand particle properties of the study area, based on the particle size analysis results, simulations use a single particle size of 0.15 mm. The sand particle density is set to 2600 kg/m3 (Chen et al., 2019). Regarding the selection of sand particle volume fraction, considering the research area is located in the hinterland of the desert and combining with field meteorological data, the sand particle volume fraction is set to 0.05, uniformly distributed at the inlet. Since the Mach number of the wind-blown sand flow is less than 0.3, the density variation of the wind-blown sand flow is not considered. The pressure is set at atmospheric pressure; the inlet is a typical wind speed profile flow. The equation for solving the wind speed profile, as illustrated by Eq. 6:
In the formula: v represents the friction velocity; y0 is the roughness length; k is the von Karman constant, taken as 0.4; y is the height; v(y) denotes the wind speed value at height y.
The solution method is set to reflect the unsteady, pressure-based two-phase flow of wind and sand. The turbulence model selected is the standard k-ε model. To ensure computational accuracy and accelerate the convergence of the iterative process, standard wall functions are used for the wall region. The equation solving method employs the SIMPLEC algorithm, with convergence criteria set to 1×10⁻⁶.
To consider the adverse effects of wind speed on desert highways, the maximum values of the maximum and average wind speeds from various azimuth angles of the desert highway are taken as the computational wind speeds. As shown in Tables 2, 3, based on the onsite measured wind speed data from 2018 to 2021, the maximum values of the maximum and average wind speeds for the desert highways in the hinterland of the Taklamakan Desert are 14.8 m/s and 8.71 m/s, respectively. Therefore, in calculations, wind speeds are set to 15 m/s and 9 m/s. The sections of the desert highway in the hinterland of the Taklamakan Desert that suffer severe sand damage have their orientations intersecting at large angles with the prevailing wind direction. To fully consider the impact of the geometric structure of the sand-transporting subgrade on the sand-transporting capacity of the desert highway itself, it is advisable to avoid small-angle intersections between the incoming flow direction and the embankment orientation. Hence, the angles between the embankment orientation and the incoming flow direction are set to 60° and 90°.
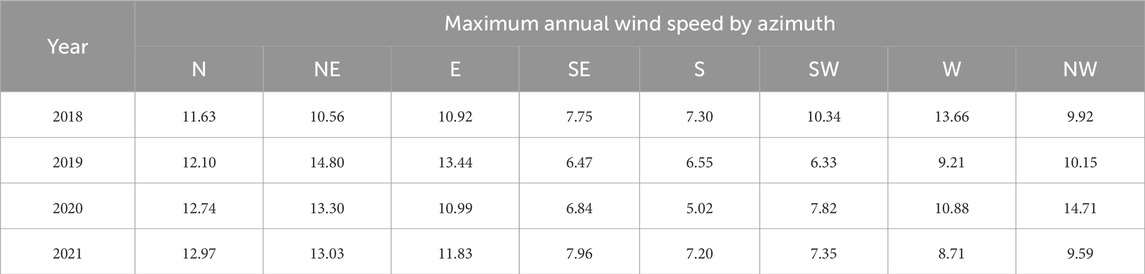
Table 2. Maximum annual wind speeds at various azimuths along the desert highway in the hinterlands of the Taklamakan Desert (Unit: m/s).
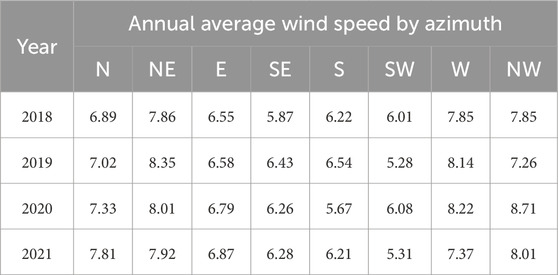
Table 3. Average annual wind speeds at various azimuths along the desert highway in the hinterlands of the Taklamakan Desert (Unit: m/s).
3 Optimization mathematical model and method for subgrade geometric parameters
3.1 Mathematical model
3.1.1 Design variables
Design variables, also known as input parameters, are closely related to the occurrence of sand hazards on desert highways and various parameters of the subgrade and pavement. These include subgrade height, subgrade slope gradient, roughness of the pavement and slope surface, intensity of wind-blown sand flow, and the length of sand transport on the pavement (or the angle between the incoming flow and the direction of the subgrade). Among these, the depth of the cut for cuttings, the height of embankments, and the slope gradient of the subgrade are parameters that can be optimized. Therefore, this paper considers the height of the embankment h and the slope gradient of the subgrade α as the design variables, i.e., the input parameters, as illustrated by Eq. 7.
The setting of the upper and lower limits of the design variables is obtained through analysis after multiple computations and can be represented by Eq. 8:
In the formula: xi corresponds sequentially to each element in the set of design variables X; xiL represents the lower limit of the design variable; xiU represents the upper limit of the design variable.
3.1.2 Objective function
The objective function is also known as the output parameter. During the movement of wind-blown sand, accumulation first occurs on the windward side of the embankment due to its obstruction, and then the sand is transported to the leeward side under the action of airflow. In this paper, the mass flow rate of sand particles on the windward side of the embankment is selected as the sand accumulation volume mz entering the embankment, and the mass flow rate of sand particles on the leeward side of the embankment is considered as the remaining mass mc after obstruction by the embankment. For optimization analysis, mz and mc are taken as the output parameters, and the optimization of the derived parameters of mz and mc evolution, denoted as optimization S, is taken as the objective function for optimization calculations, as shown in Eq. 9:
In the formula: S represents the sand transport capacity of the embankment, with a larger S indicating a better sand transport effect of the embankment; mzi represents the mass of sand particles passing through the windward side of the embankment during the i th time period; mci represents the mass of sand particles passing through the leeward side of the embankment during the i th time period; i represents the calculation time, i=1, 2, 3, … … , n, where n is the calculation duration of 30 s.
3.2 Optimization method
This paper proposes an optimization method for the geometric parameters of desert highway embankments based on DOE (Design of Experiments) and the Kriging model. Initially, a DOE is conducted to obtain initial sample points; subsequently, a surrogate model is generated using the Kriging method, with the optimization process illustrated in Figure 5.
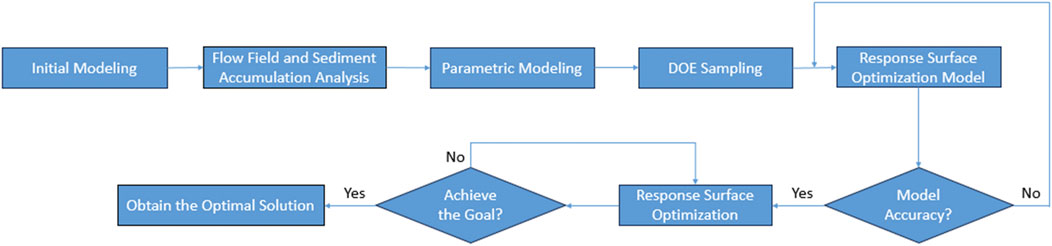
Figure 5. Design exploration optimization process.
The optimization process is completed within the Design Exploration module provided by Ansys Workbench. DOE experimental design methods include Central Composite Design (CCD), Box-Behnken Design, Latin Hypercube Sampling Design (LHS), and Optimal Space-Filling Design (OSF), among others. In this study, when generating sample points for input parameters using DOE experiments, the Optimal Space-Filling sampling method is adopted with the sample type chosen as CCD. This method enables uniform distribution of design parameters throughout the entire design space, allowing for maximum insight into the design with the fewest possible number of sample points (Xin et al., 2018). A total of 15 samples are required, and the optimization experimental sample combination is illustrated in Figure 6.
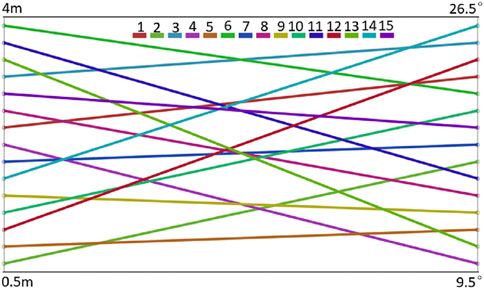
Figure 6. Optimization of experimental sample combinations.
Due to its significant efficiency improvement in engineering optimization design problems, surrogate model methods are widely applied in engineering design. Commonly used surrogate models include the Standard Response Surface and Kriging (Zhang and Qiu, 2021; Zhu et al., 2022). Upon comparison, it has been found that the Kriging model demonstrates a better fit between the observed values at design points and the predicted values by the response surface. The criterion for fit assessment is: the closer to the line y=x, the better the fit, as shown in Figure 7. As an unbiased estimator model that minimizes estimation variance, Kriging exhibits ideal fitting effects for problems with high nonlinearity and maintains high accuracy both globally and locally. Therefore, in optimizing the geometric parameters of the subgrade, the Kriging model is chosen for optimization in this study.
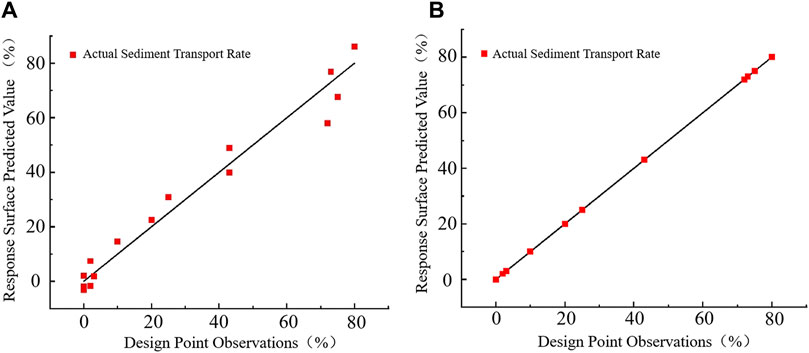
Figure 7. Response surface model fitting curve. (A): Standard quadratic response surface; (B) Kriging method).
The Kriging optimization model is a regression algorithm for spatial modeling and prediction of stochastic fields based on the theory of correlation functions (Wan et al., 2022; Liu et al., 2023). It is an optimal unbiased estimation technique, composed of a global trend function F(β, x) and a stochastic deviation Z(x). Its mathematical expression is given by Eq. 10:
In the formula, F(β, x) = f T(x) β, where β are the coefficients of the regression function f T(x), and Z(x) indicates that local errors are approximately key to the model’s accuracy. The characteristics of Z(x) are shown in Eqs 11–13:
The mathematical expectation of the random deviation is zero, and its variance σ2 is minimized, which can be calculated by Eq. 4. Here, Cov[Z(xi), Z(xj)] represents the covariance of the random deviations, and R(c, xi, xj) is the correlation function, indicating the spatial correlation between any two points. The expression for R(c, xi, xj) is shown in Eq. 14:
Where n is a variable, θk is a scale factor, and dk represents the Euclidean distance between two points. It can be seen from the above definition that the key to the accuracy of the Kriging Surrogate Model lies in the selection of the correlation function. Commonly used correlation functions include the exponential function, Gaussian function, linear function, and cubic spline function.
4 Results analysis
4.1 Optimization analysis of response surface
Figure 8 presents three-dimensional response surfaces of the output parameter S with respect to the input parameters h and α for different subgrade cross-sections. From Figures 8A, B, it can be observed that the conductivity of both embankment and cut section subgrades decreases with an increase in subgrade height/cut depth; however, the change in conductivity with slope gradient varies at different subgrade heights, demonstrating specific trends: at a subgrade height/cut depth of 0.5 m, the sand transport rate increases with an increase in the slope gradient of the embankment; at a height/depth of 4 m, the conductivity decreases with an increase in the slope gradient. The primary reason for these results is that, at a height/depth of 0.5 m, sand particles can pass smoothly over the embankment, but the sand transport path is longer at lower gradients than at higher ones, leading to lower conductivity at smaller gradients; when the height/depth reaches 4 m, sand particles cannot pass smoothly over the embankment, and only when the gradient decreases can the sand pass, hence the transport rate increases as the gradient decreases. For the semi-filled and excavated uphill subgrade cross-section, conductivity decreases with an increase in cut-and-fill height and with an increase in slope gradient, as shown in Figure 8C. The main reason for these results is that the semi-filled and excavated uphill subgrade cross-section type differs from the embankment and cut section subgrades, as wind-blown sand experiences two decelerations when passing over such subgrades, making it difficult for sand particles to pass over the subgrade even at lower cut-and-fill heights, and only decreasing the slope gradient facilitates sand passage. The conductivity of the semi-filled and excavated downhill subgrade decreases with an increase in cut-and-fill height and increases with an increase in gradient, as depicted in Figure 8D.
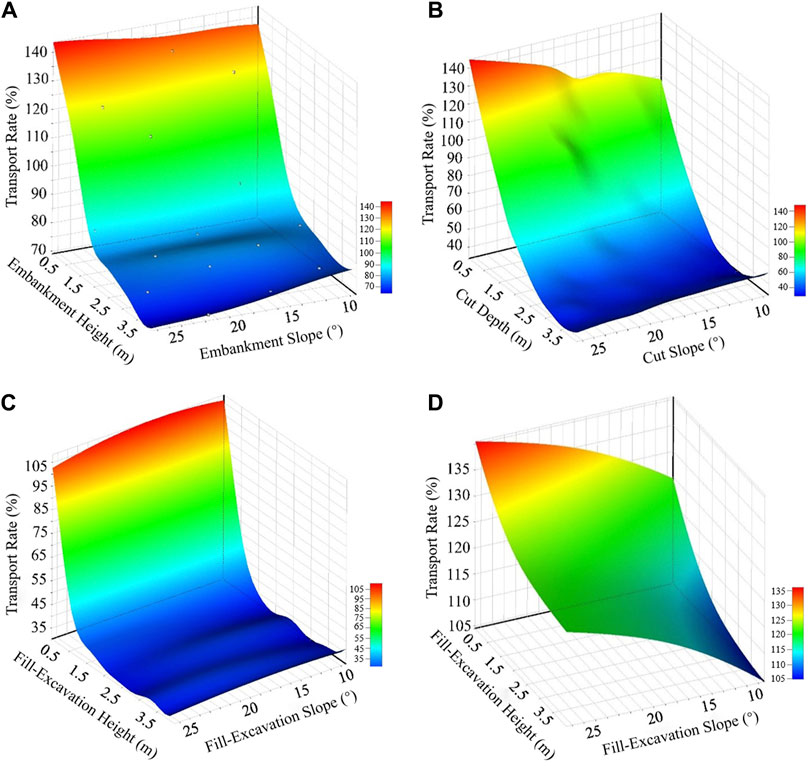
Figure 8. 3D response surface diagram of input parameters and output parameters of different subgrade. (A): Three-dimensional response surface of embankment-type Subgrades; (B) Three-dimensional response surface of cut-type Subgrades; (C) Three-dimensional response surface of semi-filled and excavated uphill Subgrade; (D) Three-dimensional response surface of semi-filled and excavated downhill subgrades).
4.2 Sand transport subgrade cross-section parameters
From Figures 9A, B, it can be seen that when the incoming wind speed is 15 m/s and the embankment orientation is 60°, the embankment height being less than 1.5 m results in a transport rate greater than 1. This indicates that, for embankment heights below 1.5 m, sand particles can successfully pass over the embankment. Meanwhile, at an incoming wind speed of 15 m/s and an embankment orientation of 90°, the embankment height must be below 1.25 m to ensure the smooth passage of sand particles, as shown in Figure 9A. The higher the incoming wind speed, the greater the embankment transport rate; under the condition of an incoming wind speed of 15 m/s, an embankment height of less than 1.25 m results in a transport rate greater than 1; when the incoming wind speed is 9 m/s, an embankment height of less than 0.85 m results in a transport rate greater than 1, as illustrated in Figure 9B.
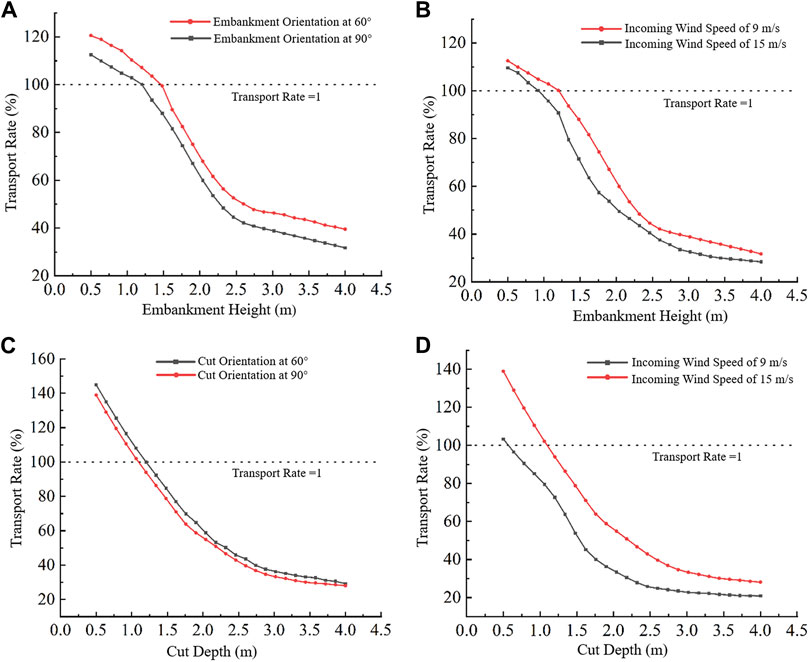
Figure 9. Relation curves of input parameters and output parameters under different path trends.
Figures 9C, D illustrate the variation in the conductivity of cut section subgrades with cut depth under different cut orientations and incoming wind speeds. As can be observed from Figure 9C, the transport rate increases with a decrease in the depth of the cut across different orientations, and it is slightly higher when the cut orientation is at 60° compared to 90°. From Figure 9D, it is known that under an incoming wind speed of 15 m/s and a cut orientation of 60°, a cut depth of less than 1.2 m results in a transport rate greater than 1. Similarly, with an incoming wind speed of 15 m/s and a cut orientation of 90°, a cut depth of less than 1.0 m yields a transport rate greater than 1.
From the analysis above, it is known that for an embankment orientation of 60° and an incoming wind speed of 15 m/s, the upper limit for the sand transport embankment height is 1.5 m; for an embankment orientation of 90° and an incoming wind speed of 15 m/s, the upper limit is 1.25 m; for an embankment orientation of 90° and an incoming wind speed of 9 m/s, the upper limit is 0.85 m. For a cut orientation of 60° and an incoming wind speed of 15 m/s, the upper limit for the sand transport cut depth is 1.2 m; for a cut orientation of 90° and an incoming wind speed of 15 m/s, the upper limit is 1.0 m; for a cut orientation of 90° and an incoming wind speed of 9 m/s, the upper limit is 0.62 m.
To determine the specific sand transport cut section parameters under different conditions, the embankment heights are set to 1.5, 1.2, and 0.8 m, respectively, and the cut depths to 1.2, 1.0, and 0.6 m. The variations in the slope gradient of the subgrade at different sand transport subgrade heights and their impact on conductivity are then studied, thereby determining the optimal slope gradient for sand transport subgrades.
From Figure 10, it can be observed that the optimal sand transport slope for an embankment height of 1.5 m is 21.7°; for an embankment height of 1.2 m, the optimal slope is 22.4°; and for an embankment height of 0.8 m, the corresponding slope for sand transport is 24.5°. Thus, the parameters of the sand transport cross-section for embankment-style road foundations under different conditions can be determined, as shown in Table 4. For a cut depth of 1.0 m, the optimal sand transport slope is 21.7°; for a cut depth of 0.5 m, the optimal slope is 26.5°. Therefore, the parameters of the sand transport cross-section for cut-style road foundations under different conditions can be derived, as indicated in Table 5.
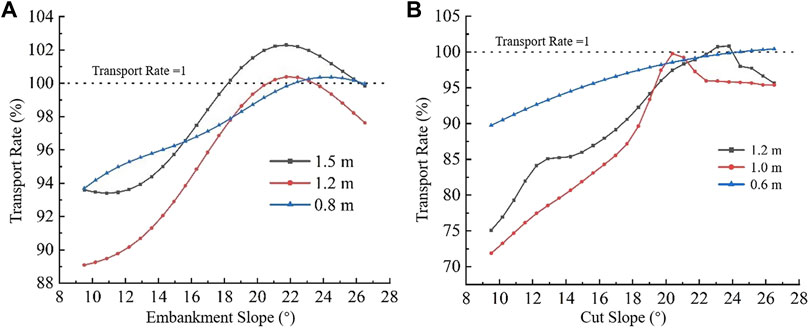
Figure 10. Sand transport slope corresponding to different embankment heights.
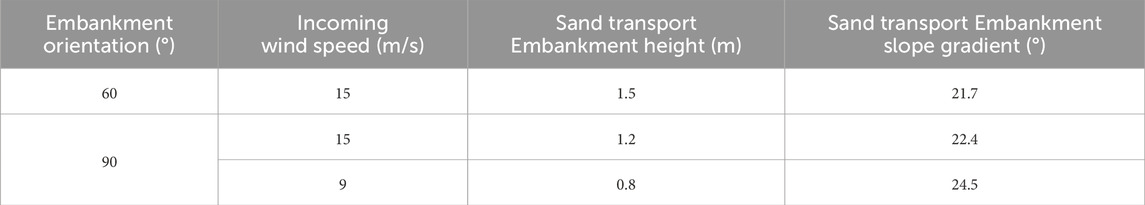
Table 4. Section parameters of sand transport embankment under different working conditions.
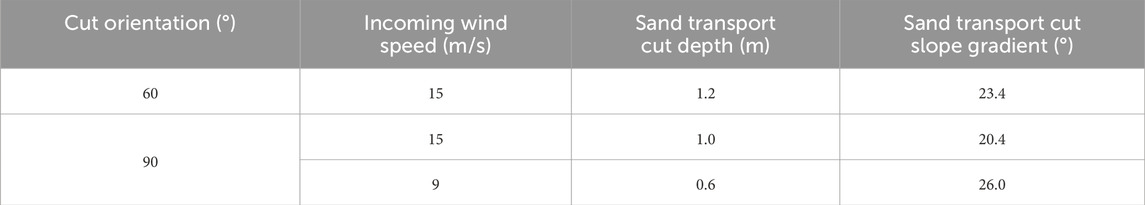
Table 5. Section parameters of sand transport embankment under different working conditions.
5 Conclusion
Based on the theory of two-phase flow of wind and sand, DOE experiments, and Kriging surrogate models, different geometric parameters of subgrade sections were optimized in this study. The variations of sand transport rates with subgrade geometric parameters were analyzed. The conclusions are as follows:
The sediment transport rate of embankment and cutting sections in roadbeds is negatively correlated with the height/depth of the roadbed, and the variation trend with slope gradient shows different patterns at different heights/depths. For semi-filled and excavated uphill subgrades, the sediment transport rate is negatively correlated with the height of cut and fill and the slope gradient; whereas, for semi-filled and excavated downhill subgrades, the sediment transport rate is positively correlated with the height of cut and fill and the slope gradient.
For an embankment oriented at 60° with an incoming wind speed of 15 m/s, the optimal parameters for the sediment transport embankment section are determined to be a height of 1.5 m and a slope of 21.7°. In the scenario where the embankment is oriented at 90° with an incoming wind speed of 15 m/s, the optimal parameters are identified to include a height of 1.0 m and a slope of 23.1°. Additionally, for an embankment oriented at 90° with an incoming wind speed of 9 m/s, the optimal parameters are found to be a height of 0.8 m and a slope of 24.5°.
For a cutting oriented at 60° with an incoming wind speed of 15 m/s, it has been determined that the optimal parameters for the sediment transport cutting section comprise a depth of 1.2 m and a slope of 23.4°. In instances where the cutting is oriented at 90° with an incoming wind speed of 15 m/s, the optimal parameters have been identified to include a depth of 1.0 m and a slope of 20.4°. Additionally, for a cutting orientation of 90° with an incoming wind speed of 9 m/s, the optimal parameters have been established as a depth of 0.6 m and a slope of 26.0°.
A comparison of the sand transport performance of different road foundation sections reveals that the sand transport capacity of semi-filled and excavated downhill subgrades exceeds that of embankment sections, which in turn surpasses the capacity of cut sections, with the semi-filled and excavated uphill subgrades demonstrating the least capacity. Consequently, in areas with significant terrain undulations, semi-filled and excavated downhill subgrades should be preferred, whereas in regions with minimal terrain variations, embankment sections are recommended.
Data availability statement
The original contributions presented in the study are included in the article/Supplementary Material, further inquiries can be directed to the corresponding author.
Author contributions
YW: Data curation, Writing–original draft, Writing–review and editing. JC: Writing–review and editing. YA: Software, Writing–review and editing. RZ: Software, Writing–review and editing.
Funding
The author(s) declare that financial support was received for the research, authorship, and/or publication of this article. This work was supported by the National Natural Science Foundation of China (52168065) and the Youth and Middle-aged Scientific and Technological Innovation Leading Talents Program of the Corps (2019CB023).
Conflict of interest
The authors declare that the research was conducted in the absence of any commercial or financial relationships that could be construed as a potential conflict of interest.
Publisher’s note
All claims expressed in this article are solely those of the authors and do not necessarily represent those of their affiliated organizations, or those of the publisher, the editors and the reviewers. Any product that may be evaluated in this article, or claim that may be made by its manufacturer, is not guaranteed or endorsed by the publisher.
References
Chen, B. Y., Cheng, J. J., Xin, L. G., and Wang, R. (2019). Effectiveness of hole plate-type sand barriers in reducing aeolian sediment flux: evaluation of effect of hole size. Aeolian Res. 38 (06), 1–12. doi:10.1016/j.aeolia.32019.03.001
Cheng, J. J., Zhi, L. Y., and Xue, C. X. (2017). Characteristic of wind-sand flow field of box-type movable sand barrier. J. Traffic Transp. Eng. 17 (05), 61–70. CNKI:SUN:JYGC.0.2017-05-006.
Choi, J., Kim, H. U., Yang, S., and Kim, T. (2018). Numerical analysis of particle con-centration around the air-inlet of a train in a tunnel by using a discrete phase model. J. Mech. Sci. Technol. 32 (2), 717–722. doi:10.1007/s12206-018-0120-6
Ding, B. S., Gao, L., Cheng, J. J., and Chen, B. Y. (2021). Numerical simulation of wind-sand flow characteristics of inclined inserting-type sand fence under influence of inserting plate angle. Bull. Soil Water Conservation 41 (01), 132–137. doi:10.13961/j.cnki.stbctb.2021.01.019
Dong, H. J. (2021). Wind tunnel test study on characteristics of wind sand flow field in sand crossing highway subgrade. Hohhot(Inner Mongolia): Inner Mongolia Agricultural University. [master's thesis].
Horvat, M., Bruno, L., and Khris, S. (2021). CWE study of wind flow around railways: effects of embankment and track system on sand sedimentation. J. Wind Eng. Industrial Aerodynamics 208, 104476. doi:10.1016/j.jweia.2020.104476
Li, C., and Gao, Y. (2011). Experimental studies of wind erosion failure of aeolian soils subgrade for desert highway. Rock Soil Mechan-ics 32 (01), 33–38. doi:10.16285/j.rsm.2011.01.012
Li, Q. (2018). The experimental research and numerical simulation of response between subgrade of highway and wind sand flow in single orthogonal wind conditions. Lanzhou(Gansu): Lanzhou Jiaotong University. [master's thesis].
Li, S. Y., Lei, J. Q., Xu, X. W., Qu, J. J., and Ren, H. J. (2020). Patterns of blown-sand hazard control for traffic arteries in China and its application. Bull. Chin. Acad. Sci. 35 (06), 665–674. doi:10.16418/j.issn.1000-3045.20200430002
Liu, Y. L., Liu, S., Cheng, Y., and Yang, Z. C. (2023). Optimization design of placement machine beam based on modified Kriging model. Mod. Mach. (02), 31–35. doi:10.13667/j.cnki.52-1046/th.2023.02.010
Mehdipour, R., and Baniamerian, Z. (2019). A new approach in reducing sand depo-sition on railway tracks to improve transportation. Aeolian Res. 41, 100537. doi:10.1016/j.aeolia.2019.07.003
Shi, L., Jiang, F. Q., and Han, F. (2014). Numerical simulation of response law of wind-blown sand flow around the railway embankment. J. China Railw. Soc. 36 (05), 82–87. doi:10.3969/j.issn.1001-8360.2014.05.014
Wan, Y. F., Sun, W. L., Wang, H. W., Xu, T. T., and Wang, B. K. (2022). Lightweight design of wind turbine's main shaft based on Kriging model and MOGA al-gorithm Acta. Energiae Solaris Sin. 43 (03), 388–395. doi:10.19912/j.0254-0096.tynxb.2020-0558
Wang, R., Zhou, L. H., Chen, Y., Xiao, J. H., and Zon, Y. M. (2017). Wind-blown sand control effect of sand barriers used in the hobq desert. Arid Zone Res. 34 (02), 330–336. doi:10.13866/j.azr.2017.02.12
Wang, S. J., Xu, X. W., Kang, X. G., Zhang, H., Tian, Y., Liu, J. Y., et al. (2015). Blown sand hazard situation and spatial difference of mechanical sand prevention system along alar-hetian Desert Highway. Arid. Zone Re-search 32 (05), 1017–1023. doi:10.13866/j.azr.2015.05.26
Xin, G. W., Huang, N., Zhang, J., and Dun, H. C. (2021). Investigations into the design of sand control fence for Gobi buildings. Aeolian Res. 49, 100662. doi:10.1016/J.AEOLIA.2020.100662
Xin, L. G., Cheng, J. J., Wang, L., and Zhi, L. Y. (2018). Optimization of key design parameters of the aviation baffle engineering of railway based on design exploration method. Jouenal Desert Re-search 38 (06), 1193–1199. doi:10.7522/j.issn.1000-694X.2017.00094
Xu, B., Zhang, J., Huang, N., Gong, K., and Liu, Y. (2018). Characteristics of turbulent aeolian sand movement over straw checkerboard barriers and formation mecha-nisms of their internal erosion form. J. Geophys. Re-search Atmos. 123 (13), 6907–6919. doi:10.1029/2017JD027786
Yu, G. G. (2022). Study on wind-sang flow field characteristics of highway in desert hinterland based on CFD numerical simula-tion. Yinchuan(Ningxia): Ningxia University. [master's thesis].
Yu, Y. P., Xiao, J. H., Qu, J. J., Wei, M. N., Pan, D. M., Hong, X. F., et al. (2018). Wind tunnel test on flow field of highway subgrade with different slope angles. Jouenal Desert Res. 38 (03), 464–472. doi:10.7522/j.issn.1000-694X.2018.00010
Zhang, Z. S., and Qiu, Z. P. (2021). Fatigue reliability analysis for structures with hybrid uncertainties combining quadratic response surface and polynomial chaos expansion. Int. J. Fatigue 144 (1), 106071. doi:10.1016/j.ijfatigue.2020.106071
Keywords: subgrade engineering, desert highway, wind-sand flow, DOE experiment, kriging model, sand transport embankment
Citation: Wang Y, Cheng J, An Y and Zhang R (2024) Optimal sand transport roadbed geometry structure of Taklamakan Desert highway. Front. Earth Sci. 12:1402878. doi: 10.3389/feart.2024.1402878
Received: 18 March 2024; Accepted: 26 April 2024;
Published: 20 May 2024.
Edited by:
Jianhua Xiao, Chinese Academy of Sciences (CAS), ChinaReviewed by:
Jie Zhang, Lanzhou University, ChinaHongchao Dun, Lanzhou University, China
Lihai Tan, Chinese Academy of Sciences (CAS), China
Copyright © 2024 Wang, Cheng, An and Zhang. This is an open-access article distributed under the terms of the Creative Commons Attribution License (CC BY). The use, distribution or reproduction in other forums is permitted, provided the original author(s) and the copyright owner(s) are credited and that the original publication in this journal is cited, in accordance with accepted academic practice. No use, distribution or reproduction is permitted which does not comply with these terms.
*Correspondence: Jianjun Cheng, Y2hlbmdkZXNpZ25AMTI2LmNvbQ==