- 1Fujian Qijian Group Co., Ltd., Zhangzhou, China
- 2College of Civil Engineering, Fuzhou University, Fuzhou, China
Rock masses are formed through long-term, complex geological processes, and the presence of joints significantly reduces their strength and increases their deformation. Rock bolts effectively enhance the strength and stability of rock masses and are extensively utilized for reinforcement. According to field investigations, a significant portion of the damage to bolted rock masses stems from shear deformation at joint surfaces. Moreover, roughness affects friction and surface contact, thus influencing the shear behavior between rock and rock bolts. This study considers two crucial factors affecting the shear characteristics of bolted rock joints: joint surface roughness and normal stress. Using the Particle Flow Code discrete element numerical method, the Barton standard joint profile lines were input to establish numerical models of both unbolted and bolted rock joints for direct shear tests. Results reveal that the peak shear stress and stiffness of both unbolted and bolted rock joints increase with rising normal stress and joint roughness coefficient. The peak shear stress and stiffness of bolted rock joints are notably higher than those of unbolted ones, with a maximum increase of 17.5%. Crack development in bolted rock joints occurs in stages of rapid, slow, and stable development, whereas no distinct slow development stage is observed in unbolted rock joints. Additionally, micro cracks in both unbolted and bolted rock joints are primarily tensile cracks, originating around the joint surface and extending outward with increasing shear displacement. These findings offer valuable insights into the microscopic shear mechanics of bolted rock joints and provide practical references for engineering design and applications in rock reinforcement projects.
1 Introduction
Geological tectonic forces generate structural features such as cracks, bedding planes, voids, and fragile interlayers within rock masses (Shi et al., 2020; Chen Q. Z. et al., 2022; Zaheri and Ranjbarnia, 2022). These varied discontinuities significantly weaken the inherent strength of the rock formations, presenting considerable stability challenges, especially in the field of mining engineering (Jaeger, 1971; Pariseau, 1999; Kemeny, 2005; Cao et al., 2020; Zheng et al., 2024a; Wang et al., 2024).
To avoid engineering geological disasters caused by the sliding of jointed rock mass, reinforcement measures must be taken. Rock bolts were widely used because of its simple installation, economical and can effectively enhance the strength of jointed rock mass (Kalman, 2003; Ma et al., 2017; Yang et al., 2022). At present, the study of rock bolts is mostly focused on tensile mechanical properties (Wu et al., 2018; Li et al., 2023). However, at the construction site, it was found that the failure of the rock bolt was partly due to tensile failure and partly due to shear failure caused by the sliding of the structural plane (Li, 2010).
Under varying influencing factors such as JRC (Joint Roughness Coefficient) (Wu et al., 2022), normal stress (Zheng et al., 2021), bolt installation angle (Kang et al., 2016), bolting length (Zhang et al., 2024), and environmental conditions (Ma et al., 2018), the theoretical analysis of the impact of shear load on bolted rock joints becomes intricate. Moreover, the costs associated with the field tests, monitoring, and laboratory analyses are substantial. Consequently, a range of numerical analysis methods becomes imperative (Park and Song, 2009; Asadi et al., 2012; Li et al., 2016). In employing numerical analysis to simulate bolt effects, the bolting force is often simplified as a uniformly distributed additional internal pressure, treating the bolted rock joints as an isotropic homogeneous body using an equivalent model (Shang et al., 2018; Srivastava, 2022). Jalalifar and Azia (2010) validated test results accuracy using ANSYS via double shear tests, analyzing the influence of pre-tightening force and sample strength on the shear mechanical behavior of fully encapsulated bolts. Saadat and Taheri (2020) utilized discrete element software to numerically simulate shear characteristics of bolted and unbolted joints. Under constant normal load (CNL) and constant normal stiffness (CNS) conditions, joint shear strength increased, though significant enhancement of peak shear stress was not observed in cases of high roughness. Lin et al. (2014) employed FLAC3D to refine models established by ANSYS, primarily investigating the influence of bolt dip angle on shear characteristics of flat and undulating joints. Based on the particle discrete element method, Wang et al. (2017) focused on bolted rock joints, examining the development of micro cracks and the failure modes during the shear process. Ranjbarnia et al. (2022) analyzed and simulated the behavior of pre-tensioned grouted rock bolts in bedding rock slopes. Their findings indicated that pre-tensioning and joint roughness improve resistance to sliding along the joint, with rock bolts proving particularly effective in high-strength rock slopes.
Many scholars have made significant contributions to the study of the shear characteristics of rock bolts, with a focus primarily on smooth joints, while research on the roughness of joint surfaces is relatively scarce. Roughness affects friction and surface contact, thereby influencing the shear behavior between rock and rock bolts. Hence, consideration of joint surface roughness is essential in bolt design to ensure accurate assessment of its shear characteristics and implementation of appropriate measures to enhance structural stability and safety.
The microscopic shear behavior of joint surfaces is challenging to observe directly through laboratory experiments. To address this, the Particle Flow Code (PFC) discrete element method was employed in this study to simulate and analyze the microscopic shear behavior of joint surfaces. This approach provided detailed data on stress distribution, displacement, and crack propagation. Using the Barton standard joint profile and accounting for joint roughness, numerical simulations of direct shear tests were conducted on rock mass joints under varying normal stresses and JRC values. The JRC range of 12–20 was selected to comprehensively examine the impact of joint roughness on the shear behavior of bolted rock joints. This range was chosen based on the Barton standard, ensuring that the simulations accurately represent the roughness variations typically found in natural rock masses. The research results reveal the evolutionary patterns of shear stress, shear stiffness, and micro crack development in rock joints reinforced with rock bolts.
2 Parameter calibration and numerical model establishment
2.1 Mesoscopic parameter calibration
Before conducting the single shear test, it was necessary to calibrate the mesoscopic parameters through numerical simulation. Initially, numerous biaxial compression numerical simulations were performed using PFC2D, with iterative adjustments made to the mesoscopic parameters. The calibration results were compared with laboratory test results until a consistent match was achieved. Subsequently, the mesoscopic parameters listed in Table 1 were utilized for the numerical simulation.
Taking the calculation of the internal friction angle and cohesion as an example, the relationship between compressive strength and confining pressure was first plotted based on numerical test results, and a linear relationship between them was established through linear regression. Next, the slope and intercept parameters of the linear regression were calculated using the least squares method. These parameters describe the relationship between compressive strength and confining pressure. Using the slope parameter, the friction angle was calculated to be 35.3° through an arcsine function. Finally, the intercept parameter and the calculated friction angle were used to determine the cohesion.
2.2 Numerical model establishment
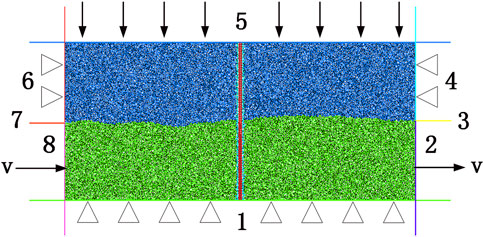
As shown in Figure 1, a two-dimensional numerical test model of bolted rock joints is established in PFC. According to the common size of the indoor experiment, the size length of the model is set to 200 mm and the height is 90 mm. The model includes the upper test block, the lower test block, the joint, the grouting body and the bolt. In the model, the blue particles represent the upper test block, and the green particles represent the lower test block. The cyan particles represent the slurry, and the diameter of the grouting hole is 5 mm. The red particles represent the full-length grouting bolt, and the diameter of the bolt is 2 mm. The numerical model consists of eight wall elements, and the upper part of the model is composed of No.4, No.5 and No.6 walls. The lower part of the model is composed of No. 1, No. 2 and No. 8 walls. The purpose of setting the No.3 and No.7 walls is to prevent the particles from overflowing during the shearing process.
The minimum radius of the particles is 0.45 mm, the maximum radius is 0.747 mm, and the particle size ratio is 1.66. The particles of the bolt are juxtaposed in two rows with a radius of 0.5 mm, and the particles are cut off from each other. The JRC standard contour line proposed by Barton and Choubey (1977) was used for the joint surface. The steps to accurately create a standard contour line in the particle discrete element are as follows. Firstly, different standard contour lines are divided into one hundred segments, then the contour lines of each segment are transformed into coordinate values, and finally, the front and rear coordinate values of each segment are input into the model.
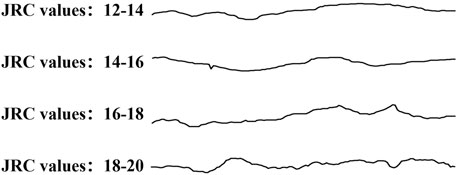
In order to investigate the influence of normal stress and JRC on the shear mechanical properties and failure mode of bolted rock joints, numerical simulations were conducted separately for unbolted and bolted rock joints. To cover a wide range of common geological conditions and potential scenarios encountered in practical engineering (Özvan et al., 2014; Hu et al., 2022), specific JRC and stress values were selected for the simulations, as shown in Table 2, based on relevant studies conducted by previous researchers. When examining the influence of normal stress, four different normal stresses (6.5 MPa, 8.5 MPa, 10.5 MPa, and 12.5 MPa) were applied to both bolted and unbolted rock joints, with a constant JRC of 12–14. Similarly, when analyzing the effect of JRC, four different JRC (12–14, 14–16, 14–18, and 18–20) were applied to both bolted and unbolted rock joints, while maintaining a constant normal stress of 6.5 MPa. Figure 2 illustrates the two-dimensional profile lines of the four different joints.
3 Numerical simulations of direct shear under different normal stress conditions
3.1 Analysis of shear stress-shear displacement curve
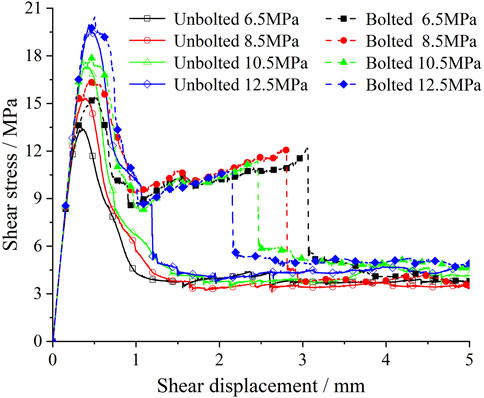
Under different normal stress conditions, the shear stress-shear displacement curves of unbolted and bolted rock joints are summarized as shown in Figure 3. The shear stress-shear displacement curve of unbolted rock joint can be divided into three stages, which are linear elasticity, plastic softening and residual stage. The shear stress-shear displacement curve of bolted rock joint can be divided into five stages: linear elasticity, drop, plastic strengthening, bolt fracture and residual stage.
As the joint surface undergoes minimal displacement before reaching peak shear stress, the relationship between shear stress and displacement remains consistent for both unbolted and bolted rock joints when displacement is small. Initially, shear stress increases linearly with displacement, with the influence of bolted joints being limited. During this linear elasticity stage, shear behavior primarily depends on the inherent properties of the joint surface. The peak shear stress of both unbolted and bolted rock joints rises with increasing normal stress, with the peak shear stress of bolted joints notably surpassing that of unbolted. Shear stress peaks at minimal displacement, after which it gradually declines, eventually plateauing. Rock bolts reinforce the rock mass and restrict the displacement of jointed rock, thereby enhancing its overall load-bearing capacity and shear strength, Zhang et al. (2024) also reached a similar conclusion in their shear tests on bolted jointed rock masses. After the bolt is broken, the shear stress changes abruptly, and finally, the shear stress decreases to the same level as the unbolted rock joints (Zheng et al., 2024a; Zheng et al., 2024b).
Under varying normal stress conditions, both the unbolted and bolted rock joints exhibit increasing peak shear stress. However, the rate of increase in peak shear stress decreases as normal stress rises. Specifically, for the unbolted rock joint, the peak shear stress values are 13.44 MPa, 15.32 MPa, 17.32 MPa, and 19.97 MPa, respectively. Correspondingly, for the bolted rock joint, the peak shear stress values are 15.39 MPa, 16.52 MPa, 17.85 MPa, and 20.45 MPa, respectively. The incremental increases in peak shear stress are 1.95 MPa, 1.2 MPa, 0.53 MPa, and 0.48 MPa, respectively, showcasing a continuous decrease in the rate of increase with escalating normal stress. This phenomenon occurs because, as normal stress increases, the ability of the rock joints (both unbolted and bolted) to resist further increases in peak shear stress diminishes. For bolted joints, the bolt transitions to a tensile state after shear displacement, enhancing the normal stress on the joint surface. This additional stress increases the resistance to shear but does so at a decreasing rate as normal stress rises, leading to the observed diminishing increments in peak shear stress. This trend aligns with the findings of Hass (Hass, 1976), indicating that the joint’s shear resistance capacity becomes progressively less sensitive to normal stress increments.
The relationship between normal stress and maximum shear displacement of the bolt follows a pattern: as the normal stress increases, the shear stress on the bolt increases as well, leading to a gradual decrease in the shear displacement when the bolt breaks. Specifically, when the normal stress is 6.5 MPa, the maximum shear displacement of the bolt is 3.06 mm. With a normal stress of 10.5 MPa, the maximum shear displacement decreases to 2.81 mm, and further reduces to 2.60 mm at the same normal stress level. Finally, at a normal stress of 12.5 MPa, the maximum shear displacement decreases further to 2.16 mm. This is because higher normal stress enhances the frictional resistance at the joint, reducing the relative movement between the joint surfaces. This increased friction results in greater resistance to shear, leading to a reduced shear displacement at the point of bolt failure. As normal stress rises, the joint becomes more constrained, thereby limiting the movement and resulting in smaller maximum shear displacements when the bolt ultimately breaks (Zhang et al., 2024; Wang et al., 2022).
3.2 Analysis of shear stiffness
The study of shear stiffness is essential for understanding the mechanical behavior of bolted rock joints, as it provides insights into how the rock mass deforms under shear stress. This knowledge is crucial for predicting the stability and failure mechanisms of jointed rock masses, thereby enhancing the design and effectiveness of reinforcement measures such as rock bolts. The examination of shear stiffness focuses on understanding the shear deformation characteristics of rock joints. During numerical simulations, the shear stress-shear displacement curve exhibited fluctuations, potentially leading to accidental errors. To mitigate these errors, the shear stiffness is determined using the secant method, by selecting the linear segment preceding the peak shear stress, with the slope of this segment representing the shear stiffness.
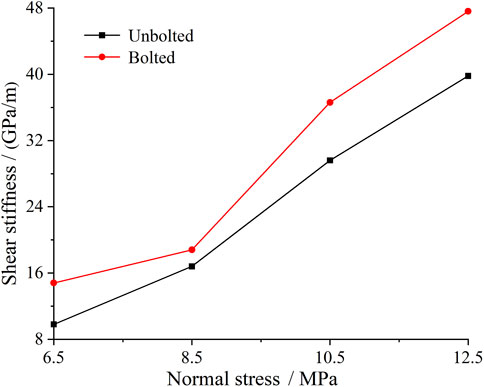
Based on the shear stress-shear displacement curve, the shear stiffness of the sample under varying normal stress conditions is calculated, as illustrated in Figure 4. The shear stiffness of the anchored specimens increases with the rise in normal stress levels. This is primarily because higher normal stress results in tighter contact between surfaces, reducing slippage and deformation at the interface, thereby enhancing shear stiffness. Additionally, the presence of rock bolts significantly improves the shear stiffness of the rock joints. This improvement is mainly attributed to the additional constraints provided by the rock bolts, which make it more difficult for the joint surfaces to undergo noticeable displacement or failure under shear loading, thereby enhancing the overall mechanical performance.
3.3 Record and analysis of micro cracks
In the numerical simulation, micro cracks emerged during particle bonding failure, prompting an investigation into the correlation between micro cracks and shear displacement under various normal stress conditions. Throughout this study, the location, number, and type of micro cracks occurring during the shear process were meticulously recorded.
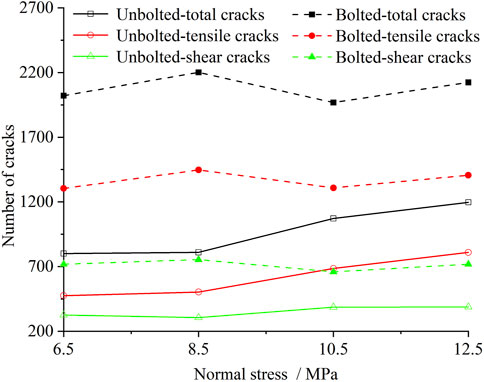
The relationship between the number of micro cracks and the normal stress of unbolted and bolted rock joints is shown in Figure 5. Micro cracks include tensile cracks and shear cracks. When the contact force exceeds the normal bond strength, it is shown as a tensile crack. When the contact force is greater than the tangential bond strength, it is shown as a shear crack. According to the pressure-induced tensile mechanism (Potyondy and Cundall, 2004), the micro cracks of unbolted and bolted rock joints are mainly tensile cracks. The total number of cracks, including tensile cracks, in unbolted rock joints demonstrates a positive correlation with increasing normal stress levels. However, in the case of bolted rock joints, an evident crushing zone forms between the bolt and the joint surface, leading to a higher occurrence of both types of cracks compared to unbolted rock joints. Across the four normal stress conditions, the total number of cracks in bolted rock joints increased by approximately 2.52 times, 2.72 times, 1.84 times, and 1.77 times, respectively. The bolts introduce additional stress concentrations, particularly in the crushing zone at the bolt-joint interface, which enhances both tensile and shear crack formation. This zone experiences high stress intensities due to the bolts restraining the rock movement, leading to a greater accumulation of micro cracks. The higher normal stress exacerbates this effect, causing more pronounced cracking in bolted joints, as compared to unbolted joints, where stress distribution is less localized and severe (Chen Y. F. et al., 2022).
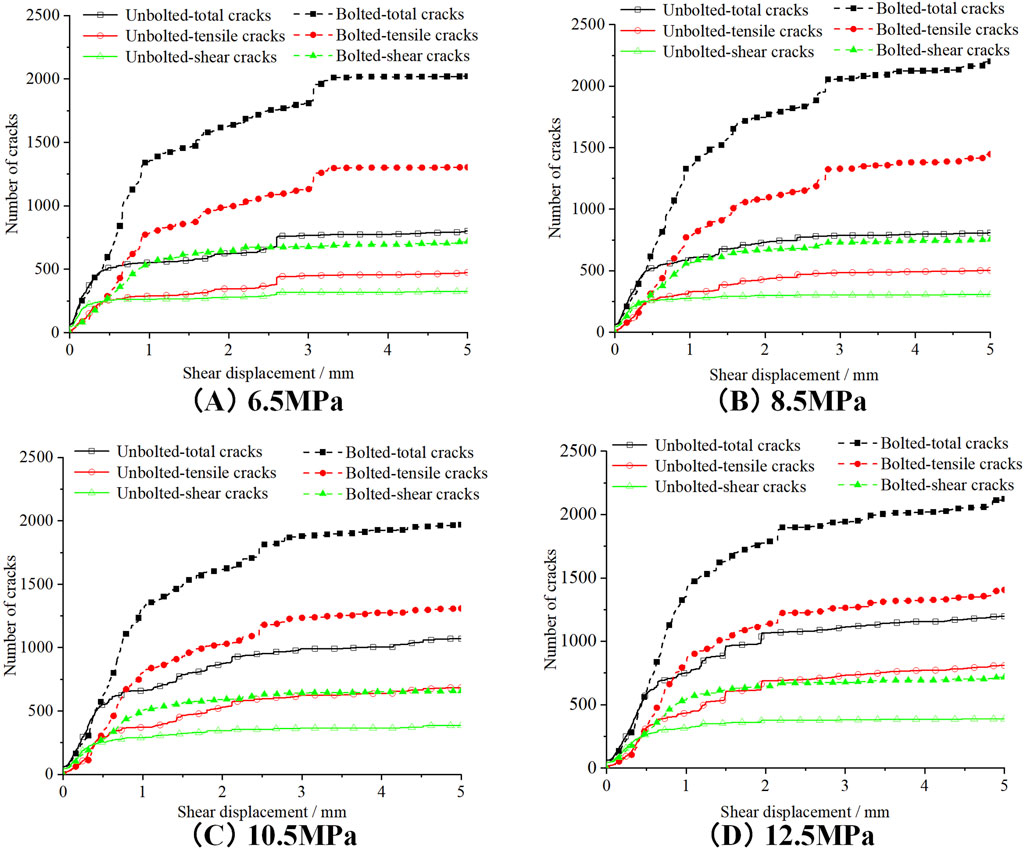
The relationship between the number of micro cracks and shear displacement under varying normal stress conditions is depicted in Figure 6. The evolution pattern of total cracks, tensile cracks, and shear cracks remains consistent. The crack propagation in unbolted rock joints exhibits two distinct stages: a rapid development phase and a stable phase. During the rapid development phase, extensive contact between the upper and lower rock masses leads to a sharp increase in crack numbers with shear displacement. Conversely, the stable phase sees a gradual rise in micro cracks due to the degradation of joint surface asperities. It can be seen from the Figure 6 that the crack development of unbolted rock joints enters the stable stage earlier than that of bolted rock joints. The shear crack enters the stable stage earlier than the tensile crack.
The crack evolution in bolted rock joints can be categorized into three distinct stages: the high-speed development stage, the slow development stage, and the stable development stage. During the high-speed development stage, the pattern of microcrack evolution mirrors that of unbolted rock joints, with rapid crack propagation. As the sample transitions into the slow development stage, microcracks begin to spread outward from the larger asperities, with an increased concentration of cracks forming at the intersection between the bolt and the joint surface. The growth rate of microcracks during this phase is slower compared to the high-speed development stage. Once the joint surface of the rock mass has fully degraded and the bolt has fractured, the crack evolution enters the stable development stage. In this final stage, the number of cracks increases at a much slower rate.
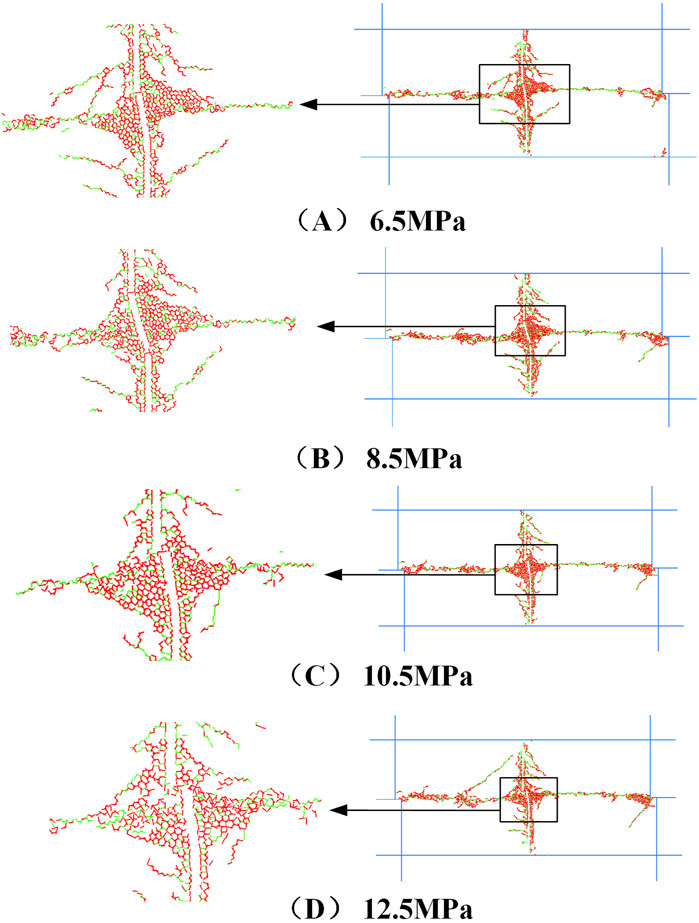
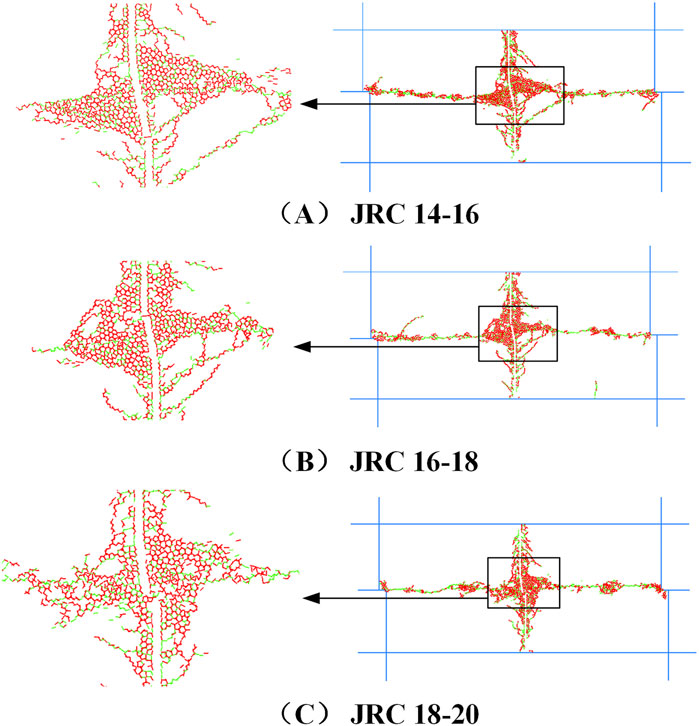
Figure 7 depicts the micro crack distribution of unbolted rock joints at the conclusion of the shear process under varying normal stress conditions. In the figure, red line segments represent tensile cracks, while green line segments denote shear cracks. Despite the consistency in crack distribution positions across different conditions, the number of cracks increases with escalating normal stress levels. Under different normal stress conditions, the distribution of micro cracks in bolted rock joints at the end of shear is illustrated in Figure 8, with all four specimens showing similar distributions. Initially, when the shear displacement is small, cracks emerge on the joint surface. As the relative position of the upper and lower shear boxes increases, the cracks at the junction of the bolt and the joint surface gradually proliferate and extend towards both ends of the bolt. This is because the bolts constrain the joint, leading to higher localized stresses at the junction between the bolt and the joint surface, which causes increased crack formation and extension in those areas (Chen Y. F. et al., 2022).
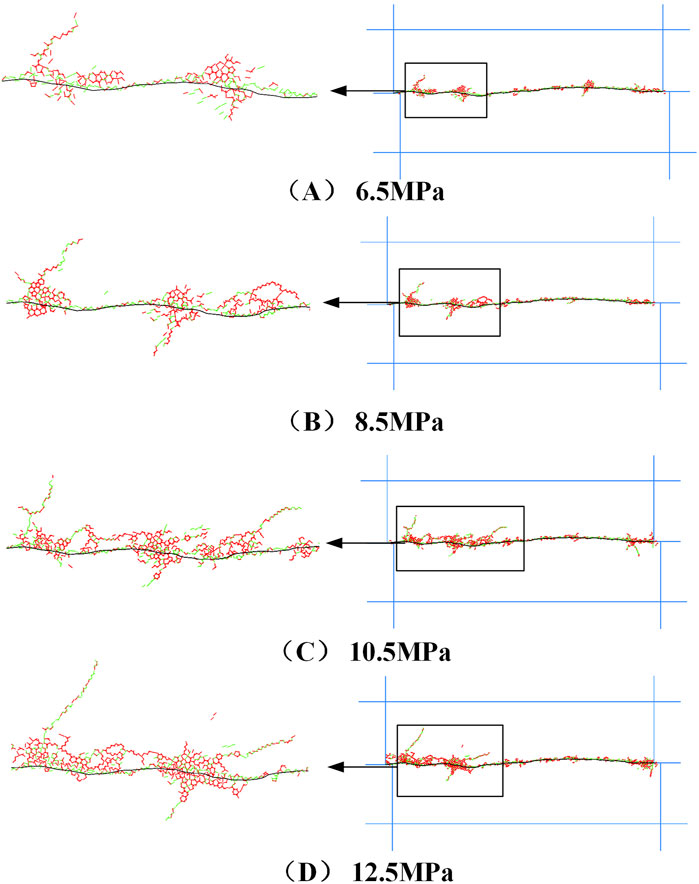
Figure 7. Microcracks distribution of unbolted rock joints under different normal stress conditions.
4 Direct shear numerical simulation under different JRC conditions
4.1 Analysis of shear stress-shear displacement curve
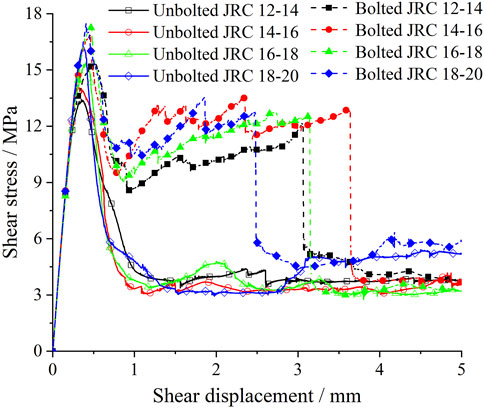
The roughness of the joint surface influences the dilatancy effect, crack development, and peak shear stress under shear load. As described in Figure 9 and consistent with section 3.1, the shear stress-shear displacement curves for unbolted and bolted rock joints show that with increasing JRC, the peak shear stress also rises. This increase is more pronounced in bolted joints, where the peak shear stress is significantly higher than in unbolted joints. The enhanced interlocking effect of rougher joint surfaces increases resistance to shear movement, leading to higher peak shear stress. Bolts further amplify this effect by providing additional restraint. Additionally, the JRC affects the maximum shear displacement of the bolt, with rougher surfaces creating greater resistance to shear forces and thereby reducing the displacement at which the bolt may fail.
Figure 10 illustrates the variation of peak shear stress of jointed rock mass with changes in JRC. It is evident that the peak shear stress of the specimens increases with the rise in JRC. Specifically, under different JRC conditions, the peak shear stress of the jointed rock mass before bolt reinforcement measures 13.44 MPa, 14.37 MPa, 15.38 MPa, and 16.25 MPa, respectively. Subsequently, after bolt reinforcement, the peak shear stress is recorded as 15.39 MPa, 16.88 MPa, 17.30 MPa, and 17.35 MPa, respectively. The addition of bolt reinforcement leads to varying degrees of improvement in the peak shear stress of the specimens, with incremental percentages of 14.5%, 17.5%, 12.5%, and 6.8%, respectively.
To verify the accuracy of the numerical simulation results, the theoretical formula proposed by Barton (Barton, 1973) was used to obtain the corresponding shear strength of the unbolted rock joint. The calculation formula is as follows:
Where,
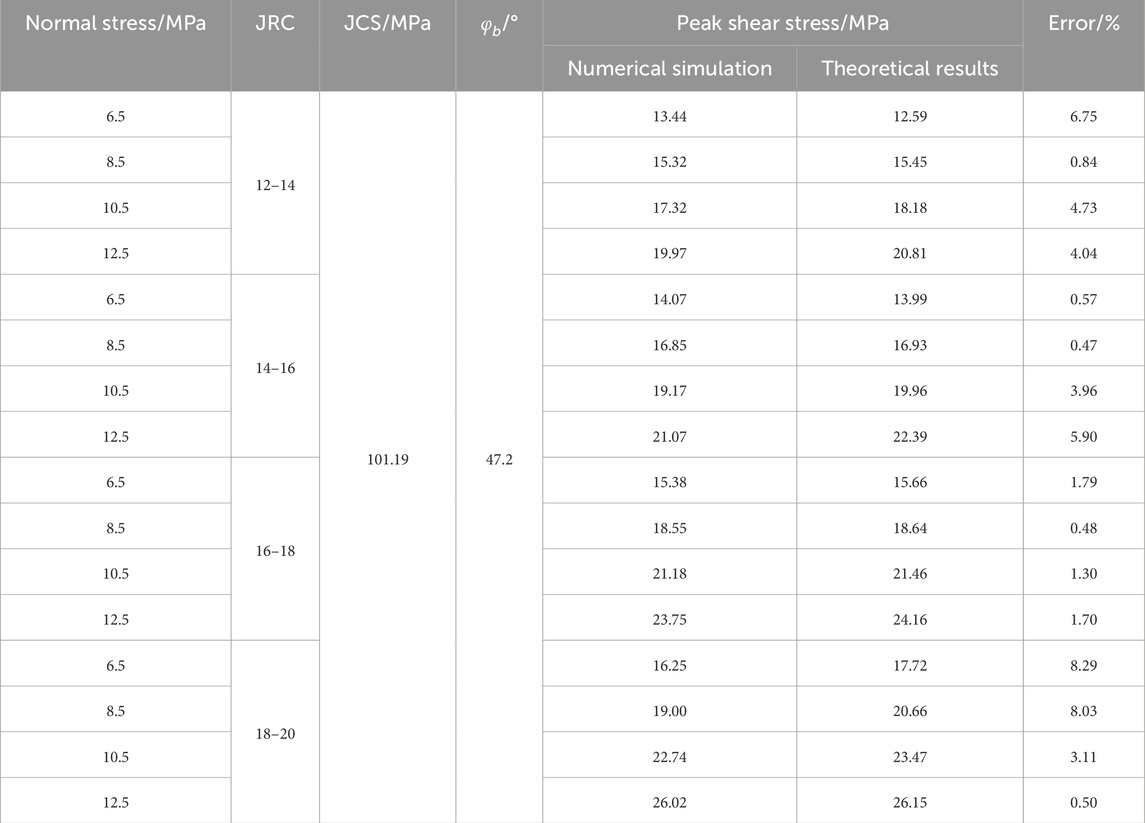
Under different JRC conditions, the direct shear numerical simulation of unbolted rock joints with different normal stresses is carried out. The results of Barton’s theoretical formula and numerical simulation are shown in Table 3. The maximum error is 8.29%, and the minimum error is 0.47%. The results show that the numerical results match the theoretical results well.
4.2 Analysis of shear stiffness
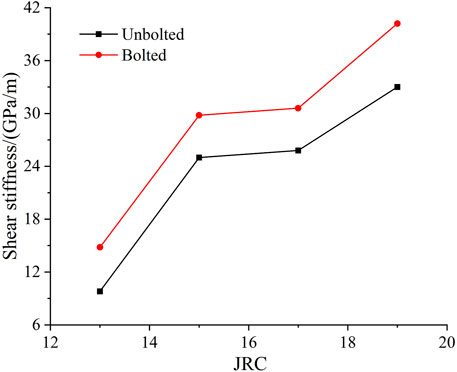
According to the shear stress-shear displacement curves of different JRC, the calculated shear stiffness is shown in Figure 11. With the increase of JRC, the shear stiffness gradually increases, and the shear stiffness of bolted rock joint is larger than that of unbolted rock joint. The shear stiffness of unbolted rock joints is 9.8 GPa/m, 25.0 GPa/m, 25.8 GPa/m, and 33.0 GPa/m, respectively. For the rock joint after bolt reinforcement, the shear stiffness is 14.8 GPa/m, 29.8 GPa/m, 30.6 GPa/m, and 40.2 GPa/m, respectively. This represents an increase in shear stiffness of 51.0%, 19.2%, 18.6%, and 21.8%, respectively.
The observed increase in shear stiffness with rising JRC and the higher stiffness in bolted rock joints compared to unbolted ones can be attributed to several factors. As JRC increases, the roughness of the joint surfaces enhances mechanical interlocking, which increases resistance to shear displacement and thus shear stiffness. Bolt reinforcement further contributes by providing additional structural support, preventing relative movement between rock blocks and thereby increasing the system’s overall stiffness. Additionally, higher JRC leads to an increased contact area and frictional resistance, further enhancing shear stiffness. Bolts also play a crucial role in preventing sliding and controlling crack propagation, maintaining the integrity of the rock mass. The percentage increases in shear stiffness due to bolting, ranging from 18.6% to 51.0%, are more pronounced at lower JRC values, highlighting the significant role of bolts in enhancing the rigidity and stability of the rock joint system, especially when natural interlocking is less prominent (Wu et al., 2023).
4.3 Record and analysis of micro cracks
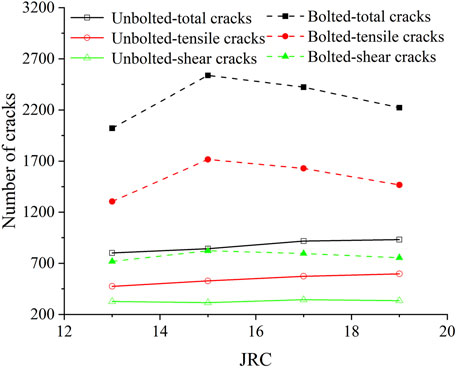
The relationship between the number of micro cracks and JRC is illustrated in Figure 12. As JRC increases, both the total number of cracks and the number of tensile cracks in unbolted rock joints increase. In bolted rock joints, the number of cracks is consistently higher than in unbolted joints. Specifically, for different JRC values, the total number of cracks in bolted rock joints is 2.52, 3.01, 2.64, and 2.38 times greater than in unbolted rock joints, respectively. The increase in the number of total and tensile cracks with higher JRC in unbolted rock joints is due to the greater surface roughness, which induces more stress concentrations and crack initiation points. In bolted rock joints, the presence of bolts introduces additional stress concentrations around the bolts and enhances the constraint on the joint, leading to more pronounced stress distribution and crack propagation. As a result, bolted rock joints exhibit a significantly higher number of cracks compared to unbolted joints, with the total number of cracks being 2.52 to 3.01 times greater, depending on the JRC (Yang et al., 2022; Potyondy and Cundall, 2004).
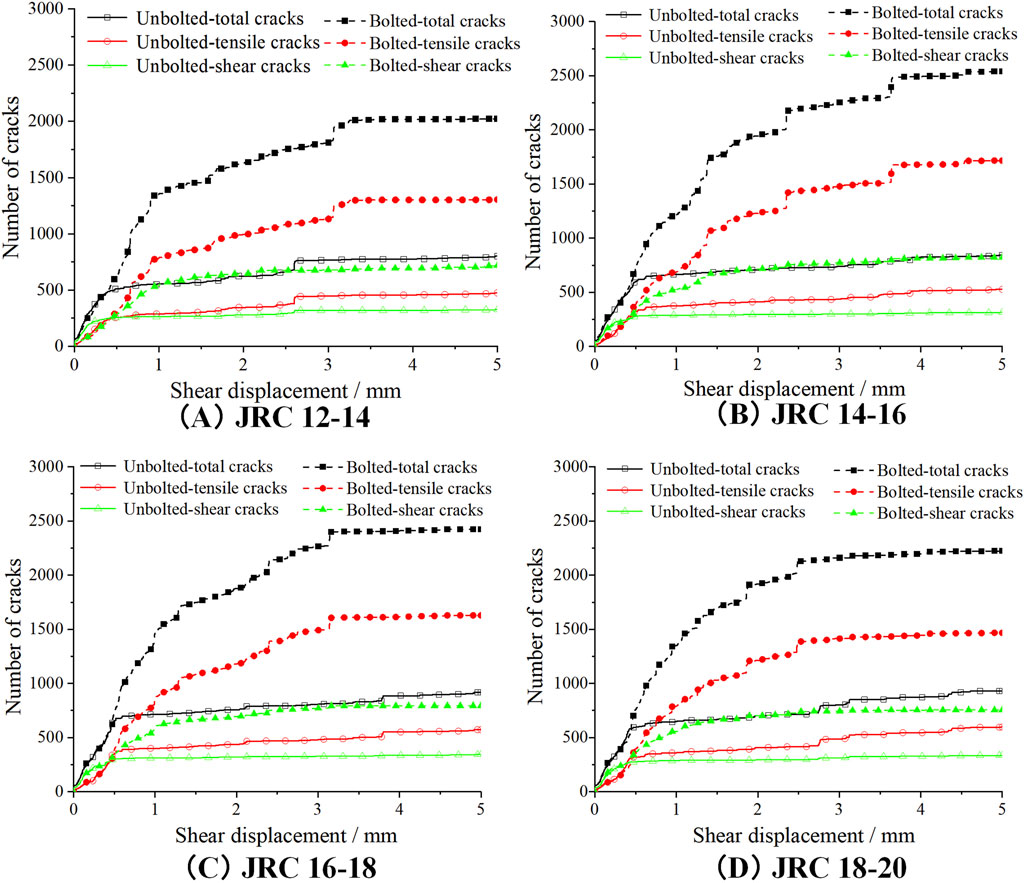
As shown in Figure 13, the relationship between the number of micro cracks in the jointed rock mass and shear displacement is depicted under various JRC conditions. The crack development trend mirrors that described in section 3.3. For unbolted rock joints under different JRC conditions, the rapid development stage of the total number of cracks concludes at shear displacements of 0.48 mm, 0.53 mm, 0.69 mm, and 0.63 mm, respectively. Subsequently, crack development progresses into a stable stage until the end of the simulation. The rapid development of cracks in unbolted rock joints up to certain shear displacements, followed by a transition to a stable stage, is primarily due to the initial stress concentration and strain energy release at the onset of shear displacement. As shear displacement begins, the roughness of the joint surfaces (indicated by different JRC values) causes stress to concentrate at asperities, leading to rapid crack initiation and propagation. Once the initial energy is dissipated and the primary crack paths are established, further crack development slows down, entering a stable phase where additional displacement results in only minimal new crack formation.
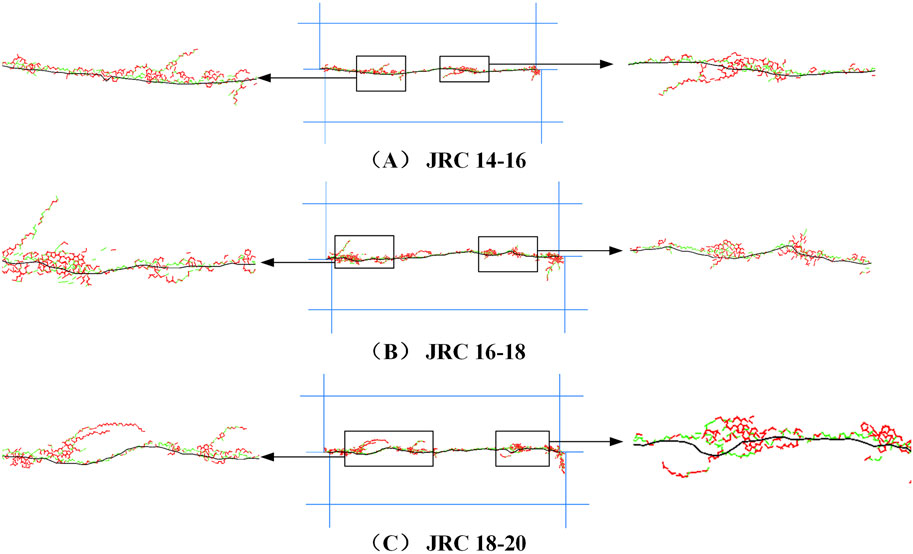
In unbolted rock joints, Figure 14 shows the distribution of micro cracks under varying JRC conditions. As JRC increases, surface wear becomes more significant, with cracks propagating around the surface irregularities, resulting in the formation of additional micro cracks. Similarly, Figure 15 illustrates the distribution of micro cracks in bolted rock joints under different JRC values. The crack patterns are similar to those observed under various normal stress conditions, with cracks continuing to develop around the asperities of the joint surface and extending toward both ends of the bolt. A notable concentration of micro cracks forms at the interface between the bolt and the joint surface.
5 Conclusion
The standard joint roughness profile line proposed by Barton was integrated into the particle discrete element numerical simulation software, enabling direct shear simulations for both unbolted and bolted rock joints. The mesoscopic shear behavior of the numerical models was examined under varying normal stresses and different JRC conditions. The specific conclusions are as follows:
(1) The shear stress-shear displacement curve of unbolted rock joints exhibits three distinct stages: linear elasticity, plastic softening, and residual stages. Conversely, the curve for bolted rock joints can be delineated into five stages: linear elasticity, drop, plastic strengthening, bolt fracture, and residual stages.
(2) Although the selected JRC values in this study are relatively close, they fall within a range commonly encountered in engineering. Higher JRC values and normal stresses enhance resistance; thus, for both unbolted and bolted rock joints, peak shear stress and shear stiffness increase with the rise in normal stress or JRC values. The peak shear stress and shear stiffness of bolted rock joints are significantly higher compared to unbolted joints, as the bolts provide additional constraints. As normal stress increases, the maximum shear displacement of the bolts decreases, reflecting greater frictional resistance at the joint surface.
(3) The total number of cracks and tensile cracks escalates in both unbolted and bolted rock joints with rising normal stress and JRC. Bolted rock joints exhibit a higher crack count compared to unbolted joints, primarily due to additional stress concentration around the bolts, which accelerates crack formation. In both types of joints, the micro cracks are predominantly tensile in nature, resulting from the applied pressure. These cracks typically initiate at the joint surface and propagate outward as shear displacement increases. In bolted rock joints, a distinct crushing zone forms at the interface between the bolt and the joint surface, further contributing to crack development.
This study comprehensively considers the influence of different JRC and normal stresses on the shear characteristics of bolted rock joints, analyzing their shear properties from a micro-mechanical perspective and observing the evolution patterns of micro cracks. These findings provide insights for the design and disaster prevention of bolting engineering, aiding in optimizing engineering solutions and enhancing disaster prevention capabilities. Additionally, there are some limitations to this research. The number of experiments conducted is relatively limited, providing an initial understanding of the mechanisms involved. To further validate and refine these findings, it is crucial to perform a broader range of experiments, exploring more variations in JRC values and normal stress conditions. Future research should not only address these experimental limitations but also further explore other factors affecting the performance of bolted rock joints. Continued improvement of numerical modeling techniques is necessary to enhance the accuracy and reliability of the research outcomes.
Data availability statement
The original contributions presented in the study are included in the article/supplementary material, further inquiries can be directed to the corresponding author.
Author contributions
ZW: Conceptualization, Methodology, Supervision, Validation, Writing–original draft. LL: Conceptualization, Formal Analysis, Project administration, Software, Writing–original draft. SG: Investigation, Visualization, Writing–original draft. HZ: Visualization, Writing–review and editing. XW: Funding acquisition, Methodology, Project administration, Supervision, Writing–review and editing.
Funding
The author(s) declare that financial support was received for the research, authorship, and/or publication of this article. This study has been partially funded by National Natural Science Foundation of China (No. 52179098, 41907251). These supports are gratefully acknowledged.
Conflict of interest
Authors ZW, LL, SG and XW were employed by Fujian Qijian Group Co., Ltd.
The remaining author declares that the research was conducted in the absence of any commercial or financial relationships that could be construed as a potential conflict of interest.
Publisher’s note
All claims expressed in this article are solely those of the authors and do not necessarily represent those of their affiliated organizations, or those of the publisher, the editors and the reviewers. Any product that may be evaluated in this article, or claim that may be made by its manufacturer, is not guaranteed or endorsed by the publisher.
References
Asadi, S. M., Rasouli, V., and Barla, G. (2012). A bonded particle model simulation of shear strength and asperity degradation for rough rock fractures. Rock Mech. Rock Eng. 45, 649–675. doi:10.1007/s00603-012-0231-4
Barton, N. (1973). Review of a new shear-strength criterion for rock joints. Eng. Geol. 7, 287–332. doi:10.1016/0013-7952(73)90013-6
Barton, N., and Choubey, V. (1977). The shear strength of rock joints in theory and practice. Rock Mech. 10, 1–54. doi:10.1007/bf01261801
Cao, R. H., Yao, R. B., Meng, J. J., Lin, Q. B., Lin, H., and Li, S. (2020). Failure mechanism of non-persistent jointed rock-like specimens under uniaxial loading: laboratory testing. Int. J. Rock Mech. Min. Sci. 12, 104341. doi:10.1016/j.ijrmms.2020.104341
Chen, Q. Z., Liu, Y. M., Wang, W., Ou, X., Zhou, Y. H., Teng, Z. L., et al. (2022a). Effects of normal stress and joint inclination angle on rock failure characteristics under compression-shear conditions. Front. Earth S. C. 10, 950648. doi:10.3389/feart.2022.950648
Chen, Y. F., Lin, H., Xie, S. J., Ding, X. R., He, D. L., Yong, W. X., et al. (2022b). Effect of joint microcharacteristics on macro shear behavior of single-bolted rock joints by the numerical modelling with PFC. Environ. Earth. Sci. 81, 276. doi:10.1007/s12665-022-10411-y
Hu, Y. J., Wang, X. Y., and Zhong, Z. (2022). Investigations on the jointed influences of saturation and roughness on the shear properties of artificial rock joints. Geomech. Geophys. Geo-energ. Geo-resour. 8, 115. doi:10.1007/s40948-022-00421-2
Jaeger, J. C. (1971). Friction of rocks and stability of rock slopes. Geotechnique 21, 97–134. doi:10.1680/geot.1971.21.2.97
Jalalifar, H., and Azia, N. (2010). Experimental and 3D numerical simulation of reinforced shear joints. Rock Mech. Rock Eng. 43, 95–103. doi:10.1007/s00603-009-0031-7
Kalman, K. (2003). History of the sprayed concrete lining method-part II: milestones up to the 1960s. Tunn. Undergr. Sp. Tech. 18, 71–83. doi:10.1016/s0886-7798(03)00006-3
Kang, H., Wu, Y., Gao, F., Jiang, P., Cheng, P., Meng, X., et al. (2016). Mechanical performances and stress states of rock bolts under varying loading conditions. Tunn. Undergr. Sp. Tech. 52, 138–146. doi:10.1016/j.tust.2015.12.005
Kemeny, J. (2005). Time-dependent drift degradation due to the progressive failure of rock bridges along discontinuities. Int. J. Rock Mech. Min. Sci. 42, 35–46. doi:10.1016/j.ijrmms.2004.07.001
Li, C. C. (2010). Field observations of rock bolts in high stress rock masses. Rock Mech. Rock Eng. 43, 491–496. doi:10.1007/s00603-009-0067-8
Li, C. C., Aure, A., and Knox, G. (2023). Experimental study of the effects of borehole size, borehole roughness, and installation pressure on the pull load capacity of inflatable rockbolts. Rock. Mech. Rock. Eng. 56 (11), 8415–8431. doi:10.1007/s00603-023-03492-z
Li, Y., Zhou, H., Zhang, L., Zhu, W. S., Li, S. C., and Li, J. (2016). Experimental and numerical investigations on mechanical property and reinforcement effect of bolted jointed rock mass. Constr. Build. Mater 126, 843–856. doi:10.1016/j.conbuildmat.2016.09.100
Lin, H., Xiong, Z. Y., Liu, T. Y., Cao, R. H., and Cao, P. (2014). Numerical simulations of the effect of bolt inclination on the shear strength of rock joints. Int. J. Rock Mech. Min. Sci. 66, 49–56. doi:10.1016/j.ijrmms.2013.12.010
Ma, J., Stankus, J., and Faulkner, D. (2018). Development and evaluation of corrosion resistant coating for expandable rock bolt against highly corrosive ground conditions. Int. J. Min. Sci. Techno. 28 (01), 145–151. doi:10.1016/j.ijmst.2017.12.023
Ma, S., Aziz, N., Nemcik, J., and Mirzaghorbanali, A. (2017). The effects of installation procedure on bond characteristics of fully grouted rock bolts. Geotech. Test. J. 40, 846–857. doi:10.1520/gtj20160239
Özvan, A., Dinçer, İ., Acar, A., and Özvan, B. (2014). The effects of discontinuity surface roughness on the shear strength of weathered granite joints. Bull. Eng. Geol. Environ. 73, 801–813. doi:10.1007/s10064-013-0560-x
Pariseau, W. G. (1999). An equivalent plasticity theory for jointed rock masses. Int. J. Rock Mech. Min. Sci. 36, 907–918. doi:10.1016/s0148-9062(99)00052-2
Park, J. W., and Song, J. J. (2009). Numerical simulation of a direct shear test on a rock joint using a bonded-particle model. Int. J. Rock Mech. Min. Sci. 46, 1315–1328. doi:10.1016/j.ijrmms.2009.03.007
Potyondy, D., and Cundall, P. (2004). A bonded-particle model for rock. Int. J. Rock Mech. Min. Sci. 41, 1329–1364. doi:10.1016/j.ijrmms.2004.09.011
Ranjbarnia, M., Rashedi, M. M., and Dias, D. (2022). Analytical and numerical simulations to investigate effective parameters on pre-tensioned rockbolt behavior in rock slopes. B. Eng. Geol. Environ. 81, 74. doi:10.1007/s10064-021-02563-1
Saadat, M., and Taheri, A. (2020). A numerical study to investigate the influence of surface roughness and boundary condition on the shear behaviour of rock joints. B Eng. Geol. Environ. 79, 2483–2498. doi:10.1007/s10064-019-01710-z
Shang, J., Yokota, Y., Zhao, Z., and Dang, W. (2018). DEM simulation of mortar-bolt interface behaviour subjected to shearing. Constr. Build. Mater 185, 120–137. doi:10.1016/j.conbuildmat.2018.07.044
Shi, G. C., Yang, X. J., Chen, W., Chen, H., Zhang, J. C., and Tao, Z. G. (2020). Characteristics of failure area and failure mechanism of a landslide in Yingjiang County, Yunnan, China. Landslides 18, 721–735. doi:10.1007/s10346-020-01544-x
Srivastava, L. P. (2022). Analysis of a rock bolt-reinforced tunnel with equivalent mechanical properties. Indian Geotech. J. 52, 815–834. doi:10.1007/s40098-022-00631-1
Wang, B., Jiang, Y. J., Zhang, Q. Y., and Zhang, Y. Q. (2024). Cyclic shear behavior of en-echelon joints under constant normal stiffness conditions. J. Rock Mech. Geotech. Eng., 107308. doi:10.1016/j.jrmge.2023.12.002
Wang, C. S., Jiang, Y. J., Wang, G., Luan, H. J., Zhang, Y. C., and Zhang, S. H. (2022). Experimental investigation on the shear behavior of the bolt-grout interface under CNL and CNS conditions considering realistic bolt profiles. Geomech. Geophys. Geo-energ. Geo-resour. 8, 111. doi:10.1007/s40948-022-00416-z
Wang, G., Zhang, Y. Z., Jiang, Y. J., Wang, S. G., and Jing, W. J. (2017). Macro-micro failure mechanisms and damage modelling of a bolted rock joint. Adv. Mater Sci. Eng., 1627103. doi:10.1155/2017/1627103
Wu, C. Z., Chen, X. G., Hong, Y., Xu, R. Q., and Yu, D. H. (2018). Experimental investigation of the tensile behavior of rock with fully grouted bolts by the direct tensile test. Rock. Mech. Rock. Eng. 51 (1), 351–357. doi:10.1007/s00603-017-1307-y
Wu, X. Z., Zheng, H. F., and Jiang, Y. J. (2023). Influence of joint roughness on the shear properties of energy-absorbing bolt. Int. J. Rock Mech. Min. Sci. 163, 105322. doi:10.1016/j.ijrmms.2022.105322
Wu, X. Z., Zheng, H. F., Jiang, Y. J., Deng, T., Xiao, G. S., and Wang, Y. (2022). Effect of cyclic shear loading on shear performance of rock bolt under different joint roughness. Rock. Mech. Rock. Eng. 56 (3), 1969–1980. doi:10.1007/s00603-022-03174-2
Yang, Z., Zhu, W. C., Guan, K., Yan, B. X., Luo, W. J., and Liang, P. (2022). Experimental and numerical study on the anchorage effect of bolted jointed rock masses. Front. Earth S. C. 10, 861912. doi:10.3389/feart.2022.861912
Zaheri, M., and Ranjbarnia, M. (2022). Long-term analysis of tunnels in rheological rock masses considering the excavation-damaged zone. Int. J. Geomech. 23. doi:10.1061/(ASCE)GM.1943-5622.0002642
Zhang, S. H., Jiang, Y. J., Luan, H. J., Li, B., Liu, J. R., and Wang, C. S. (2024). Study on shear mechanical characteristics of rock joints under different anchorage lengths. Rock. Mech. Rock. Eng. 57, 9959–9981. doi:10.1007/s00603-024-04075-2
Zheng, H. F., Wu, X. Z., Jiang, Y. J., Wang, G., and Li, B. (2024b). Insights into velocity-dependent shear characteristics of bolted rock joints: a comparative study of fully-grouted and energy-absorbing bolts. Int. J. Rock Mech. Min. Sci. 183, 105910. doi:10.1016/j.ijrmms.2024.105910
Zheng, H. F., Wu, X. Z., Jiang, Y. J., Wang, G., Zheng, B., Zhu, J. H., et al. (2024a). Model studies on the effects of filling thickness and joint roughness on the shear characteristics of fully encapsulated bolts and energy-absorbing bolts. Rock Mech. Rock Eng. 57, 765–777. doi:10.1007/s00603-023-03558-y
Keywords: mining engineering, rock bolts, rock joints, numerical simulation, joint roughness coefficient
Citation: Wang Z, Liao L, Guo S, Zheng H and Wu X (2024) Numerical investigation of bolted rock joints under varying normal stress and joint roughness coefficient conditions. Front. Earth Sci. 12:1402708. doi: 10.3389/feart.2024.1402708
Received: 18 March 2024; Accepted: 18 November 2024;
Published: 04 December 2024.
Edited by:
Han Du, Tsinghua University, ChinaReviewed by:
Jiaqi Guo, Henan Polytechnic University, ChinaMasoud Ranjbarnia, University of Tabriz, Iran
Copyright © 2024 Wang, Liao, Guo, Zheng and Wu. This is an open-access article distributed under the terms of the Creative Commons Attribution License (CC BY). The use, distribution or reproduction in other forums is permitted, provided the original author(s) and the copyright owner(s) are credited and that the original publication in this journal is cited, in accordance with accepted academic practice. No use, distribution or reproduction is permitted which does not comply with these terms.
*Correspondence: Xuezhen Wu, d3VAZnp1LmVkdS5jbg==
 Zhiyong Wang1,2
 Shiyi Guo
 Xuezhen Wu
