- 1School of Geosciences, Yangtze University, Wuhan, China
- 2CNOOC Research Institute Ltd., Beijing, China
- 3China National Logging Corporation, Xi’an, China
- 4The Second Oil Plant, Changqing Oil and Gas Branch Company, Xi’an, China
- 5School of Resources and Environment (Institute of Digital Geology and Energy), Linyi University, Linyi, China
Shale oil is stored in nanoscale shale reservoirs. To explore enhanced recovery, it is essential to characterize the flow of hydrocarbons in nanopores. Molecular dynamics simulation is required for high-precision and high-cost experiments related to nanoscale pores. This technology is crucial for studying the kinetic characteristics of substances at the micro- and nanoscale and has become an important research method in the field of micro-mechanism research of shale oil extraction. This paper presents the principles and methods of molecular dynamics simulation technology, summarizes common molecular models and applicable force fields for simulating shale oil flow and enhanced recovery studies, and analyzes relevant physical parameters characterizing the distribution and kinetic properties of shale oil in nanopores. The physical parameters analyzed include interaction energy, density distribution, radial distribution function, mean-square displacement, and diffusion coefficient. This text describes how molecular dynamics simulation explains the mechanism of oil driving in CO2 injection technology and the factors that influence it. It also summarizes the advantages and disadvantages of molecular dynamics simulation in CO2 injection for enhanced recovery of shale oil. Furthermore, it presents the development trend of molecular dynamics simulation in shale reservoirs. The aim is to provide theoretical support for the development of unconventional oil and gas.
1 Introduction
Shale reservoirs differ from conventional sandstone reservoirs in several ways. They have smaller pore throats, lower permeability, higher mud content, and micro- and nano-pore channels. These channels typically have diameters less than 10 nm, and some even have pores less than 2 nm in organic matter. As a result, the seepage mechanism in shale reservoirs is complex and does not conform to Darcy’s law of seepage (Ross and Marc Bustin, 2009; Wang, 2014; Yang et al., 2015; Perez and Devegowda, 2019; Yang et al., 2019; Yang et al., 2020a). And the pore wall composition is complex, which has a great influence on both shale oil endowment and flow in the pore space. Shale is characterized by high brittleness, non-homogeneity, high clay mineral content, and difficulty in fracturing (Zou et al., 2013; Su et al., 2022). At the present stage, horizontal well fracturing technology and multi-well platform industrialized production and other technologies are generally used to modify the reservoir and improve the reservoir permeability, but still can not achieve the desired oil and gas recovery rate. Later, water flooding, chemical flooding, gas flooding, gas huff and puff and other enhanced oil recovery development technologies have been developed successively, but there are different degrees of problems (Feng et al., 2020; Gaddipati et al., 2020). Water drive will produce serious water-sensitive reaction, low water wave efficiency, capillary phenomenon is serious, the development is more difficult; for chemical drive with water drive, there is the same problem of difficult to inject, and serious pollution to the environment, the use of high cost, is not suitable for large-scale production. In comparison, gas injection to improve recovery is a more environmentally friendly and efficient development method.
In the selection of displacement media, experimental studies and field development reports have proved that CO2 injection can effectively improve oil recovery and achieve CO2 storage (Chen et al., 2010; Gao et al., 2010; Liu et al., 2020). CO2 is dissolved in the crude oil, which leads to the expansion of the crude oil volume, thus reducing the viscosity of the crude oil, so that the crude oil mobility is improved (Mondal and De, 2015). According to whether the displacement pressure is higher than the minimum miscible pressure (MMP), gas flooding is divided into immiscible flooding, near miscible flooding and miscible flooding (Li et al., 2020). Compared with nitrogen and methane, CO2 has a lower minimum miscible pressure (Yu et al., 2020a).
This paper explores methods for studying the flow behavior of fluids in nanopores and summarizes recent advances in molecular dynamics simulations for shale oil flow as well as enhanced recovery. In recent years, molecular dynamics simulation has been widely used in the study of shale oil flow characteristics as well as enhanced recovery, which can not only make up for the shortcomings of physical experiments in micro and nanoscale studies and reduce the cost, but also intuitively observe the kinetic behaviors and microscopic mechanisms of the interactions between different fluids in the confined space.
2 Methods for studying fluid flow behavior in micro- and nanopores
Currently, the study of fluid states in micro- and nanopores is primarily divided into experimental research and numerical simulations (Chen et al., 2018). The microfluidic method is currently the most commonly used experimental technique for studying the flow behavior of microscale fluids. This method has been used to investigate the diffusion of macromolecular tracers and the phase transition behavior of light components in nano-slits (Zhong et al., 2017; Zhong et al., 2018). It has also been used to observe the flow behavior of single-phase water and gas-water two-phase flow in 100 nm channels, including different flow regimes such as laminar flow and annular flow (Wu et al., 2013). Additionally, it has been utilized to study the mechanism of enhanced recovery in shale reservoirs (Nguyen et al., 2018). Nuclear magnetic resonance (NMR) technology has been widely used in studies on enhanced shale oil recovery. The technology categorizes shale oil into movable and immovable oil and investigates the effects of gas drive time and maintenance pressure on drive efficiency (Zhou et al., 2019; Zhu et al., 2020). The lattice Boltzmann method (LBM) enables simulation of fluid flow within porous media and detection of the interactions of microscopic fluid particles to obtain macroscopic properties of the study object (Shan and Doolen, 1995; Zhang and Tian, 2008). Mahabadian et al. (Mahabadian and Jamialahmadi, 2012) used LBM to study mixed-phase flow in two-dimensional pores and fractures, and the simulation results agreed well with the microchannel experiments of Ahdari et al. (Ajdari et al., 2006). The available LBM simulations predominantly study single-phase flow and non-mixed-phase drives, which are in good agreement with the experimental results.
3 Advances in molecular dynamics modeling in shale oils
3.1 Molecular dynamics simulation
3.1.1 Fundamentals of molecular dynamics simulations
The molecular dynamics simulation method is based on physical principles such as Newtonian mechanics and quantum mechanics, and simulates the kinetic behavior of molecules under given conditions by calculating the interaction forces between molecules and the trajectories of molecular motion (Alder and Wainwright, 1957). In molecular dynamics simulations, matter is viewed as basic units composed of atoms, and the kinetic properties of matter are explored by simulating the changes in these basic units over time. Molecular dynamics simulations play an important role in the fields of materials, physics, chemistry, biology, and the environment. In the molecular dynamics simulation study of the kinetic characteristics of shale oil, generally with the help of software for modeling and data analysis, now the commonly used software are LAMMPS, Materials Studio, GROMACS, VASP and so on.
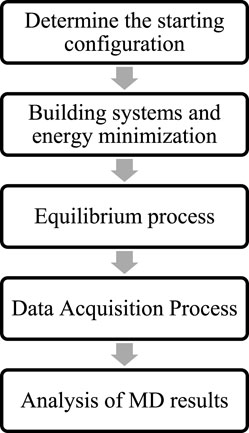
In molecular dynamics simulations of fluids within nanopores, most studies focus on fugacity, diffusion, and transport. Short-range molecular interactions are typically described using the Lennard-Jones potential, while long-range electrostatic forces are often calculated using the Coulomb potential or the PPPM method. The entire system is subject to periodic boundary conditions, and cutoff distances are used to eliminate the influence of periodic atoms on the system. The cutoff distance is usually not greater than half of the simulation box. The entire system is maintained electrically neutral. The temperature and pressure of the system are regulated by a Nose-Hoover thermostat and a Parrinello-Rahman pressure regulator. The specific simulation process is shown in Figure 1.
3.1.2 Molecular composition and force field description of shale
As shown in Figure 2, the mineral composition of shale reservoir is complex and has strong heterogeneity. It not only contains abundant organic matter, but also a large number of inorganic minerals, including quartz, feldspar, calcite, dolomite and some clay minerals (Clarkson et al., 2013). The organic fraction accounts for 5% of the total shale fraction, and the organic matter pore seams have very high porosity and specific surface area, which is an important part of the reservoir space, while the inorganic fractions with the highest percentage in the shale reservoir are mainly quartz and clay minerals.
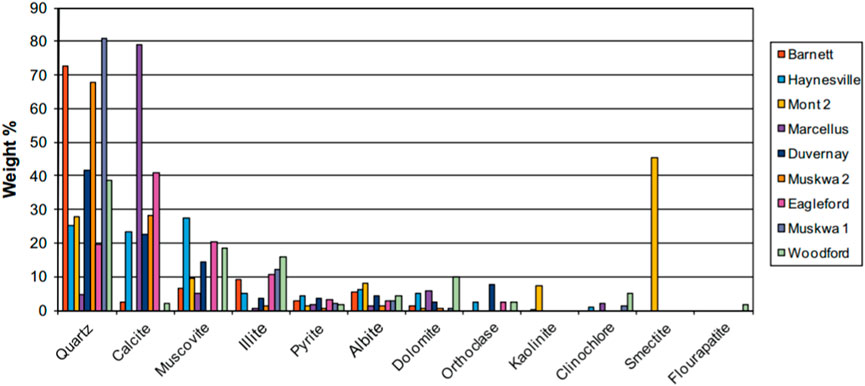
Figure 2. Comparison of mineralogical composition of the shale samples based on XRD analysis (Clarkson et al., 2013).
In molecular dynamics simulation studies related to shale oil, it is crucial to study kerogen as it is the primary source of shale oil. Kerogen is chemically and physically heterogeneous (Rexer et al., 2014; Yang et al., 2021), and its physicochemical properties depend on its genesis and depositional environment (Sui and Yao, 2016). According to the H/C versus O/C diagrams, kerogen is classified into three types: I, II, and III (Hutton et al., 1994). Type I kerogen typically has an H/C atomic ratio greater than 1.5 and an O/C atomic ratio less than 0.1. It is primarily derived from algal material lipids. Type II kerogen typically has an H/C atomic ratio ranging from 1.0 to 1.3, while the O/C atomic ratio is usually around 0.15. This type of kerogen can produce both oil and gas. In contrast, Type III kerogens are typically only suitable for shale gas production. The pores in the kerogen matrix are classified as micropores (pore size <2 nm) and mesopores (2 nm < pore size <50 nm). A small percentage of the micropores are isolated, while the mesopores are connected in all directions within the matrix (Perez and Devegowda, 2019). As the organic matter fractions of shale samples differ in each region, the elemental ratios and functional groups of the kerogen models in molecular dynamics simulations also vary. Ungerer et al. (Ungerer et al., 2015) used molecular dynamics simulations to study a representative set of kerogen, based on previous elemental and functional group analyses. The simulated density results were in good agreement with experimental results and showed reasonable thermodynamic and bulk properties. This kerogen model has since been applied to the adsorption and diffusion of fluids in kerogen, as well as kerogen swelling studies (Atmani et al., 2017; Pathak et al., 2017; Pang et al., 2019; Takbiri-Borujeni et al., 2019). Li et al. (Li and Sun, 2022) and Firoozabadi et al. (Tesson and Firoozabadi, 2018; Tesson and Firoozabadi, 2019) have shown that the flexible nature of kerogen impacts the competing adsorption of fluids in the pore space.
Existing molecular dynamics simulation studies usually use single mineral crystals to compose the rock surface in order to simplify the model and shorten the computation time, such as using graphene or carbon nanotubes instead of complex organic reservoir structures (Wang et al., 2015a; Wang et al., 2015b), and simple quartz pore walls instead of actual complex hydrophilic nanopore walls. Figure 3 lists some of the common modeled structures of organic and inorganic shale reservoirs.
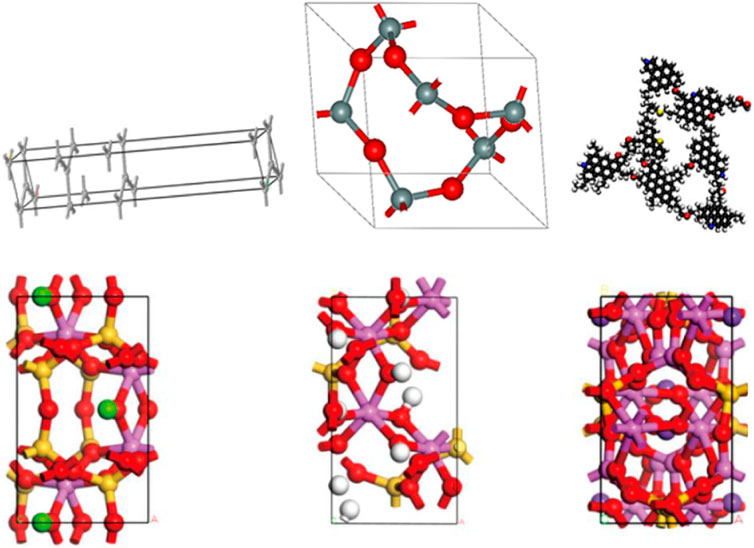
Figure 3. Modeled structures of common organic and inorganic shale reservoirs (from left to right and top to bottom, graphene, quartz (Yang et al., 2017), kerogen (Yang et al., 2020b), montmorillonite, kaolinite, illite (Cao et al., 2021).
Force field in molecular dynamics simulation is a mathematical model used to describe the intermolecular interactions and is an important concept in molecular dynamics simulation (Ul Samad et al., 2022). The choice of force field is related to the success of molecular dynamics simulation and the reliability of the simulated results, and different force fields have different scope of application as well as defects. Fluid molecules in nanopores receive different kinds of interaction forces, among which the short-range van der Waals force obtainable by the Lennard-Jones (LJ) 12-6 potential and the long-range electrostatic force obtainable by the Coulomb potential are the most common, and the potential function of the combination of the two can be expressed as (Lange et al., 2016; Hong et al., 2022):
where
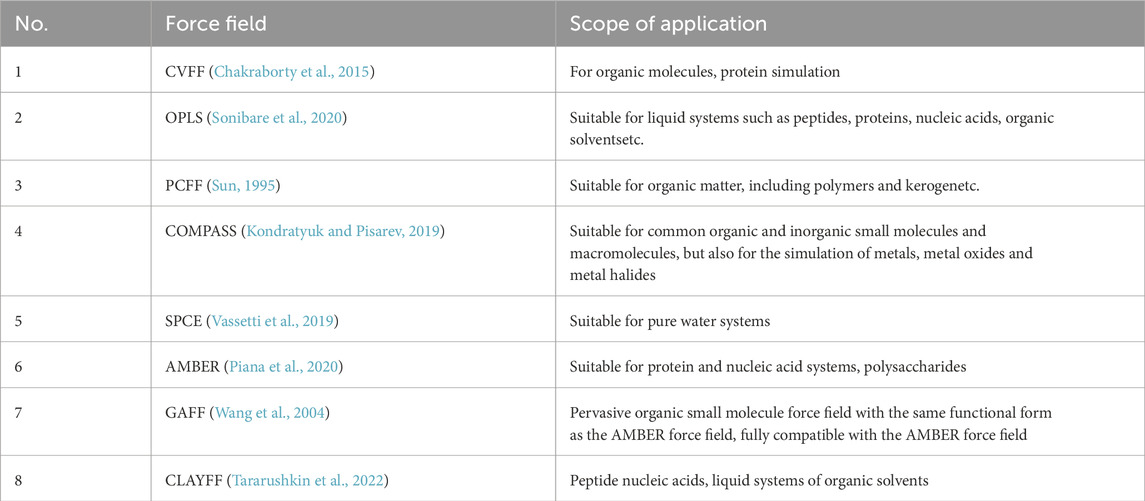
Table 1 shows some common force fields and their range of application. CVFF (consistent valence force field) can be well applied to the simulation of organic molecules, the disadvantage is that its formula is extremely complicated. PCFF (polymer consistent force field) can also calculate the properties of organic matter, such as polymers and kerogen, etc. COMPASS (condensed-phase optimized molecular potential for atomic simulation studies force field) is the second generation of consistent force field with improved parameters based on PCFF. COMPASS shows better predictions compared to other force fields (Moradi et al., 2023). Chemical reactions are often involved in simulation studies for kerogen, but none of the above mentioned force fields can describe the chemical reactions. Van Duin et al. developed ReaxFF (Reactive force field) in order to enable molecular dynamics simulations of large-scale reactive chemical systems, which can describe the stability and geometry of conjugated, non-conjugated, and free radical-containing compounds, and can be used to characterize the dissociation and formation of compounds in hydrocarbons (Van Duin et al., 2001). In the flow characterization of shale oil and in the drive-off studies, the commonly used force fields for hydrocarbons are OPLS, and for CO2 are EPM2, TraPPE, and Zhang. If the transport properties of pure CO2 are studied, Zhang is the force field with the best overall performance. TraPPE improves the parameters based on Zhang. EPM2 improves on the rigid EPM force field, and the EPM force field calculates a rigid EPM force field that has the best overall performance. Improvements were made to the EPM force field to calculate a slightly higher critical value compared to the experimental value. Jonathan introduced a flexible bond angle energy, which can more accurately predict the coexistence curves of the gas-liquid two-phase.
3.1.3 Calculation of relevant physical parameters
Molecular dynamics simulation can visualize the distribution characteristics and kinetic properties of shale oil in the reservoir, and the main physical characterization parameters are interaction energy, density distribution, radial distribution function, mean square displacement, diffusion coefficient and so on. The following is a detailed introduction and example application of each physical characterization parameter.
3.1.3.1 Interaction energy
For pores with different mineral properties and different wettability, there are differences in the interaction force between the fluid and the wall (Thomas et al., 2010). The ability of pore walls to adsorb fluid is characterized in terms of interaction energy, which is given by (Xu et al., 2011; Zhong et al., 2013):
Where
Figure 4 shows the cohesive energy between crude oil molecules and the interaction energy between crude oil and pores in pores with different mineral properties (Zhang and Guo, 2021). It can be observed that the cohesive energy of each system gradually weakened during the process of crude oil being compressed into the pores, so the cohesive energy is not the main factor preventing the flow of crude oil in the nanopores, and the initial cohesive energy of calcite pores is the lowest (Figure 4A), which is affected by the interaction between crude oil and pore walls, and the interaction energy between crude oil and calcite is the strongest at the beginning of the simulation (Figure 4B), The stronger attraction disrupts the adhesion between crude oil molecules. The interaction between crude oil and the wall surface increases with simulation time, and the final order of crude oil-pore interaction energies for different systems is kaolinite (0 0–1) > calcite > kaolinite (0 0 1) > quartz (Figure 4B).
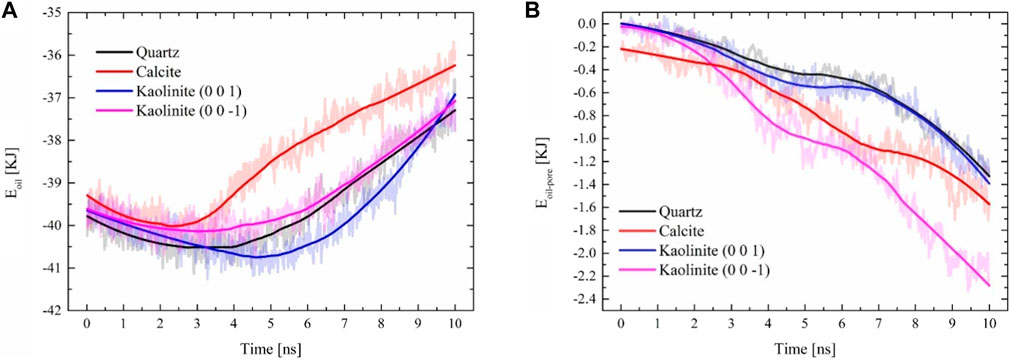
Figure 4. Interaction energy changes during crude oil migration: (A) cohesive energy during crude oil migration; (B) interaction energy between crude oil and the wall (Zhang and Guo, 2021).
3.1.3.2 Density distribution
The density distribution is one of the most important properties in the resultant information from molecular dynamics simulations. It is difficult to provide interfacial densities on the nanoscale experimentally, and molecular dynamics simulations can fill this gap. The density distribution in molecular dynamics simulations is usually distributed by dividing a specified area, and the average density of crude oil molecules in the nth cell from time step JN to JM along the z-direction, which divides the entire shale pore space into multiple cells of equal volume, is (Li et al., 2010):
where z is the normal direction of flow; J is the time step; zi is the coordinate of the midpoint of the nth cell; and A is the area of the XY surface.
The component of shale oil is complex, containing a large number of alkanes, aromatic hydrocarbons, and various compounds, among which the content of aromatic hydrocarbons is larger than that of conventional oil and gas reservoirs (Hunt and Jamieso, 1956; Hunt, 1961). In molecular dynamics simulations, shale oil is usually replaced by a single component, such as liquid alkanes such as n-pentane or n-octane. The hydrocarbon molecules are not uniformly distributed in the nanopores, forming multiple adsorption layers, which are characterized by periodic distribution and symmetry at the interface of the pore center (Figure 5) (Chilukoti et al., 2014; Wang et al., 2015b; Le et al., 2015; Zhang et al., 2022). While the increase in pressure gradient increases the overall fluid flow rate within the pores, which enhances the mutual collision between hydrocarbon molecules, some adsorbed layer molecules are desorbed down from the pore wall, resulting in a decrease in the peak density of the adsorbed layer, and the increase in the number of hydrocarbon molecules in the bulk phase further strengthens the fluid flow ability.
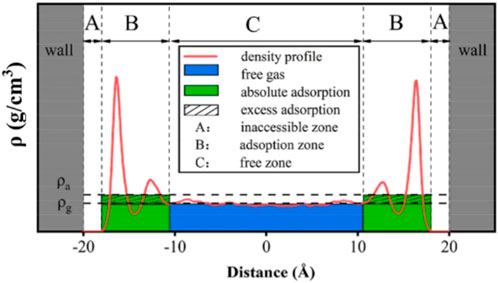
Figure 5. Density distribution curve of methane in graphite slit (Zhang et al., 2022).
3.1.3.3 Radial distribution function
The radial distribution function (RDF) can be used to characterize the spatial distribution of oil and gas molecules in the model, describing how the density varies with distance from the central particle, with the value of the ratio of the local density to the overall density. The RDF is defined by the following equation:
Where
The position of the RDF peak is very important in molecular dynamics simulation studies, which can reflect many problems. The peak of RDF is less than or equal to 3.5 Å, which indicates that there are chemical or hydrogen bonding interactions between the other atoms and the reference atoms; if the peak is greater than 3.5 Å, it indicates that van der Waals and electrostatic forces play a dominant role in the system (Chen et al., 2021). Figure 6 shows the RDF distributions of dodecane-dodecane and dodecane-CO2 RDF distributions, revealing their changes during the separation process (Fang et al., 2017). During the degreasing process the dodecanes move away from each other and dissolve in CO2. The shortest time for the system to reach equilibrium was observed when the temperature was 343 K, indicating that CO2 molecules at this temperature are more effective in swelling the oil film. From the RDF distributions at 4,000 ps in Figures 6A–C, it can be seen that the RDF peaks at 303 K and 383 K are significantly higher than those at 343 K. This implies that the average distances between dodecane molecules are smaller than those at 343 K at 303 K and 383 K. The main reason for this is that the dodecane molecules that are adsorbed are compactly structured at 383 K, whereas the dodecane molecules are entangled with each other at 303 K to form dodecane clusters, and these aggregated dodecane molecules have compact structures and small average distances.
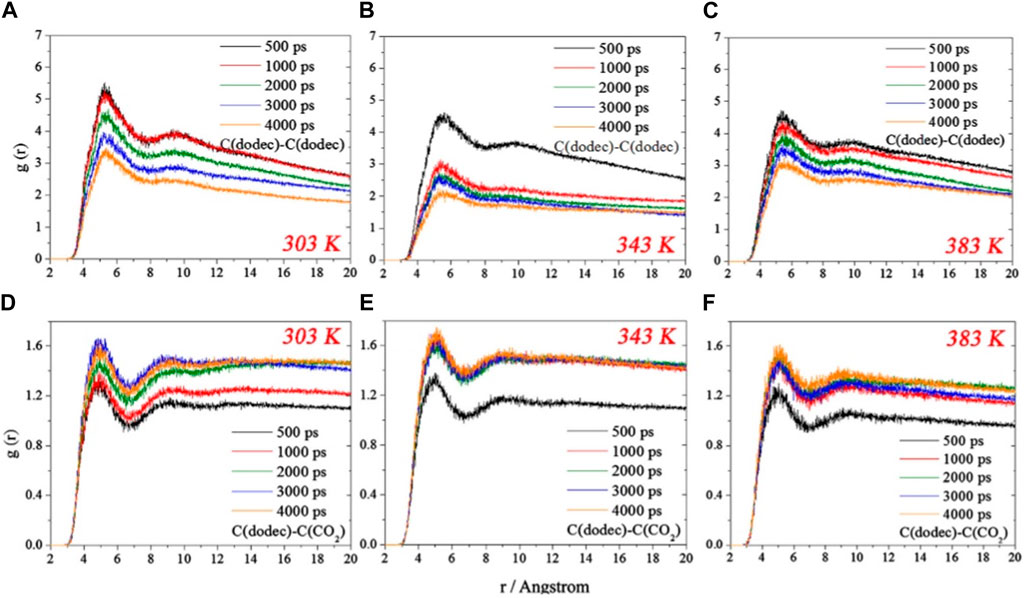
Figure 6. RDF profiles of C (dodec)-C (dodec) for (A) 303 K, (B) 343 K and (C) 383 K, C (dodec)-C(CO2) for (D) 303 K, (E) 343 K and (F) 383 K (Fang et al., 2017).
3.1.3.4 Mean square displacement, diffusion coefficient
Both the mean square displacement and the diffusion coefficient are capable of reflecting the state of motion of the particles in the system and characterizing the diffusion capacity of the molecules in the system. The defining equation for MSD is derived from Einstein’s equation (Cao et al., 2003; Kumar et al., 2005; Han et al., 2008; Chen et al., 2015):
Where
where N is the number of system particles and n is the number of simulation steps.
When the system is a liquid,
where D is the diffusion constant. Thus when the time is long enough, the slope of the MSD versus time curve is 6D.
The mean square displacement and diffusion coefficient reflect the intensity of the movement of hydrocarbon molecules on the pore surface. The mineral type has a significant effect on the fluid movement behavior in the pore space, as shown in Figure 7A, the diffusion coefficient of n-octane in clay minerals has a value of 10–9 m2/s, which verifies the results of molecular dynamics simulation done by Wang et al. (Wang H. et al., 2016). For the same pore size, the diffusion coefficient of n-octane in the clay mineral pores is smaller than that in the quartz pores, indicating that the interaction between n-octane and the clay mineral is stronger, which restricts the diffusion motion of n-octane. The diffusion coefficient of n-octane in graphene slits is much larger than that of clay minerals and quartz surfaces, which contradicts the strong interaction between alkanes and organic surfaces, and based on previous studies, the main reason is that the graphene surfaces are very smooth, which allows hydrocarbon molecules to have a high flow rate (Skoulidas et al., 2002). The diffusion ability of different oil components also varies, as shown in Figure 7B, the longer the chain length, the greater the intermolecular interaction and the weaker the diffusion ability. The diffusion coefficients of alkanes increase with increasing temperature, and the diffusion coefficients of n-hexane and n-octane rise faster than those of decane and dodecane, indicating that the temperature has a greater effect on the diffusion ability of short-chain alkanes.
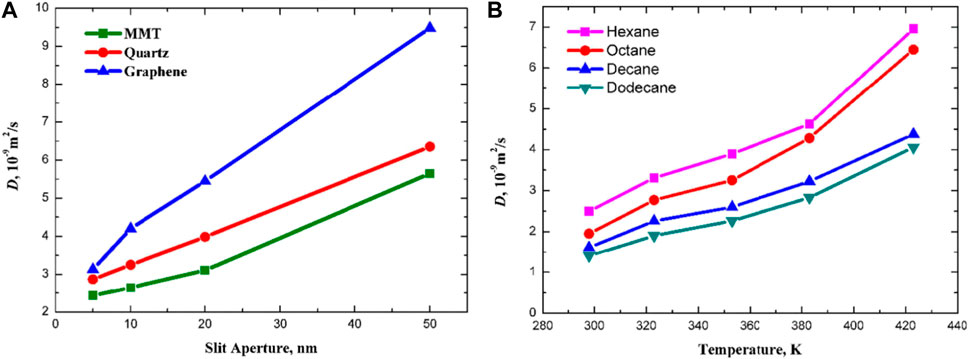
Figure 7. (A) Diffusion coefficients of n-octane in slits composed of different mineral fractions; (B) Diffusion coefficients of various alkanes in shale (Zhang et al., 2019).
3.2 Application of molecular dynamics simulation to shale oil flow characterization and CO2 gas injection development
3.2.1 Molecular dynamics simulation of shale oil flow characteristics
The study utilized the nonequilibrium molecular dynamics approach to analyze fluid dynamics behavior and evaluate the relevance of this approach in describing flow under pressure gradient conditions by a continuous hydrodynamic model (Boţan et al., 2011; Zhang, 2016). Inorganic nanoporous materials, such as calcite, quartz, and clay, are commonly used in the study of fluid motion behavior (Zhang and Guo, 2021; Xu et al., 2022). Organic matter materials, such as graphene, carbon nanotubes, and kerogen, are also utilized. The kerogen matrix is known for its flexibility, which accurately describes fluid behavior in the kerogen cracks. The simulation may include various pore morphologies, such as slits, twisted channels, and circular nanopores (Perez and Devegowda, 2020; Dong et al., 2022; Liu et al., 2022; Xu et al., 2023). It is important to note that the choice of morphology depends on the specific needs of the simulation (Zhang et al., 2020).
The concept of nanofluid was first proposed by Choi and Eastman in 1995, and the fluid transportation properties in nanopores are different from those in conventional pores (Choi and Eastman, 1995). There are many microscale effects in micro and nano scale fluids, such as low Reynolds number effect, molecular force effect, double-layer electric effect, and interfacial slip phenomenon, etc., among which interfacial slip phenomenon has a great influence on flow prediction. The existence of these phenomena makes the flow characteristics of nanoscale fluids in micro and nanopores no longer conform to the Navier-Stokes (N-S) equations. Molecular dynamics simulations are widely used to study fluid flow behavior in individual shale nanopores. Wang et al. (Wang et al., 2016b; Wang et al., 2016c; Wang et al., 2016d) investigated the flow of n-octane in quartz, montmorillonite, calcite, and graphene nanopores and found that organic surfaces are more attractive to hydrocarbon molecules, resulting in a stronger tendency for hydrocarbon molecules to adsorb on the organic surfaces, which causes the organic pore fluid Velocity reduction. Molecular dynamics studies show that the velocity distribution of hydrocarbon molecules in the graphene slits is not the traditional hydrodynamic parabolic distribution, but presents a plug flow, which indicates that the fluid is very fast on the graphene surface, mainly due to the fact that the surface of graphene is very smooth, which results in an extremely strong slip effect. The slip length is defined as the distance between the slip boundary and the position where the extrapolated velocity is zero (Figure 8) (Neto et al., 2005; Kannam et al., 2011). If the boundary slip phenomenon and viscosity correction are ignored, the estimated total flow will produce a great error (Majumder et al., 2005; Holt et al., 2006). Meanwhile, Wang et al. (Wang et al., 2016b) also found that the well-known Klinkenberg effect fails to characterize the transport properties of light hydrocarbons in calcite nanoporous materials, and the transport rate is slower than that predicted by the Hagen-Poiseuille equation, which contradicts with the piston flow between the graphene sheets and the slight enhancement in the quartz slit (Figure 9), which is mainly due to the fact that calcite has a strong attraction, the crude oil near the wall will form a solid-like layer, and the pore surface is relatively rough, the friction during fluid flow is high, resulting in the phenomenon of no slip or even negative slip, which indicates that the roughness of the wall affects the velocity of hydrocarbon molecules, and Yu et al. (Yu et al., 2020b) verified this conclusion in their subsequent study.
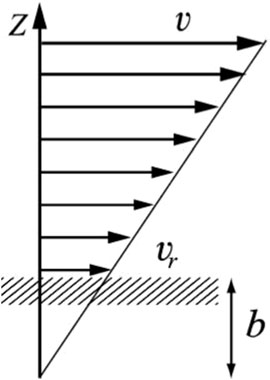
Figure 8. Slip phenomenon of fluid in nanopores (b is the slip length) (Neto et al., 2005).
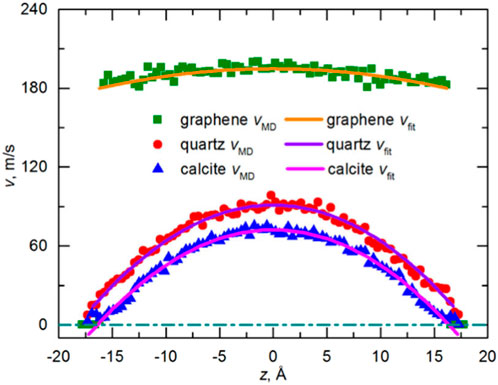
Figure 9. Comparison of velocity profiles for CH4 transport in graphene, quartz, and calcite nanopores (Karniadakis et al., 2006; Wang et al., 2016b).
Numerous molecular dynamics simulation studies conducted by previous authors have summarized that the fluid viscosity under extreme constraints has a large difference relative to the bulk-phase fluid, ranging from an increase of four orders of magnitude to a decrease of three orders of magnitude (Granick, 1991; Chen et al., 2008); the pore walls produce slip phenomena as well as adhesion effects (Feng et al., 2018), and these changes cause the fluid to no longer flow according to the flow velocity predicted by the conventional Poiseuille equation (Jiang et al., 2017). Wu et al. (Wu et al., 2017; Wu et al., 2019) proposed a model for pressurized water flow based on the concept of effective slip, the results of which agreed with most of the 53 experiments summarized as well as molecular dynamics simulation studies, quantitatively explaining the controversy about the increase or decrease of flow rate in experiments and molecular dynamics simulations, and later found that the velocity distributions and the flow rate of n-alkanes in the nanoslit were affected by the wall surface of the nanopore interfacial resistance of the nearby first adsorption layer and the mutual attraction of other n-alkanes in the pores, resulting in a correction to the Poiseuille equation.
These single-phase and multiphase flow models in the extreme confined space have laid the foundation for the development of shale oil, but they also lead to many problems, such as how to judge the slip boundary, whether the same law exists for single-component hydrocarbons and multicomponent hydrocarbons and so on, which are yet to be investigated by more in-depth theoretical studies, so as to provide the theoretical basis for the shale oil enhancement of the recovery in the future.
3.2.2 Molecular dynamics simulation of CO2 injection to enhance oil recovery in shale reservoirs
The process of CO2 drive behavior in shale reservoirs is quite different from conventional reservoirs (Luo et al., 2015; Rahmani and Akkutlu, 2015). Nanopores have a great influence on the distribution of each component in the reservoir, with large physical changes, and affect the CO2 drive process (Teklu et al., 2014). Whether CO2 and crude oil can realize miscibility depends on whether the drive pressure is higher than the minimum miscibility pressure, and the influencing factors of the minimum miscibility pressure include the purity of CO2, the temperature, and the crude oil components and so on. Among them, the reservoir temperature and crude oil composition have the greatest influence. The lower the reservoir temperature is, the more light hydrocarbon components in crude oil are, and the easier it is for CO2 to miscible with crude oil (Wang et al., 2021).
CO2 exhibits different properties under different temperature and pressure conditions, which affects the interaction with crude oil and walls. The bond angle of CO2 at room temperature and pressure is 180°, and changes in temperature and pressure can lead to changes in the bond angle, which prevents the centers of positive and negative charges from overlapping, leading to localized intermolecular aggregation (Zhu et al., 2009). However, the change of CO2 bond angle with temperature and pressure has uncertainty, which also increases the uncertainty of molecular action, which is characterized by the uneven distribution of density. And the CO2 in the micro and nanopores has a strong entrance effect, and there is an obvious pressure difference at the entrance of the pore channel, and this effect is greatly affected by the temperature and pressure, which makes the CO2 pile up at the entrance of the pore channel, and it is difficult to enter the pore channel, as shown in Figure 10, and it has a great influence on the CO2 flooding process (Kirchofer et al., 2017).
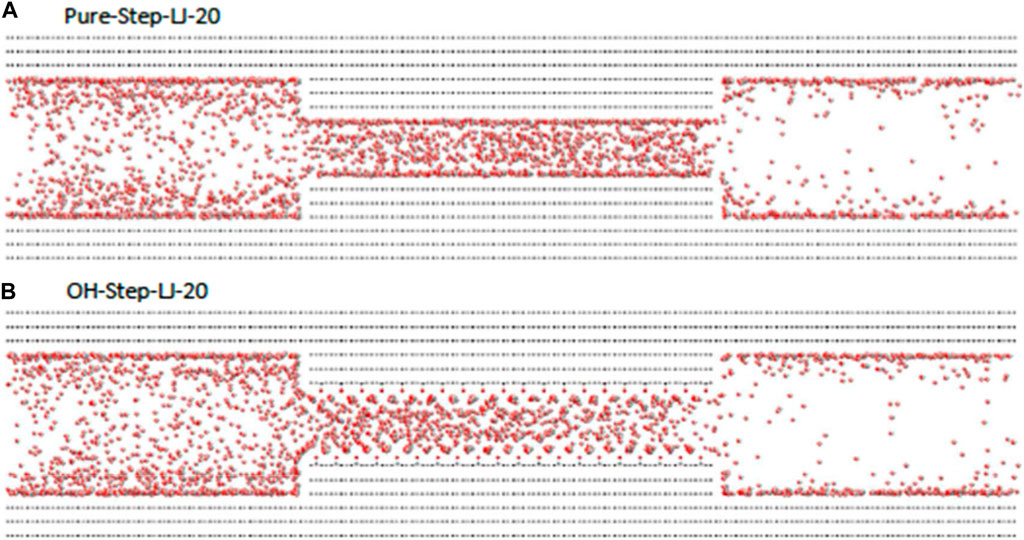
Figure 10. Entrance effect of CO2 in micro and nanopores (Kirchofer et al., 2017). (A) Pure–Step–LJ–20 and (B) OH–Step–LJ–20.
CO2 is in a supercritical state when the temperature and pressure exceed 31°C and 7.1 MPa, respectively (Riazi et al., 2011). Supercritical CO2 dissolved in crude oil causes crude oil expansion, which reduces the viscosity of crude oil, improves the fluidity, and obtains higher crude oil recovery. As shown in Figure 11, the molecular dynamics simulation divides the process of CO2 interaction with crude oil into three stages (Liu et al., 2017; Baek and Yucel Akkutlu, 2019; Wang R. et al., 2022; Guo et al., 2022): (1) CO2 dissolution and diffusion stage: CO2 enters the pore space, overcomes the dispersion force between hydrocarbon molecules and dissolves into the crude oil, causing the volume of the crude oil to expand, and some of the crude oil molecules are extracted into the CO2 molecules, which weakens the interaction between the crude oil molecules and the pore walls; (2) Competitive adsorption stage. CO2 molecules continuously extract crude oil molecules and approach the pore wall, and the interaction with the wall is further strengthened, and the interaction between CO2 and the pore wall is stronger than that of crude oil, which can displace the crude oil in the adsorption layer; (3) CO2 sequestration, oil film push off stage. CO2 will strip the crude oil from the pore wall, gradually occupy the pore wall, and push the displaced crude oil molecules further away from the wall, the interaction force between CO2 and the wall is much larger than that between the crude oil and the wall. In the actual replacement process, the shale reservoir has complex components, containing colloid, asphalt and other components unfavorable to the extraction of crude oil, resulting in a slightly difficult replacement of CO2 to crude oil.
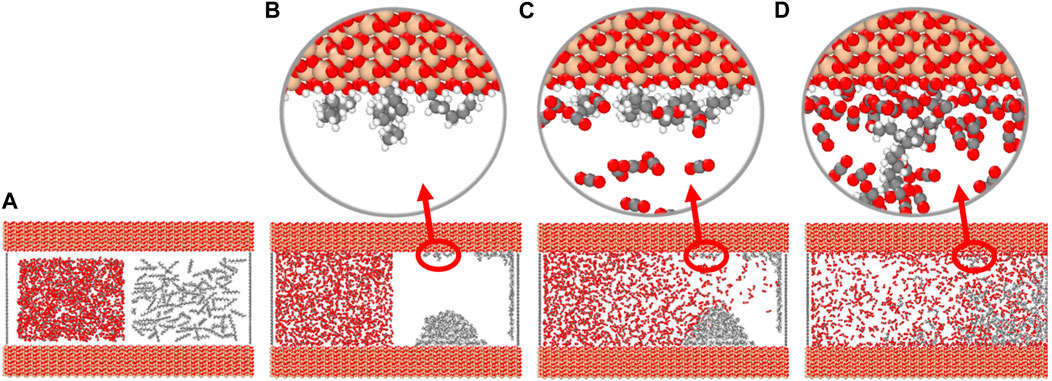
Figure 11. Competitive adsorption process of CO2 and crude oil. (A) Initial model of competitive adsorption of CO2 and crude oil in nanopores (left: CO2, right: n-octane); (B) Adsorption of crude oil molecules on the pore walls; (C) CO2 dissolved and diffused in crude oil; (D) CO2 molecules displacing crude oil molecules adsorbed on the pore wall.
The interaction between CO2 and shale oil is affected by various factors such as temperature, CO2 content ratio, pore structure, etc. Fang et al. (Atmani et al., 2017) investigated the de-oiling process of CO2 in oil repelling at different temperatures, and found that there existed two modes of stripping, one is the overall stripping at low temperatures, and the other one is layer-by-layer stripping at high temperatures, and the stripping effect is the best when the temperature of the medium is 343 K. Pu et al. (Pu et al., 2018) used molecular dynamics simulations to evaluate the replacement efficiency and molecular orientation of n-octane in quartz nanoseams at different CO2 injection rates. After CO2 injection, it was found that the adsorbed n-octane molecules were driven away from the surface by the injected CO2, and the orientation of n-octane became more irregular, suggesting CO2 injection could increase the oil recovery rate and weaken the interaction between the two. Wang et al. (Wang L. et al., 2022) investigated the effect of CO2 in oil repelling in wedge-shaped pores. The oil repelling effect of CO2 in wedge-shaped pores, constructed single and double pores of the wedge, and found that the wider entrance and exit of both single and double pores had higher oil repelling velocity and easier phase mixing, and the exit of the wedge-shaped pores had a greater effect on CO2 oil repelling than the entrance.
Through the molecular dynamics simulation method of CO2, we can clarify the diffusion and mass transfer law of CO2 in the micro and nanoscale pores of shale reservoirs, and put forward the new method of shale oil development in a targeted way.
4 Conclusion
The development of shale oil presents significant challenges due to the complex and non-homogeneous structure of shale reservoirs. The fluid flow characteristics in these reservoirs differ greatly from macroscopic dimensions. Compared with experimental-based research, molecular dynamics simulation technology has a unique advantage in the field of unconventional oil and gas, using the powerful computational ability of computers and image display capabilities, without the restriction of experimental conditions, to construct micro and nanopores close to the actual reservoir, simulate the high temperature and high pressure environment, simulate the molecular structure and dynamics of the molecular behavior from the molecular scale, the simulation cost is low, and the results can be visualized, which can be used to supplement experimental research. This paper reviews the methods of fluid flow behavior in confined nanopores, the basic principles of molecular dynamics simulation, and the relevant physical parameters. On this basis, the application of molecular dynamics simulation in shale oil flow characterization and gas injection is described. Conclusions and outlook are given:
(1) Experimental studies of fluid flow behavior in nanopores require high instrument accuracy and long testing time. Molecular dynamics simulation is widely used in shale oil research to simulate various unconventional geological conditions. The choice of force field directly affects the final simulation results. The state of the fluid in the nanopore can be analyzed using physical parameters such as interaction energy, density distribution, radial distribution function, mean square displacement, and diffusion coefficient.
(2) Ignoring the slippage phenomenon and viscosity correction can result in a significant error between the estimated total flow rate and the actual rate in the nanopore fluid. The CO2 oil drive mechanism is primarily controlled by the pressure gradient and competitive adsorption. CO2 molecules are more readily adsorbed on the wall than alkane molecules, and the inlet effect of CO2 in the nanopore makes it challenging for it to enter the pore space.
(3) Molecular dynamics simulation research has made considerable progress, but there are obvious shortcomings, such as molecular dynamics simulation to build the system is idealized, only for single-factor analysis, the actual geological conditions are very complex and variable, the need to fit the physical experimental results and field reports to ensure that the simulation results of the authenticity and reliability. Molecular dynamics simulation is mostly applied to the microscopic scale in shale oil research, which is the advantage of molecular dynamics simulation, but in the subsequent research, we should consider how to transfer the results of molecular dynamics simulation to mesoscopic or even macroscopic scales to realize cross-scale research. When applied to oil and gas systems of larger sizes, the computational efficiency is low, and large-scale calculations cannot be carried out in a shorter time, and the combination of molecular dynamics simulation and machine learning should be considered to improve the computational efficiency.
Author contributions
XH: Conceptualization, Data curation, Formal Analysis, Investigation, Methodology, Software, Validation, Visualization, Writing–original draft, Writing–review and editing. XY: Data curation, Formal Analysis, Investigation, Methodology, Visualization, Writing–original draft, Writing–review and editing. XL: Data curation, Investigation, Writing–original draft, Writing–review and editing. HW: Writing–original draft, Writing–review and editing. DH: Conceptualization, Data curation, Formal Analysis, Investigation, Methodology, Project administration, Resources, Supervision, Visualization, Writing–original draft, Writing–review and editing. WL: Conceptualization, Data curation, Formal Analysis, Funding acquisition, Investigation, Methodology, Project administration, Supervision, Validation, Writing–original draft, Writing–review and editing.
Funding
The author(s) declare that financial support was received for the research, authorship, and/or publication of this article. This work is funded by the CNPC Innovation Found (2022DQ02-0102).
Conflict of interest
Author XY was employed by CNOOC Research Institute Ltd. Author XL was employed by China National Logging Corporation. Author HW was employed by Changqing Oil and Gas Branch Company.
The remaining authors declare that the research was conducted in the absence of any commercial or financial relationships that could be construed as a potential conflict of interest.
Publisher’s note
All claims expressed in this article are solely those of the authors and do not necessarily represent those of their affiliated organizations, or those of the publisher, the editors and the reviewers. Any product that may be evaluated in this article, or claim that may be made by its manufacturer, is not guaranteed or endorsed by the publisher.
References
Ajdari, A., Bontoux, N., and Stone, H. A. (2006). Hydrodynamic dispersion in shallow microchannels: the effect of cross-sectional shape. Anal. Chem. 78, 387–392. doi:10.1021/ac0508651
Alder, B. J., and Wainwright, T. E. (1957). Phase transition for a hard sphere system. J. Chem. Phys. 27, 1208–1209. doi:10.1063/1.1743957
Atmani, L., Bichara, C., Pellenq, R. J. M., Van Damme, H., Van Duin, A. C. T., Raza, Z., et al. (2017). From cellulose to kerogen: molecular simulation of a geological process. Chem. Sci. 8, 8325–8335. doi:10.1039/C7SC03466K
Baek, S., and Yucel Akkutlu, I. (2019). CO2 stripping of kerogen condensates in source rocks. SPE J. 24, 1415–1434. doi:10.2118/190821-PA
Boţan, A., Rotenberg, B., Marry, V., Turq, P., and Noetinger, B. (2011). Hydrodynamics in clay nanopores. J. Phys. Chem. C 115, 16109–16115. doi:10.1021/jp204772c
Cao, D., Zhang, X., Chen, J., and Yun, J. (2003). Local diffusion coefficient of supercritical methane in activated carbon by molecular simulation. Carbon 41, 2686–2689. doi:10.1016/S0008-6223(03)00383-X
Cao, Z., Jiang, H., Zeng, J., Saibi, H., Lu, T., Xie, X., et al. (2021). Nanoscale liquid hydrocarbon adsorption on clay minerals: a molecular dynamics simulation of shale oils. Chem. Eng. J. 420, 127578. doi:10.1016/j.cej.2020.127578
Chakraborty, T., Hens, A., Kulashrestha, S., Chandra Murmu, N., and Banerjee, P. (2015). Calculation of diffusion coefficient of long chain molecules using molecular dynamics. Phys. E Low-Dimensional Syst. Nanostructures 69, 371–377. doi:10.1016/j.physe.2015.01.008
Chen, M., Kang, Y., Zhang, T., You, L., Li, X., Chen, Z., et al. (2018). Methane diffusion in shales with multiple pore sizes at supercritical conditions. Chem. Eng. J. 334, 1455–1465. doi:10.1016/j.cej.2017.11.082
Chen, M., Lu, X., Liu, X., Hou, Q., Zhu, Y., and Zhou, H. (2015). Slow dynamics of water confined in Newton black films. Phys. Chem. Chem. Phys. 17, 19183–19193. doi:10.1039/C5CP02908B
Chen, S., Li, H., Yang, D., and Tontiwachwuthikul, P. (2010). Optimal parametric design for water-alternating-gas (WAG) process in a CO2-miscible flooding reservoir. J. Can. Petroleum Technol. 49, 75–82. doi:10.2118/141650-PA
Chen, X., Cao, G., Han, A., Punyamurtula, V. K., Liu, L., Culligan, P. J., et al. (2008). Nanoscale fluid transport: size and rate effects. Nano Lett. 8, 2988–2992. doi:10.1021/nl802046b
Chen, Z., Shen, Y., Zhang, H., Dai, Y., Qu, Y., Zhu, Z., et al. (2021). Molecular interaction mechanism and performance evaluation in the liquid-liquid extraction process of ionic liquid-heptane-tertiary butanol based on molecular dynamics. J. Mol. Liq. 340, 116837. doi:10.1016/j.molliq.2021.116837
Chilukoti, H. K., Kikugawa, G., and Ohara, T. (2014). Structure and transport properties of liquid alkanes in the vicinity of α-quartz surfaces. Int. J. Heat Mass Transf. 79, 846–857. doi:10.1016/j.ijheatmasstransfer.2014.08.089
Choi, S. U. S., and Eastman, J. A. (1995). Enhancing thermal conductivity of fluids with nanoparticles. Asme Fed. 231, 99–105.
Clarkson, C. R., Solano, N., Bustin, R. M., Bustin, A. M. M., Chalmers, G. R. L., He, L., et al. (2013). Pore structure characterization of North American shale gas reservoirs using USANS/SANS, gas adsorption, and mercury intrusion. Fuel 103, 606–616. doi:10.1016/j.fuel.2012.06.119
Dong, X., Xu, W., Liu, R., Chen, Z., Lu, N., and Guo, W. (2022). Insights into adsorption and diffusion behavior of shale oil in slit nanopores: a molecular dynamics simulation study. J. Mol. Liq. 359, 119322. doi:10.1016/j.molliq.2022.119322
Fang, T., Wang, M., Wang, C., Liu, B., Shen, Y., Dai, C., et al. (2017). Oil detachment mechanism in CO 2 flooding from silica surface: molecular dynamics simulation. Chem. Eng. Sci. 164, 17–22. doi:10.1016/j.ces.2017.01.067
Feng, D., Li, X., Wang, X., Li, J., and Zhang, X. (2018). Capillary filling under nanoconfinement: the relationship between effective viscosity and water-wall interactions. Int. J. Heat Mass Transf. 118, 900–910. doi:10.1016/j.ijheatmasstransfer.2017.11.049
Feng, Q., Xu, S., Xing, X., Zhang, W., and Wang, S. (2020). Advances and challenges in shale oil development: a critical review. Adv. Geo-Energy Res. 4, 406–418. doi:10.46690/ager.2020.04.06
Gaddipati, M., Karacaer, C., Ozgen, C., Firincioglu, T., Bowen, G., Pallister, I., et al. (2020). “Overcoming the limitations of SRV concept,” in Proceedings of the 8th Unconventional Resources Technology Conference (American Association of Petroleum Geologists).
Gao, P., Towler, B., and Jiang, H. (2010). “Feasibility investigation of CO2 miscible flooding in south slattery minnelusa reservoir, Wyoming,” in Paper presented at the SPE Western Regional Meeting, Anaheim, CA, USA (SPIE).
Granick, S. (1991). Motions and relaxations of confined liquids. Science 253, 1374–1379. doi:10.1126/science.253.5026.1374
Guo, H., Wang, Z., Wang, B., Zhang, Y., Meng, H., and Sui, H. (2022). Molecular dynamics simulations of oil recovery from dolomite slit nanopores enhanced by CO2 and N2 injection. Adv. Geo-Energy Res. 6, 306–313. doi:10.46690/ager.2022.04.05
Han, S., Kumar, P., and Stanley, H. E. (2008). Absence of a diffusion anomaly of water in the direction perpendicular to hydrophobic nanoconfining walls. Phys. Rev. E 77, 030201. doi:10.1103/PhysRevE.77.030201
Holt, J. K., Park, H. G., Wang, Y., Stadermann, M., Artyukhin, A. B., Grigoropoulos, C. P., et al. (2006). Fast mass transport through sub-2-nanometer carbon nanotubes. Science 312, 1034–1037. doi:10.1126/science.1126298
Hong, X., Yu, H., Xu, H., Wang, X., Jin, X., Wu, H., et al. (2022). Competitive adsorption of asphaltene and n-heptane on quartz surfaces and its effect on crude oil transport through nanopores. J. Mol. Liq. 359, 119312. doi:10.1016/j.molliq.2022.119312
Hunt, J. M. (1961). Distribution of hydrocarbons in sedimentary rocks. Geochimica Cosmochimica Acta 22, 37–49. doi:10.1016/0016-7037(61)90071-0
Hunt, J. M., and Jamieso, G. W. (1956). Oil and organic matter in source rocks of petroleum. Bulletin 40. doi:10.1306/5CEAE3E8-16BB-11D7-8645000102C1865D
Hutton, A., Bharati, S., and Robl, T. (1994). Chemical and petrographic classification of kerogen/macerals. Energy and Fuels 8, 1478–1488. doi:10.1021/ef00048a038
Jiang, C., Ouyang, J., Wang, L., Liu, Q., and Wang, X. (2017). Transport properties and structure of dense methane fluid in the rough nano-channels using non-equilibrium multiscale molecular dynamics simulation. Int. J. Heat Mass Transf. 110, 80–93. doi:10.1016/j.ijheatmasstransfer.2017.03.023
Kannam, S. K., Todd, B. D., Hansen, J. S., and Daivis, P. J. (2011). Slip flow in graphene nanochannels. J. Chem. Phys. 135, 144701. doi:10.1063/1.3648049
Karniadakis, G., Beskok, A., and Aluru, N. (2006). Microflows and nanoflows: fundamentals and simulation. New York: Springer Science and Business Media.
Kirchofer, A., Firouzi, M., Psarras, P., and Wilcox, J. (2017). Modeling CO 2 transport and sorption in carbon slit pores. J. Phys. Chem. C 121, 21018–21028. doi:10.1021/acs.jpcc.7b06780
Kondratyuk, N. D., and Pisarev, V. V. (2019). Calculation of viscosities of branched alkanes from 0.1 to 1000 MPa by molecular dynamics methods using COMPASS force field. Fluid Phase Equilibria 498, 151–159. doi:10.1016/j.fluid.2019.06.023
Kumar, P., Buldyrev, S. V., Starr, F. W., Giovambattista, N., and Stanley, H. E. (2005). Thermodynamics, structure, and dynamics of water confined between hydrophobic plates. Phys. Rev. E 72, 051503. doi:10.1103/PhysRevE.72.051503
Lange, J., De Souza, F. G., Nele, M., Tavares, F. W., Segtovich, I. S. V., Da Silva, G. C. Q., et al. (2016). Molecular dynamic simulation of oxaliplatin diffusion in poly(lactic acid-co -glycolic acid). Part A: parameterization and validation of the force-field CVFF: molecular dynamic simulation of oxaliplatin diffusion. Macromol. Theory Simul. 25, 45–62. doi:10.1002/mats.201500049
Le, T., Striolo, A., and Cole, D. R. (2015). Propane simulated in silica pores: adsorption isotherms, molecular structure, and mobility. Chem. Eng. Sci. 121, 292–299. doi:10.1016/j.ces.2014.08.022
Li, J., and Sun, C. (2022). How gas recovery and carbon storage capacity response to dynamic deformation of kerogen upon CO2/CH4 competitive adsorption for CCUS? Evidence from molecular dynamics. Int. J. Coal Geol. 263, 104113. doi:10.1016/j.coal.2022.104113
Li, X., Wang, S., Feng, Q., and Xue, Q. (2020). The miscible behaviors of C10H22(C7H17N)/C3H8 system: insights from molecular dynamics simulations. Fuel 279, 118445. doi:10.1016/j.fuel.2020.118445
Li, Y., Xu, J., and Li, D. (2010). Molecular dynamics simulation of nanoscale liquid flows. Microfluid Nanofluid 9, 1011–1031. doi:10.1007/s10404-010-0612-5
Liu, B., Wang, C., Zhang, J., Xiao, S., Zhang, Z., Shen, Y., et al. (2017). Displacement mechanism of oil in shale inorganic nanopores by supercritical carbon dioxide from molecular dynamics simulations. Energy fuels. 31, 738–746. doi:10.1021/acs.energyfuels.6b02377
Liu, J., Yang, Y., Sun, S., Yao, J., and Kou, J. (2022). Flow behaviors of shale oil in kerogen slit by molecular dynamics simulation. Chem. Eng. J. 434, 134682. doi:10.1016/j.cej.2022.134682
Liu, Z., Liang, Y., Wang, Q., Guo, Y., Gao, M., Wang, Z., et al. (2020). Status and progress of worldwide EOR field applications. J. Petroleum Sci. Eng. 193, 107449. doi:10.1016/j.petrol.2020.107449
Luo, S., Lutkenhaus, J. L., and Nasrabadi, H. (2015). “Experimental study of confinement effect on hydrocarbon phase behavior in nano-scale porous media using differential scanning calorimetry,” in Paper presented at the SPE Annual Technical Conference and Exhibition, Houston, Texas, USA, September 30, 2015 (SPIE), D031S043R003.
Mahabadian, M. A., and Jamialahmadi, M. (2012). The investigation of longitudinal dispersion coefficient in a miscible displacement process using multicomponent multiphase Shan-chen lattice-Boltzmann modeling. Energy Sources, Part A Recovery, Util. Environ. Eff. 34, 2268–2279. doi:10.1080/15567036.2011.563271
Majumder, M., Chopra, N., Andrews, R., and Hinds, B. J. (2005). Enhanced flow in carbon nanotubes. Nature 438, 44. doi:10.1038/438044a
Mondal, S., and De, S. (2015). CO2 based power cycle with multi-stage compression and intercooling for low temperature waste heat recovery. Energy 90, 1132–1143. doi:10.1016/j.energy.2015.06.060
Moradi, M., Azizpour, H., and Mohammarehnezhad-Rabieh, M. (2023). Determination of diffusion coefficient of C2H6 and CO2 in hydrocarbon solvents by molecular dynamics simulation. J. Mol. Liq. 370, 121015. doi:10.1016/j.molliq.2022.121015
Neto, C., Evans, D. R., Bonaccurso, E., Butt, H.-J., and Craig, V. S. J. (2005). Boundary slip in Newtonian liquids: a review of experimental studies. Rep. Prog. Phys. 68, 2859–2897. doi:10.1088/0034-4885/68/12/R05
Nguyen, P., Carey, J. W., Viswanathan, H. S., and Porter, M. (2018). Effectiveness of supercritical-CO2 and N2 huff-and-puff methods of enhanced oil recovery in shale fracture networks using microfluidic experiments. Appl. Energy 230, 160–174. doi:10.1016/j.apenergy.2018.08.098
Pang, W., He, Y., Yan, C., and Jin, Z. (2019). Tackling the challenges in the estimation of methane absolute adsorption in kerogen nanoporous media from molecular and analytical approaches. Fuel 242, 687–698. doi:10.1016/j.fuel.2019.01.059
Pathak, M., Kweon, H., Deo, M., and Huang, H. (2017). Kerogen swelling and confinement: its implication on fluid thermodynamic properties in shales. Sci. Rep. 7, 12530. doi:10.1038/s41598-017-12982-4
Perez, F., and Devegowda, D. (2019). Spatial distribution of reservoir fluids in mature kerogen using molecular simulations. Fuel 235, 448–459. doi:10.1016/j.fuel.2018.08.024
Perez, F., and Devegowda, D. (2020). A molecular dynamics study of primary production from shale organic pores. SPE J. 25, 2521–2533. doi:10.2118/201198-PA
Piana, S., Robustelli, P., Tan, D., Chen, S., and Shaw, D. E. (2020). Development of a force field for the simulation of single-chain proteins and protein–protein complexes. J. Chem. Theory Comput. 16, 2494–2507. doi:10.1021/acs.jctc.9b00251
Pu, J., Qin, X., Gou, F., Fang, W., Peng, F., Wang, R., et al. (2018). Molecular modeling of CO2 and n-octane in solubility process and α-quartz nanoslit. Energies 11, 3045. doi:10.3390/en11113045
Rahmani, B., and Akkutlu, Y. I. (2015). “Confinement effects on hydrocarbon mixture phase behavior in organic nanopore,” in Proceedings of the 3rd Unconventional Resources Technology Conference, San Antonio, Texas, USA (American Association of Petroleum Geologists).
Rexer, T. F., Mathia, E. J., Aplin, A. C., and Thomas, K. M. (2014). High-pressure methane adsorption and characterization of pores in posidonia shales and isolated kerogens. Energy fuels. 28, 2886–2901. doi:10.1021/ef402466m
Riazi, M., Jamiolahmady, M., and Sohrabi, M. (2011). Theoretical investigation of pore-scale mechanisms of carbonated water injection. J. Petroleum Sci. Eng. 75, 312–326. doi:10.1016/j.petrol.2010.11.027
Ross, D. J. K., and Marc Bustin, R. (2009). The importance of shale composition and pore structure upon gas storage potential of shale gas reservoirs. Mar. Petroleum Geol. 26, 916–927. doi:10.1016/j.marpetgeo.2008.06.004
Shan, X., and Doolen, G. (1995). Multicomponent lattice-Boltzmann model with interparticle interaction. J. Stat. Phys. 81, 379–393. doi:10.1007/BF02179985
Skoulidas, A. I., Ackerman, D. M., Johnson, J. K., and Sholl, D. S. (2002). Rapid transport of gases in carbon nanotubes. Phys. Rev. Lett. 89, 185901. doi:10.1103/PhysRevLett.89.185901
Sonibare, K., Rathnayaka, L., and Zhang, L. (2020). Comparison of CHARMM and OPLS-aa forcefield predictions for components in one model asphalt mixture. Constr. Build. Mater. 236, 117577. doi:10.1016/j.conbuildmat.2019.117577
Su, Y.-L., Xu, J.-L., Wang, W.-D., Wang, H., and Zhan, S.-Y. (2022). Relative permeability estimation of oil−water two-phase flow in shale reservoir. Petroleum Sci. 19, 1153–1164. doi:10.1016/j.petsci.2021.12.024
Sui, H., and Yao, J. (2016). Effect of surface chemistry for CH4/CO2 adsorption in kerogen: a molecular simulation study. J. Nat. Gas Sci. Eng. 31, 738–746. doi:10.1016/j.jngse.2016.03.097
Sun, H. (1995). Ab initio calculations and force field development for computer simulation of polysilanes. Macromolecules 28, 701–712. doi:10.1021/ma00107a006
Takbiri-Borujeni, A., Fathi, E., Kazemi, M., and Belyadi, F. (2019). An integrated multiscale model for gas storage and transport in shale reservoirs. Fuel 237, 1228–1243. doi:10.1016/j.fuel.2018.10.037
Tararushkin, E. V., Pisarev, V. V., and Kalinichev, A. G. (2022). Atomistic simulations of ettringite and its aqueous interfaces: structure and properties revisited with the modified ClayFF force field. Cem. Concr. Res. 156, 106759. doi:10.1016/j.cemconres.2022.106759
Teklu, T. W., Alharthy, N., Kazemi, H., Yin, X., Graves, R. M., and AlSumaiti, A. M. (2014). Phase behavior and minimum miscibility pressure in nanopores. SPE Reserv. Eval. Eng. 17, 396–403. doi:10.2118/168865-PA
Tesson, S., and Firoozabadi, A. (2018). Methane adsorption and self-diffusion in shale kerogen and slit nanopores by molecular simulations. J. Phys. Chem. C 122, 23528–23542. doi:10.1021/acs.jpcc.8b07123
Tesson, S., and Firoozabadi, A. (2019). Deformation and swelling of kerogen matrix in light hydrocarbons and carbon dioxide. J. Phys. Chem. C 123, 29173–29183. doi:10.1021/acs.jpcc.9b04592
Thomas, J. A., McGaughey, A. J. H., and Kuter-Arnebeck, O. (2010). Pressure-driven water flow through carbon nanotubes: insights from molecular dynamics simulation. Int. J. Therm. Sci. 49, 281–289. doi:10.1016/j.ijthermalsci.2009.07.008
Ul Samad, I., Darwish, N. A., Qasim, M., and Al Zarooni, M. (2022). Prediction of saturation densities and critical properties of n -decane, n -pentadecane, and n -eicosane using molecular dynamics with different force-fields. ACS Omega 7, 40257–40266. doi:10.1021/acsomega.2c05175
Ungerer, P., Collell, J., and Yiannourakou, M. (2015). Molecular modeling of the volumetric and thermodynamic properties of kerogen: influence of organic type and maturity. Energy fuels. 29, 91–105. doi:10.1021/ef502154k
Van Duin, A. C. T., Dasgupta, S., Lorant, F., and Goddard, W. A. (2001). ReaxFF: a reactive force field for hydrocarbons. J. Phys. Chem. A 105, 9396–9409. doi:10.1021/jp004368u
Vassetti, D., Pagliai, M., and Procacci, P. (2019). Assessment of GAFF2 and OPLS-AA general force fields in combination with the water models TIP3P, SPCE, and OPC3 for the solvation free energy of druglike organic molecules. J. Chem. Theory Comput. 15, 1983–1995. doi:10.1021/acs.jctc.8b01039
Wang, H., Wang, X., Jin, X., and Cao, D. (2016a). Molecular dynamics simulation of diffusion of shale oils in montmorillonite. J. Phys. Chem. C 120, 8986–8991. doi:10.1021/acs.jpcc.6b01660
Wang, J., Wolf, R. M., Caldwell, J. W., Kollman, P. A., and Case, D. A. (2004). Development and testing of a general amber force field. J. Comput. Chem. 25, 1157–1174. doi:10.1002/jcc.20035
Wang, L., Lyu, W., Ji, Z., Wang, L., Liu, S., Fang, H., et al. (2022b). Molecular dynamics insight into the CO2 flooding mechanism in wedge-shaped pores. Molecules 28, 188. doi:10.3390/molecules28010188
Wang, P., Li, X., Tao, Z., Wang, S., Fan, J., Feng, Q., et al. (2021). The miscible behaviors and mechanism of CO2/CH4/C3H8/N2 and crude oil in nanoslits: a molecular dynamics simulation study. Fuel 304, 121461. doi:10.1016/j.fuel.2021.121461
Wang, R., Bi, S., Guo, Z., and Feng, G. (2022a). Molecular insight into replacement dynamics of CO2 enhanced oil recovery in nanopores. Chem. Eng. J. 440, 135796. doi:10.1016/j.cej.2022.135796
Wang, S., Feng, Q., Javadpour, F., Xia, T., and Li, Z. (2015b). Oil adsorption in shale nanopores and its effect on recoverable oil-in-place. Int. J. Coal Geol. 147, 9–24. doi:10.1016/j.coal.2015.06.002
Wang, S., Feng, Q., Javadpour, F., and Yang, Y.-B. (2016b). Breakdown of fast mass transport of methane through calcite nanopores. J. Phys. Chem. C 120, 14260–14269. doi:10.1021/acs.jpcc.6b05511
Wang, S., Feng, Q., Zha, M., Lu, S., Qin, Y., Xia, T., et al. (2015a). Molecular dynamics simulation of liquid alkane occurrence state in pores and slits of shale organic matter. Petroleum Explor. Dev. 42, 844–851. doi:10.1016/S1876-3804(15)30081-1
Wang, S., Javadpour, F., and Feng, Q. (2016c). Fast mass transport of oil and supercritical carbon dioxide through organic nanopores in shale. Fuel 181, 741–758. doi:10.1016/j.fuel.2016.05.057
Wang, S., Javadpour, F., and Feng, Q. (2016d). Molecular dynamics simulations of oil transport through inorganic nanopores in shale. Fuel 171, 74–86. doi:10.1016/j.fuel.2015.12.071
Wang, Y. (2014). Nanogeochemistry: nanostructures, emergent properties and their control on geochemical reactions and mass transfers. Chem. Geol. 378–379, 1–23. doi:10.1016/j.chemgeo.2014.04.007
Wu, K., Chen, Z., Li, J., Lei, Z., Xu, J., Wang, K., et al. (2019). Nanoconfinement effect on n -alkane flow. J. Phys. Chem. C 123, 16456–16461. doi:10.1021/acs.jpcc.9b03903
Wu, K., Chen, Z., Li, J., Li, X., Xu, J., and Dong, X. (2017). Wettability effect on nanoconfined water flow. Proc. Natl. Acad. Sci. U. S. A. 114, 3358–3363. doi:10.1073/pnas.1612608114
Wu, Q., Ok, J. T., Sun, Y., Retterer, S. T., Neeves, K. B., Yin, X., et al. (2013). Optic imaging of single and two-phase pressure-driven flows in nano-scale channels. Lab. Chip 13, 1165. doi:10.1039/c2lc41259d
Xu, J., Wang, R., and Zan, L. (2023). Shale oil occurrence and slit medium coupling based on a molecular dynamics simulation. J. Petroleum Sci. Eng. 220, 111151. doi:10.1016/j.petrol.2022.111151
Xu, J., Zhan, S., Wang, W., Su, Y., and Wang, H. (2022). Molecular dynamics simulations of two-phase flow of n-alkanes with water in quartz nanopores. Chem. Eng. J. 430, 132800. doi:10.1016/j.cej.2021.132800
Xu, Z., Yuan, S.-L., Yan, H., and Liu, C.-B. (2011). Adsorption of histidine and histidine-containing peptides on Au(111): a molecular dynamics study. Colloids Surfaces A Physicochem. Eng. Aspects 380, 135–142. doi:10.1016/j.colsurfa.2011.02.046
Yang, S., Dehghanpour, H., Binazadeh, M., and Dong, P. (2017). A molecular dynamics explanation for fast imbibition of oil in organic tight rocks. Fuel 190, 409–419. doi:10.1016/j.fuel.2016.10.105
Yang, Y., Liu, J., Yao, J., Kou, J., Li, Z., Wu, T., et al. (2020b). Adsorption behaviors of shale oil in kerogen slit by molecular simulation. Chem. Eng. J. 387, 124054. doi:10.1016/j.cej.2020.124054
Yang, Y., Narayanan Nair, A. K., and Sun, S. (2020a). Adsorption and diffusion of carbon dioxide, methane, and their mixture in carbon nanotubes in the presence of water. J. Phys. Chem. C 124, 16478–16487. doi:10.1021/acs.jpcc.0c04325
Yang, Y., Narayanan Nair, A. K., and Sun, S. (2021). Sorption and diffusion of methane, carbon dioxide, and their mixture in amorphous polyethylene at high pressures and temperatures. Ind. Eng. Chem. Res. 60, 7729–7738. doi:10.1021/acs.iecr.0c06110
Yang, Y., Wang, K., Zhang, L., Sun, H., Zhang, K., and Ma, J. (2019). Pore-scale simulation of shale oil flow based on pore network model. Fuel 251, 683–692. doi:10.1016/j.fuel.2019.03.083
Yang, Y., Yao, J., Wang, C., Gao, Y., Zhang, Q., An, S., et al. (2015). New pore space characterization method of shale matrix formation by considering organic and inorganic pores. J. Nat. Gas Sci. Eng. 27, 496–503. doi:10.1016/j.jngse.2015.08.017
Yu, H., Li, S., Li, J., Zhu, S., and Sun, C. (2020a). Interfacial mass transfer characteristics and molecular mechanism of the gas-oil miscibility process in gas flooding. Acta Phys. Chim. Sin. 0, 2006061. doi:10.3866/PKU.WHXB202006061
Yu, H., Xu, H., Fan, J., Wang, F., and Wu, H. (2020b). Roughness factor-dependent transport characteristic of shale gas through amorphous kerogen nanopores. J. Phys. Chem. C 124, 12752–12765. doi:10.1021/acs.jpcc.0c02456
Zhang, D., Tang, H., Zhang, X., Ranjith, P. G., and Perera, M. S. A. (2022). Molecular simulation of methane adsorption in nanoscale rough slits. J. Nat. Gas Sci. Eng. 102, 104608. doi:10.1016/j.jngse.2022.104608
Zhang, J., and Tian, F. (2008). A bottom-up approach to non-ideal fluids in the lattice Boltzmann method. Europhys. Lett. 81, 66005. doi:10.1209/0295-5075/81/66005
Zhang, W., Feng, Q., Wang, S., and Xing, X. (2019). Oil diffusion in shale nanopores: insight of molecular dynamics simulation. J. Mol. Liq. 290, 111183. doi:10.1016/j.molliq.2019.111183
Zhang, Y. (2016). The flow equation for a nanoscale fluid flow. Int. J. Heat Mass Transf. 92, 1004–1008. doi:10.1016/j.ijheatmasstransfer.2015.09.008
Zhang, Y., Fang, T., Ding, B., Wang, W., Yan, Y., Li, Z., et al. (2020). Migration of oil/methane mixture in shale inorganic nano-pore throat: a molecular dynamics simulation study. J. Petroleum Sci. Eng. 187, 106784. doi:10.1016/j.petrol.2019.106784
Zhang, Y., and Guo, W. (2021). Molecular insight into the tight oil movability in nano-pore throat systems. Fuel 293, 120428. doi:10.1016/j.fuel.2021.120428
Zhong, J., Abedini, A., Xu, L., Xu, Y., Qi, Z., Mostowfi, F., et al. (2018). Nanomodel visualization of fluid injections in tight formations. Nanoscale 10, 21994–22002. doi:10.1039/C8NR06937A
Zhong, J., Wang, P., Zhang, Y., Yan, Y., Hu, S., and Zhang, J. (2013). Adsorption mechanism of oil components on water-wet mineral surface: a molecular dynamics simulation study. Energy 59, 295–300. doi:10.1016/j.energy.2013.07.016
Zhong, J., Zandavi, S. H., Li, H., Bao, B., Persad, A. H., Mostowfi, F., et al. (2017). Condensation in one-dimensional dead-end nanochannels. ACS Nano 11, 304–313. doi:10.1021/acsnano.6b05666
Zhou, X., Yuan, Q., Zhang, Y., Wang, H., Zeng, F., and Zhang, L. (2019). Performance evaluation of CO2 flooding process in tight oil reservoir via experimental and numerical simulation studies. Fuel 236, 730–746. doi:10.1016/j.fuel.2018.09.035
Zhu, A., Zhang, X., Liu, Q., and Zhang, Q. (2009). A fully flexible potential model for carbon dioxide. Chin. J. Chem. Eng. 17, 268–272. doi:10.1016/S1004-9541(08)60204-9
Zhu, C., Sheng, J. J., Ettehadtavakkol, A., Li, Y., Gong, H., Li, Z., et al. (2020). Numerical and experimental study of enhanced shale-oil recovery by CO2 miscible displacement with NMR. Energy fuels. 34, 1524–1536. doi:10.1021/acs.energyfuels.9b03613
Keywords: shale oil, molecular dynamics simulations, CO2 flooding, flow characteristics, microscopic mechanism, enhanced recovery
Citation: Huang X, Yu X, Li X, Wei H, Han D and Lin W (2024) A review of the flow characteristics of shale oil and the microscopic mechanism of CO2 flooding by molecular dynamics simulation. Front. Earth Sci. 12:1401947. doi: 10.3389/feart.2024.1401947
Received: 16 March 2024; Accepted: 17 April 2024;
Published: 10 May 2024.
Edited by:
Hongjian Zhu, Yanshan University, ChinaReviewed by:
Yize Huang, Chinese Academy of Sciences (CAS), ChinaDebin Xia, Chinese Academy of Sciences (CAS), China
Copyright © 2024 Huang, Yu, Li, Wei, Han and Lin. This is an open-access article distributed under the terms of the Creative Commons Attribution License (CC BY). The use, distribution or reproduction in other forums is permitted, provided the original author(s) and the copyright owner(s) are credited and that the original publication in this journal is cited, in accordance with accepted academic practice. No use, distribution or reproduction is permitted which does not comply with these terms.
*Correspondence: Denglin Han, aGFuZGxAeWFuZ3R6ZXUuZWR1LmNu; Wei Lin, dWNhc2xpbndlaUAxMjYuY29t
 Xinmiao Huang1
 Denglin Han
 Wei Lin