 Xiaolong Chen
 Yufei Gao
- China National Offshore Oil Corporation Research Institute Co., Ltd., Beijing, China
This study focuses on coalbed methane (CBM) wells in high-ranking coal seam as the research subject. Considering the influence of effective stress and matrix shrinkage, a comprehensive permeability calculation model for CBM reservoirs is established. Based on this model, the variations in pressure and permeability during well production are quantified. By integrating static geological parameters, a finely classified classification of CBM wells is achieved using self-organizing map (SOM) neural network. Subsequently, an analysis of production dynamic characteristics and productivity differences among different types of CBM wells is performed, followed by providing drainage optimization suggestions. The results of SOM analysis show that 7,000 m3/d and 1,500 m3/d can be used as the production boundaries for the wells with different productivity in Block P. The daily gas production of exceptional well exceeds 7,000 m3/d, and the permeability remains relatively stable throughout the drainage process of this well. The daily gas production of the potential well ranges from 1,500 to 7,000 m3/d, and the permeability exhibits a significant decrease during the drainage process. The daily gas production of Inefficient well is consistently below 1,500 m3/d with moderate permeability variation. In addition to well location and structural geology, production variability is also influenced by the matching of reservoir conditions and drainage systems. This is primarily manifested in discontinuous drainage systems and rapid decline in bottom hole pressure (BHP) during early production. The analysis of drainage parameters indicates that in order to achieve optimal production from CBM wells, the BHP should exhibit an initial rapid decline followed by a slowly decrease during the early production period, with an average pressure drop ranging from 0.005 to 0.02 MPa/d. The research findings can offer technical guidance for the future advancement of CBM in the P Block.
1 Introduction
The utilization of clean energy is regarded as one of the efficacious measures to alleviate global climate change (Dickey, 2006; Zhu et al., 2021). CBM, characterized by its non-toxic combustion, absence of particulate matter emissions, and lower carbon dioxide release compared to coal, oil, or wood, is acknowledged as a clean fuel (Chen et al., 2017; Peng et al., 2017; Kong et al., 2022; Ni et al., 2023). Over the past 2 decades, CBM has emerged as a significant energy resource and is anticipated to play a pivotal role in meeting future global energy demands (Moore, 2012; Lou et al., 2013; Fu et al., 2017; Gao et al., 2023a; Ifrene et al., 2023; Wang et al., 2024a). China, as the current global leader in coal consumption and production, can benefit from the development of CBM resources. This not only aids in reducing natural greenhouse gas emissions and maximizing energy utilization but also enhances safety measures in coal mining operations by mitigating risks associated with underground disasters such as fires caused by spontaneous combustion of natural gas and coal (Bao et al., 2020; Kong et al., 2021). The CBM reserves in China are distributed among high-rank, middle-rank, and low-rank coal seams, with each accounting for approximately one-third of the total resources. However, the focus of CBM development is primarily on the high-rank and middle-rank seams. A prime example of a high-rank CBM field is located in the southern Qinshui Basin of Shanxi Province (Bustin, 1997; Chen et al., 2016; Gao et al., 2023b; Qiu et al., 2023). In recent years, scholars have conducted comprehensive research on the geological background, physical properties of CBM reservoirs, resource evaluation, reservoir formation mechanisms, and production potential in the Qinshui Basin. Li et al. demonstrated that the tectonic subsidence and weak hydrodynamics in the southern block of the Qinshui Basin created favorable constraints for the occurrence of CBM (Li et al., 2018). Liu et al. discovered that during the formation of CBM reservoirs, the spatial distribution of CBM composition exhibits a gradual change in different locations, and there is relatively weak interference between CBM wells in the southern block of Qinshui Basin (Liu et al., 2018). Lu et al. conducted a study on the production characteristics and key factors of numerous gas Wells in the southern Qinshui Basin using variable correlation analysis and grey correlation theory. They concluded that hydraulic fracturing is an effective method to ensure high production of CBM wells, and identified gas content and permeability as two crucial factors influencing gas production of CBM wells (Lv et al., 2012). Jiang et al. conducted a study on the characteristics and gas production potential of the No. 15 coal seam in the northern block of Qinshui Basin, revealing that the No. 15 coal seam exhibits significant thickness, high adsorption capacity, moderate gas content, low critical desorption pressure, and substantial gas production potential (Jiang et al., 2022). At present, the commercial development of CBM from high-rank coal reservoirs in Qinshui Basin has achieved remarkable results (Nie et al., 2000; Qin et al., 2005; Chen et al., 2015; Wang et al., 2024b).
The P block is situated in the southeastern region of the Qinshui Basin, where CBM exploration activities commenced in the 1970s. This area represents a typical site for CBM development in China, with two primary target coal seams: the No. 3 coal seam of the Shanxi Formation and the No. 15 coal seam of the Taiyuan Formation. The CBM well of No. 3 coal in Block P has a prolonged production history, and the overall gas production of this coal seam has exhibited a noticeable declining trend. Therefore, it is imperative to develop No. 15 coal seam in order to enhance the gas production of the block (Yuanyuan et al., 2012). However, due to the different reservoir characteristics, there are significant differences in the gas production rules of No. 3 and No. 15 coal seam CBM wells, and the development method of No. 15 coal seam cannot be fully used for reference by No. 3 coal seam. Therefore, it is the key to develop efficient development methods to clarify the production characteristics and influencing factors of CBM wells in No. 15 coal seam.
Permeability is a key parameter that determines fluid migration ability, and its influence on the production dynamics of CBM wells cannot be ignored. In the process of CBM production, the permeability of the reservoir will change significantly due to the strong influence of effective stress, matrix contraction and gas slippage (Cai et al., 2014). Scholars have established multiple permeability models to evaluate the dynamic changes of reservoir permeability. These models can be divided into three categories: stress-based models (Palmer and Mansoori, 1998a), strain-based models (Shi and Durucan, 2005a) and production data-based models (Lai et al., 2013). However, these models consider fewer factors and have limited applicability. Fine classification of CBM wells is the prerequisite for accurate analysis of production dynamics. Most previous studies have classified wells based on geostatic parameters, without quantifying the influence of dynamic characteristic parameters (dynamic changes in permeability and pressure) on well classification. Shang et al. classified CBM wells into four types according to gas production and analyzed the forming reasons. The results showed that coal structure was the basic factor affecting the productivity of CBM wells, and gas content and permeability were the direct geological factors controlling the production of CBM wells (Sang et al., 2009). Yi et al. classified CBM wells according to the type of reservoir pressure drop, and divided them into three types: rapid drop type, medium-term stable type and slow drop type. Among them, the rapid drop type is more favorable for high and stable production of CBM (Yi et al., 2019). Hou et al. classified CBM wells into four categories based on the static coal reservoir properties and the dynamic average daily gas production data of a single well, and systematically analyzed the gas production characteristics of each type of well (Hou et al., 2018). At present, most of the studies on CBM well classification do not consider dynamic parameters such as permeability and average reservoir pressure. In addition, the classification results of CBM wells are greatly affected by subjective factors. Therefore, it is the key point of the future CBM development evaluation in Block P to objectively classify the CBM wells according to the dynamic and static parameters, and comprehensively analyze the production characteristics and control factors of different types of CBM wells.
This study focuses on the No. 15 coal seam in the P block as a research subject, investigating the impact of various static factors on CBM production. Based on this, a neural network method is employed to finely classify CBM wells by considering both static and dynamic parameters. The production dynamics and productivity differences among different types of CBM wells are analyzed, providing CBM drainage optimization suggestions that offer technical support for future development of No. 15 coal seam.
2 Regional geology and reservoir characteristics
The P block is situated in the southeastern part of the Qinshui Basin. The structural configuration within the block is characterized by simplicity, presenting a predominantly west-dipping monoclinic structure overall, with only two faults observed in the northeastern region (refer to Figure 1). Secondary folds are primarily developed within the block, exhibiting a general orientation along the north-south axis on a planar scale. These folds possess distinctive features including broad and gentle characteristics, symmetrical wings, and shallow dip angles. The fold structures in the east-west direction consist of Zhengcun anticline, Panhe syncline, Shigou anticline, Huojiashan syncline, Mashancun anticline, etc. The strata exhibit gentle inclination angles ranging from 5° to 8° on average, with a maximum dip angle of only 15°. Generally speaking, the synclines tend to have relatively high gas content compared to the anticlines.
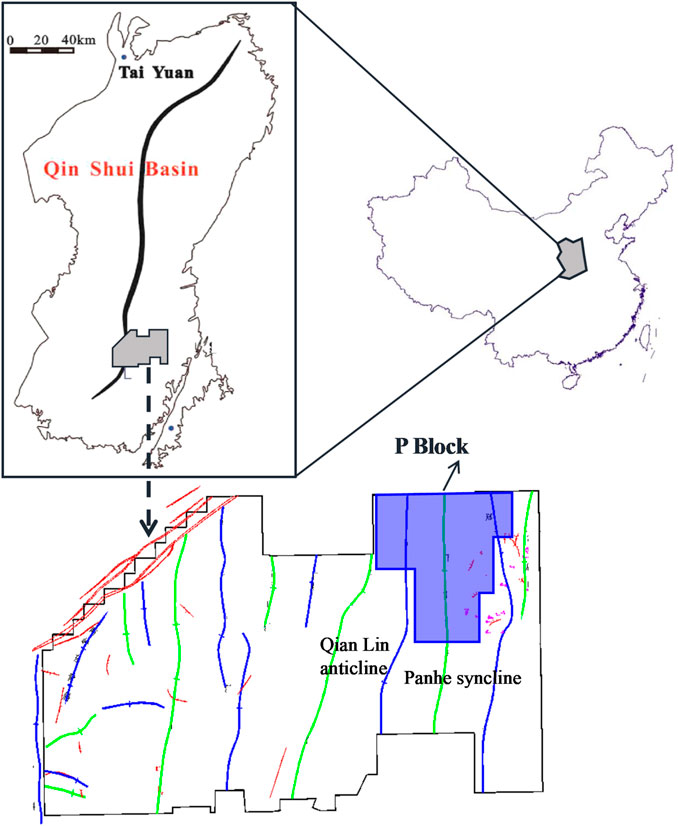
Figure 1. Location of the P block in China.
In the P block, the primary coal-bearing strata comprise the Upper Carboniferous Taiyuan Formation and the Lower Permian Shanxi Formation (refer to Figure 2). The Taiyuan Formation predominantly accumulated in a marine sedimentary environment, consisting of sandstone, mudstone, coal, and limestone. Conversely, the Shanxi Formation primarily deposited in a terrestrial sedimentary setting composed of sandstone, mudstone, and coal. The coal seam within the block comprises the No. 3 coal seam of Shanxi Formation and the No. 15 coal seam of Taiyuan Formation, with a current focus on exploring and developing CBM in the latter. The No. 15 coal seam consists of sediments from barrier coast and delta systems. Furthermore, within the paleo-sedimentary environment, there is well-developed distributary channeling and inter-distributary bay formation, leading to bifurcation or even disappearance of certain coal seams within the block.
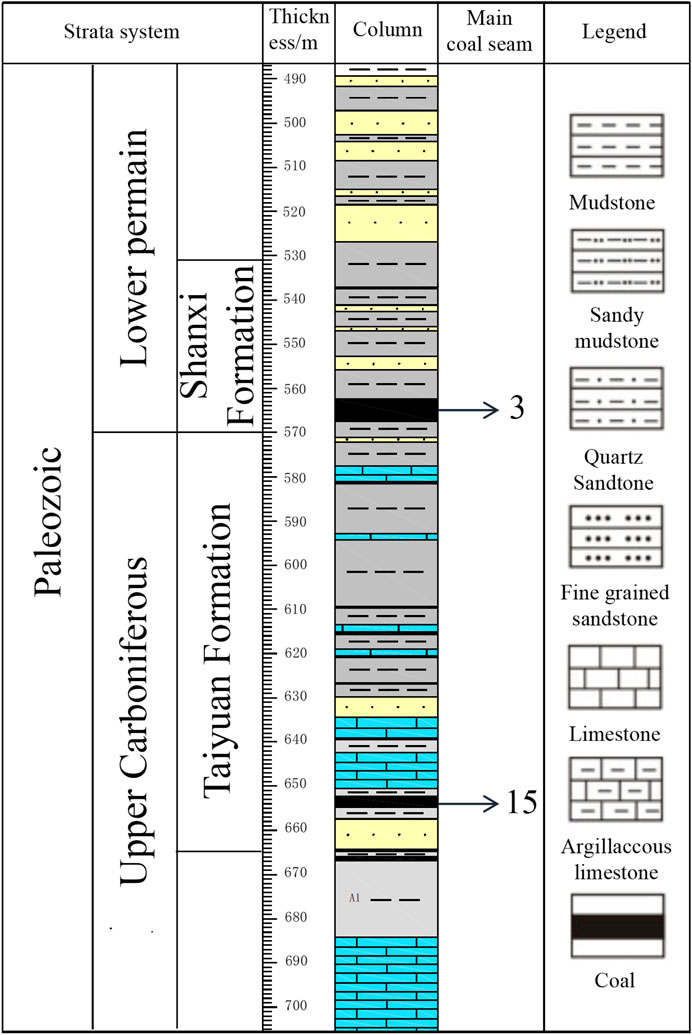
Figure 2. Stratigraphic column of the Permo-Carboniferous coal-bearing strata in P block.
The No. 15 coal seam is buried at depths ranging from 350 m to 700 m, with an average burial depth of 510 m. The thickness of the coal seam remains consistent in the horizontal plane, varying between 2.68 m and 7.78 m, with an average thickness of 4.14 m. The coal body structure primarily consists of intact structural coal and fragmented coal, exhibiting a permeability range of 0.08 to 5.707 mD, with an average permeability value of 1.84 mD. Additionally, the raw coal exhibits an ash yield ranging from 9.15% to 15.54%, averaging at around 12.17%, indicating its classification as low and medium ash coal. The desorption test results indicate that No. 15 coal exhibits a high gas content, ranging from 12.57 to 27.71 m3/t, with an average of 20.91 m3/t, and the gas saturation exceeds 90%. Additionally, the reservoir pressure ranges from 1.82 to 2.93 MPa, averaging at 2.21 MPa. The overall development geological conditions of No. 15 coal are more suitable for the development of CBM.
3 Mathematical model of dynamic permeability of CBM well
The consideration of permeability as a parameter in dynamic analysis is crucial; however, it is impractical to measure the permeability of CBM wells in real-time during production. Therefore, this section initially derives the calculation model for determining the dynamic permeability of CBM wells. In the actual production process of CBM, reservoir pressure is closely correlated with permeability. Therefore, the dynamic characteristics of coal reservoir pressure are investigated through analysis of the material balance equation. The material balance equation for CBM can be expressed as follows:
where, Gp is cumulative gas production, m3; A is well control area, m2; h is coal seam thickness, m;
The material balance equation for water can be expressed as follows:
where, WB is gas volume coefficient, m3/m3; cw is water compression coefficient, MPa−1; We is water invasion volume, m3; Wp is cumulative water production, m3.
We = 0, Eq. 2 is simplified as:
The porosity of coal exhibits a self-adjusting effect, which varies in response to the pressure exerted on the coal reservoir. According to the P&M model (Shi et al., 2021), at the current reservoir pressure, the ratio of porosity to initial porosity can be expressed as follows:
where, cm is P&M model coefficient, MPa−1; εl is langmuir volumetric strain fitting parameter; K is volume modulus, MPa; M is unaxial modulus, MPa.
where, g is a correction factor between 0 and 1;
where, E is young’s modulus, MPa; ν is poisson ratio.
Combine Eqs 4–7 to obtain the equation of porosity under the influence of effective stress and matrix shrinkage:
The iterative solution of Eqs 1, 3, 8 enables the calculation of coal reservoir pressure during the production process, thereby providing fundamental parameters for subsequent permeability calculations.
For an unsaturated coal reservoir, when the reservoir pressure exceeds the critical desorption pressure, CBM cannot be released from the coal matrix, resulting in pore saturation with coalbed water. This stage is characterized by single-phase water flow production. During this stage, the permeability of the coal reservoir is solely influenced by effective stress. The mathematical model describing changes in coal permeability during this stage is as follows (Chen et al., 2015):
where, Ki is initial permeability, mD; K is dynamic permeability of single-phase flow stage, mD.
When the reservoir pressure is below the critical desorption pressure, CBM is released from the coal matrix due to the decrease in pressure. The permeability of the reservoir is not only affected by effective stress but also by matrix shrinkage. According to the classical P&M model (Shi et al., 2021), the relationship between porosity and permeability can be expressed as follows:
where, Kcd is the permeability at critical desorption pressure, mD;
Combine Eqs 8, 10 to obtain the equation of permeability under the influence of effective stress and matrix shrinkage:
where, Know is the permeability below critical desorption pressure, mD.
The permeability calculation method is as follows: the change in reservoir pressure over time during CBM well production can be determined using Eqs 1, 3, 8. Equation 9 is employed to calculate permeability when the reservoir pressure exceeds the critical desorption pressure, while Eq. 11 is utilized for calculating permeability when the reservoir pressure falls below the critical pressure.
4 Results and discussion
4.1 Classification of CBM wells based on SOM neural network
The fine classification of CBM wells necessitates a comprehensive consideration of both the static reservoir parameters and the dynamic drainage parameters. Figure 3 is the scatter diagram of the correlation between static parameters and gas production. The permeability, ratio of critical desorption pressure to reservoir pressure (RCR), and gas content are ultimately selected as the key static parameters for well type classification due to their relatively high correlation with gas production. Considering that the key dynamic parameters of CBM wells in existing studies usually include gas production, pressure and permeability (Yuanyuan et al., 2012; Lou et al., 2013; Chen et al., 2015; Fu et al., 2017; Bao et al., 2020), this paper selects average daily gas production, average reservoir pressure drop, and change amplitude of permeability as dynamic parameters. The average reservoir pressure drop and dynamic permeability are derived from the mathematical model established in the preceding section. After the parameters of CBM well classification are determined, the intelligent algorithm is used to classify the CBM wells in detail. To minimize the influence of subjective factors in the classification process, this study employs a SOM neural network for automatic clustering. The key feature of this algorithm lies in its ability to determine the optimal number of clusters based on data characteristics, thereby revealing the underlying essential features concealed within the data (Kalteh et al., 2008).
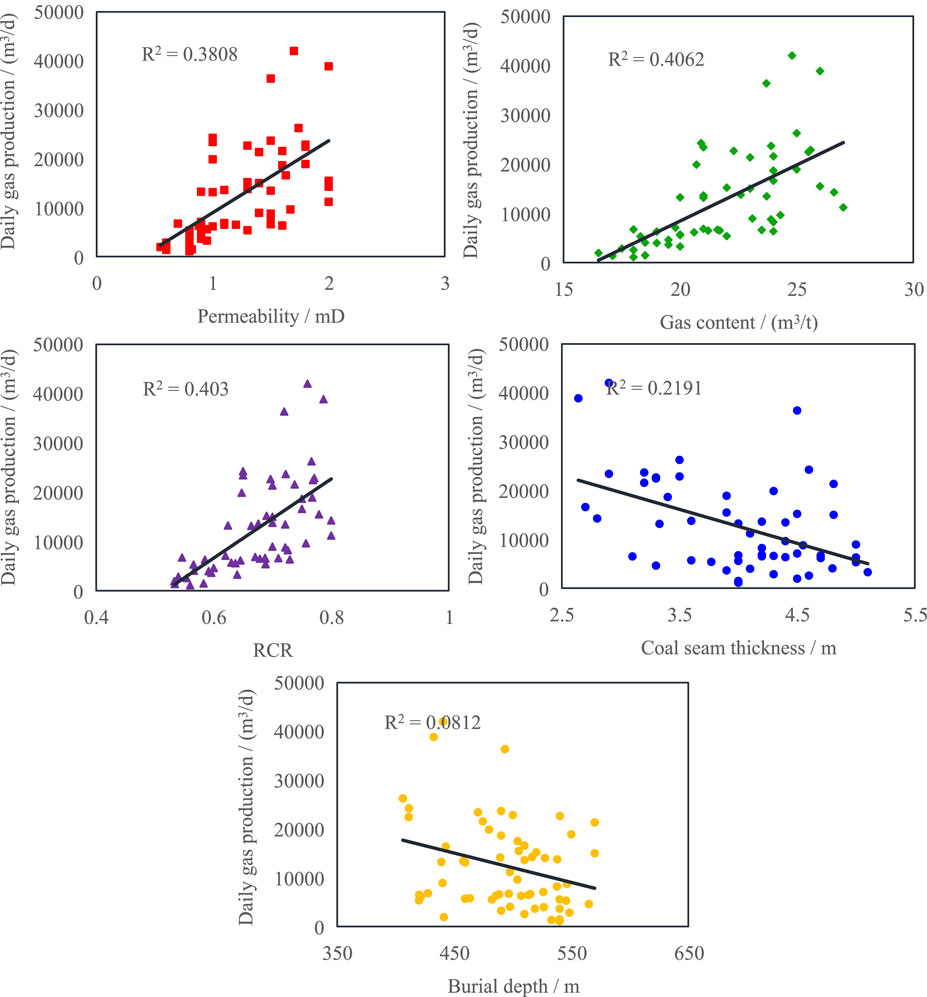
Figure 3. Correlation between reservoir static parameters and gas production.
The SOM neural network is employed for clustering 71 CBM wells. Table 1 presents the data required for SOM clustering of some CBM wells. After repeated training, it has been determined that a competition layer consisting of a 10×10 network structure (i.e., 100 neurons in total) yields favorable training effects and clustering outcomes, while also exhibiting a rapid learning rate. Consequently, the competition layer (output layer) of the SOM neural network is configured with 100 neurons, whereas the input layer comprises six neurons.
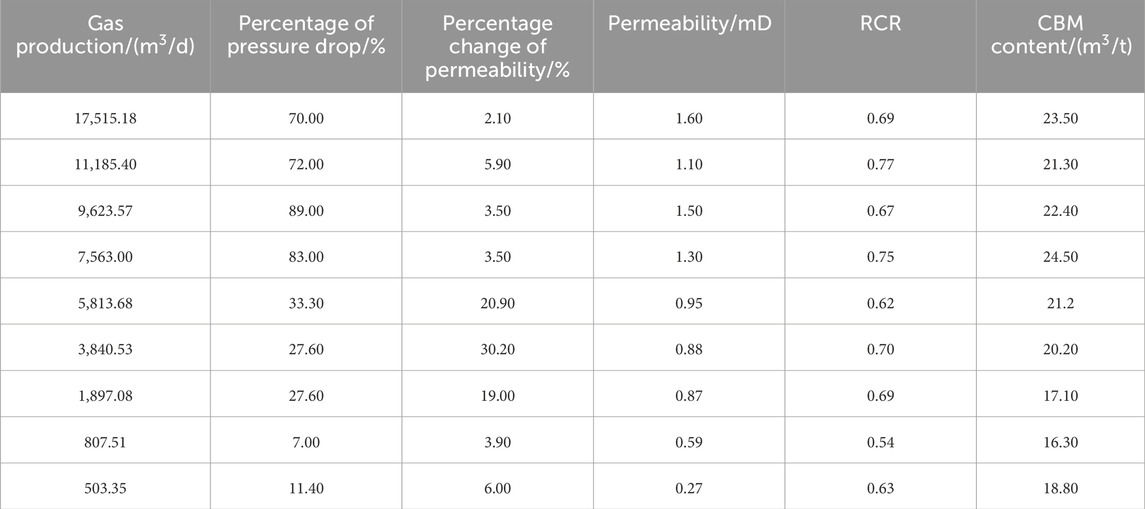
Table 1. Partial parameter data of CBM wells.
Figure 4 illustrates the weight connections among network neurons post-training, with each small hexagon representing a neuron. The color intensity of the connection between two hexagons indicates their proximity, reflecting the similarity in features of two input vectors. The hexagon with the deepest shade of black is assigned a weight of 0, while the boundaries of each well type region are defined by neighboring neurons exhibiting progressively darker colors. Within the depicted figure, these dark neurons effectively partition the entire network map into three distinct segments, thereby illustrating how the SOM neural network classifies samples into three distinct types.
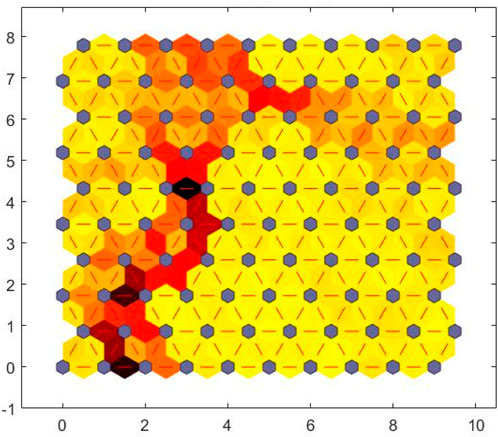
Figure 4. Distance distribution of neurons after training.
The statistical analysis is conducted on the parameter distribution of three types of wells. Table 2 presents the classification of well types based on SOM clustering results. Based on the characteristics of various well parameters, CBM wells are categorized into three groups: exceptional wells, potential wells, and inefficient wells. According to the distribution characteristics of dynamic and static parameters of the three wells, it can be observed that the exceptional well exhibits favorable geological conditions and a rational drainage system, thereby fully realizing its gas production potential. Conversely, the potential well possesses advantageous geological conditions but lacks an optimal drainage system, resulting in an underdeveloped gas production potential. Implementing certain measures could potentially transform them into exceptional wells. Lastly, the inefficient well is characterized by unfavorable geological conditions and limited gas production capacity. The exceptional wells are predominantly distributed in close proximity to the central syncline structure, while the potential wells exhibit a wide distribution pattern. The majority of inefficient wells are concentrated in the northeastern and southern regions of the block.
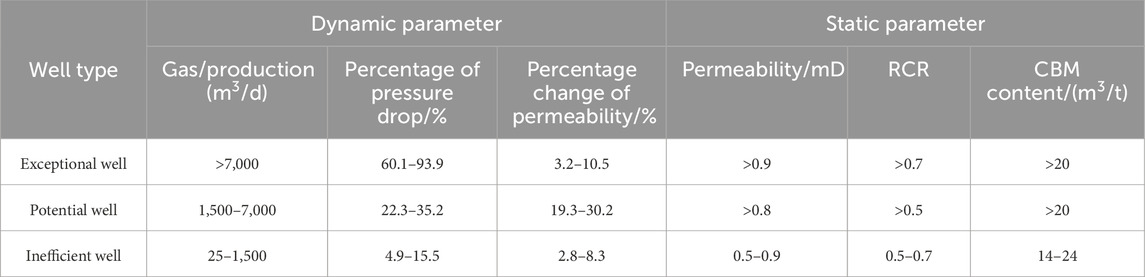
Table 2. The classification of well types based on SOM clustering results.
4.2 Production characteristics of CBM wells
The production curves of three exceptional wells are depicted in Figure 5. In order to enhance the clarity of the production curve morphology for different CBM wells, we have simplified the production curves for each well. The production curves of the three wells differed before they reached steady production. Well Z1 and Z3 were already producing gas in the early stages of production, and well Z1 reached its peak gas production quickly, while well Z3 needed a longer time to reach the peak gas production. Well Z2 only produced water in the early production stage and needed a longer time to reach its peak gas production rate. The difference of the curve shape is related to the geological structure and drainage system of the well. Well Z1 and Z3 are located in the syncline, with good gas preservation conditions and high CBM content. Under the reasonable production system, there is enough natural gas supply in the area controlled by a single well, with an average daily gas production of more than 15,000 m3/d. The Z2 well is situated along the anticline axis, exhibiting well-developed interbedded layers and fractures with favorable permeability. However, the presence of certain vertical fractures facilitates gas leakage, resulting in limited gas content and prolonged drainage water and pressure reduction period. Despite a reasonable production regime, well Z2 still exhibits lower daily gas production compared to wells Z1 and Z3. The three typical wells exhibit distinct curve morphologies; however, they all demonstrate consistent quantitative characteristics in terms of dynamic parameters. During the 700-day production period, the average daily gas production of the three wells exceeded 10,000 m3/d; the average decline in reservoir pressure surpassed 60%; the water production curve exhibited a single peak, and water production was exceptionally low during the intermediate stage of production, with an average daily water production rate below 1.0 m3/d. As water production decreases, the influence of effective stress on reservoir permeability damage gradually diminishes, leading to a balance between damage and recovery processes, resulting in stable or slightly reduced permeability (Fu et al., 2002).

Figure 5. The production curves of three exceptional wells.
The production curves of the three potential wells are depicted in Figure 6. While the production curves characteristics of Q1, Q2, and Q3 exhibit similarities with Z1, Z2, and Z3, respectively, notable distinctions can be observed in terms of their production dynamic parameters. The average daily gas production of the three potential wells falls significantly short of that of the exceptional well, with Q2 exhibiting the highest average daily gas production at only 6,285 m3/d. The water production of the three wells exhibits a substantial increase during the early and middle periods, followed by a gradual decrease in the later stages; however, the decline rate is minimal, ensuring a consistent level of water production. The average decline in reservoir pressure is lower compared to that of exceptional wells. Due to the high water production and low gas production characteristics, the impact of effective stress on reservoir permeability surpasses that of matrix shrinkage, resulting in a significant decrease in reservoir permeability. Some potential wells exhibit comparable geological conditions to the exceptional wells, yet they yield significantly disparate gas production owing to unreasonable production systems, which will be comprehensively analyzed in the subsequent section.
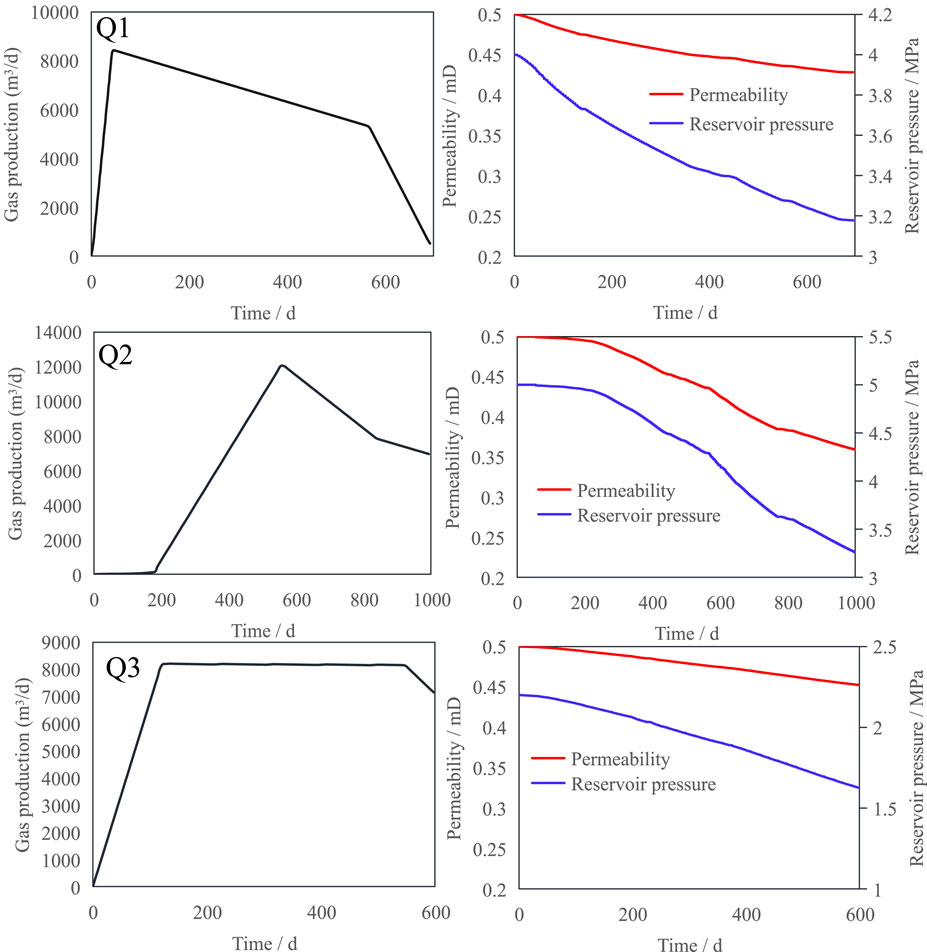
Figure 6. The production curves of three potential wells.
Figure 7 shows the typical production curve of inefficient wells. The average daily gas production of most inefficient wells is less than 1,000 m3/d, but the water production is relatively high, with a multi-peak water production curve, and the average daily water production is between 1.15 and 16 m3/d. Inefficient wells have a slow decline in reservoir pressure during production, resulting in low gas production. Although the well is characterized by high water production and low gas production, the overall liquid output is comparatively smaller while experiencing a lesser decline in reservoir permeability.
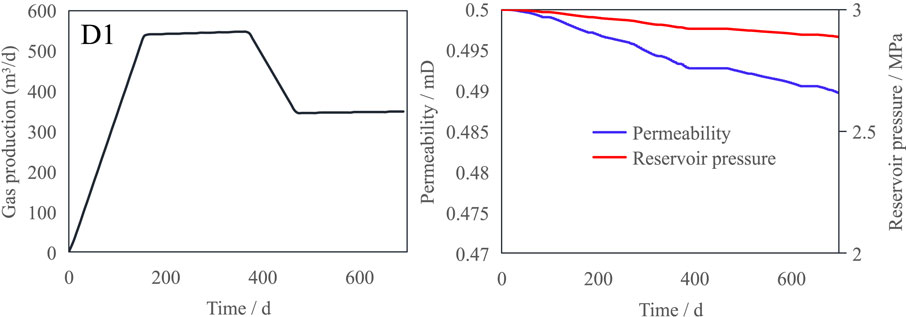
Figure 7. The production curves of three inefficient wells.
4.3 Productivity differences among different well types
4.3.1 Analysis of causes for inefficient wells
The production capacity of gas wells is closely correlated with their structural position, leading to varying productivity among gas wells located in different structural positions. Due to the effect of north-south compressive stress, numerous fractures are formed along the axis of the anticline within the study block. The upper overburden exhibits thinness and vertical fractures have developed, facilitating gas migration. Consequently, the gas content within the anticline axis is limited, resulting in low production. On the contrary, the gas preservation conditions in the syncline axis and the flank are good, the CBM is enriched, and the gas content is large. The average and maximum gas production of gas wells are generally higher than those of wells in the axis of the anticline. The inefficient wells are predominantly distributed within the Zhengcun anticline, distant from the Panhe syncline, exhibiting low reservoir permeability, gas content, and RCR, resulting in inadequate gas production capacity.
In the process of CBM production, the generation of coal powder is inevitable. The optimal amount of coal powder facilitates the improvement of reservoir permeability and enhances production capacity of gas wells. However, excessive coal powder can cause reservoir damage and hinder production capacity of gas wells (Kravchenko and Lyerly, 2018). Some low-efficiency wells in the No. 15 coal seam are seriously affected by coal powder, and the well D5 has a high amount of coal powder blocking the reservoir, resulting in a very low gas production in the early stage. In order to solve this problem, measures of washing coal powder were carried out, and the average daily gas production before washing coal powder was 103.3 m3/d, and the average daily gas production after washing coal powder was 446.5 m3/d (see Figure 8).
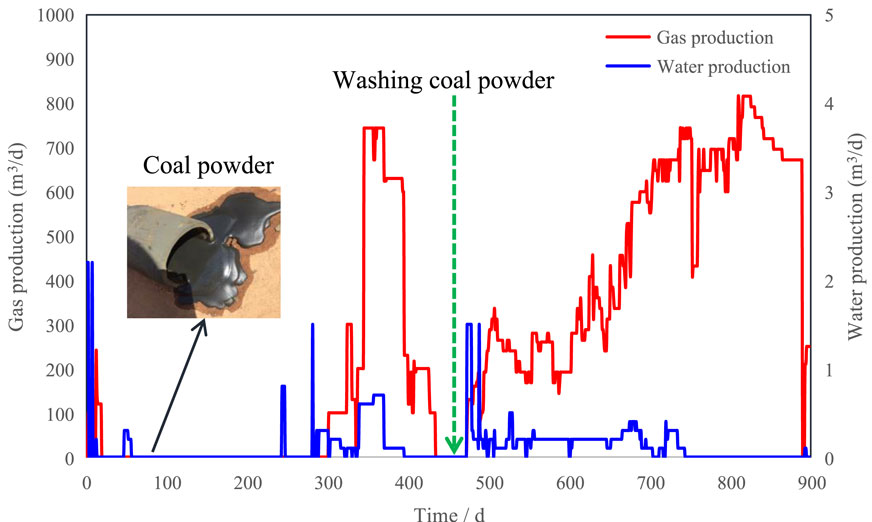
Figure 8. The influence of coal power on the production curve of well D5.
The continuity of production directly affects the uninterrupted of gas-water flow and the stability of depressurization and desorption in coal reservoirs. The discontinuous production, on the one hand, leads to the rapid rise of reservoir pressure near the wellbore, which stops the seepage action and causes coal powder accumulation to block the seepage channel, reducing the permeability of coal seam; on the other hand, the stagnant flow of free CBM leads to the gradual accumulation of small bubbles in the micro-cracks of coal reservoir into large bubbles, which block the seepage channel and produce Jamin’s effect, increasing the gas flow resistance. The blockage of the seepage channels of coal seam caused by multiple switching wells will seriously affect the production in the later stage, and even the gas wells completely failed (Palmer and Mansoori, 1998b). The hazards of discontinuous production are illustrated by the example of well D6, whose production process is shown in Figure 9. The well underwent a normal drainage process during the initial stage of production; however, due to power and mechanical failures, it experienced 28 shutdowns throughout the production period. These intermittent shutdowns significantly impacted production continuity, leading to a substantial rise in the dynamic liquid level of the gas well and greatly affecting its gas production capacity, resulting in an average daily gas production of only 80.8 m3/d. Figure 10 illustrates the correlation between average daily gas production and shutdown frequency of inefficient wells. Statistical analysis indicates that a lower number of shutdowns is associated with higher gas production and greater potential for gas production.
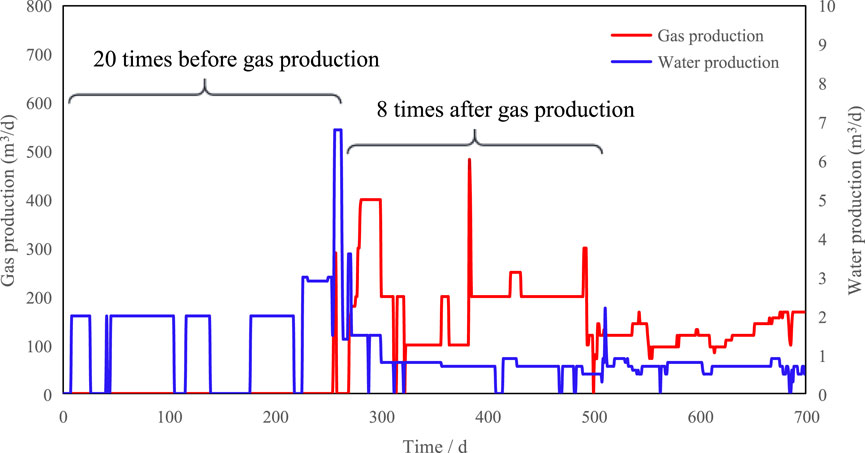
Figure 9. The influence of discontinuous production system on the production curve of well D6.
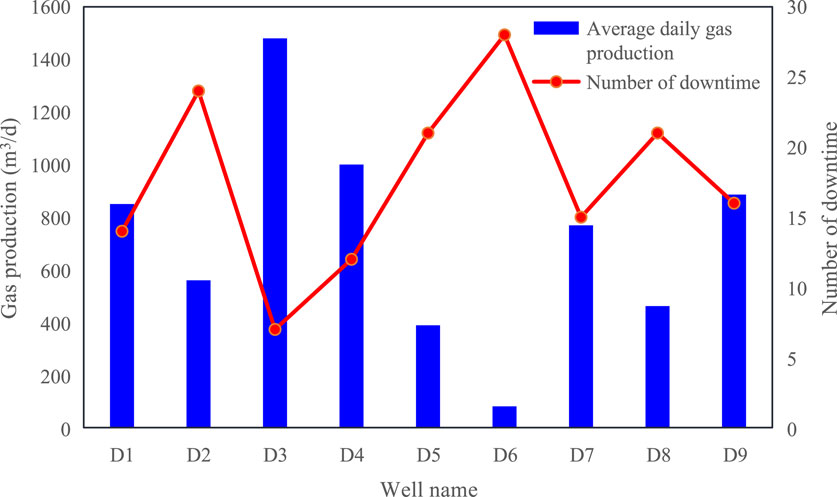
Figure 10. The correlation between average daily gas production and shutdown frequency of inefficient wells.
4.3.2 Analysis of the productivity differences between exceptional wells and potential wells
Both exceptional wells and potential wells have good geological conditions. The main reason for the difference in productivity between the two is the different matching degree between drainage system and reservoir conditions. The CBM reservoir in the study area is an undersaturated reservoir, necessitating decompression and pressure reduction during the development process. The initial rate of pressure reduction significantly influences both overall pressure reduction and the expansion of the pressure reduction funnel.
Figure 11 shows the production curves of the exceptional well Z4 and the potential well Q4. The two wells are adjacent to each other and have the same geological conditions, but the productivity differences are very obvious. The average daily gas production of well Z4 is 14061 m3/d, accompanied by an average daily water production of 1.65 m3/d. In contrast, well Q4 exhibits a significantly lower average daily gas production of only 1,606 m3/d, coupled with an average daily water production of 0.91 m3/d. This disparity can be primarily attributed to the differential pressure drop rates experienced during the early stage of drainage. The pressure drop rate in Well Z4 before peak production was 0.01 MPa/d, with a 76% reduction in bottom flow pressure, while the pressure drop rate in Well Q4 before peak production was 0.076 MPa/d, with a 70% reduction in bottom flow pressure. When the disparity in bottom flow pressure drop is insignificant, the pressure drop rate of Q4 well exhibits an approximate 9 times faster than that of Z4 well. This phenomenon potentially leads to an elevation in the pressure differential between overlying rock and pore spaces within the rock, resulting in coal matrix compression, closure of minuscule fissures within the rock, and gradual reduction in permeability—thus inducing a pressure-sensitive effect. On the other hand, this phenomenon will result in an excessive growth rate of gas production, thereby accelerating the fluid flow velocity within the coal reservoir fissures. The rapid fluid flow carries a substantial amount of coal powder through the seepage channel, leading to blockages in the coal seam fissures due to the velocity-sensitive effect (Shi and Durucan, 2005b). The internal permeability of the reservoir is compromised under the combined influence of pressure-sensitive and velocity-sensitive effects, thereby impeding the outward expansion rate of the pressure drop funnel. Consequently, this limited the extent of desorption zone, ultimately leading to a decline in gas production from the potential well and an incomplete realization of its gas production potential.
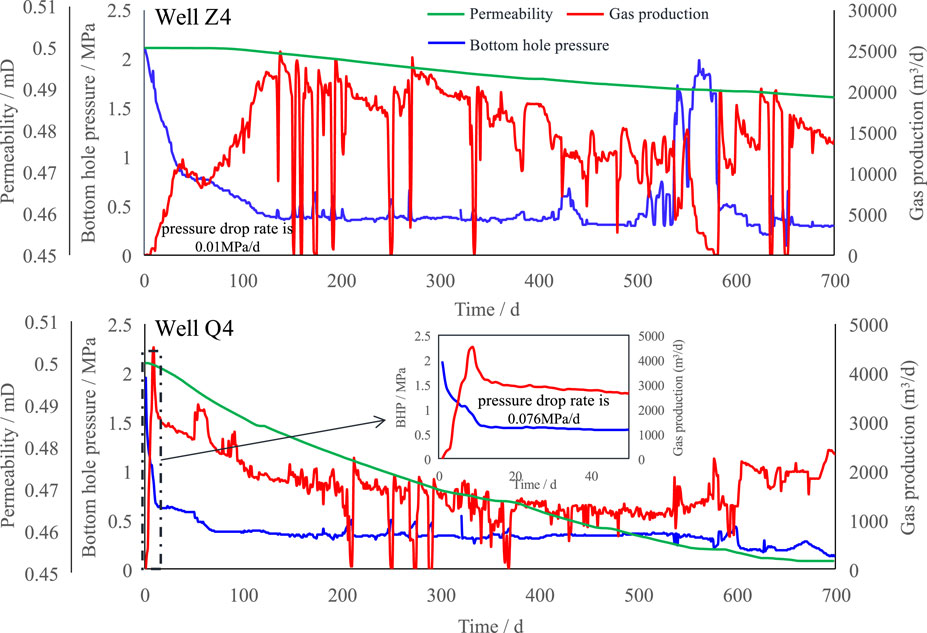
Figure 11. The production curves of the exceptional well Z4 and the potential well Q4.
4.3.3 Optimization method of pressure drop rate
The rate of drainage pressure drop in the early stage of CBM well production should not be excessively high, as this may lead to a reduction in desorption area and a significant decline in gas production potential. The production characteristics observed in Q4 well align with this particular pressure drop trend. The system of drainage with a large pressure drop velocity first and a small one later is beneficial to improve the gas production effect. The production characteristics of Well Z4 align with the observed pressure drop path, thereby enhancing its production performance. Subsequently, the underlying internal mechanism responsible for this phenomenon is discussed.
The seepage states under three different pressure drops are illustrated in Figure 12. The black solid line a represents the stage when the BHP reaches the critical desorption pressure. The yellow dotted line represents the pressure distribution after rapidly reducing the BHP from the state a, and the purple dotted line represents the pressure distribution after slowly reducing the BHP from the state a.
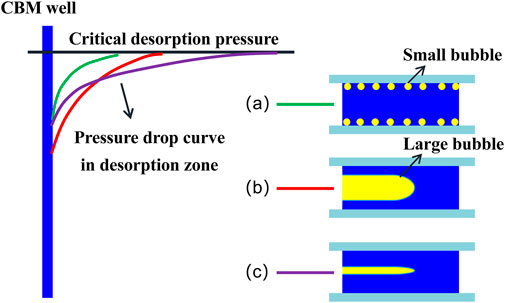
Figure 12. The seepage states under three different pressure drops (Yan et al., 2021).
The difference between the BHP and the critical desorption pressure is constrained for a, resulting in a limited amount of gas desorbed into the micro-fracture system. The majority of gas is predominantly stored on the surface of the micro-fracture as minute bubbles, which lack flowability but contribute to a reduction in effective flow area and weaken the flow ability of the fluid. However, the flow resistance in this case is consistently negligible, and the primary consequence of reducing BHP is an augmentation in gas production rather than an escalation in resistance near the bottom hole. Consequently, the reduction of BHP in this scenario exerts a positive influence on the expansion of desorption zone.
In scenario b, the decline in BHP continues at an accelerated rate, facilitating a sustained period of rapid production growth and reaches the peak in a short period of time (refer to Figure 13). However, it is important to note that the rapid decrease in BHP results in a significant release of desorption gas around the bottom hole, leading to gas-water two-phase seepage at the bottom hole, which will sharply increase the flow resistance in the near-well area, resulting in the difficulty of fluid flowing to the bottom hole from the distal coal seam (Wang et al., 2023). Therefore, the pressure drop is difficult to be transmitted to the distal end, resulting in the slow expansion of the desorption area, which is consistent with the production characteristics of Q4 well. The scenario c can be interpreted as a gradual and controlled decline in BHP following the relatively large BHP decline for a certain duration, namely scenario a. On one hand, this pressure drop mode hinders the increase of gas saturation in the near-wellbore region, mitigates the occurrence of gas lock phenomenon in the near-wellbore area, and facilitates smooth fluid flow to reach the bottom of the well, thereby promoting desorption area expansion. On the other hand, the BHP is still slightly decreased, the production pressure difference is constantly increased, and the average daily gas production will also increase, which will reduce the gas saturation of the coal seam to a certain extent, thus reducing the flow resistance of the coal seam (refer to Figure 13).
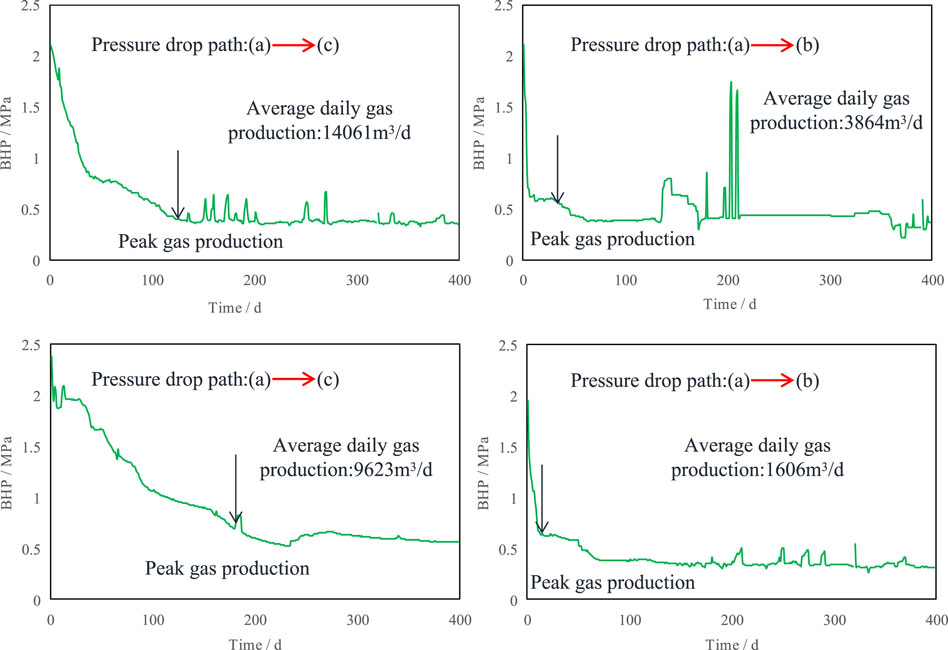
Figure 13. The seepage states under three different pressure.
Figures 14, 15 represent the reasonable value of the average pressure drop rate in the early stage of drainage in the study area analyzed from a statistical perspective. The correlation analysis reveals a logarithmic relationship between the pressure drop rate and the peak gas production volume during the initial production period. As the pressure drop rate gradually increases, there is a decrease in peak gas and water production. In the initial stage of gas well production, when the pressure drop rate exceeds 0.005 MPa/d, most wells exhibit a peak gas production of less than 10,000 m3/d; whereas when the pressure drop rate falls below 0.005 MPa/d, the peak gas production is generally greater than 13,000 m3/d. The well Z12, which exhibits the highest gas production in the P block, demonstrates an exceptionally minimal pressure drop during production, measuring only 0.00067 MPa/d. Moreover, it achieves a peak gas production rate of 52,316 m3/d and maintains a steady gas production rate of 43,000 m3/d. The initial decline rate of drainage pressure in most high production water wells is typically below 0.02 MPa/d, whereas wells with a decline rate exceeding 0.02 MPa/d exhibit limited peak water production, usually less than 10 m3/d. Therefore, to ensure stable and continuous gas production, the pressure drop rate should not be too fast in the early stage of production, and the average pressure drop rate should be controlled within 0.005–0.02 MPa/d.
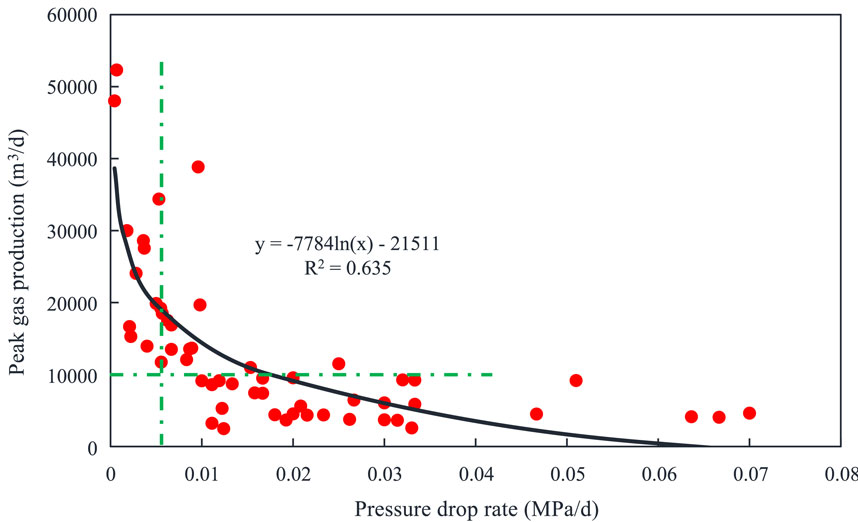
Figure 14. Correlation between pressure drop rate and peak gas production in early production stage.
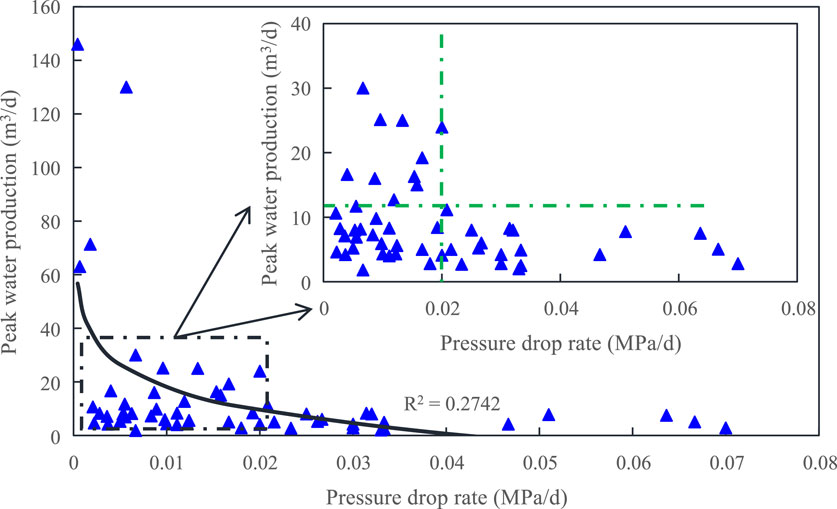
Figure 15. Correlation between pressure drop rate and peak water production in early production stage.
5 Conclusion
(1) Utilizing static and dynamic parameters, the SOM neural network is employed for the classification of CBM wells. The CBM wells in P Block’s No. 15 coal seam are categorized into three types: exceptional wells, potential wells, and inefficient wells. The exceptional well exhibits favorable geological conditions and a rational drainage system, thereby fully realizing its gas production potential. Conversely, the potential well possesses advantageous geological conditions but lacks an optimal drainage system, resulting in an underdeveloped gas production potential. Implementing certain measures could potentially transform them into exceptional wells. Lastly, the inefficient well is characterized by unfavorable geological conditions and limited gas production capacity.
(2) Poor reservoir conditions, high content of coal powder and discontinuous drainage system are the main causes of inefficient wells. Both exceptional wells and potential wells have good geological conditions. The main reason for the difference in productivity between the two is the different matching degree between drainage system and reservoir conditions. The pressure decline rate of most potential wells is excessively rapid during the early stage of drainage, leading to pressure-sensitive, velocity-sensitive and jiamin effect effects on coal reservoirs, resulting in damage to the reservoir and a gradual decrease in permeability that ultimately impacts gas production during later stages.
(3) A logarithmic relationship between the pressure drop rate and the peak gas production volume during the initial production period. In the initial stage of gas well production, when the pressure drop rate exceeds 0.005 MPa/d, most wells exhibit a peak gas production of less than 10,000 m3/d; the initial decline rate of drainage pressure in most high production water wells is typically below 0.02 MPa/d, whereas wells with a decline rate exceeding 0.02 MPa/d exhibit limited peak water production. Therefore, it is suggested that the average pressure drop rate in the early stage of drainage should be controlled within 0.005–0.02 MPa/d.
Data availability statement
The raw data supporting the conclusion of this article will be made available by the authors, without undue reservation.
Author contributions
XC: Writing–review and editing, Writing–original draft, Visualization, Validation, Supervision, Resources, Project administration, Methodology, Investigation, Funding acquisition, Formal analysis, Data curation, Conceptualization. YG: Formal Analysis, Methodology, Supervision, Writing–review and editing, Investigation. YM: Methodology, Resources, Writing–original draft, Writing–review and editing.
Funding
The author(s) declare financial support was received for the research, authorship, and/or publication of this article. This research was supported by the China Postdoctoral Science Foundation (2023M733916).
Acknowledgments
We would like to thank China Postdoctoral Science Foundation (2023M733916) for their support of this work. The authors also thank the reviewers for their valuable comments.
Conflict of interest
Authors XC, YG, and YW were employed by China National Offshore Oil Corporation Research Institute Co. Ltd.
Publisher’s note
All claims expressed in this article are solely those of the authors and do not necessarily represent those of their affiliated organizations, or those of the publisher, the editors and the reviewers. Any product that may be evaluated in this article, or claim that may be made by its manufacturer, is not guaranteed or endorsed by the publisher.
References
Bao, Y., Ju, Y., Yin, Z., Xiong, J., Wang, G., and Qi, Y. (2020). Influence of reservoir properties on the methane adsorption capacity and fractal features of coal and shale in the upper Permian coal measures of the South Sichuan coalfield, China. Energy Explor. Exploitation 38 (1), 57–78. doi:10.1177/0144598719877527
Bustin, R. M. (1997). Importance of fabric and composition on the stress sensitivity of permeability in some coals, northern Sydney basin, Australia: relevance to coalbed methane exploitation. AAPG Bull. 81 (11), 1894–1908. doi:10.1306/3b05c65e-172a-11d7-8645000102c1865d
Cai, Y., Pan, Z., Liu, D., Zheng, G., Tang, S., Connell, L. D., et al. (2014). Effects of pressure and temperature on gas diffusion and flow for primary and enhanced coalbed methane recovery. Energy Explor. Exploitation 32 (4), 601–619. doi:10.1260/0144-5987.32.4.601
Chen, S., Tang, D., Tao, S., Zhao, J., Li, Y., Liu, W., et al. (2016). Discussion about “critical depth” of deep coalbed methane in Zhengzhuang area, Qinshui Basin. J. China Coal Soc. 41 (12), 3069–3075.
Chen, S., Tang, D., Tao, S., Xu, H., Li, S., Zhao, J., et al. (2017). In-situ stress measurements and stress distribution characteristics of coal reservoirs in major coalfields in China: implication for coalbed methane (CBM) development. Int. J. Coal Geol. 182, 66–84. doi:10.1016/j.coal.2017.09.009
Chen, Y. X., Liu, D. M., Yao, Y. B., Cai, Y., and Chen, L. (2015). Dynamic permeability change during coalbed methane production and its controlling factors. J. Nat. Gas Sci. Eng. 25, 335–346. doi:10.1016/j.jngse.2015.05.018
Dickey, M. W. (2006). “Economic pumping technology for coalbed methane (CBM), stripper oil, and shallow gas well deliquification,” in SPE Eastern Regional Meeting, Canton, Ohio, USA, October, 2006.
Fu, H., Tang, D., Xu, T., Xu, H., Tao, S., Li, S., et al. (2017). Characteristics of pore structure and fractal dimension of low-rank coal: a case study of Lower Jurassic Xishanyao coal in the southern Junggar Basin, NW China. Fuel 193, 254–264. doi:10.1016/j.fuel.2016.11.069
Fu, X., Li, D., Qin, Y., Jiang, B., Wang, W., Li, G., et al. (2002). Experimental research of influence of coal matrix shrinkage on permeability. Journal of China University of Mining & Technology, 31(2): 129–131. doi:10.3321/j.issn:1000-1964.2002.02.005
Gao, J., Kong, D., Peng, Y., Zhou, Y., Liu, Y., and Zhu, W. (2023b). Pore-scale mechanisms and hysteresis effect during multi-cycle injection and production process in underground hydrogen storage reservoir. Energy 283, 129007. doi:10.1016/j.energy.2023.129007
Gao, J., Li, X., Cheng, G., Luo, H., and Zhu, H. (2023a). Structural evolution and characterization of organic-rich shale from macroscopic to microscopic resolution: the significance of tectonic activity. Adv. Geo-Energy Res. 10 (2), 84–90. doi:10.46690/ager.2023.11.03
Hou, C. H., Shi, J. T., Liu, C., Peng, L. S., Wang, S., Chang, Y. C., et al. (2018). Classification and evaluation method of coalbed methane wells in M block. Nat. Gas. Ind. 38 (S1), 74–79.
Ifrene, G., Irofti, D., Ni, R., Egenhoff, S., and Pothana, P. (2023). New insights into fracture porosity estimations using machine learning and advanced logging tools. Fuels 4 (3), 333–353. doi:10.3390/fuels4030021
Jiang, W., Zhang, P., Li, D., Li, Z., Wang, J., Duan, Y., et al. (2022). Reservoir characteristics and gas production potential of deep coalbed methane: insights from the no. 15 coal seam in shouyang block, Qinshui Basin, China. Unconv. Resour. 2, 12–20. doi:10.1016/j.uncres.2022.06.001
Kalteh, A. M., Hjorth, P., and Berndtsson, R. (2008). Review of the self-organizing map (SOM) approach in water resources: analysis, modelling and application. Environ. Model. Softw. 23 (7), 835–845. doi:10.1016/j.envsoft.2007.10.001
Kong, D., Gao, J., Lian, P., Zheng, R., Zhu, W., and Xu, Y. (2022). Characteristics of gas-oil contact and mobilization limit during gas-assisted gravity drainage process. Adv. Geo-Energy Res. 6 (2), 169–176. doi:10.46690/ager.2022.02.08
Kong, D., Gao, Y., Sarma, H., Li, Y., Guo, H., and Zhu, W. (2021). Experimental investigation of immiscible water-alternating-gas injection in ultra-high water-cut stage reservoir. Adv. Geo-Energy Res. 5 (2), 139–152. doi:10.46690/ager.2021.02.04
Kravchenko, J., and Lyerly, H. K. (2018). The impact of coal-powered electrical plants and coal ash impoundments on the health of residential communities. N. C. Med. J. 79 (5), 289–300. doi:10.18043/ncm.79.5.289
Lai, F., Li, Z., Fu, Y., and Yang, Z. h. (2013). A drainage data-based calculation method for coalbed permeability. J. Geophys. Eng. 10 (6), 065005. doi:10.1088/1742-2132/10/6/065005
Li, Z., Liu, D., Ranjith, P. G., Cai, Y., and Wang, Y. (2018). Geological controls on variable gas concentrations: a case study of the northern Gujiao Block, northwestern Qinshui Basin, China. Mar. Petroleum Geol. 92, 582–596. doi:10.1016/j.marpetgeo.2017.11.022
Liu, H., Sang, S., Xue, J., Lan, T., Xu, H., Ren, B., et al. (2018). Evolution and geochemical characteristics of gas phase fluid and its response to inter-well interference during multi-well drainage of coalbed methane. J. Petroleum Sci. Eng. 162, 491–501. doi:10.1016/j.petrol.2017.10.007
Lou, Y., Song, H., Yang, J., Huang, X., and Dong, H. (2013). Productivity equation of fractured well in CBM reservoirs. J. Nat. Gas Sci. Eng. 11, 39–45. doi:10.1016/j.jngse.2012.12.001
Lv, Y., Tang, D., Xu, H., and Luo, H. (2012). Production characteristics and the key factors in high-rank coalbed methane fields: a case study on the Fanzhuang Block, Southern Qinshui Basin, China. Int. J. Coal Geol. 96, 93–108. doi:10.1016/j.coal.2012.03.009
Moore, T. A. (2012). Coalbed methane: a review. Int. J. Coal Geol. 101, 36–81. doi:10.1016/j.coal.2012.05.011
Ni, R., Ling, K., and Afari, S. (2023). Different ways to approach shale reservoirs’ CO2 storage potential in America. Heliyon 9, e18458. doi:10.1016/j.heliyon.2023.e18458
Nie, B. S., He, X. Q., and Wang, E. Y. (2000). Mechanism and modes of gas diffusion in coal seams. China Saf. Sci. J. 10 (6), 24–28. doi:10.3969/j.issn.1003-3033.2000.06.006
Palmer, I., and Mansoori, J. (1998a). How permeability depends on stress and pore pressure in coalbeds: a new model. SPE Reserv. Eval. Eng. 1 (06), 539–544. doi:10.2118/52607-pa
Palmer, I., and Mansoori, J. (1998b). How permeability depends on stress and pore pressure in coalbeds: a new model. SPE Reserv. Eval. Eng. 1 (06), 539–544. doi:10.2118/52607-pa
Peng, C., Zou, C., Zhou, T., Li, K., Yang, Y., Zhang, G., et al. (2017). Factors affecting coalbed methane (CBM) well productivity in the Shizhuangnan block of southern Qinshui basin, North China: investigation by geophysical log, experiment and production data. Fuel 191, 427–441. doi:10.1016/j.fuel.2016.11.071
Qin, S., Song, Y., Tang, X., and Fu, G. (2005). The mechanism of the flowing ground water impacting on coalbed gas content. Chin. Sci. Bull. 50, 118–123. doi:10.1007/bf03184093
Qiu, L., Zhu, Y., Liu, Q., Guo, M., Song, D., and Wang, A. (2023). Response law and indicator selection of seismic wave velocity for coal seam outburst risk. Adv. Geo-Energy Res. 9 (3), 198–210. doi:10.46690/ager.2023.09.07
Sang, S., Liu, H., Li, Y., Li, M. x., and Li, L. (2009). Geological controls over coal-bed methane well production in southern Qinshui basin. Procedia Earth Planet. Sci. 1 (1), 917–922. doi:10.1016/j.proeps.2009.09.142
Shi, J., and Durucan, S. (2005a). A model for changes in coalbed permeability during primary and enhanced methane recovery. SPE Reserv. Eval. Eng. 8 (04), 291–299. doi:10.2118/87230-pa
Shi, J., Wu, J., Fang, Y., Lu, J., Hou, C., Li, X., et al. (2021). A new coal reservoir permeability model considering the influence of pulverized coal blockage and its application. Nat. Gas. Ind. B 8 (1), 67–78. doi:10.1016/j.ngib.2020.06.004
Shi, J. Q., and Durucan, S. (2005b). A model for changes in coalbed permeability during primary and enhanced methane recovery. SPE Reserv. Eval. Eng. 8 (04), 291–299. doi:10.2118/87230-pa
Wang, Y., Dai, Z., Chen, L., Shen, X., Chen, F., and Soltanian, M. R. (2023). An integrated multi-scale model for CO2 transport and storage in shale reservoirs. Appl. Energy 331, 120444. doi:10.1016/j.apenergy.2022.120444
Wang, Y., Sun, Q., Chen, F., and Wang, M. (2024b). Multiscale model for hydrogen transport and storage in shale reservoirs. SPE J., 1–27. doi:10.2118/219472-pa
Wang, Y. W., Dai, Z. X., Wang, G. S., Chen, L., Xia, Y. Z., and Zhou, Y. H. (2024a). A hybrid physics-informed data-driven neural network for CO2 storage in depleted shale reservoirs. Petroleum Sci. 21 (1), 286–301. doi:10.1016/j.petsci.2023.08.032
Yan, X., Zhang, S., Tang, S., Li, Z., Guan, W., Zhang, Q., et al. (2021). A prediction model for pressure propagation and production boundary during coalbed methane development. Energy & Fuels 35 (2), 1219–1233. doi:10.1021/acs.energyfuels.0c03354
Yi, Y. X., Tang, S. H., Zhang, S. H., Yan, X. L., Wang, K. F., Dang, F., et al. (2019). Analysis on the type of reservoir pressure drop and drainage control of coalbed methane well in the southern block of Shizhuang. Coal Geol. Explor. 47 (05), 118–126.
Yuanyuan, K., Xianjie, S., and Caifeng, W. (2012). Production characteristics and affecting factors of high—mid rank coalbed methane wells: taking Fanzhuang and Hancheng mining areas as examples. Petroleum Explor. Dev. 39 (6), 773–777. doi:10.1016/s1876-3804(12)60103-7
Zhu, H., Huang, C., Ju, Y., Bu, H., Li, X., Yang, M., et al. (2021). Multi-scale multi-dimensional characterization of clay-hosted pore networks of shale using FIBSEM, TEM, and X-ray micro-tomography: implications for methane storage and migration. Appl. Clay Sci. 213, 106239. doi:10.1016/j.clay.2021.106239
Keywords: coalbed methane, permeability, production characteristics, high-ranking coal seam, Qinshui Basin
Citation: Chen X, Gao Y and Wang Y (2024) Production characteristics and influencing factors of coalbed methane wells: a case study of the high-ranking coal seam in the southeastern Qinshui Basin, China. Front. Earth Sci. 12:1401455. doi: 10.3389/feart.2024.1401455
Received: 15 March 2024; Accepted: 26 April 2024;
Published: 22 May 2024.
Edited by:
Hongjian Zhu, Yanshan University, ChinaReviewed by:
Qitao Zhang, The Pennsylvania State University (PSU), United StatesYanwei Wang, China University of Geosciences, China
Copyright © 2024 Chen, Gao and Wang. This is an open-access article distributed under the terms of the Creative Commons Attribution License (CC BY). The use, distribution or reproduction in other forums is permitted, provided the original author(s) and the copyright owner(s) are credited and that the original publication in this journal is cited, in accordance with accepted academic practice. No use, distribution or reproduction is permitted which does not comply with these terms.
*Correspondence: Yaqing Wang, NjQ0NjQ2NDM3QHFxLmNvbQ==