- Department of Earth and Atmospheric Sciences, University of Houston, Houston, TX, United States
The low-frequency content of seismic waves in exploration is of substantial value as it can benefit imaging and inversion by providing deeper penetration, broader-band energy, and wavelet stability. However, characterizing the factors contributing to low frequencies (the seismic source, response of the receiver, and spectral signal-to-noise) and their effects may be complicated. The Hussar, Alberta survey, conducted by the CREWES Project at the University of Calgary and used here, addresses this challenge with a range of sources and receiver types. We further analyze the low-frequency content of the Hussar data using surface waves - because of their significant coherent low-frequency energy. The multichannel analysis of surface waves (MASW) method is used. To improve accuracy, a nonlinear approach is applied to extract dispersion properties, overcoming the limitations of conventional methods at low frequencies. This allows for precise phase velocity measurements across frequencies and assesses the frequency content of different source-receiver type combinations based on surface-wave coherence. The extracted dispersion properties were validated by comparing the dispersion curves estimated using Vs from traveltime tomography and well-logging data. The survey tested 2 kg dynamite in addition to vibroseis sources with low-dwell and linear sweeps. The receivers evaluated included Vectorseis accelerometers, as well as 10 and 4.5 Hz geophones. Our dispersion results indicate that all source-receiver combinations contain considerable surface-wave energy down to about 2 Hz. The inverted 1-D Vs models provide Vs estimates to about 800 m, consistent with results from S-wave tomography and shear logging. Dynamite produced more low-frequency energy in surface waves than vibroseis sources, extending below 1.5 Hz. Low-dwell sweeps showed clearer coherence in surface waves at low frequencies than linear sweeps. Of the receivers tested, the 4.5 Hz geophone showed higher sensitivity to low frequencies than both the Vectorseis accelerometer and the 10 Hz geophone. Although the Vectorseis accelerometer recorded more coherent low-frequency surface waves than the 10 Hz geophone, its signals were affected by some instrument noise. Analyzing surface-wave energy and coherency to assess low-frequency content can complement other types of spectral analysis.
1 Introduction
Generation and analysis of low-frequency in seismic exploration have gained prominence due to their ability to benefit seismic imaging and interpretation with deeper penetration, more stable wavelets, assistance in full-waveform inversion, and more accurate well logging (e.g., Martin and Stewart, 1994; Goloshubin et al., 2006; Ten Kroode et al., 2013; Dellinger et al., 2016; Li and Demanet, 2016; Shang et al., 2023). Low frequencies are also of significant benefit in surface wave analysis on account of their greater depth penetration (Park et al., 2005).
Surface wave analysis estimates the shear velocity (Vs) in the near-surface via their velocity dispersion properties. Variations in density and P- and S-wave velocities with depth cause surface waves to propagate at different velocities for different frequencies (Park et al., 1998). Lower frequencies, which correspond to longer wavelengths, can theoretically penetrate deeper layers. Currently, the Multichannel Analysis of Surface Waves (MASW) method is widely employed for this purpose. It extracts dispersion properties from seismic data using transformation techniques, such as f-k and tau-p transforms. At different common midpoint (CMP) locations, 1-D Vs models are inverted from these dispersion properties, which then can be used to construct a 2-D or 3-D Vs model. Many successful examples using the MASW method to estimate Vs change in the near-surface have been published (Lin et al., 2004; Ivanov et al., 2006; Wu, 2022). However, as frequency decreases, these transformation techniques lose sensitivity to dispersion properties (Zheng and Hu, 2017). To address this, we applied the Nonlinear Signal Comparison (NLSC) method, as proposed by Zheng and Hu (2017), to extract dispersion properties in MASW.
This study uses the MASW method to evaluate the low-frequency content of different source-receiver combinations in an acquisition test conducted by the University of Calgary’s CREWES Project in Hussar, Alberta (Margrave et al., 2012). Surface wave analysis can be a reasonable reference or complement for assessing the useable frequency content of other signals in related studies. First, surface waves are often the strongest signals. A vertical source, such as a vibroseis, may convert more than half of its energy into surface waves (Woods, 1968). Additionally, surface waves experience less energy loss from geometrical spreading because they propagate along the surface. Finally, the frequency content of the recorded body and surface waves is influenced by the source wavelet. Although body waves are typically used to estimate the source wavelet, surface waves can also serve this purpose effectively (Gao and Pan, 2018). Therefore, analyzing the frequency content of surface waves may offer a reliable benchmark for evaluating body-wave signals, such as P-wave reflections.
In the following sections, an introduction to the Hussar data sets is followed by an overview of the methods. Then, the surface wave analysis results are shown and compared with those from other measurements (shear logging and S-wave tomography). Finally, we will assess the low-frequency signals in 12 source-receiver combinations and cross-verify the evaluation results with forward estimates using tomography results and well-logging data.
2 Low-frequency data from Hussar, Alberta
The dataset used in this study was obtained from a seismic experiment conducted by the CREWES Project in collaboration with Husky Energy, Geokinetics, and INOVA (Margrave et al., 2012). The primary objective of the experiment was to study low-frequency seismic reflections and test inversion methods. The dataset comprises recordings from a 4.5 km multi-component seismic line near Hussar, Alberta, passing through three wells, as shown in Figure 1. Five wells in the site have measurements in acoustic velocity, bulk density, and gamma-ray, but only Well 12–27 has a shear velocity measurement.
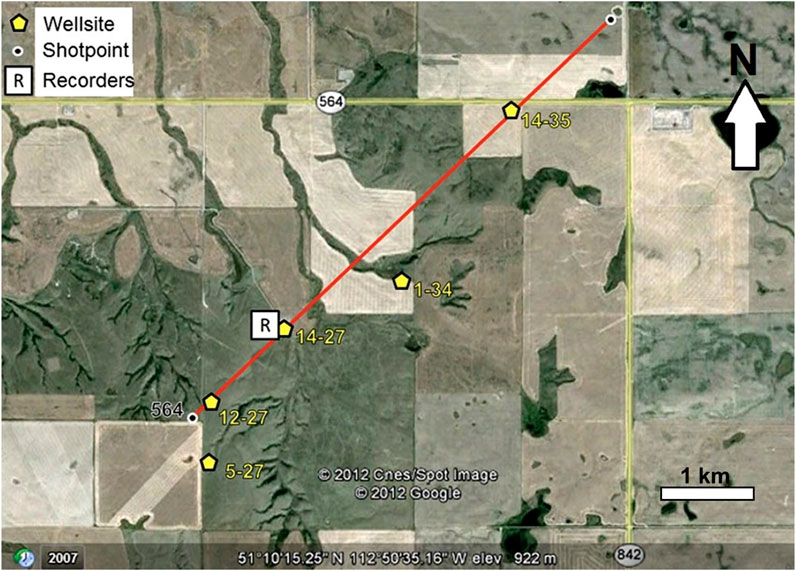
Figure 1. Map of the 4.5 km Hussar seismic line with five wells. The red line represents the seismic line where receivers and sources are located. Twelve source-receiver combinations are tested to study signal quality at low frequencies. Receiver types include accelerometers, geophones, and seismometers, and source types are dynamite and vibroseis. Seismic recorders are positioned near the southwest end of the line. Five wells (yellow pentagons) provide acoustic velocity, bulk density, and gamma-ray measurements near the line, with only Well 12–27 including shear logging (from Margrave et al., 2012).
2.1 Sources and receivers
Various source types were utilized in the experiment, including 2-kg dynamite and vibroseis sources, along with five types of receivers. A specifically modified low-frequency vibrator, the INOVA AHV-IV Model 364 (hereinafter referred to as “INOVA 364”), and a more conventional vibrator, the Eagle Failing Model Y2400 (hereinafter referred to as “Failing”), were used. Both vibrators were operated with specially designed low-dwell functions, allocating more time in the frequency range below 8 Hz. The sweeps were 24 s long, ranging from 1 to 100 Hz. The low-dwell sweep for the INOVA 364 and Failing vibrators spent the first 10 and 15 s on linear sweeping from 1 to 8 Hz. Within the remaining sweep time, the sweeping continued to increase to 100 Hz linearly. A linear sweep from 1 to 100 Hz was also conducted on the INOVA 364 for comparison. Three lines were completely deployed with Vectorseis accelerometers, 10 Hz, or 4.5 Hz geophones. The fourth line, a hybrid configuration, included broadband Trillium seismometers and 10 Hz geophones, spaced at 200 and 20 m, respectively. The fourth line is not discussed in this study due to the inappropriate spacing of the Trillium seismometers for the MASW method. In total, the dataset comprises 12 vertical-component lines.
2.2 Spectral analysis
Initial spectral analysis on the reflection signals of the raw data reveals varying levels of low-frequency energy (Margrave et al., 2012). All four sources in the experiment generated substantial low-frequency energy. The 2-kg dynamite, placed at a depth of 15 m in a single hole, exhibited the highest strength, followed by the INOVA 364 low-dwell, the Failing low-dwell, and the INOVA 364 linear, ranked in decreasing terms of their low-frequency energy output. The Vectorseis accelerometers recorded signals below 1 Hz and had a more sensitive response than the geophones. The 10 and 4.5 Hz geophones performed well down to their resonant frequencies, with signal recovery extending to around 1.5 Hz after inverse filtering for instrument response.
All receivers captured clear surface wave signals, as indicated by the arrows in Figure 2. The three panels, displayed from top to bottom, show shot gathers recorded by the Vectorseis accelerometers, 10 Hz geophones, and 4.5 Hz geophones. All three shot gathers were recorded using the same dynamite source. Because the panels are presented at the same scale, it is evident that the 4.5 Hz geophones recorded the strongest surface waves, as seen in their higher amplitudes in the time domain.
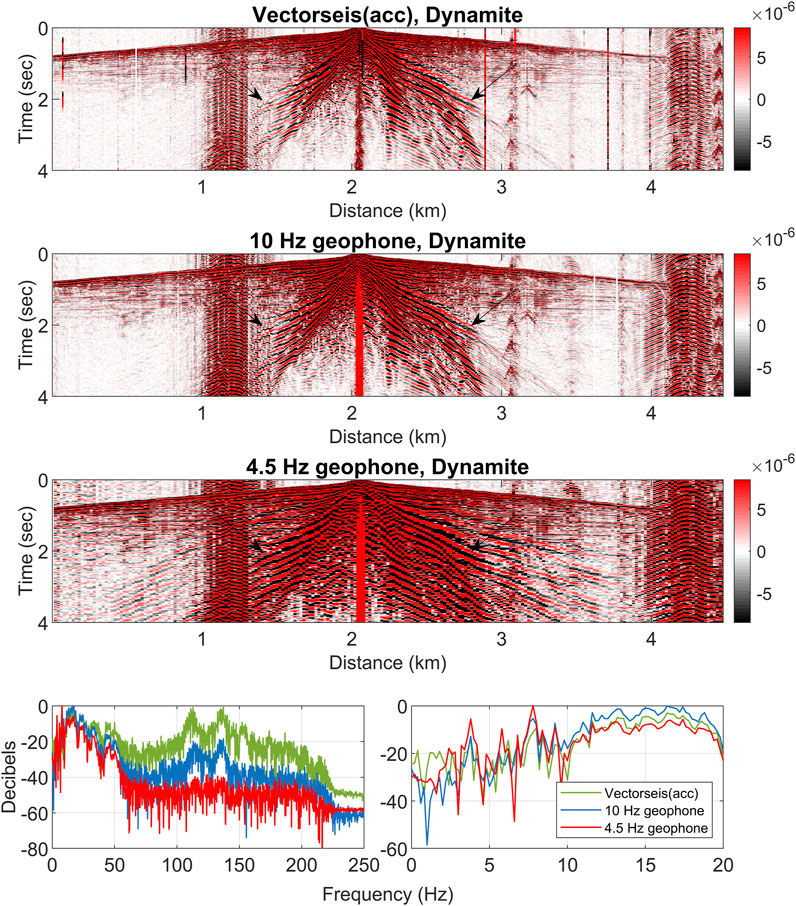
Figure 2. Seismic Data and Spectral Analysis for Shot Point 321. Data generated using 2 kg of dynamite and recorded by three types of receivers, including Vectorseis accelerometers, 10 Hz geophones, and 4.5 Hz geophones. The arrows indicate surface waves. In the time domain, the 4.5 Hz geophones exhibit the most apparent surface waves, followed by the Vectorseis accelerometers and the 10 Hz geophones. The Spectral analysis results with an enlarged view between 0 and 20 Hz. Each spectrum is normalized by its maximum energy. The Vectorseis accelerometers show the strongest energy below 3 Hz, possibly due to instrument noise. Noise from human activity around 4,500 m caused an energy increase between 100 and 150 Hz.
The two bottom panels in Figure 2 display the spectral analysis of the shot gathers. The left panel shows the full frequency range from 0 to 250 Hz, while the right panel focuses on frequencies below 20 Hz. In the spectral analysis of surface waves, the Vectorseis accelerometers showed the highest energy below 3 Hz after each spectrum was normalized to its maximum energy. However, it remains uncertain whether this increase in spectral energy is due to noise or actual source signals. Margrave et al. (2012) deduced that the Vectorseis accelerometers exhibit an increase in instrument noise below 3 Hz based on spectral analysis results, though this has not been verified.
Additionally, human activity around 4,500 m introduced noise, which raised the energy between 100 and 150 Hz, making it difficult to distinguish noise from actual signals in the spectrum. This challenge highlights the limitations of using spectral analysis alone to evaluate frequency content, as it does not allow us to ignore noise energy. Therefore, we aim to investigate whether assessing frequency content through surface wave coherence could address this limitation.
3 Methodology
Active surface-wave methods generally involve three main steps: acquisition, processing, and inversion. During the processing stage, the primary objective is to extract dispersion properties from seismic data (i.e., velocity versus frequency). Their quality significantly influences the accuracy of the inverted Vs models. In the MASW method, common approaches for extracting dispersion properties include the phase-shift method (Park et al., 1999), f-k transform (Serdyukov et al., 2019), Radon transform (Ivanov et al., 2017), and tau-p transform (McMechan and Yedlin, 1981). However, these methods tend to lose sensitivity to phase changes as frequency decreases (Zheng and Hu, 2017). To maintain high sensitivity to phase shifts at low frequencies, we employed the NLSC method within the MASW processing framework.
In the inversion stage, we then estimated a 1-D Vs model using the extracted dispersion curve (Park et al., 2007). The phase velocities at different frequencies correspond to different wavelengths, resulting in variations in penetration depth. This allows low-frequency signals to sense deeper layers. The 1-D velocity models were inverted by fitting dispersion curves from both extracted data and forward estimates.
3.1 Multi-channel NLSC method
The NLSC method, proposed by Zheng and Hu (2017), estimates phase shifts consistently across different frequencies. It can effectively reduce sensitivity issues in dispersion plots at low frequencies. Following the approach of Hu et al. (2019), we selected seismic data from receiver pairs with the same CMP within a specific spacing range. We then used the NLSC method to generate dispersion plots for each pair in this range and then stacked these plots together. This stacking enhances mode identification and suppresses noise. Given an angular frequency
where
in which
The stacked dispersion plot in Equation 1 can be further normalized by its maximum and minimum values and ranges from 0 to 1, as shown in Equation 4. For detailed derivatives, please refer to Zheng and Hu (2017) and Hu et al. (2019).
3.2 Calculation and inversion of dispersion curves
We follow the dispersion inversion approach of Haney and Tsai (2017). The forward modeling of Rayleigh wave dispersion is calculated using the finite-element method, also known as the thin-layer method (Kausel, 2005). Incorporating the solution of wavenumber
where
To invert a 1-D Vs model, we first built an initial model with thicknesses defined from wavelengths of the extracted dispersion curve. Each wavelength consists of at least five layers above its sensitivity depth. The depth of the models is designed to be twice the maximum wavelength. Then, we used the weighted-damped least-square inversion developed by Haney and Tsai (2017) to iteratively update the initial Vs model. At fixed frequency, the perturbation in phase velocity caused by model perturbations can be represented as Equation 6.
in which
Assuming Poisson’s ratio and density to be fixed, Equation 6 becomes a shear-wave phase velocity kernel. This enables us to iteratively update the initial Vs model using the misfit between observed and forward modeling dispersion curves. We assume constant Poisson’s ratio (and density) during the inversion and use constant Vs value in the initial model. To avoid falling into local minimum, we performed multiple inversions with different Poisson’s ratio and initial Vs.
4 Results and discussion
In Section 4.1, we present surface wave analysis results at Well 12–27 and compare them with Vs models from traveltime tomography and shear logging. This comparison serves as a reference to understand how different source-receiver combinations affect Vs estimates.
Section 4.2 shows the evaluation results through dispersion plots. Because signals below 2 Hz are not clear in these plots, we use a forward-estimated dispersion curve as an evaluation standard. This curve is calculated using velocity data from tomography and well logging, as well as density log data. Finally, we provide a summary comparison with results from spectral analysis.
4.1 Surface wave analysis results
We present dispersion plots for 12 source-receiver combinations from the Hussar data. The manually picked and forward-estimated dispersion curves are also depicted on the dispersion plots. Then, we compare the inverted Vs models with other measurements to validate the accuracy of the dispersion properties. Because shear logging begins at a depth of 200 m, we also performed S-wave traveltime tomography to estimate Vs variations above this depth.
4.1.1 Dispersion plots
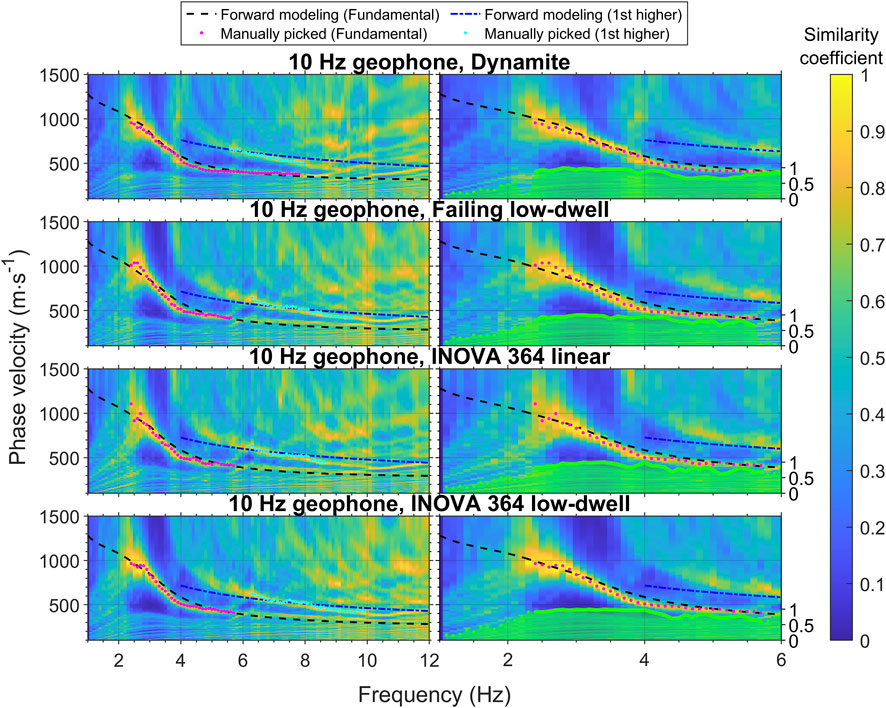
The dispersion plots of the same receiver types are compared in Figures 3–5 for the Vectorseis accelerometer, 10 Hz geophone, and 4.5 Hz geophone, respectively. They are generated using the stacked NLSC results at a distance less than 100 m from the CMP. The CMP location is at Well 12–27 for later comparison with shear logging. The seismic data from the receiver pairs with the CMP located at Well 12–27 were used to compute
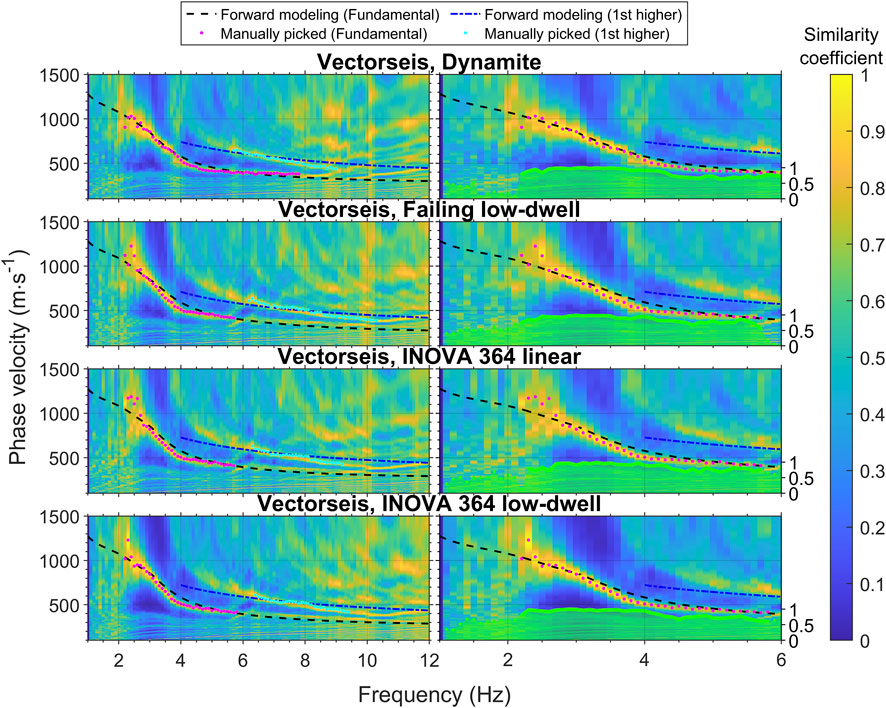
Figure 3. (Left) Dispersion plots of Vectorseis accelerometers with four different source types. The dotted lines are forward calculated using well logging and tomography results. The fundamental and first higher modes are shown in black and blue, respectively. Instrument noise is evident below 2 Hz. (Right) Similarity coefficients of the fundamental-mode surface wave, with an enlarged view of the left-column figures at low frequencies.
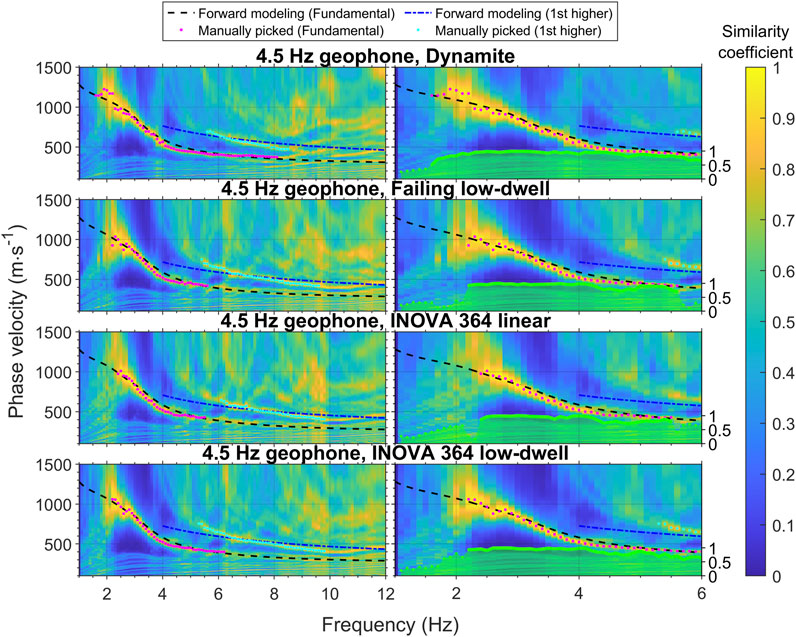
Figure 5. Dispersion plots of the 4.5 Hz geophones with four different source types. Dynamite produced the strongest low-frequency energy in the 4.5 Hz geophone recordings among all tested combinations.
In the plots, the manually picked dispersion curves are overlaid, with the fundamental mode shown in magenta and the first higher mode in cyan. We selected the phase velocity with the highest similarity coefficient at each frequency as our picking criterion. This similarity coefficient, which helps assess signal quality, is similar to the normalized amplitude used in the phase-shift method (Park et al., 1998). Below the curves in the enlarged figures at low frequencies, we display the similarity coefficients for the fundamental mode. Solid green lines represent the coefficients from the manually picked curves, while dotted lines show the coefficients in frequency ranges where dispersion properties are unclear and are instead estimated from forward-modeled dispersion curves. More details on how these forward estimates were computed will be explained in Section 4.2.1.
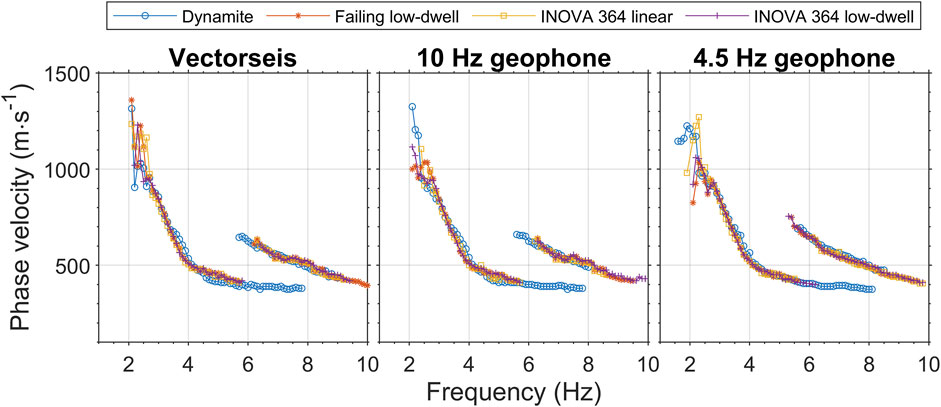
Figure 6 presents an overall comparison, demonstrating a strong agreement in the manually picked dispersion curves above 3 Hz. The fundamental-mode dispersion curves span the 2–8 Hz range, and the first higher mode spans 5–10 Hz. Both modes were used for Vs inversion. We further investigate how changes in these dispersion curves, especially at low frequencies, impact the inverted 1-D Vs model.
4.1.2 Inversion results
In our dispersion inversion, we used multiple initial models to improve the uniqueness of inversion (Foti et al., 2018). The initial constant Vs models ranged from 1,200 to 1,700 m/s with increments of 100 m/s, and Poisson’s ratio ranged from 0.3 to 0.45 with increments of 0.1. Figure 7 shows the inversion results with the lowest misfit values. The three panels from left to right correspond to the three types of receivers displayed in Figures 3–5. We also show the ranges of ± one standard deviation. Interestingly, the inversion results remained generally similar across different source and receiver types.

Figure 7. Comparison of dispersion inversion results and well logging from Well 12–27. The three panels on the left compare surface wave inversion results with S-wave velocity measurements and the tomography model. The fourth panel shows sensitivity kernels of 2- to 6-Hz surface waves. The fifth panel displays acoustic and density logs along with Vp from tomography. The leftmost panel includes the gamma-ray log plotted with Poisson’s ratio calculated from well logging and tomography models. Corresponding formation tops at the study site are shown in all panels.
The fourth panel in Figure 7 shows the average sensitivity kernels for phase velocities between 2 and 6 Hz. The dispersion inversion results are closely related to the sensitivity depths of the surface waves. Phase velocities at different frequencies are most sensitive to Vs changes at specific depths. Their Vs sensitivity decreases as the depth moves away from these depths. In this study, the maximum sensitivity depth is approximately 300 m, attributed to the 2-Hz signal. Below 300 m, Vs can still be estimated, but surface wave sensitivity to Vs change continues to decrease until about 800 m. Notably, the low-frequency part (2 Hz–3 Hz) covers a larger range of depths than higher frequencies (above 3 Hz).
4.1.3 Comparison with other Vs measurements
To evaluate the accuracy of the dispersion analysis results, we conducted tomography for both P- and S-waves. The first arrival times of P- and S-waves were determined from the vertical and horizontal components, respectively, as illustrated in Figure 8. We used dynamite as the source and 10 Hz geophones as receivers for this process. During the traveltime inversion, we performed forward estimation using Fortran code developed by Qin et al. (1992). The initial model was designed to be 1 km deep with lateral and vertical grid sizes same as the receiver spacing. For the P-wave velocity (Vp) inversion, initial velocities increased with depth from 500 to 4,000 m/s, and these values were halved for the Vs inversion. The initial models were iteratively updated to minimize arrival time misfits using the steepest descent method. The velocity updating ended when the root-mean-square (RMS) error approached a quarter of the shortest period. The final tomography results are displayed in Figure 9.
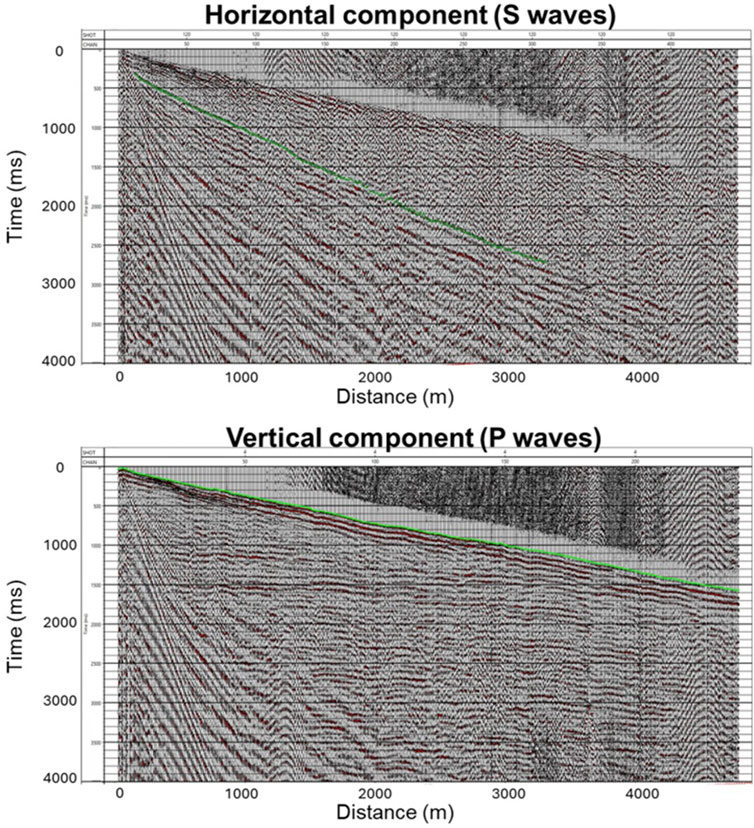
Figure 8. Four-second long shot gather on the vertical and horizontal components with manually picked first arrival times of (Top) S-waves and (Bottom) P-waves. The source is dynamite and the receivers are 10 Hz geophones.
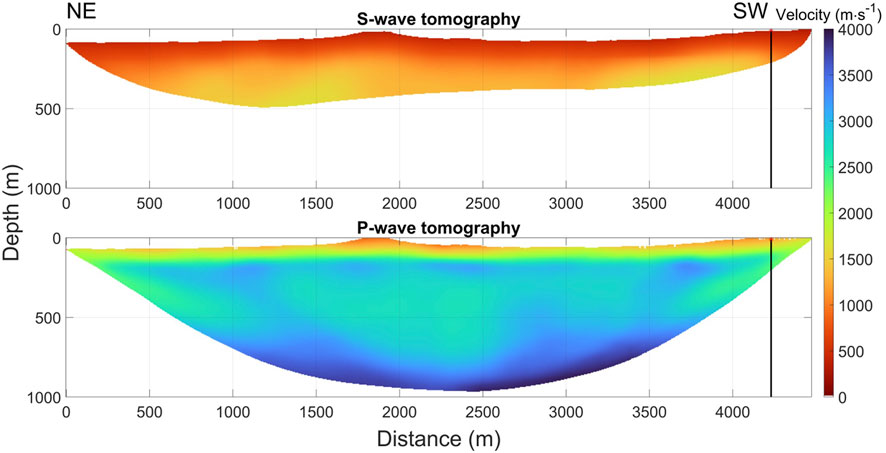
Figure 9. (Top) S-wave and (Bottom) P-wave travel time tomography models. Black lines on the tomography models indicate the location of Well 12–27.
The three panels on the left in Figure 7 compare the dispersion inversion results at the well location with the 1-D Vs models from traveltime tomography and shear logging. The two panels on the right display additional measurements from Well 12–27, including Vp, density, and gamma-ray logs. We identified formation tops according to Eberth and Brman (2012). Poisson’s ratio was calculated using the velocity data from both the tomography results and well logging. The Vs models show close correspondence overall. Due to the geometry of the survey, S-waves only reach a depth of 200 m at the well location, as indicated by the Vs model from the tomography result (red line) in the left three panels. Fortunately, the well provides Vs data (gray line) starting from 200 m, enabling a comparison of Vs models in deeper layers.
We observed that uncertainty in the dispersion inversion increases with depth due to fewer overlapping frequency kernels at greater depths. Above 300 m, the inverted Vs shows a smaller standard deviation and provides more detailed Vs information than traveltime tomography. However, below 300 m, the standard deviation starts to increase, and the inverted Vs loses some detail visible in the shear logging. For a more detailed analysis of the low-frequency range, we zoomed in on the depth range of shear logging and quantitatively compared the Vs from the dispersion inversion and shear logging.
Figure 10 presents a comparison of smoothed shear logging and the Vs inversion results across different source-receiver combinations. The smoothed shear logging data, referred to as ‘blocked shear logging,’ has the same layer thickness as the 1-D models from the dispersion inversion, with slowness smoothed to keep traveltime unchanged in each layer. The receiver types shown in Figure 10, from left to right, correspond to those in Figures 3–5. Among the source types, the dynamite source generates Vs results that most closely align with the shear logging, possibly suggesting it produced the most coherent low-frequency signals. Further quantitative analysis was performed to assess differences in inversion results across receiver types.
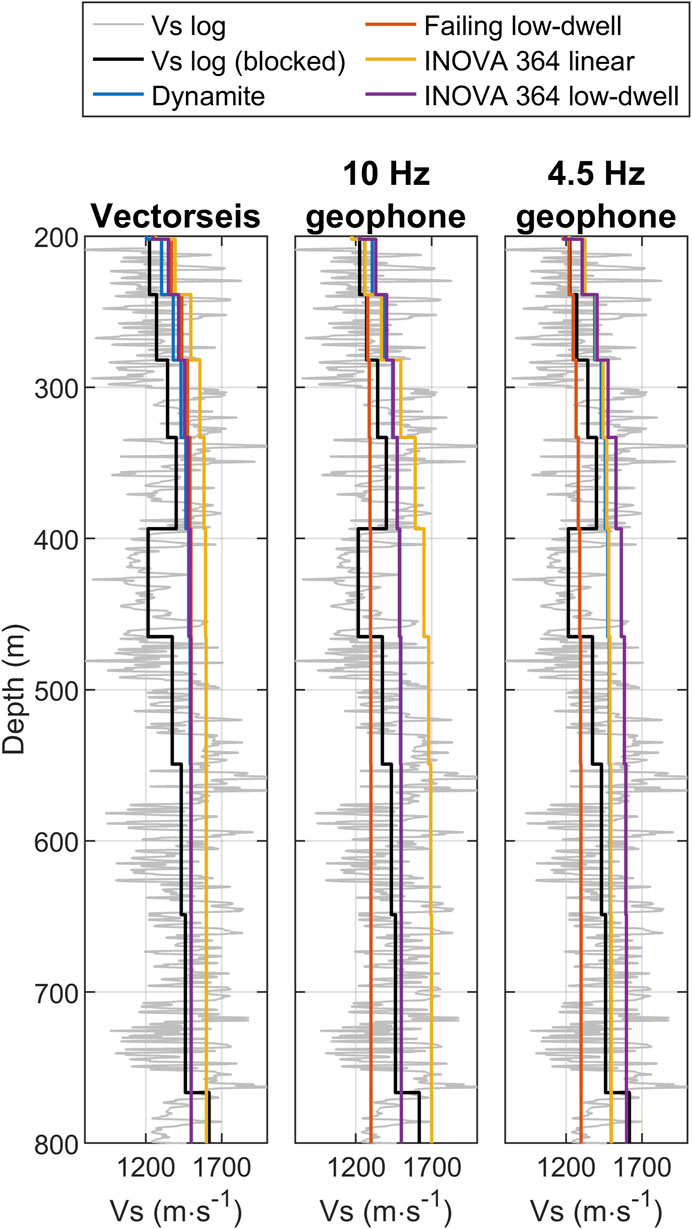
Figure 10. Zoomed images of dispersion inversion results. The blocked shear logging is compared with the Vs inversion results of different source-receiver combinations.
To access the accuracy of Vs estimates derived from low-frequency signals, we computed the RMS difference between the blocked shear logging and inverted Vs models. Table 1 presents these differences for depths ranging from 200 to 800 m. Among all receiver types, seismic signals generated by dynamite sources exhibit the closest alignment with shear logging, showing the smallest differences. This is followed by signals from low-dwell and linear sweep sources. Notably, the combination of 4.5 Hz geophones with the dynamite source resulted in the smallest difference, 121.87 m/s.
Overall, surface wave analysis can effectively estimate continuous Vs changes with depth, reaching nearly 1 km. In shallow layers (above 200 m), the inverted Vs can provide more detailed results than Vs tomography. In deeper layers (between 200 and 800 m), the accuracy of Vs estimates may vary based on the types of sources and receivers used. However, the maximum RMS difference from shear logging may be less than 250 m/s. Although this difference can vary from site to site, surface wave analysis remains a valuable supplement for estimating Vs in deep layers.
4.2 Low-frequency content evaluation
The manually picked dispersion curves become inconsistent below 3 Hz, as shown in Figure 6. To evaluate the frequency content in this range, we first forward estimated dispersion curves, extending the frequencies down to 1 Hz using tomography results and logging data. Next, we assessed the low-frequency signals from different source-receiver combinations and analyzed how their quality varies with frequency on the dispersion plots. Finally, we compared the results of our surface wave analysis with the spectral analysis of reflections to discuss the differences between the two evaluation approaches.
4.2.1 Forward estimation of dispersion curves
We forward estimated dispersion curves to gain insights into potential trends in the dispersion curves below 3 Hz. Our evaluation of low-frequency content primarily focused on the fundamental mode of Rayleigh waves. To accurately calculate their phase velocities below 3 Hz, we replaced our dispersion inversion results for depths greater than 200 m with Vs values from shear logging. We then forward estimated the fundamental-mode dispersion curves of the Rayleigh waves using the modified Vs models along with Vp, density, and Poisson’s ratio data obtained from tomography and well logging. Figures 3–5 illustrate the forward-estimated curves as black dotted lines.
4.2.2 Evaluation results
We evaluated the low-frequency content using the similarity coefficient and the difference between the picked and forward-estimated dispersion curves. Figure 3 presents the dispersion plots of Vectorseis accelerometers for the four different source types. The surface wave signals extend down to nearly 2 Hz. Below 2 Hz, a high similarity coefficient is scarcely visible. Between 2 and 3 Hz, the dynamite source exhibits the highest similarity coefficients, followed by the INOVA 364 low-dwell, the Failing low-dwell, and the INOVA 364 linear. This ranking of low-frequency signal quality, based on the similarity coefficient, aligns with the accuracy of the dispersion curves. Within the 2–3 Hz range, the phase velocities picked for the dynamite source closely match the forward estimates, while the two low-dwell sweeps start to diverge slightly, and the linear sweep diverges even more. Below 2.5 Hz, the picked phase velocities increasingly deviate from the forward estimates.
Figure 4 displays similar plots for the four source types recorded by the 10 Hz geophones. While the same source effects are observed, the lowest frequency recorded is around 2.5 Hz, and the overall similarity coefficients below 2 Hz are lower than those shown in Figure 3. This suggests that the instrument noise of the Vectorseis accelerometers may affect the low-frequency signals. Figure 5 resembles Figures 3, 4, with the exception that the receivers are the 4.5 Hz geophones. The combination of the dynamite and the 4.5 geophone shows the most apparent low-frequency signals among the receivers and sources tested, with dispersion curves fitting well with the forward estimates. Among the other sources, the two low-dwell sweeps generated stronger signals between 2 and 3 Hz than the linear sweep. The lowest frequency is about 1.5 Hz, and no instrument noise is observed.
Table 2 shows the RMS difference between observed and forward-estimated dispersion properties below 3 Hz, along with the lowest frequency of the extracted dispersion properties. The analysis indicates that both dynamite and the INOVA 364 low-dwell effectively generate low-frequency signals down to 2.4 Hz, as their dispersion curves closely match the forward-estimated curves. The INOVA 364 low-dwell slightly outperforms the Failing low-dwell, and both are more effective than the INOVA 364 linear in terms of dispersion accuracy and reaching lower frequencies. For lower frequencies between 2.4 and 1.5 Hz, dynamite is the most suitable source. Among the receivers, with dynamite as the source, the 4.5 Hz geophones are most sensitive to low-frequency signals, followed by Vectorseis accelerometers and then 10 Hz geophones. However, signals recorded by Vectorseis accelerometers may be affected by instrument noise.

Table 2. The RMS difference between the extracted and forward-estimated dispersion curves below 3 Hz and the lowest frequency of the extract dispersion properties.
Our surface wave analysis results indicate that both geophones can record signals below their natural frequency. The 4.5 Hz geophone may capture signal frequencies down to 1.5 Hz, the Vectorseis accelerometer is less sensitive to signals below 2 Hz, and the 10 Hz geophone primarily records signals above 2.5 Hz. Regarding the sources, dynamite can generate low-frequency signals down to at least 1.5 Hz. The sweep functions have a more significant impact than the vibrator models; spending more time sweeping at low frequencies can generate more apparent signals. Overall, from the surface wave analysis, the combination of the 4.5 Hz geophone and dynamite generates the strongest low-frequency signals.
4.2.3 Comparison with spectral analysis
Spectral analysis is a common method for quickly assessing the frequency content of data at the beginning of the analysis process. It intuitively illustrates how energy varies with frequency. However, it may not always accurately represent the actual frequency content of the signals because it does not allow us to ignore noise energy. In contrast, evaluating frequency content using surface waves takes into account signal coherency, enabling the suppression of noise effects during processing.
Our ranking of receivers and sources for a low-frequency survey is consistent with the spectral analysis results of reflection signals, which confirms that frequency evaluation using dispersion analysis can serve as a useful reference for P-wave reflections. Additionally, surface wave analysis offers two advantages that spectral analysis does not. First, it improves the accuracy of frequency content evaluation by considering signal coherency. Signals can be visualized on dispersion plots, allowing us to determine their phase velocity only when they exhibit coherency at a given frequency. This also helps distinguish the instrument noise of the Vectorseis accelerometers from the actual signals. Second, the results can be cross-verified with other measurements. Surface wave analysis visualizes the lowest frequency boundary on the dispersion plots, which can be further examined through forward estimation using physical measurements estimated from tomography and well logging.
5 Conclusion
This work has presented a valuable case study for characterizing near-surface properties through surface wave analysis using low-frequency data down to 1.5 Hz. To assess the reliability of the inversion results, we compared them with well-logging and tomography results, which demonstrated close agreement.
Furthermore, our surface wave analysis revealed that low-frequency content was present in all datasets but varied with source and receiver types. Dynamite produced the most coherent low-frequency surface waves among sources. The type of sweep function influenced the frequency content more than the vibrator type. The two low-dwell sweeps showed similar dispersion curves and more pronounced low-frequency surface waves than the linear sweep. For the receivers tested, the 4.5 Hz geophone showed the highest low-frequency surface wave energy and aligned most closely with well-log observations. The Vectorseis accelerometer recorded lower frequencies than the 10 Hz geophone, though its data were affected by instrument noise in the low-frequency range.
Because low frequencies are crucial in seismic analysis, such as mitigating the cycle-skipping issue in full-waveform inversion, it is important to understand how they can be generated and recorded. This study provides further insight into how best to access and evaluate low-frequency seismic data.
Data availability statement
The data analyzed in this study is subject to the following licenses/restrictions: It was obtained from a seismic experiment conducted by the CREWES Project in collaboration with Husky Energy, Geokinetics, and INOVA (Margrave et al., 2012). Requests to access these datasets should be directed to Gary F. Margrave, bWFyZ3JhdmVAdWNhbGdhcnkuY2E=
Author contributions
Y-TW: Conceptualization, Formal Analysis, Methodology, Software, Validation, Visualization, Writing–original draft, Writing–review and editing. RS: Funding acquisition, Project administration, Resources, Supervision, Validation, Writing–review and editing.
Funding
The author(s) declare that no financial support was received for the research, authorship, and/or publication of this article.
Acknowledgments
We are grateful to the CREWES Project at the University of Calgary, its sponsors, and the participants in the Hussar Survey for acquiring and releasing these data for our analysis. We also express our appreciation to the Allied Geophysical Lab at the University of Houston for supporting this work and the Hewlett Packard Enterprise Data Science Institute at the University of Houston for providing computing resources.
Conflict of interest
The authors declare that the research was conducted in the absence of any commercial or financial relationships that could be construed as a potential conflict of interest.
Publisher’s note
All claims expressed in this article are solely those of the authors and do not necessarily represent those of their affiliated organizations, or those of the publisher, the editors and the reviewers. Any product that may be evaluated in this article, or claim that may be made by its manufacturer, is not guaranteed or endorsed by the publisher.
References
Dellinger, J., Ross, A., Meaux, D., Brenders, A., Gesoff, G., Etgen, J., et al. (2016). Wolfspar®, an “FWI-friendly” ultralow-frequency marine seismic source. Seg. Tech. Program Expand. Abstr., 4891–4895. doi:10.1190/segam2016-13762702.1
Eberth, D. A., and Braman, D. R. (2012). A revised stratigraphy and depositional history for the Horseshoe Canyon Formation (Upper Cretaceous), southern Alberta plains. Can. J. Earth Sci. 49, 1053–1086. doi:10.1139/e2012-035
Foti, S., Hollender, F., Garofalo, F., Albarello, D., Asten, M., Bard, P. Y., et al. (2018). Guidelines for the good practice of surface wave analysis: a product of the InterPACIFIC project. Bull. Earthq. Eng. 16, 2367–2420. doi:10.1007/s10518-017-0206-7
Gao, L., and Pan, Y. (2018). Source signature estimation from multimode surface waves via mode-separated virtual real source method. Geophys. J. Int. 213, 1177–1186. doi:10.1093/gji/ggy063
Goloshubin, G., Van Schuyver, C., Korneev, V., Silin, D., and Vingalov, V. (2006). Reservoir imaging using low frequencies of seismic reflections. Lead. Edge 25, 527–531. doi:10.1190/1.2202652
Haney, M. M., and Tsai, V. C. (2017). Perturbational and nonperturbational inversion of Rayleigh-wave velocities. Geophysics 82, F15–F28. doi:10.1190/geo2016-0397.1
Hu, H., Senkaya, M., and Zheng, Y. (2019). A novel measurement of the surface wave dispersion with high and adjustable resolution: multi-Channel nonlinear signal comparison. J. Appl. Geophys. 160, 236–241. doi:10.1016/j.jappgeo.2018.11.015
Ivanov, J., Miller, R. D., Feigenbaum, D. Z., and Schwenk, T. (2017). Benefits of using the high-resolution linear Radon transform with the multichannel analysis of surface waves method. Seg. Tech. Program Expand. Abstr., 2647–2653. doi:10.1190/segam2017-17793766.1
Ivanov, J., Miller, R. D., Lacombe, P., Johnson, C. D., and Lane, J. W. (2006). Delineating a shallow fault zone and dipping bedrock strata using multichannal analysis of surface waves with a land streamer. Geophysics 71, A39–A42. doi:10.1190/1.2227521
Kausel, E. (2005). Wave propagation modes from simple systems to layered soils, in Surface waves in geomechanics: direct and inverse modeling for soil and rocks. Editors C. G. Lai, and K. Wilmanski (Springer), 165–202.
Li, Y. E., and Demanet, L. (2016). Full-waveform inversion with extrapolated low-frequency data. Geophysics 81, R339–R348. doi:10.1190/geo2016-0038.1
Lin, C. P., Chang, C. C., and Chang, T. S. (2004). The use of MASW method in the assessment of soil liquefaction potential. Soil Dyn. Earthq. Eng. 24, 689–698. doi:10.1016/j.soildyn.2004.06.012
Margrave, G. F., Mewhort, L., Phillips, T., Hall, M., Bertram, M. B., Lawton, D. C., et al. (2012). The Hussar low-frequency experiment. CSEG Rec. 37, 25–39.
Martin, N., and Stewart, R. R. (1994). The effect of low frequencies on seismic analysis. CREWES Res. Rep. 6, 1–8.
McMechan, G. A., and Yedlin, M. J. (1981). Analysis of dispersive waves by wave field transformation. Geophysics 46, 869–874. doi:10.1190/1.1441225
Park, C. B., Miller, R. D., Rydén, N., Xia, J., and Ivanov, J. (2005). Combined use of active and passive surface waves. J. Environ. and Eng. Geophys. 10, 323–334. doi:10.2113/JEEG10.3.323
Park, C. B., Miller, R. D., and Xia, J. (1998). Imaging dispersion curves of surface waves on multi-channel record. Seg. Tech. Program Expand. Abstr., 1377–1380. doi:10.1190/1.1820161
Park, C. B., Miller, R. D., and Xia, J. (1999). Multichannel analysis of surface waves. Geophysics 64, 800–808. doi:10.1190/1.1444590
Park, C. B., Miller, R. D., Xia, J., and Ivanov, J. (2007). Multichannel analysis of surface waves (MASW)—active and passive methods. Lead. Edge 26, 60–64. doi:10.1190/1.2431832
Qin, F., Luo, Y., Olsen, K. B., Cai, W., and Schuster, G. T. (1992). Finite-difference solution of the eikonal equation along expanding wavefronts. Geophysics 57, 478–487. doi:10.1190/1.1443263
Serdyukov, A. S., Yablokov, A. V., Duchkov, A. A., Azarov, A. A., and Baranov, V. D. (2019). Slant f-k transform of multichannel seismic surface wave data. Geophysics 84, A19–A24. doi:10.1190/geo2018-0430.1
Shang, X., Kryvohuz, M., Macintyre, H., Baeten, G., Allemand, T., Herrmann, P., et al. (2023). Broadband data with a new low frequency source—acquisition and processing example from the Gulf-of-Mexico. Seg. Tech. Program Expand. Abstr. 142–146. doi:10.1190/image2023-3915083.1
Ten Kroode, F., Bergler, S., Corsten, C., de Maag, J. W., Strijbos, F., and Tijhof, H. (2013). Broadband seismic data—the importance of low frequencies. Geophysics 78, WA3–WA14. doi:10.1190/geo2012-0294.1
Woods, R. D. (1968). Screening of surface wave in soils. J. Soil Mech. Found. Div. 94, 951–979. doi:10.1061/jsfeaq.0001180
Wu, Y. T. (2022). Changes in soil conditions before and after earthquakes at a repetitive soil liquefaction site in Taiwan. Geophysics 87, B179–B191. doi:10.1190/geo2020-0665.1
Keywords: low frequency, surface waves, sources, receivers, MASW, dispersion analysis, seismic exploration, Hussar
Citation: Wu Y-T and Stewart RR (2024) Comparing the low-frequency content of exploration seismic source - receiver combinations using surface waves: a field study in Hussar, Alberta. Front. Earth Sci. 12:1401202. doi: 10.3389/feart.2024.1401202
Received: 14 March 2024; Accepted: 12 November 2024;
Published: 29 November 2024.
Edited by:
Lianjie Huang, Los Alamos National Laboratory (DOE), United StatesReviewed by:
Fuqiong Huang, China Earthquake Networks Center, ChinaDavid Monk, MonkGeo, United States
Mengyu Wu, University of Colorado Boulder, United States
Copyright © 2024 Wu and Stewart. This is an open-access article distributed under the terms of the Creative Commons Attribution License (CC BY). The use, distribution or reproduction in other forums is permitted, provided the original author(s) and the copyright owner(s) are credited and that the original publication in this journal is cited, in accordance with accepted academic practice. No use, distribution or reproduction is permitted which does not comply with these terms.
*Correspondence: Yu-Tai Wu, eXd1NjBAdWguZWR1
 Yu-Tai Wu
 Robert R. Stewart