
94% of researchers rate our articles as excellent or good
Learn more about the work of our research integrity team to safeguard the quality of each article we publish.
Find out more
ORIGINAL RESEARCH article
Front. Earth Sci., 01 August 2024
Sec. Geoscience and Society
Volume 12 - 2024 | https://doi.org/10.3389/feart.2024.1400283
This article is part of the Research TopicNear-Surface Geophysics in Latin American Contexts: Its Applications, Education and Societal Perspectives as a wholeView all 6 articles
 Zebaze Djuka Mba Kevin1,2,3*
 Jidong Yang1*
 Anatole Eugene Djieto Lordon2
 Jianping Huang1Clotaire José Pako Perabi3Onguene Rapheal4Kengue Ngouene Jocelyn Dirane2Mbouemboue Nsangou Moussa Ahmed2,3
Located in Douala V (Cameroon), Makepé Missoké is a lowland area that is influenced by the Tongo Bassa and Ngongué rivers. The site has a closed dumpsite, that operated from the 1975’s to 2003 for the disposal and storage of domestic waste produced in Douala. Geoelectric profiling (ERT) coupled with seismo-electric imaging was used to characterize the shallow aquifer of the Douala subbasin and map subsurface pollution. Fourteen geoelectrical profiles were deployed between June and August 2018 and March 2019. Along these lines, 49 sets of seismo-electric point data were collected in December 2021. A total of 118 wells drilled (2018) were used to obtain water level and topographic data. The aquifer geometry, hydraulic characteristics, permeability, lithology and leachate plume extent were determined. This survey enables us to visualize waste infiltration and migration within Makepé. The drilled wells indicate that the main lithologies observed are clay, sandy clay, sand, clayey sand and gravel. The leachate plume observed after processing the electric profiles had a resistivity signature of ≤ 10 Ωm, and high electrical conductivity are observed in some wells. The leachate migrates within the subsurface along a northwest‒southwest trend, where ground water pollution is observed due to leachate infiltration. This infiltration resulted in poor water quality indices in some collected samples. Such pollution is common in unconfined aquifers (< 50 m) due to the absence of a confining layer at the landfill. An increase in resistivity values with depth toward the northeast direction indicates progressive vertical dilution during leachate mineralization. This study integrated geoelectric and seismo-electric tomography with basic water chemistry analysis to effectively characterize the groundwater within the phreatic Quaternary/Mio-Pliocene aquifers of the Douala basin.
Douala, Cameroon’s largest city, has an estimated population of 3 million residents. The city’s surface and subsurface water resources serve as the main sources of water to support its growing population and industrial activities (Tichaawa, 2017). The sustainability of Douala’s water resources, including aquifers and springs, remains a critical area of research due to their vulnerability to a complex interplay of factors such as fluvial and marine influences, ongoing mangrove degradation, coastal erosion, frequent lowland flooding, and contamination of both surface and groundwater. With such a complex environment and a rapidly growing population, the “Douala Urban Council” (DUC) has addressed these difficulties through collaborative projects with the research community. Within this context, a study was carried out at Makepé Missoké along the Tongo Bassa and Ngongué rivers to characterize its aquifer and evaluate the possible pollution caused by the landfill.
In developing countries such as Cameroon, the water supply and waste disposal are not well managed. Most of these communities rely on groundwater resources for drinking and other domestic purposes (Takem et al., 2010). The economic growth of these low-income cities does not keep pace with urban population growth (Nkot S, 2015). Urbanization is steadily increasing without the development of environmental services such as solid waste disposal systems, sewage treatment, industrial pollution control, basic water demands, and basic water supplies (Takem et al., 2015).
Douala, the economic hub of the country, has a relatively low topography that intersects with the water table in the shallow aquifer. This aquifer is the major source of water for the population and industrial activities within the city (Douala Urban Council, 2012). The population also uses water that is available in springs, but this water is also polluted due to the inadequate disposal of untreated industrial and domestic wastes (Takem, et al., 2010). The high migration of the population and inadequate supply of pipe-borne water, where about 3% of the population is connected, has led to a drastic increase in the demand and consumption of water from springs and bore wells (Takem, et al., 2010). Groundwater is generally free from contamination and is usually the best alternative to surface water (Emvoutou et al., 2018). Monitoring this water resource, which is a prerequisite for its optimal management, is a real problem in underdeveloped urban cities. Currently, there is little piezometric monitoring throughout Cameroon, and groundwater quality monitoring has not yet been established to assess such resources (Fantong et al., 2016). To assess the quality of groundwater for consumption and determine the exploitable depth, it is essential to understand the groundwater system in the region by characterizing the physical and chemical properties of the aquifer. This work was carried out under the “Douala Ville Durable (DVD) project” (component A: Makepé Missoké along the Tongo Bassa and Ngongué rivers) which is linked to the Sustainable Development Goal “6” (clean water and sanitation), and the DUC development strategic plan (Douala Urban Council, 2012).
The streams and rivers along the Wouri estuary have consistently drawn researchers aiming to study the hydrogeology of the Douala basin using both conventional hydrogeological and hydrochemical survey techniques. These studies are crucial for understanding the complex interactions between fluvial and marine waters, as well as addressing issues like salinization and pollution of coastal aquifers (Fantong et al., 2016; Wirmvem et al., 2017). Hydrochemical studies in this area have shown that the water of shallow aquifers are (i) weakly mineralized and needs to be treated for human consumption, (ii) human activities are the main cause of pollution and salinization, and (iii) the main geochemical processes responsible for controlling the evolution of groundwater quality in aquifers were identified (Emvoutou et al., 2018; Emvoutou et al., 2024). The shallow wells have high concentrations of NO3- and Cl−, with levels of NO3− exceeding the WHO guideline for drinking water. This contamination poses a risk of waterborne diseases due to the presences of harmful substances (Takem et al., 2010; Wirmvem et al., 2017).
Despite these studies, the proliferation of waterborne diseases within the Douala basin is still observed in localities located along streams and rivers (Makepé). Although these areas are identified as high-risk zone, the DUC wishes to rehabilitate it through development project known as the “Douala Sustainable City”. Few, geophysical survey has been carried out within the Douala basin with aim to characterized the subsurface and asses the groundwater resources. This work characterizes the subsurface and assesses potential pollution within the Douala subbasin aquifers, specifically along the Ngongue and Tongo-Bassa rivers. The study will use hydrological and geophysical methods to identify subsurface lithology, assess hydraulic properties, and map the leachate plume extent. The approach will provide comprehensive knowledge of subsurface conditions and contamination spread.
Makepéis part of the Douala V communal councils, which lies between longitudes 9°44′06″E to 9°44′46″E and latitudes 4°03′36″N to 4°04′30″N (Figure 1) and occupies approximately a surface area of 153.5 ha(Douala Urban Council, 2012). The Makepé hydrological network, comprising rivers and streams, is characterized by an erosive phase on slopes that deposit sediment in lowland wetland areas. This network nourishes the major Wouri River estuary, which flows out to the Atlantic Ocean. (Nkot, 2015; Ramatlapeng et al., 2021). The topography is characterized by a varying altitude ranging from 5 to 60 m above mean sea level, where ridges are separated by valleys (Mafany et al., 2006).
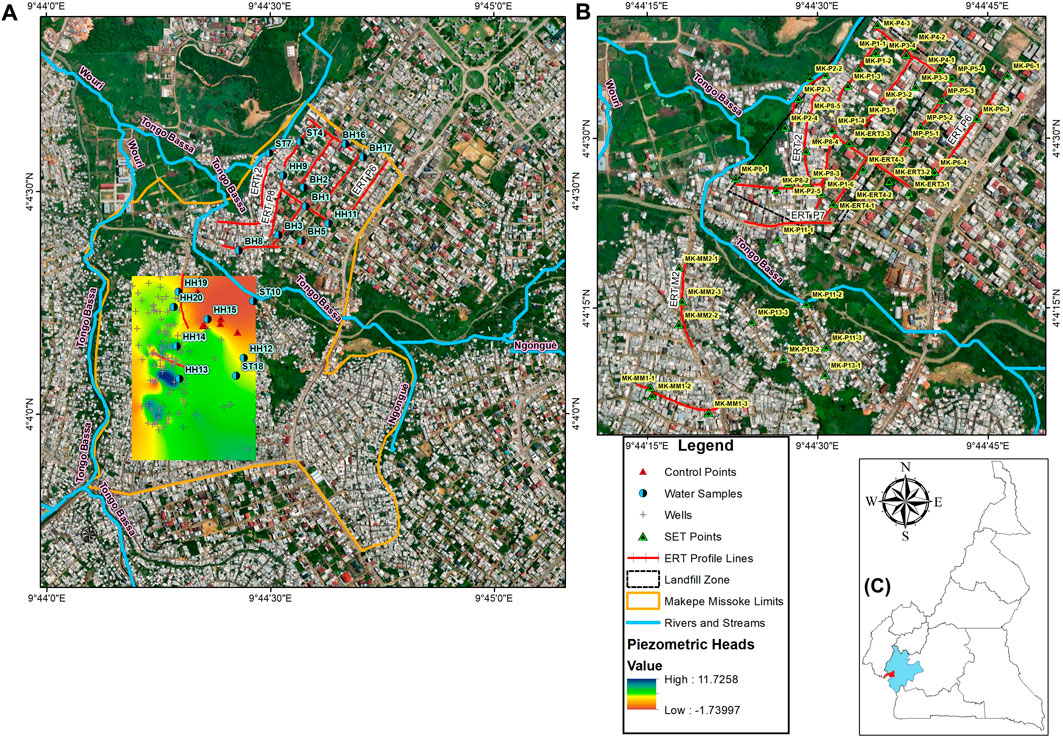
Figure 1. Spatial distribution of (A) geoelectrical, hydrogeological, and (B) seismo-electrical data collected within the study area. (C) The Douala city (red) located in the littoral region (blue) of Cameroon.
The study area is located within the Douala sedimentary basin, covering an area of 7000 km2 (Figure 2B), which is part of the Wouri Formation (Boum-Nkot et al., 2023). As one of the divergent margin basins located on the coast of West Africa, its origin and structure are associated with the opening of the South Atlantic Ocean during the breakup of Gondwanaland (Fantong et al., 2016). According to Takem et al. (2015), the stratigraphy of the basin consists of a Precambrian basement unconformably overlain by a sedimentary sequence ranging in age from Cretaceous to Recent (Figure 2A). Douala city lies directly on the Mio-Pliocene to recent alluvial sediments of the basin. The formation mainly consists of unconsolidated fine to coarse-grained sand and gravel mixed with a small quantity of clay. The alluvium is mainly composed of quartz and kaolinite with thickness ranging between 50 and 60 m (Mafany et al., 2006).
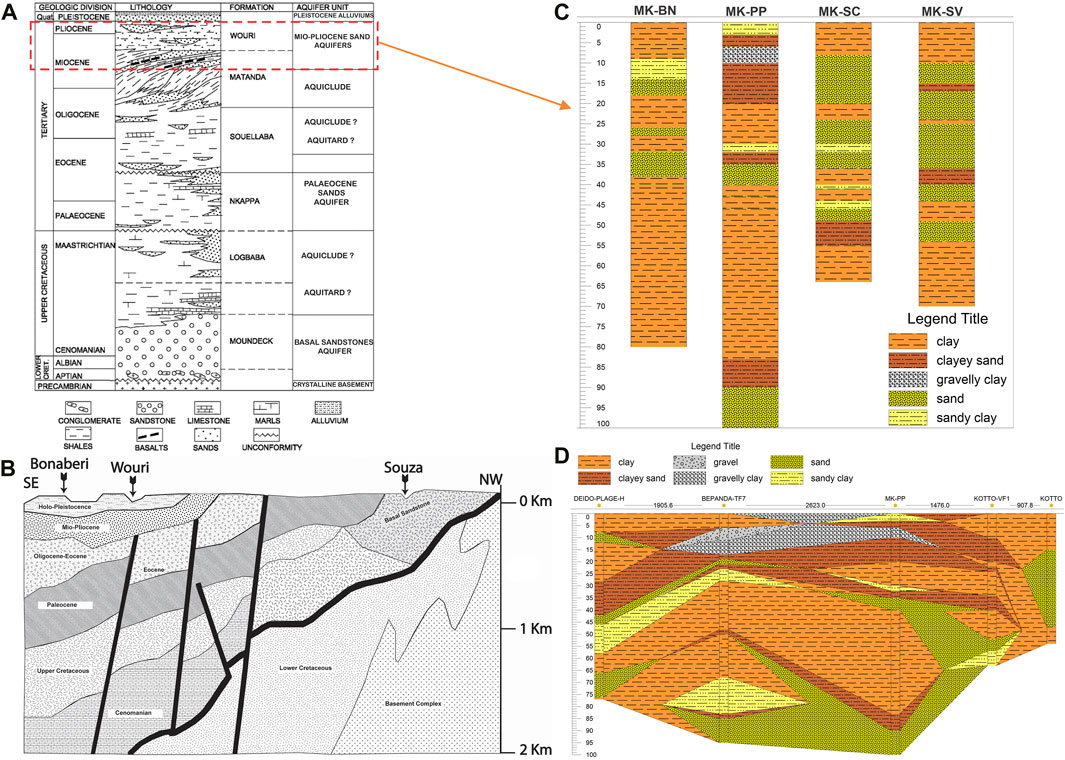
Figure 2. Geological setting of the Douala basin showing (A) chrono-stratigraphy, (B) hydrological setting and main aquifer units, (C) lithology, and (D) cross-section derived from drilled wells. (adapted from Emvoutou et al., 2018; Takem et al., 2015).
There are two types of aquifers in the Douala Basin: shallow and deep aquifers. The aquifer system can be classified into shallow aquifers (<50 m depth) and deep aquifers (>50 m depth) based on depth (Kevin et al., 2024).
The lithologies observed from the various drilled wells are sand, clay, sandy clay, clayey sand, gravelly clay and gravel (Figures 2C, D). These rocks are found in a sedimentary environment and are characteristic of the Douala shallow aquifer, which is composed of Mio-Pliocene sands at the base and quaternary sands and clays (Emvoutou et al., 2024).
The geoelectric and seismoelectromagnetic (SEM) surveys were carried out using electrical resistivity tomography (ERT) and seismoelectric tomography method (SET). The ERT has been broadly used and documented both for its application in groundwater investigation and to assess subsurface pollution (Mondal et al., 2007; Soupios et al., 2007; Bichet et al., 2016; Ganiyu et al., 2016; Maurya et al., 2017; Osinowo and Falufosi, 2018; Aziz et al., 2019; Niculescu and Andrei, 2021; Christopher et al., 2023). Whereas, SET approach are known to combines both seismic high resolution and electromagnetic fluid sensitivity, when used for subsurface exploration (Yevalla et al., 2020; Kevin et al., 2024) and offers a noninvasive and cost-effective approach for characterizing the Earth subsurface: reservoir geometry, depth, hydraulic properties and fluid content (such as water, oil or gas), from a few 100 m to depths >1000 m (Jouniaux and Zyserman, 2016; Butler et al., 2018; Chi, 2021). Further literature on this method are well described and documented (Butler et al., 2002; Butler et al., 2018; Haines et al., 2007b; Haines et al., 2007a; Jouniaux and Ishido, 2012; Jouniaux and Zyserman, 2015; Jouniaux and Zyserman, 2016; Yevalla et al., 2020; Chi, 2021; Arato et al., 2022; Kevin et al., 2024).
From this literature, two main types of seismoelectric (SEM) conversion can be distinguished: (i) coseismic conversion, which occurs when the electric field is contained within the seismic wave and travels at the same speed as the seismic wave. (ii) Interface response (IR), which occurs when the seismic wave encounters a boundary between two media with contrasting physical properties. At this boundary, the electromagnetic signal associated with the seismic wave travels at the velocity of the electromagnetic signal in the medium, rather than the seismic wave velocity. The interface response (IR) can be used to detect contrasts in permeability within the Earth’s crust. These permeability contrasts are often associated with geological boundaries or features, such as fractures or faults (Jouniaux and Zyserman, 2016). A seismic source induces seismic wave propagating downward toward the interface (Figure 3), through which the difference in physical properties, caused due to their charge imbalance may generate charge separation on both sides of the interface. This IR is used to pick three parameters (Kevin et al., 2024): (1) The hydraulic conductivity values obtained from hydraulic conductivity tomography (ESKT) are expressed in m/day. These values are normalized, with the highest response set to 100 m/day and the other observed values scaled accordingly. The ESKT responses range from 100 m/day down to 0 m/day. A response near zero may indicate the presence of low-permeability materials such as clay or saltwater, while a high ESKT response may suggest the presence of a more permeable fluid-bearing zone, such as a sand aquifer. (2) The inferred fracture network associated with secondary permeability within a primary permeability aquifer is determined from electrical fracture tomography (ESFT). ESFT can also be used to delineate bedding plane fracturing, with a maximum tilt of up to 30° from the horizontal plane. (3) Geological shifts determined from interface tomography (ESIT) can be used to identify the presence of large fractures or faults in the geological formation. The IR polarities indicate the type of fluid or rocks involved in the generation of the seismoelectric signal. Thus, similar rock types generates similar polarity responses, which indicates the boundaries stratification (Yevalla et al., 2020; Kevin et al., 2024).
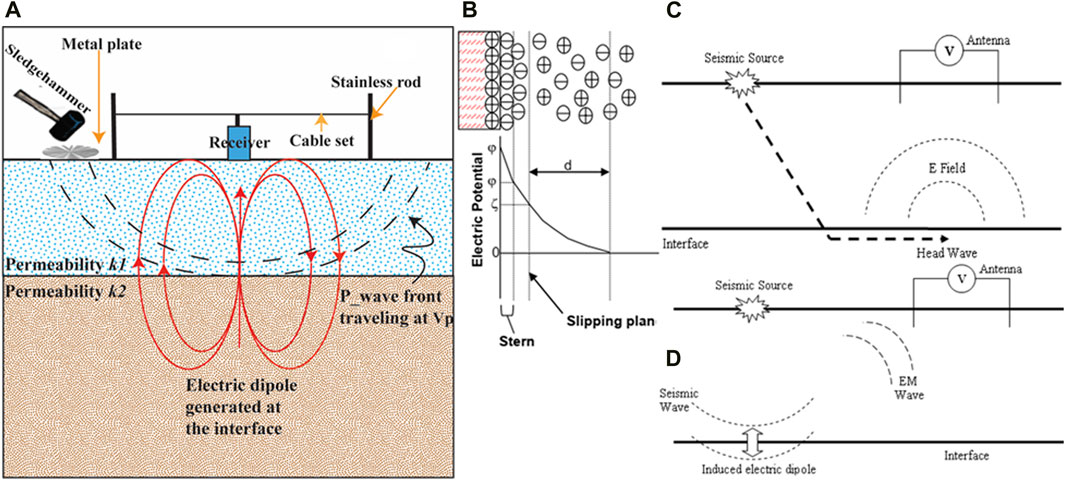
Figure 3. (A) Seismo-electrical equipment and data acquisition techniques, (B) electric double layer, (C) seismic wave crossing an interface generating an electromagnetic wave and (D) Head wave travelling along an interface generating an electric field.
A 2D electrical resistivity imaging survey was carried out within the study area using the IRIS Instrument SYSCAL R1 Pro + Switch-48. Fourteen electrical profiles were collected in Makepé (June to August 2018 and March 2019). The data were collected via a multielectrode Iris Instrument (SYSCAL R1 Pro + Switch-48 [600V; 200W; 2.5A]). The profiles collected had diverse orientations, each 240 m long with a variable distance separating each profile (Table 1). Forty-eight stainless steel electrodes that were planted in the ground at 5 m intervals, were connected to the Terameter through two cable outlets. At each electrode, the GPS coordinates and elevation were obtained. The Terrameter collects the data according to a preprogrammed sequence following the different pathways already defined within the study area. Both the Wenner-Schlumberger and dipole-dipole configuration were used to acquire the geoelectrical data. These configurations are known to be sensitive to both lateral and vertical variations in resistivity (Wenner-Schlumberger is sensitive to horizontal structures and the dipoles are sensitive to vertical structures) (Bichet et al., 2016). These two configurations are adapted for groundwater studies to observe both horizontal and vertical structures (Bichet et al., 2016; Ganiyu et al., 2016). The terrameter displays the field resistance value and the corresponding root mean square (RMS) error of the reading at each measurement. The computed apparent resistivity (ρa) and the geometric factor (k) of the subsurface were obtained using Eq. 1.
where ρ is the apparent resistivity, k is the geometric factor, and R is the field resistance value (Loke et al., 2013).

Table 1. Characteristics of the electrical tomography profiles.
SET equipment (Figure 3A) consisted of two stainless steel rods (1x50 cm), a set of cables (with clippers), a sledgehammer (10 kg), a metallic plate (5x25 cm), and a receiver (smartphone). The two pins are inserted in the ground at 2 m apart (dipole configuration). The cables are used to connect the mobile phone device (receiver) to the rods. The phone automated data acquisition process is activated (Du Preez, 2019). The seismic wave is produced by striking the ground 6 to 15 times, near the ground pins at each location (data stacking). At each point, data processing is performed through, filtering, extraction, correlation, stacking, and quality evaluation. At this stage, the collected data can be rejected (poor quality) or stored (good quality). The data are further process to produce up to three different datasets (ESKT, ESFT and ESIT), which enable characterized and identify the fluid content within the subsurface (Kevin et al., 2024). SET with very low or negative signal are assume to be an indication of clay/shale (highly conductive material). Forty-nine sets of point data (14 profiles) were collected in December 2021 using SEM.
A tape-like meter was used to measure the water levels in the wells. At each well site, its geographic coordinates, and elevation were obtained using a GPS connected to an RTK. The E-line uses a thin, round wire to transmit a signal to a buzzer when water is encountered (static water level) and 118 hand-dug wells were measured (March 2018) in the study area. Water samples were collected from 20 wells (hand-dug and drilled wells). In-situ parameters such as pH, total dissolve solute (TDS), and electrical conductivity (EC) were measured in the field using a portable handheld meter (ExStik II EC400). Water samples analysed for anions (Cl−, Br−, NO3−, NO2−, SO42−, and PO42−) and cations (Na+, K+, Mg2+, and Ca2) were filtered through a 0.45 μm filter into 6 mL plastic vials. The samples were immediately transferred to a cooling box and stored at 10 °C until analysis. The analysis was conducted by ion chromatography (Dionex ICS-1100 with an Ion Pac AS18 4 mm column (P/N 056904) and Ion Pac AG18 4 mm Guard Column combined with a suppressor, Metrohm 833 IC, Auto Sampler Dionex AS-DV).
The basic characteristics of the groundwater chemistry were analysed using descriptive statistics. The water quality index (WQI), which can reflect the impact of multiple parameters on water quality, is the most popular and effective technique (Liu et al., 2020). Different weight (wi) values were assigned to each chemical component due to their relative importance in water quality evaluation, and were used to calculate WQI values. The calculation process is shown in Figure 4. The groundwater quality of Makepe was performed using the WHO standard as the limits.
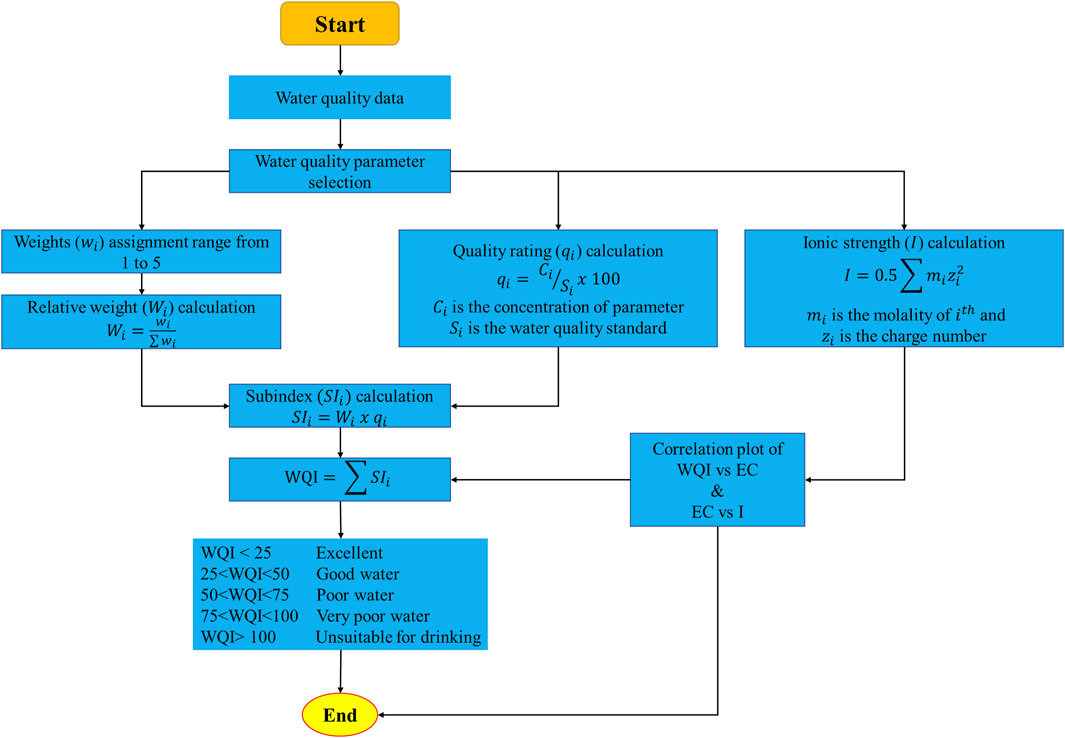
Figure 4. Workflow for WQI and ionic strength computation (adapted from Liu et al., 2020; Maurya et al., 2017).
The resistivity data were imported into RES2DINV (Loke et al., 2013) and the ZondRes3D software package for processing (Aziz et al., 2019). The processing consists of removing outliers that resulted from poor electrode contact and low energy input. The data were acquired using the maximum possible current 2.5 A and voltage of 500 V. This inversion program automatically determines the resistivity model of the subsurface from the input resistivity data using the smoothness constrained least squares method, and the Marquardt algorithm was also applied as a refinement method (Loke and Barker, 1995; Loke et al., 2013). The accuracy of the model is expressed as the root mean square error (RMS) (Loke and Barker, 1995).
The data were downloaded from SYSCAL Pro using PROSYS II software, where preprocessing was performed. The acquired data were filtered to eliminate negative values and values with a standard deviation <1% for both measurements at the same point. For each profile, a model with an RMS >10% of the values was rejected for both Wenner–Schlumberger and dipole–dipole configurations. This procedure was confirmed to be adequate for groundwater studies and pollution assessment, (George, 2006; Bichet et al., 2016; Ganiyu et al., 2016; Maurya et al., 2017; Aziz et al., 2019; Ibraheem et al., 2021), and it was implemented throughout this study.
There are various inversion methods available for reconstructing 3D resistivity structures from measured apparent resistivity data. Most of these inversion methods use the G Newton approach to minimize the misfit between data and model response (Loke and Barker, 1996; Loke et al., 2013). The first step in the inverse problem is to set up a suitable earth model for the forward problem, which is then solved either by the finite difference or the finite element method. Eleven profiles (P1–8 and ERT1–3 profiles) were selected and merged using the Res2DInv tool (Collate data in to Res3Dinv) via a script, and a 3D data set was generated. The 3D profile was generated using the coordinates of each profile. The 3D dataset was then imported into ZondRes3D for processing and interpretation. The lithology associated with leachate electrical characteristics (Table 2) obtained from drilled wells near the landfill (Figure 2) was used to assess the presence of leachate within the subsurface.
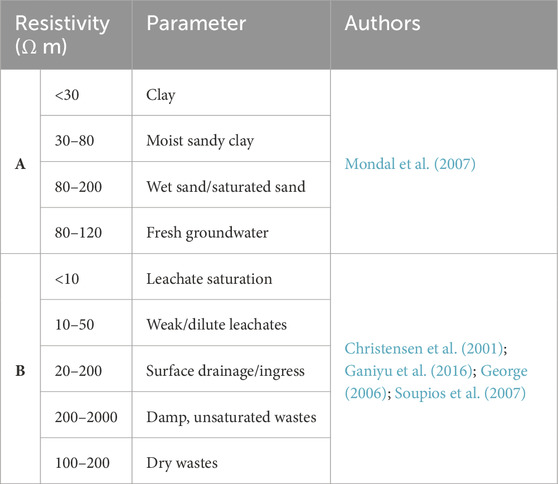
Table 2. (A) Resistivity-lithology conversion (Mondal et al., 2007), and (B) Resistivity values encountered within domestic and industrial waste (Christensen et al., 2001; George, 2006; Soupios et al., 2007; Ganiyu et al., 2016).
The groundwater elevation (GWE) obtained in the study was computed with Eq. 2 for each well.
where GSE denotes the ground surface elevation, DTW is the measured depth of water from the top of the casing, and SU denotes the stick-up.
The profile characteristics and their orientations are illustrated in Table 1. The orientations of the profiles are NE–SW (P1–P3, M1, ERT2, and ERT 4); SW–NE (P5 and P6); E–W (ERT1 and P7); NW–SE (ERT3); SSW–NNE (P8); and SSE–NNW (M2). All these profiles illustrated the target zone and its surroundings. The results produced from the ZondRes3D software after 6 iterations had an RMS error ≤10%. Figure 5 shows apparent resistivity at the geoelectric profile P1 and nearby SET profile P3.
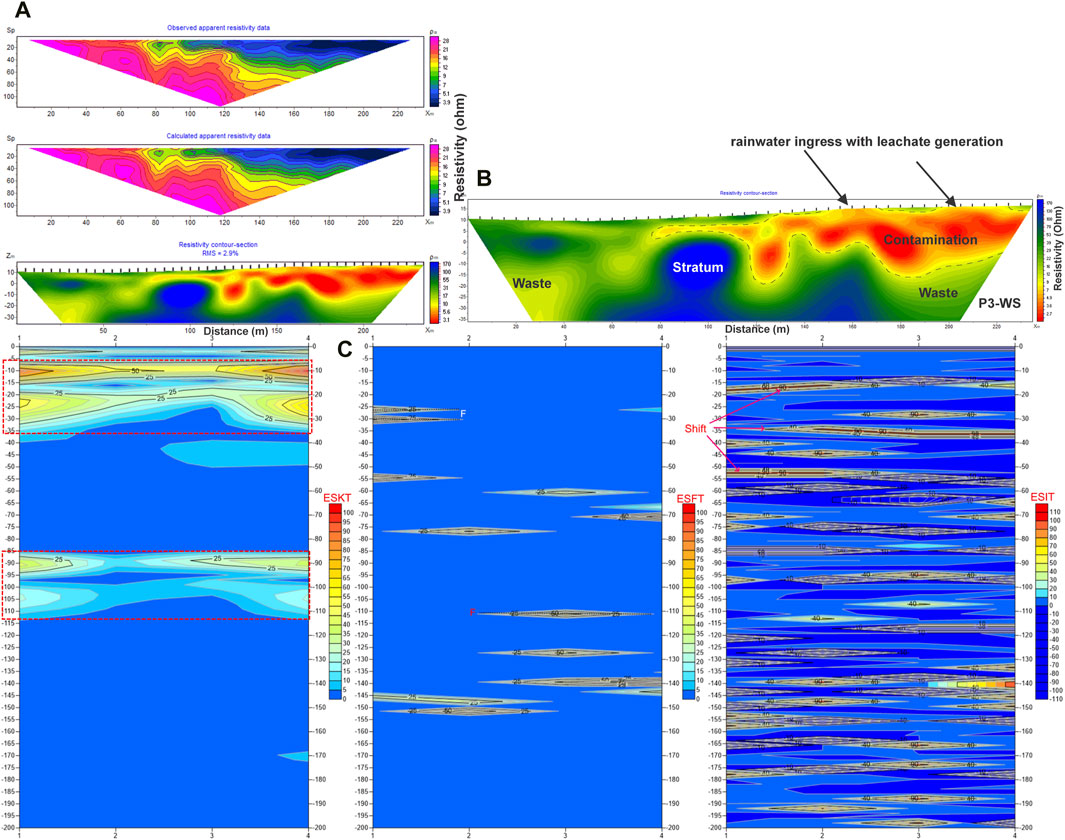
Figure 5. (A) Pseudosections of profile P1 with the apparent resistivity and RMS error, (B) ERT profile of P3, and (C) EST profile near P3.
The SET was used to map the subsurface hydraulic conductivity (ESKT), delineate bedding plane fracturing (ESFT) and to delineate high geologic shifts (ESIT). Twelve (12) SET profiles were mapped within localities of Makepé (Figures 5–8).

Figure 6. Correlation between ERT profile P4 and SET profiles P4.
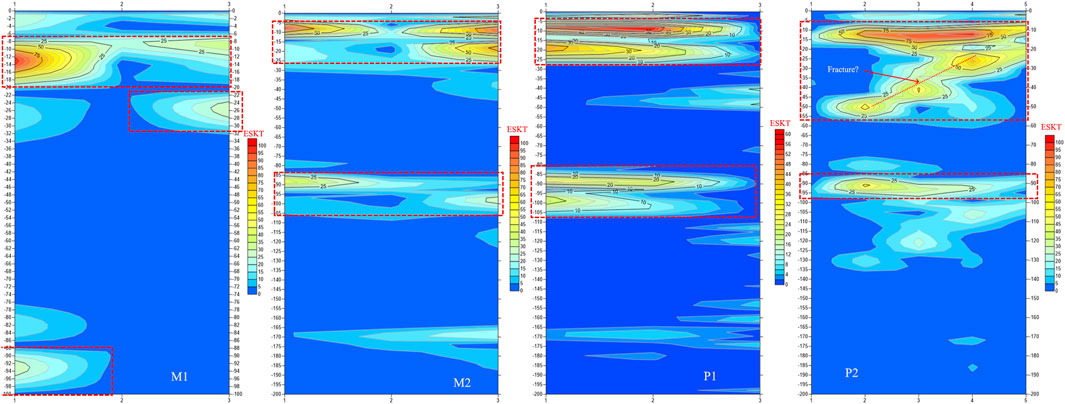
Figure 7. Hydraulic Conductivity Tomography along profiles M1, M2, P1 and P2.
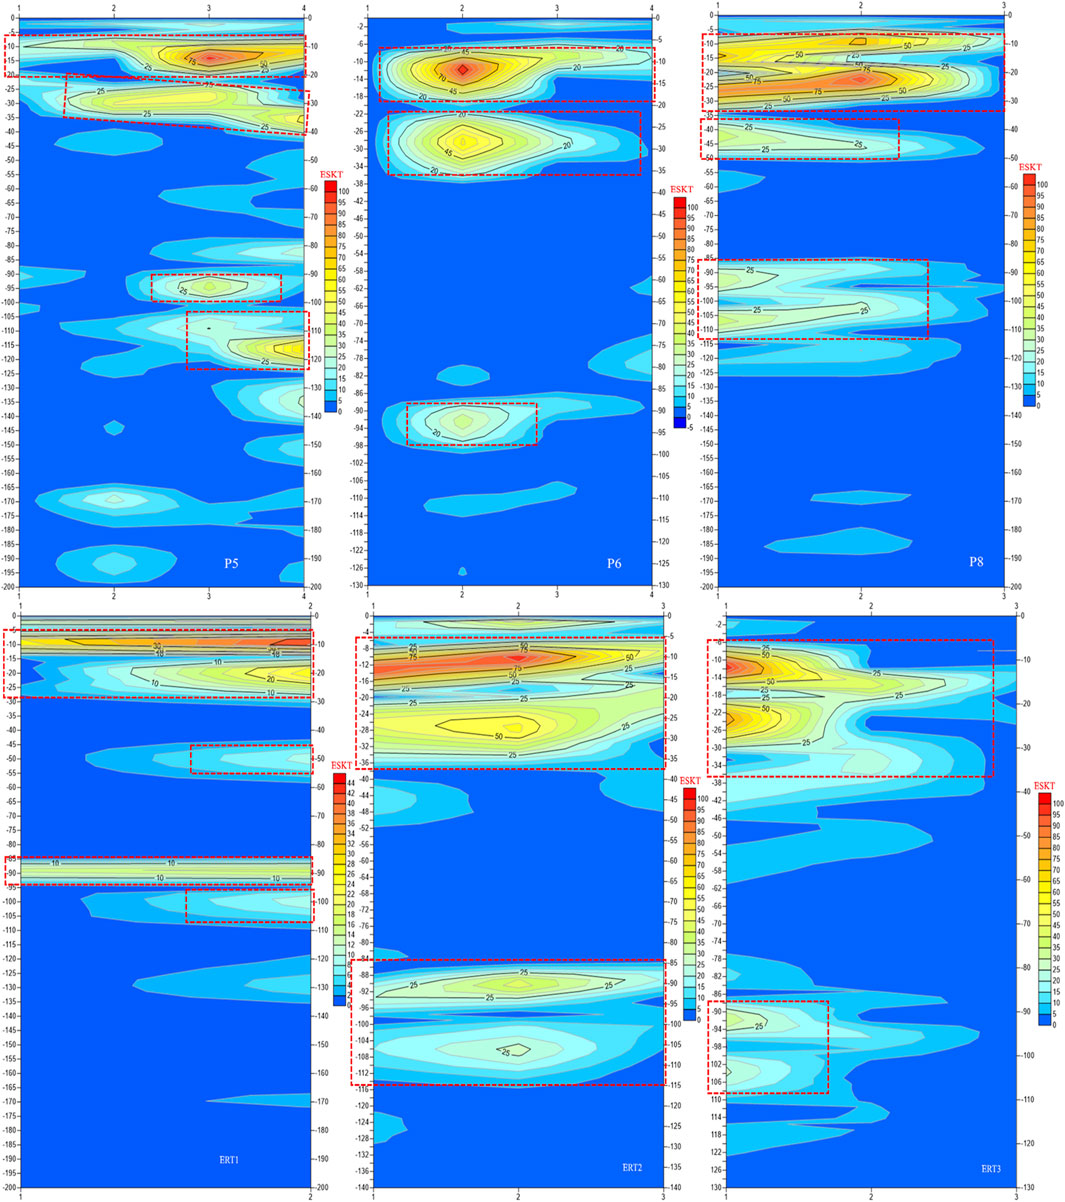
Figure 8. Hydraulic conductivity tomography (ESKT) near profile P5, P6 and P8.
In the P3 profile, four permeable zones were identified at depth ranging from 5 to 15 m, 20–35 m, 85–95 m and 100–110 m, with a thickness ranging from 10 to 15 m. The hydraulic conductivity fluctuates between 25 and 90 m/day and decreases with depth. Similar characteristics are observed in profile P4 (Figure 6D). Two main fractures (ESFT) are observed at depths of 25 m and 102 m. Four lithological shifts (ESIT) were observed that indicate a major change in lithology along the profile (Figures 4A–C), which is related to the lithology of the drilled wells (Figure 1C, at depths of 20, 35, 50 and 95 m) and correlates with the presence of clay (Figure 6B). At profile P4, four fractures (ESFT) are observed at depths of 22, 32, 102 and 160 m. Four lithological shifts (ESIT) were observed at depths of 16, 76, 96 and 175 m (Figure 6C) and corresponded to the presence of clay (Figure 6B).
Figures 7, 8, illustrate the SET (ESKT) of profiles M1, M2, P1, P2, P5, P6, P8, ERT1, ERT2 and ERT3. In Figure 7, high ESKT responses are observed at depths range of 7–18 m (profile M1), 5–25 m (M2 and P1), and 6–20 m (profile P2), are indications of fluids presence (sand aquifer). Low ESKT responses (permeability) are observed at depths ranging from 23 to 30 m and 90–95 m (profile M1), 85–105 m (profile M2 and P1) and 21–55, 87–94 and 100–125 m (profile P2). Two fractures are observed at depths of 21–55 and 100–125 m, which are linked to the high ESKT signal above and indicate the presence of sand aquifers (profile P2). In Figure 8, high permeability responses are observed at depths of 6–19 m (profile P5, P6 and ERT2); 7–30 m (profile P8); 5–12 m (profile ERT1); and 7–17 m and 20–30 m (profile ERT3), are indications of fluids presence. Low ESKT responses are observed at depths of 25–40 m, 90–100 m and 105–125 m (profile P5); 22–36 m and 85–98 m (profile P6); 38–48 m, 87–97 m and 102–114 m (profile P8); 15–28 m and 86–94 m (profile ERT1); 21–36 m, 88–96 m, and 102–112 m (profile ERT2) and 90–94 m and 100–108 m (profile ERT3).
The low resistivity signatures that may indicate subsurface pollution in the landfill were observed from ERT profiles P1–P8 and ERT1–ERT4 (Figures 9, 10) (Maurya et al., 2017; Helene and Moreira, 2021). The resistivity values, in Ω m, are displayed with a colour scale to allow a homogeneous visualization of their distribution within the target zone and its surroundings. The layers with resistivity signatures <10 Ωm correspond to conductive zones while those with a resistivity >20 Ωm indicate zones of poor conductivity (Bichet et al., 2016; Ganiyu et al., 2016; Ibraheem et al., 2021). The black delineation line represents the zone with conductive material. The pollution extent and flow direction were observed, and the leachate had a resistivity <10 Ω (Figures 9, 10).
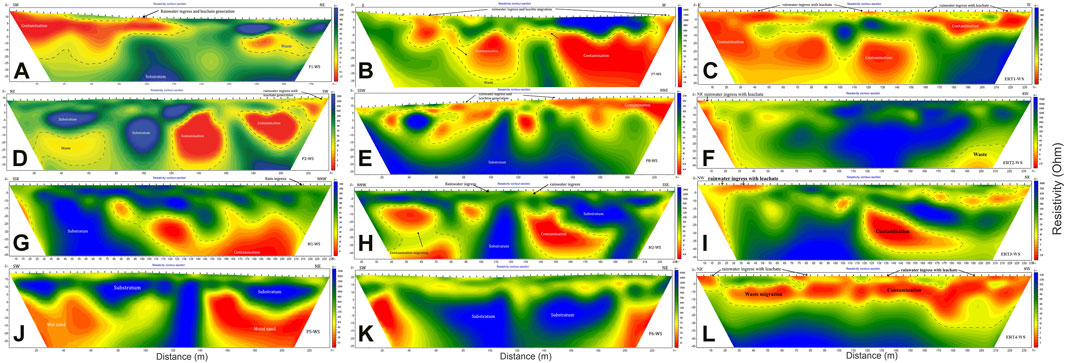
Figure 9. Inverted 2D resistivity models of profiles P1 (A), P2 (D), P7 (B), P8 (C), M1 (G), M2 (H), ERT1 (C), ERT2 (F), ERT3 (I), ERT4 (J), P5 (L) and P6 (K) using the Wenner-Schlumberger configuration. Rainwater and leachate ingress (percolation) are observed along some profiles.
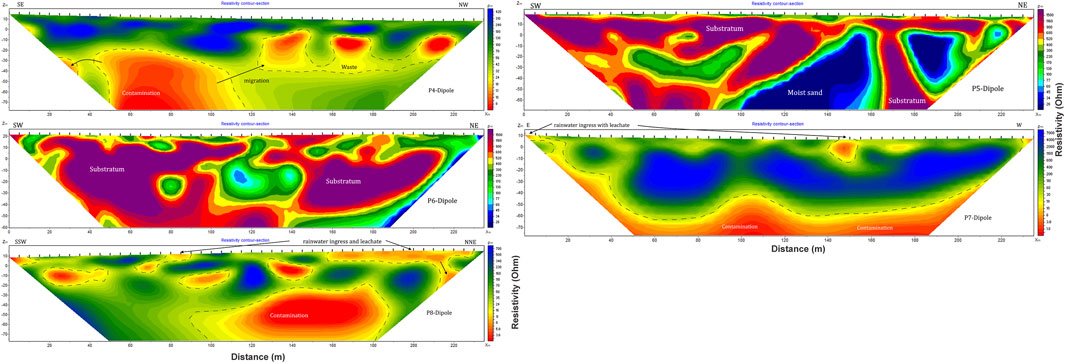
Figure 10. Inverted 2D resistivity model of profiles P4 (A), P5 (B), P6 (C), P7 (D) and P8 (E) using the dipole-dipole configuration. Rainwater and leachate ingress (percolation) are observed along some profiles.
Aquifers were identified at various depths that correspond to zones with high ESKT responses. Along profiles P1–P4, P8, ERT1 and ERT2, the low resistivity anomalies correlate with the high permeability response at depths <30 m, which indicates the presence of leachate within the shallow aquifers (Du Preez et al., 2010; Yevalla et al., 2020).
The lithology observed from the drilled well indicates the presence of clay, sandy clay, sand, clayey sand and gravel, which corresponds to the stratigraphy of shallow aquifers that are made up of Mio-Pliocene sands. The water table varies from −0.3 m to +12.19 m, with head values that are high at +7 m in the East and decrease to −0.30 m at wells located close to the Tongo Bassa River, suggesting that groundwater from the top aquifer drains into the river. In the northeastern part of the aquifer system, the heads are very low (>–1.0 m) with flow directions toward the Ngongué river. This will cause the oversaturation of rivers and their tributaries during rainy season, were the constant high groundwater recharge in the area can result in flooding (Takem et al., 2015; Emvoutou et al., 2018). The increased mobility of leachate due to excess water can lead to higher rates of transport and dispersal through the subsurface, as the excess water can carry the leachate more readily through the aquifer (Smith et al., 2020), potentially diluting contaminant concentrations but also enabling the spread of contamination over a larger area (Jones and Christopher, 2018; Sun et al., 2022).
The profiles that are found in the target zone (dump site) are P1–P4, P7, P8, ERT1, ERT2–ERT4 (Figures 9, 10). Profiles M1, M2, P5 and P6 (Figures 9D, E, K, L) were used as control lines (P5 is 30.6 m away from P4, P6 is 143.2 m away from P4, M1 is 275 m away from P7, and M2 is 314 m away from P7). Figure 9 shows the inverted 2D resistivity models from profiles P2–P8 and ERT1–ERT4, which were generated using the Wenner–Schlumberger configuration. The 2D resistivity model directly shows a low resistivity zone of varying thickness in each profile, with a range that varies between 5 and 30 m.
The 2D resistivity models (Figures 9, 10) excluding profiles P5 and P6, which are used as control profiles, were observed to have 3 layers heterogenous distributions within the profiles. The first layer has a low resistivity <10 Ωm (0–30 m) and runs from the E–W while dipping toward the NW–SW direction. The second layer is found within the whole study area with a NE–SW trend and has a medium resistivity ranges from 20 to 200 Ωm. The third layer has a NE–SE trend and has a high resistivity >250 Ωm. The low resistivity anomalies have a thickness that vary from <5 m to approximately 30 m. The second layer (medium resistivity) can be encountered from the surface deep to the subsurface (>40 m). A relatively high resistivity layer can be observed at depths >10 m and dips downwards (the resistivity increases with depth within the study area).
The 2D resistivity profiles can be divided into four sections along the N–S and E–W directions within the study area. These sections indicate that low resistivity anomaly is observed along profiles with a NE–SW orientation, from the surface to a depth of approximately 30 m, a thickness ranging between 10–25 m and dips toward the SW. Low resistivity zones are observed at depths ranging from 20 to 40 m in profiles with NW–SE trends, a thicknesses >10 m and dips toward. Intermediate to high resistivities (>20 Ωm) is present at the centre (depth >10 m) and is very prominent as the depth increases within the study area except in profile P7 (W–direction), ERT1 (E–direction), M1 and M2 (NNW–direction), where low resistivities is observed at depths >40 m. Here, the low resistivity anomaly has a western trend and the high to intermediate resistivity anomaly has an eastern trend that increases with depth.
Initially, four control profiles were used: two profiles (M1 and M2) with a NW–SE trend have low resistivity zones at depths >20 m, with thicknesses increasing from 5 to 20 m following the SE–NW trend. In contrast, both profiles P5 and P6 had resistivity values >20 Ω, which could indicate the absence of leachate in the NE direction of the study area. The 2D depth resistivity map shows the geo-resistivity distribution within the target area at a specific depth. The results of merging resistivity data obtained in the field are used to construct a 3D model (Figure 11). This model represents stack data from the surface (0 m) to a depth of 45 m. The 2D resistivity sections of the 3D model are presented at various depths of <5, 10, 15, 20, 25, 30, 40 and 45 m. This model represents the ground resistivity within 11 profiles (P1–P8 and ERT1–ERT3) in the target zone and the resistivity distribution pattern of the entire dumpsite at different depths can be inferred.
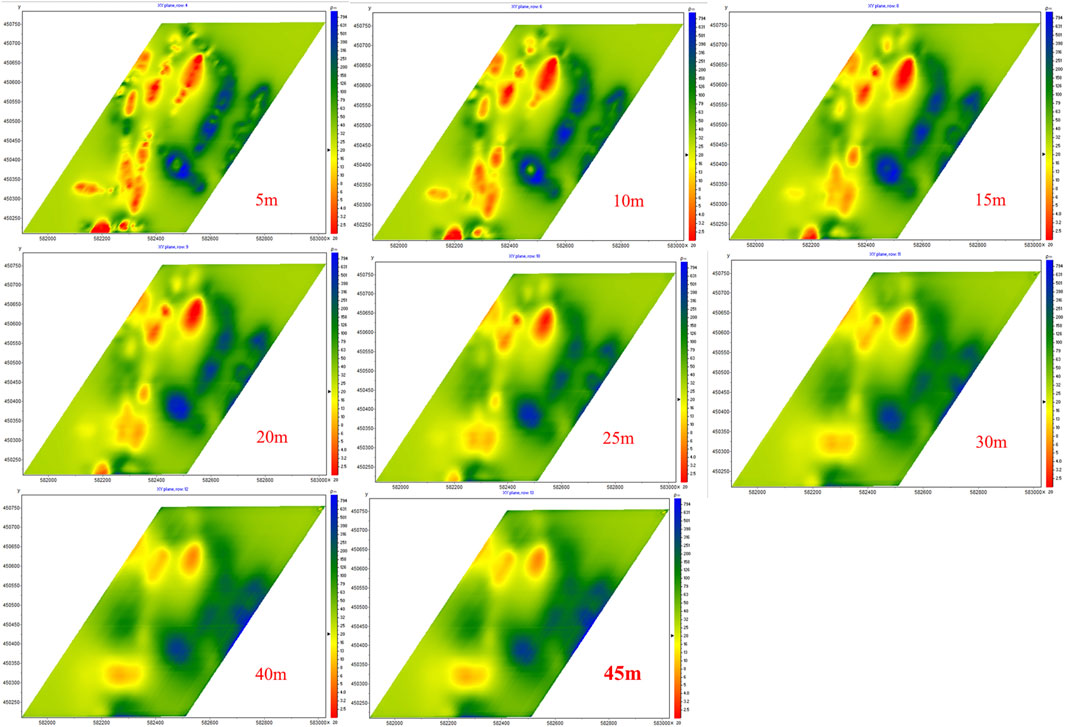
Figure 11. 2D view of the 3D resistivity model at various depths in ZondRes3D using the Wenner-Schlumberger configuration.
These 2D sections of the 3D model confirm that the low resistivity anomalies migrate from the subsurface to the surface and dip in a NW–SW direction, with the main plume being observed in the NW direction at depths <30 m (Figure 11). The maps display the progressive dilution of the leachate as it migrates within the substratum, and a rising gradient of resistivity values with depth (W–E trend). At depths between 2 m and 25 m, resistivity values <10 Ωm are prominent in the NW–SW direction, but they start to increase at depths ranging from 30 to 40 m, and at depth of 45 m medium to high resistivity values (>10 Ωm) are observe within the entire target zone. This indicates that the leachate is localized and migrates only within the shallow aquifer and the clay observed at depth of 30–45 m (Figure 2) may have formed a natural barrier (layer) that prevents the migration of the leachate to deeper depths (Maurya et al., 2017; Osinowo and Falufosi, 2018; Aziz et al., 2019).
Along the profile lines, the leachate flow direction and saturation within the subsurface are visualized and are oriented in the NW–SW direction, dipping mainly upwards while following the fracture trend where leachate infiltrations and migration are also observed. The leachate plume expands both laterally and vertically when moving away from the leachate source (George, 2006; Bichet et al., 2016; Maurya et al., 2017; Ibraheem et al., 2021) but does not migrate toward the NE direction. Clays/shales layers correspond to the high geological shift observed and enable us to dissociate the low resistivity response of the clay with those generate by the leachate (Giang et al., 2018; Yevalla et al., 2020; Ibraheem et al., 2021). SET profiles that were made along ERT enable us to assess the permeability and fractures network that enable the flow and dilution of the leachate within the subsurface. The rising gradient of resistivity values observed at certain depths, indicating a dilution effect and gradual vertical leachate mineralization (except for profiles M1, M2, P4, P7, ERT1, and ERT4 where the leachate seeps deeper and lower resistivity anomalies are observed at depths >40 m). The medium to high resistivity signatures observed in some profiles confirm the presence of fracture networks within the subsurface. These fracture networks are known to facilitate the infiltration (percolation) and migration of fluids from the surface (unconfined and semi-confined aquifers) to the subsurface (confined aquifer) of the Douala aquifer system (Emvoutou et al., 2024; Kevin et al., 2024).
The inhabitants of Makepé Missoke use groundwater as their main source of water for both domestic and commercial use. The WQI method was used for checking the level of groundwater quality degradation within the study area, which is based on the water chemistry of the samples (Supplementary: Table 3). Most of the drilled wells are suitable for drinking water (Table 3: 45% are excellent and 25% are good), where wells were drilled at depths >60 m, while poor water quality (30%) is often observed in hand-dug wells, twhich are typically shallow in the Douala basin (<50 m) (excluding the stream that was found to have total coliform >3000 cfu/mL). A positive correlation existed between EC and WQI, and EC and I (Figure 12), with R1 = 0.947 and R2 = 0.980, respectively. The WQI decreases as the EC increases since it is known to generally have a high signature within landfills. The positive correlation between the ionic strength and the EC can also be used to indicate the presence of leachate within the dumpsite (Maurya et al., 2017; Helene and Moreira, 2021).
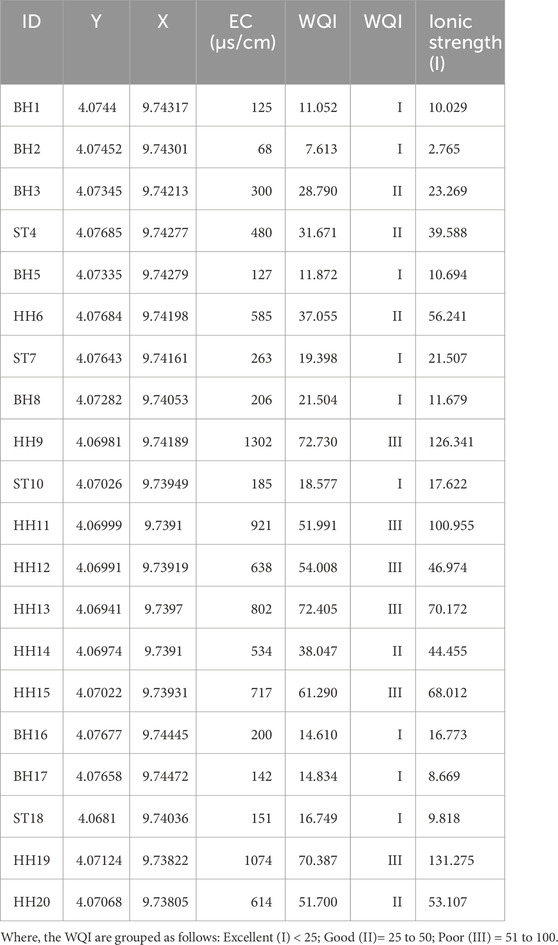
Table 3. Water quality index in the study area.
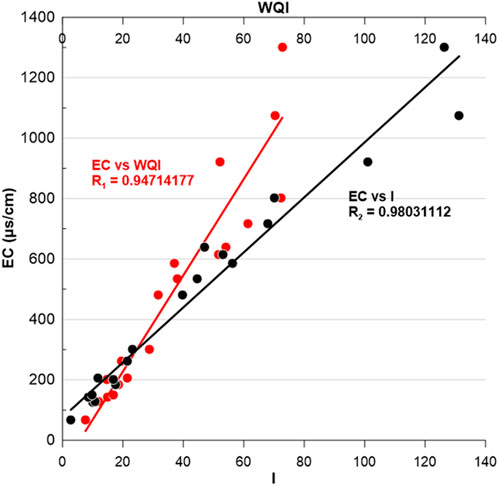
Figure 12. Correlations between EC, WQI and ionic strength (adapted from Maurya et al., 2017).
Based on 14 geoelectric profile surveys within the Makepé landfill and its periphery, combined with data from 118 drilled wells and 49 points along the ERT profile using seismo-electric tomography, the following findings have been determined:
The lithostratigraphic analysis and resistivity profiling conducted in the Douala aquifer system reveal significant insights into groundwater flow, leachate migration, and water quality. The presence of clay, sandy clay, clayey sand, and gravel corresponds to the Mio-Pliocene sands typical of shallow aquifers. Groundwater levels vary, with higher head values in the east and lower values near the Tongo Bassa River, indicating groundwater drainage into the river. This dynamic, coupled with high groundwater recharge during the rainy season, can lead to river oversaturation and potential flooding.
Resistivity profiles from the target dump site show distinct layers with varying resistivity values. Low resistivity zones suggest the presence of a leachate plume, which migrates from the subsurface to the surface, following NW-SW oriented fractures. This leachate movement is limited to the shallow aquifer, with deeper clay layers acting as natural barriers that prevent further vertical migration.
The WQI of the groundwater was found to be poor in some samples collected from hand-dug wells, whereas samples collected from drilled wells (depth >70 m) were found to have a good WQI. This indicates that contamination is limited to shallow aquifers and that high groundwater recharge diffuses the water toward rivers. Positive correlations between Electrical Conductivity (EC), WQI, and ionic strength indicate that EC can serve as a reliable indicator of leachate presence in the dumpsite. To better understand and manage the contamination level of hand-dug wells, which are used for both domestic and commercial purposes by inhabitants, heavy metal quantification should be carried out.
The study concludes that fracture networks significantly influence the infiltration and migration of fluids from unconfined and semi-confined aquifers to the confined aquifer system. This underscores the need for careful monitoring and management to mitigate potential contamination and ensure sustainable water quality in the Douala aquifer system.
Combining electrical tomography, seismo-electric tomography, and basic water chemistry proves to be a cost-effective approach for assessing groundwater conditions within sedimentary basin aquifer system.
The datasets presented in this study can be found in online repositories. The names of the repository/repositories and accession number(s) can be found below: https://data.mendeley.com/datasets/th8wnh4xyt.
ZK: Conceptualization, Formal Analysis, Methodology, Visualization, Writing–original draft, Writing–review and editing. JY: Supervision, Validation, Writing–review and editing. AD: Supervision, Validation, Writing–original draft. JH: Writing–review and editing. CP: Data curation, Formal Analysis, Writing–original draft. OR: Project administration, Resources, Writing–original draft. KD: Formal Analysis, Investigation, Writing–original draft. MA: Formal Analysis, Investigation, Writing–original draft.
The author(s) declare financial support was received for the research, authorship, and/or publication of this article. This study is supported by Natural Science Foundation of Shandong Province-General Program (ZR2023MD087), Shandong Province Leading Talent Support (ZX20240014), National Natural Science Foundation of China Outstanding Youth Science Fund Project (Overseas) (ZX20230152), and the Marine ST Fund of Shandong Province for Pilot National Laboratory for Marine Science and Technology (Qingdao) (2021QNLM020001).
The authors acknowledge the Douala Urban Council, which gave us the authorizations to work in this area, and the Department of Geology at the University of Buea, which provided the logistical support needed to carry out this work.
The authors declare that the research was conducted in the absence of any commercial or financial relationships that could be construed as a potential conflict of interest.
All claims expressed in this article are solely those of the authors and do not necessarily represent those of their affiliated organizations, or those of the publisher, the editors and the reviewers. Any product that may be evaluated in this article, or claim that may be made by its manufacturer, is not guaranteed or endorsed by the publisher.
The Supplementary Material for this article can be found online at: https://www.frontiersin.org/articles/10.3389/feart.2024.1400283/full#supplementary-material
Arato, A., Vagnon, F., and Comina, C. (2022). First application of a new seismo-electric streamer for combined resistivity and seismic measurements along linearly extended earth structures. Near Surf. Geophys. 20, 117–134. doi:10.1002/nsg.12198
Aziz, N. A., Abdulrazzaq, Z. T., and Agbasi, O. E. (2019). Mapping of subsurface contamination zone using 3D electrical resistivity imaging in Hilla city, Iraq. Environ. Earth Sci. 78, 502. doi:10.1007/s12665-019-8520-9
Bichet, V., Grisey, E., and Aleya, L. (2016). Spatial characterization of leachate plume using electrical resistivity tomography in a landfill composed of old and new cells (Belfort, France). Eng. Geol. 211, 61–73. doi:10.1016/j.enggeo.2016.06.026
Boum-Nkot, S. N., Nlend, B., Komba, D., Ndondo, G. R. N., Bello, M., Fongoh, E. J., et al. (2023). Hydrochemistry and assessment of heavy metals groundwater contamination in an industrialized city of sub-Saharan Africa (Douala, Cameroon). Implication on human health. HydroResearch 6, 52–64. doi:10.1016/j.hydres.2023.01.003
Butler, K. E., Kepic, A. W., and Rosid, M. S. (2002). “An experimental seismoelectric survey for groundwater exploration in the Australian Outback,” in SEG technical program expanded abstracts 2002 (Society of Exploration Geophysicists), 1484–1487. doi:10.1190/1.1816945
Butler, K. E., Kulessa, B., and Pugin, A. J.-M. (2018). Multimode seismoelectric phenomena generated using explosive and vibroseis sources. Geophys. J. Int. 213, 836–850. doi:10.1093/gji/ggy017
Chi, D. (2021). Geothermal exploration by seismoelectric survey. J. Geol. Geophys 10. doi:10.35248/2381-8719.21.10.492
Christensen, T. H., Kjeldsen, P., Bjerg, P. L., Jensen, D. L., Christensen, J. B., Baun, A., et al. (2001). Biogeochemistry of landfill leachate plumes. Appl. Geochem. 16, 659–718. doi:10.1016/S0883-2927(00)00082-2
Christopher, W. A. P. P., De Silva, N., Attanayake, A. M. A. N. B., and Jayasingha, P. (2023). Characterization of landslides: a vertical electrical sounding approach. Geosci. Lett. 10, 18. doi:10.1186/s40562-023-00274-x
Du Preez, M. (2019). Geosuite app. Available at: www.atsgeosuite.net/.
Du Preez, M., McKendry, J. R., Knight, N., and Monckton, N. (2010). Comparative study of an electro seismic investigation of the BR52 and BR53 geothermal wells located on the ohaaki geothermal system near taupo, NZ. New zealand: aquatronic solutions ltd. Available at: https://www.atsgeosuite.net/s/Paper-BR52-and-BR53.pdf.
Emvoutou, H. C., Estelle Ndomè, E.-P., Diongue, D. M. L., Ndam, J. R., Stumpp, C., Ketchemen-T., B., et al. (2024). Hydrochemical and isotopic studies providing a new functional model for the coastal aquifers in Douala Coastal Sedimentary Basin (DCSB)/Cameroon. Sci. Total Environ. 912, 169412. doi:10.1016/j.scitotenv.2023.169412
Emvoutou, H. C., Ketchemen Tandia, B., Ngo Boum Nkot, S., Ebonji, R. C. S., Nlend, Y. B., Ekodeck, G. E., et al. (2018). Geologic factors controlling groundwater chemistry in the coastal aquifer system of Douala/Cameroon: implication for groundwater system functioning. Environ. Earth Sci. 77, 219. doi:10.1007/s12665-018-7400-z
Fantong, W. Y., Kamtchueng, B. T., Ketchemen-Tandia, B., Kuitcha, D., Ndjama, J., Fouepe, A. T., et al. (2016). Variation of hydrogeochemical characteristics of water in surface flows, shallow wells, and boreholes in the coastal city of Douala (Cameroon). Hydrological Sci. J. 61, 2916–2929. doi:10.1080/02626667.2016.1173789
Ganiyu, S. A., Badmus, B. S., Oladunjoye, M. A., Aizebeokhai, A. P., Ozebo, V. C., Idowu, O. A., et al. (2016). Assessment of groundwater contamination around active dumpsite in Ibadan southwestern Nigeria using integrated electrical resistivity and hydrochemical methods. Environ. Earth Sci. 75, 643. doi:10.1007/s12665-016-5463-2
George, A. (2006). Development of geoelectrical techniques for investigation and monitoring of landfills. Cardiff University. Available at: https://orca.cardiff.ac.uk/id/eprint/56077/1/U584831.pdf.
Giang, N. V., Kochanek, K., Vu, N. T., and Duan, N. B. (2018). Landfill leachate assessment by hydrological and geophysical data: case study NamSon, Hanoi, Vietnam. J. Mater Cycles Waste Manag. 20, 1648–1662. doi:10.1007/s10163-018-0732-7
Haines, S. S., Guitton, A., and Biondi, B. (2007a). Seismoelectric data processing for surface surveys of shallow targets. GEOPHYSICS 72, G1–G8. doi:10.1190/1.2424542
Haines, S. S., Pride, S. R., Klemperer, S. L., and Biondi, B. (2007b). Seismoelectric imaging of shallow targets. GEOPHYSICS 72, G9–G20. doi:10.1190/1.2428267
Helene, L. P. I., and Moreira, C. A. (2021). Analysis of leachate generation dynamics in a closed municipal solid waste landfill by means of geophysical data (DC resistivity and self-potential methods). Pure Appl. Geophys. 178, 1355–1367. doi:10.1007/s00024-021-02700-7
Ibraheem, I. M., Tezkan, B., and Bergers, R. (2021). Integrated interpretation of magnetic and ERT data to characterize a landfill in the north-west of cologne, Germany. Pure Appl. Geophys. 178, 2127–2148. doi:10.1007/s00024-021-02750-x
Jones, B. A., and Christopher, D. L. (2018). The effects of water infiltration on leachate migration in landfills. Waste Manag. 45, 134–142. doi:10.1016/j.wasman.2018.01.022
Jouniaux, L., and Ishido, T. (2012). Electrokinetics in earth sciences: a tutorial. Int. J. Geophys. 2012, 1–16. doi:10.1155/2012/286107
Jouniaux, L., and Zyserman, F. (2015). Seismo-electrics, electro-seismics, and seismo-magnetics for earth sciences. Geophy. doi:10.5194/sed-7-2563-2015
Jouniaux, L., and Zyserman, F. (2016). A review on electrokinetically induced seismo-electrics, electro-seismics, and seismo-magnetics for Earth sciences. Solid earth. 7, 249–284. doi:10.5194/se-7-249-2016
Kevin, Z., Yang, J., Djieto Lordon, A. E., Huang, J., Pako Perabi, C. J., and Agyingi, C. M. (2024). Integrated geophysical exploration, water quality mapping and salinization of the coastal aquifers in Bonaberi, Douala, Cameroon. Acta. geophys. doi:10.1007/s11600-024-01389-1
Liu, J., Wang, M., Gao, Z., Chen, Q., Wu, G., and Li, F. (2020). Hydrochemical characteristics and water quality assessment of groundwater in the Yishu River basin. Acta. geophys. 68, 877–889. doi:10.1007/s11600-020-00440-1
Loke, M. H., and Barker, R. D. (1995). Least-squares deconvolution of apparent resistivity pseudosections. Geophys. 60, 1682–1690. doi:10.1190/1.1443900
Loke, M. H., and Barker, R. D. (1996). Rapid least-squares inversion of apparent resistivity pseudosections by a quasi-Newton method1. Geophys. Prospect. 44, 131–152. doi:10.1111/j.1365-2478.1996.tb00142.x
Loke, M. H., Chambers, J. E., Rucker, D. F., Kuras, O., and Wilkinson, P. B. (2013). Recent developments in the direct-current geoelectrical imaging method. J. Appl. Geophys. 95, 135–156. doi:10.1016/j.jappgeo.2013.02.017
Mafany, T. G., Fantong, W. T., and Nkeng, G. E. (2006). “Groundwater quality in Cameroon and its vulnerability to pollution,” in Groundwater pollution in Africa (CRC Press). Available at: https://www.taylorfrancis.com/chapters/edit/10.1201/9780203963548-14/groundwater-quality-cameroon-vulnerability-pollution-mafany-fantong-nkeng.
Maurya, P. K., Rønde, V. K., Fiandaca, G., Balbarini, N., Auken, E., Bjerg, P. L., et al. (2017). Detailed landfill leachate plume mapping using 2D and 3D electrical resistivity tomography - with correlation to ionic strength measured in screens. J. Appl. Geophys. 138, 1–8. doi:10.1016/j.jappgeo.2017.01.019
Mondal, S. K., Sastry, R. G., Gautam, P. K., and Pachauri, A. K. (2007). “High resolution resistivity imaging of naitwar bazar landslide, garhwal himalaya, India,” in Symposium on the application of Geophysics to engineering and environmental problems 2007 (Environment and Engineering Geophysical Society), 629–635. doi:10.4133/1.2924721
Niculescu, B. M., and Andrei, G. (2021). Application of electrical resistivity tomography for imaging seawater intrusion in a coastal aquifer. Acta geophys. 69, 613–630. doi:10.1007/s11600-020-00529-7
Nkot, S. (2015). Origin of mineralization of groundwater in the Tongo Bassa. J. Hydrogeol. Hydrol. Eng. 04. doi:10.4172/2325-9647.1000117
Osinowo, O. O., and Falufosi, M. O. (2018). 3D Electrical Resistivity Imaging (ERI) for subsurface evaluation in pre-engineering construction site investigation. NRIAG J. Astronomy Geophys. 7, 309–317. doi:10.1016/j.nrjag.2018.07.001
Ramatlapeng, G. J., Atekwana, E. A., Ali, H. N., Njilah, I. K., and Ndondo, G. R. N. (2021). Assessing salinization of coastal groundwater by tidal action: the tropical Wouri Estuary, Douala, Cameroon. J. Hydrology Regional Stud. 36, 100842. doi:10.1016/j.ejrh.2021.100842
Smith, J., Thi Hoang, N., and Liang S, W. (2020). Modeling the impact of hydraulic conductivity on leachate transport in subsurface environments. J. Contam. Hydrology 210, 12–23. doi:10.1016/j.jconhyd.2020.03.004
Soupios, P., Papadopoulos, N., Papadopoulos, I., Kouli, M., Vallianatos, F., Sarris, A., et al. (2007). Application of integrated methods in mapping waste disposal areas. Environ. Geol. 53, 661–675. doi:10.1007/s00254-007-0681-2
Sun, X., Jiang, Y., Huang, Y., Su, Y., and Miao, K. (2022). Modelling groundwater flow and contaminant migration in heterogeneous fractured media at a municipal solid waste landfill in nanjing lishui, China. Geofluids 2022, 1–15. doi:10.1155/2022/8391260
Takem, G. E., Chandrasekharam, D., Ayonghe, S. N., and Thambidurai, P. (2010). Pollution characteristics of alluvial groundwater from springs and bore wells in semi-urban informal settlements of Douala, Cameroon, Western Africa. Environ. Earth Sci. 61, 287–298. doi:10.1007/s12665-009-0342-8
Takem, G. E., Kuitcha, D., Ako, A. A., Mafany, G. T., Takounjou-Fouepe, A., Ndjama, J., et al. (2015). Acidification of shallow groundwater in the unconfined sandy aquifer of the city of Douala, Cameroon, Western Africa: implications for groundwater quality and use. Environ. Earth Sci. 74, 6831–6846. doi:10.1007/s12665-015-4681-3
Tichaawa, T. M. (2017). Business tourism in Africa: the case of Cameroon. Tour. Rev. Int. 21, 181–192. doi:10.3727/154427217X14939227920829
Wirmvem, M. J., Ohba, T., Nche, L. A., Kamtchueng, B. T., Kongnso, W. E., Mimba, M. E., et al. (2017). Effect of diffuse recharge and wastewater on groundwater contamination in Douala, Cameroon. Environ. Earth Sci. 76, 354. doi:10.1007/s12665-017-6692-8
Yevalla, G.-M. S., Blaise, B. B. M. E., Seth, R. E., Beka, É. T., and Tabod, T. C. (2020). Constructing a 3D geological model from geophysical data for groundwater modelling and management in the Kribi-Campo sedimentary sub-basin, Cameroon. Water Pract. Technol. 15, 105–119. doi:10.2166/wpt.2020.004
Keywords: electrical resistivity imaging, seismo-electric imaging, leachate, landfill, groundwater, aquifer
Citation: Kevin ZDM, Yang J, Djieto Lordon AE, Huang J, Perabi CJP, Rapheal O, Dirane KNJ and Ahmed MNM (2024) Geoelectrical and seismoelectric mapping of subsurface pollution in a closed landfill near the Tongo Bassa and Ngongue river, Douala Cameroon. Front. Earth Sci. 12:1400283. doi: 10.3389/feart.2024.1400283
Received: 13 March 2024; Accepted: 18 July 2024;
Published: 01 August 2024.
Edited by:
Omar Hamza, University of Derby, United KingdomReviewed by:
Basant Yadav, Indian Institute of Technology Roorkee, IndiaCopyright © 2024 Kevin, Yang, Djieto Lordon, Huang, Perabi, Rapheal, Dirane and Ahmed. This is an open-access article distributed under the terms of the Creative Commons Attribution License (CC BY). The use, distribution or reproduction in other forums is permitted, provided the original author(s) and the copyright owner(s) are credited and that the original publication in this journal is cited, in accordance with accepted academic practice. No use, distribution or reproduction is permitted which does not comply with these terms.
*Correspondence: Jidong Yang, amlkb25nLnlhbmdAdXBjLmVkdS5jbg==
Disclaimer: All claims expressed in this article are solely those of the authors and do not necessarily represent those of their affiliated organizations, or those of the publisher, the editors and the reviewers. Any product that may be evaluated in this article or claim that may be made by its manufacturer is not guaranteed or endorsed by the publisher.
Research integrity at Frontiers
Learn more about the work of our research integrity team to safeguard the quality of each article we publish.