 Yanju Li
 Yuandong Wu3
 Shengling Jiang
94% of researchers rate our articles as excellent or good
Learn more about the work of our research integrity team to safeguard the quality of each article we publish.
Find out more
ORIGINAL RESEARCH article
Front. Earth Sci., 16 May 2024
Sec. Geochemistry
Volume 12 - 2024 | https://doi.org/10.3389/feart.2024.1399541
To clarify the evolution of thermal maturity and pore structure in continental organic-rich shales, calcareous shales of the Liaohe Basin (China) were pyrolyzed, and examined using Raman spectroscopy, Fourier transform infrared spectroscopy (FTIR), X-ray diffraction (XRD), X-ray photoelectron spectroscopy (XPS), scanning electron microscopy (SEM), nitrogen sorption isotherms, and nuclear magnetic resonance (NMR) spectroscopy. The increase in Raman G‒D band separation and decrease in Raman ID/IG ratio with increasing thermal maturity indicate that these parameters provide superior thermal maturity indicators. This is also confirmed by the good linear correlation of G‒D band shifts and ID/IG with vitrinite reflectance (VR) and maximum temperature (Tmax), respectively. The relative detection accuracy (DA), sampling requirements (SR), sample preparation (SP), detection time (DT), and equipment requirement (ER) of VR, G‒D band shifts, ID/IG, Tmax, FTIR, and XPS indicate that Raman analysis is a simple, quick, and robust method to evaluate thermal maturity. The moderate SR, complex SP, and long DT suggest that VR and Tmax are less widely applicable for characterizing thermal maturity. The FTIR and XPS techniques provide semi-quantitative maturity indicators with poor DA and high ER. Pores observed within organic matter and minerals under SEM indicate that an increase in thermal maturity not only affects the development of organic pores but is also beneficial for the formation of mineral dissolution pores, such as those formed during the transformation of Na0.95Ca0.16Al1.16Si2.84O8 to Na0.84Ca0.02Al1.02Si2.98O8, a process confirmed by XRD. The BET and NMR data also indicate that the development of pore structure is closely related to the evolution of thermal maturity in calcareous shale. During the initial stage, primary pores are filled by bitumen generated from kerogen; this leads to a decrease in transition pores, mesopores, and shale porosity, and reduced pore connectivity. Then, secondary nanoscale pores, transition pores, and mesopores increase with increasing thermal maturity. The peak in secondary porosity is consistent with the liquid hydrocarbon production rate peak, a process that increases shale porosity and leads to improved pore connectivity. The dissolution of minerals induced by organic acids may also contribute to this secondary porosity. With a further increase in thermal maturity, secondary porosity at the microscale is further developed, while transition pores and mesopores collapse, resulting in reduced pore connectivity. The poor pore connectivity that occurs at both low and high VR values may be more conducive to the preservation of shale oil and gas. This study is significant for research into the evolution of thermal maturity and pore structure in continental organic-rich shales.
Shale gas is a type of unconventional petroleum, which is generated from, and hosted in, organic-rich shales. There are three states in which shale gas exists: 1) free state, distributed in micro-cracks and macropores; 2) adsorbed state, adhered on the surface of organic matter and clay mineral micropores; and 3) dissolved state, dispersed in water and oil. Among these, free gas and adsorbed gas are the main components of shale gas (Curtis, 2002; Ji et al., 2017; Zhu et al., 2021). Therefore, investigating the pore composition and development characteristics of shale and associated influencing factors is critical for shale oil and gas exploration and development.
According to the relationship between shale pores and mineral particles, shale pores can be divided into mineral pores, organic pores, and micro-fracture pores. In organic-rich shales, organic pores are the most important pore component because they can comprise up to 70% of the total pore volume of the shale, whilst also having good connectivity (Löhr et al., 2015; Ji et al., 2017; Borjigin et al., 2021; Zhang et al., 2022; Zheng et al., 2022). Investigating pore composition and evolution as organic-rich shales mature has important theoretical and practical significance for predicting shale gas content and evaluating shale gas resources.
Highly productive shale gas has been shown to be strongly associated with high-maturity shales (Wu et al., 2019; Chen et al., 2020; Song et al., 2021; Zheng et al., 2021; Cao et al., 2022), indicating that highly productive shale gas has inevitably experienced a high evolutionary stage and deep burial. In this long and complicated evolution process, the hydrocarbon generation of organic matter and the transformation of clay minerals in shale may have mutual influence. Such as, the organic acids formed in the process of hydrocarbon generation can accelerate the dissolution of minerals and affect the transformation of clay minerals; clay minerals also have catalytic effect on hydrocarbon generation and liquid hydrocarbon cracking. Previous investigators mainly focus on the change of organic pore structure with maturity, and few studies have investigated the effect of organic-inorganic interaction during shale thermal evolution on the formation and evolution of shale pores. At the same time, there are few experimental studies to discuss the influences of organic-inorganic interaction on mineral and organic pores with thermal maturity.
Generally, vitrinite reflectance (VR) and maximum temperature (Tmax) values provide good thermal maturity indicators for source rocks and organic matter (Hunt, 1996; Evenick, 2021; Al-Hajeri et al., 2021; Lohr et al., 2015; Waliczek et al., 2021). However, for some samples, VR and Tmax cannot accurately reflect maturity due to a lack of vitrinite or low S2 values (Lewan and Kotarba, 2014; Katz and Lin, 2021), this is the case for highly mature marine shales in the Sichuan Basin, China, and for limestone source rocks with low organic matter contents. Therefore, additional maturity indicators, which are easy to detect and provide high-performance, need to be developed to cover organic matter from a wide range of source rocks, deposited under different sedimentary settings, or at different stages of thermal evolution.
Owing to the success of marine shale gas exploration in both Permian shales and the Devonian‒Carboniferous Bakken shale of North America, many investigators have focused on the pore structure and development of marine shales (Hao et al., 2013; Hao and Zou, 2013; Yang et al., 2017; Wu et al., 2018; Yang et al., 2018; Shi et al., 2021; Xu et al., 2021), while there have been relatively few investigations of the pore evolution of continental organic-rich shales. Continental shale gas has great potential, and accounts for one-third of the total shale gas resources of China (Fan et al., 1980; Fu et al., 1988; Grice et al., 1998). Therefore, understanding the evolution of pore textures in continental organic-rich shales can contribute meaningfully to global shale gas exploration and development, especially in China.
In this study, we investigated the evolution of the thermal maturity and mineral/organic pore structure of continental organic-rich shales under semi-closed hydrous conditions to clarify the evolution of thermal maturity, and mineral/organic pores during shale gas generation. Calcareous shales from the Liaohe Basin (China) were pyrolyzed, and examined using laser Raman spectroscopy, Fourier transform infrared spectroscopy (FTIR), X-ray diffraction (XRD), X-ray photoelectron spectroscopy (XPS), scanning electron microscopy (SEM), nitrogen sorption isotherms (BET), and nuclear magnetic resonance (NMR) spectroscopy. Raman, FTIR, XRD, and XPS were used to detect changes in organic functional groups and mineral composition; SEM, BET, and NMR were used to analyze the evolution of pore texture and formation. This study has substantial implications for understanding the evolution of thermal maturity and pore structure in continental organic-rich shales, and for global shale gas exploration and development.
Calcareous shales were selected from the Shu 13 drill core from the Liaohe Basin (Shahejie Formation), as shown in Figure 1. Table 1 presents the geochemical parameters of these shales; details of the geochemical analysis methods were presented in a previous study (Wu et al., 2018). The geochemical data indicate that the kerogen in the calcareous shales is type-I kerogen and is immature (VR = 0.40%Ro; Tmax = 434 °C). Table 1 also shows that the hydrogen index (HI) of the calcareous shales is 792, which further suggests that they are oil-prone source rocks (Table 1; Wu et al., 2018).
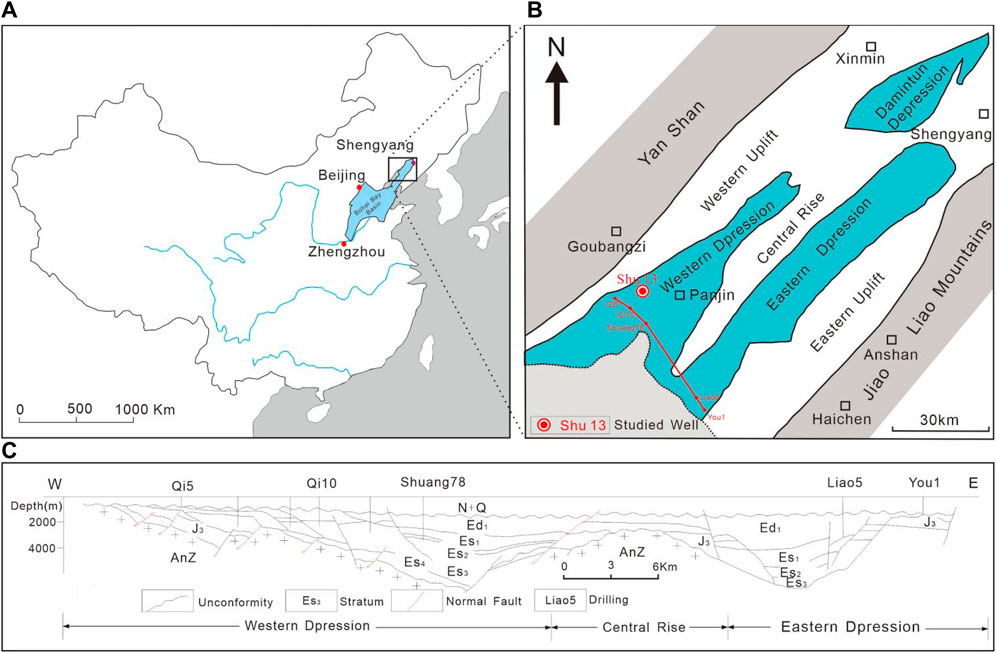
Figure 1. Location (A) and sketch structural (B) maps, and schematic geological cross-section (C) of Liaohe Basin.

Table 1. Geochemical parameters of the organic-rich shale study samples (after Wu et al., 2018).
A WYMN-3 HTHP instrument was used to simulate the thermal evolution process of continental organic-rich shales under geological conditions. The maximum simulation temperature of the WYMN-3 HTHP is 550°C, while the maximum values of water pressure and lithostatic pressure are 2,800 bar and 1,200 bar, respectively. A schematic diagram of the main structure of the instrument can be found in Zhang et al. (2020) and Wu et al. (2021). Hydrous pyrolysis was conducted at 350–520°C, with 400–800 bar water pressure, and 1,000–2000 bar lithostatic pressure. To simulate the entire evolution of the thermal maturity and pore structure of continental organic-rich shales, immature calcareous shale was used, and the pyrolysis temperatures were higher than classical hydrous pyrolysis (e.g., Hill et al., 2003; Xie et al., 2016). Detailed conditions of the pyrolysis experiments can be found in Wu et al. (2018).
The SEM analyses were performed at the South China University of Technology, using a Merlin Compact (Zeiss, Germany) instrument, equipped with an X-ray energy spectrometer (Oxford, England). The resolution of this instrument can reach 1.0 nm at 15 kV accelerating voltage and 2 mm working distance, in high vacuum mode. The accelerating voltage used herein was 20 kV.
The source rocks, before and after pyrolysis, were examined by Raman spectroscopy using an Alpha 300M Raman spectrometer (WITec, Germany). The wavelengths of the laser source were 532 and 732 nm, and the power of the laser source was 5 mW.
Raman spectroscopy can record the entire spectrum of each sample. Generally, a Raman spectrum comprises a peak position, peak intensity, and peak area. To further resolve the sample information contained within a Raman spectrum, curve-fitting is usually performed. In this investigation, Gaussian‒Lorentzian fitting was applied to the Raman spectra of all examined source rocks, before and after pyrolysis; at least 150 iterations were used until the best fit was achieved. Five peaks or bands, including D, G, D2, D3, and D4, can be fitted for organic matter evaluation in shale, as shown in Figure 2 (Khatibi et al., 2018; Khatibi et al., 2019; Birdwell et al., 2021; Craddock and Sauerer, 2022); all of these were fitted herein. However, only the D and G bands, which were most common and had the highest intensity, were considered further in this study (Table 2); the minor bands (D2, D3, and D4) were often unclear in both appearance and significance (cf. Beyssac et al., 2003).
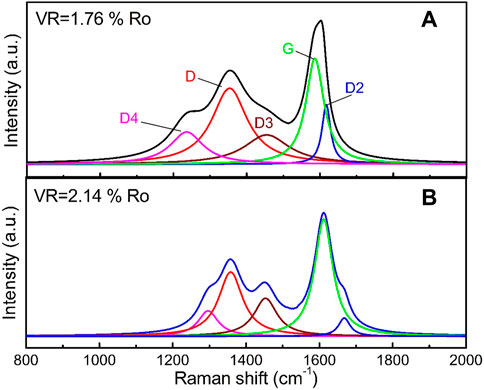
Figure 2. Example of spectral deconvolution and Raman band identification. (A) Sample with a VR of 1.76%Ro. (B) Sample with a VR of 2.14%Ro.
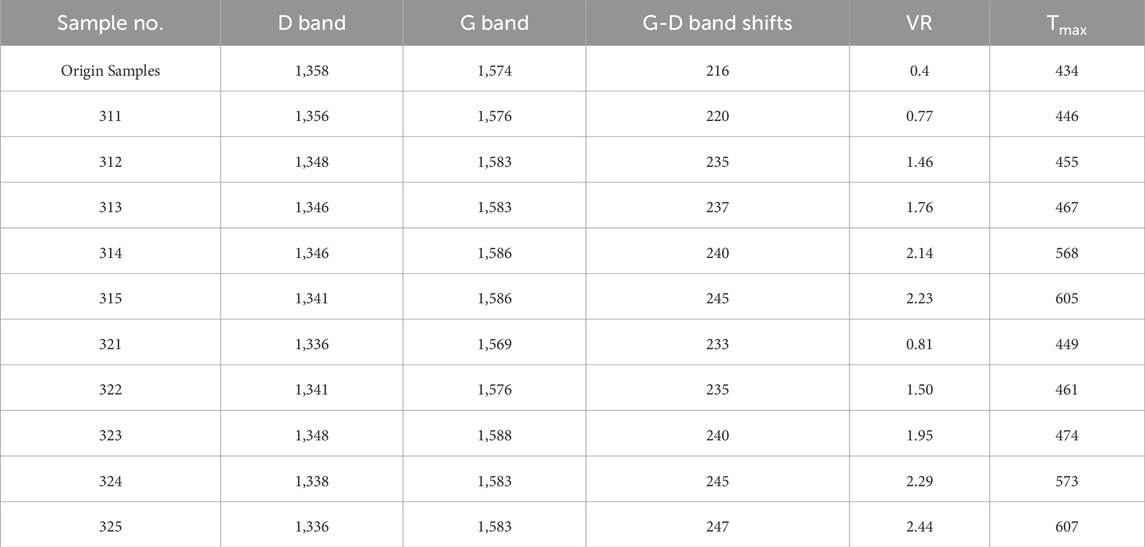
Table 2. Major D- and G-band shifts for the residue and original sample.
The infrared spectra of source rocks, before and after pyrolysis, were detected using a Perkin Elmer Spectrum 100. Each spectrum was the result of 32 scans, and the resolution was 4 cm−1 in the frequency range of 4,000–650 cm−1.
X-ray diffraction patterns of the source rocks, before and after pyrolysis, were obtained using a Rigaku D/Max 2550VB/PC diffractometer equipped with Cu Kα radiation (λ = 1.5406 Å). Duplicate analyses were performed to ensure reproducibility.
Data from the source rocks, before and after pyrolysis, were obtained using a Kratos Axis ULTRA X-ray Photoelectron Spectrometer. Monochromatic Al Kα X-rays (1,486.6 eV) at 150 W (15 kV, 10 mA) were used. The C 1s (286.8 eV) peak was used as an internal standard for correction. For full spectrum scanning, the transit energy was 100 eV, and the step size was 1 eV; for narrow spectrum scanning, the passage energy was 30 eV and the step size was 0.1 eV. To obtain good experimental results, powdered samples ground to ≤0.074 mm were made into compressed tablets for XPS analysis. In XPS C 1s spectra, the ordinate is electron counts, and the abscissa is electron binding energy (B.E.). Based on the different binding energies of carbon elements in different valence states, the XPS C 1s spectra of samples obtained from our experiments were fitted using Casa XPS software. The Shirley model was adopted for back-bottom deduction, and 70% Gaussian and 30% Lorentz hybrid lines were adopted. In the process of peak fitting, the peak position and half-width of all fitted peaks were fixed, and the half-width was 1.5 (±0.1) eV.
An ASAP 2020 Plus HD88 SA analyzer (Micromeritics Instruments Corporation, USA) was used to measure the surface area (SA) and pore volume (PV) of the source rocks, before and after pyrolysis. All samples were crushed to 80 mesh and extracted with chloroform for 72 h, then degassed at 150 °C for 6 h under vacuum before low-temperature N2 adsorption analysis. The N2 adsorption–desorption isotherm measurements were conducted at the temperature of liquid nitrogen (77.3 K) with a relative pressure P/P0 range of 0.01–0.998.
The MicroMR series NMR analyzer used in this study was produced by Suzhou Newmag analytical instrument corporation. The NMR core analyzer can be used as free-induction decay (FID) and Carr-Purcell-Meiboom-Gill pulse sequence (CPMG). sequence. To obtain a more complete NMR response signal and improve the signal-to-noise ratio and resolution, CPMG‒T2 measurements were used. The pyrolyzed samples were dried under vacuum, then the dry columnar samples were saturated with deionized water. NMR T2 distributions were measured using 0.3 ms echo spacing, 3,000 ms waiting time, 10,000 echo numbers, and 64 scan times (Zheng et al., 2019).
Generally, VR and Tmax represent good thermal maturity indicators of source rocks and organic matter (Hunt, 1996; Evenick, 2021; Al-Hajeri et al., 2021; Lohr et al., 2015; Waliczek et al., 2021).
Previous investigations have shown that with increasing kerogen maturity, aromaticity increases and there is a concurrent decrease in H, O, N, and S content (Hunt, 1996; Lewan, 1997; Sun et al., 2021). These changes may be reflected in the Raman spectra of kerogen at the molecular scale (Khatibi et al., 2019). Hence, Raman spectroscopy can be used to investigate the nature and degree of graphitization of kerogenous carbon (Charisiou et al., 2018). The Raman analysis results of pyrolyzed samples are presented in Figure 3. Both samples show Raman bands in the 800–2000 cm−1 region of the spectrum; these are the carbon G- and D-bands, which appear between 1,500 and 1,600 cm−1, and between 1,300 and 1,400 cm−1, respectively. The former is induced by the presence of crystalline graphitic/sp2 carbon atoms and involves out-of-phase intra-layer displacement in the graphene structure; the latter originates from sp3 hybridization and relates to polycrystalline imperfect graphite (Li et al., 2017; Charisiou et al., 2018; Ghaffar et al., 2018). The degree of crystallinity of the carbon formed during the thermal evolution of organic matter can also be reflected by the intensity ratio of the D- and G-bands (ID/IG), where lower ID/IG values suggest higher crystallinity, because a higher quantity of graphitized carbon is generated during organic matter evolution (Hou et al., 2019). In this investigation, the ID/IG values for the pyrolyzed samples follow the order 0.89 > 0.65 >0.63 > 0.51 > 0.40 > 0.38 corresponding to VRs of 0.77%R0 <1.46%Ro < 1.76%Ro < 1.95%Ro < 2.14%Ro < 2.44%Ro. A lower ID/IG ratio may illustrate higher thermal maturity (Muirhead et al., 2021; Zhang et al., 2021), the deduction of which matches the report of Sauerer et al. (2017). For the pyrolyzed continental shales in this investigation, the degree of crystallinity of kerogenous carbon increased with an increase in VR, and this trend was more pronounced for continental shales with VR > 1.46%Ro (Figure 3); this is also consistent with previously noted increases in the aromaticity of kerogen (Beyssac et al., 2002; Lünsdorf, 2016). A decrease in the ID/IG ratio may indicate an increase in larger aromatic clusters and improved ordering of the existing organic compounds within the kerogen.

Figure 3. Raman spectra of kerogen with different VR.
Previous investigations have reported that G- and D-band shifts increase with maturity until the dry gas window is reached (Khatibi et al., 2018; Delarue et al., 2021; Hackley et al., 2021); the D-band shifts towards lower wavenumbers and the G-band shifts towards higher wavenumbers (Kelemen and Fang, 2001; Khatibi et al., 2018; Hackley et al., 2021; Delarue et al., 2021). These increases in separation between the D- and G-bands may be caused by the increase in number of larger aromatic clusters and improved structural ordering of kerogen as maturity increases (Schito et al., 2017; 2021). Further investigations have speculated that these shifts may be attributed to the wavelength dependence of the D-band position and the independence of the excitation energy of the G-band position in the Raman spectra of carbonaceous materials (Marshall et al., 2010; Lünsdorf, 2016; Schito et al., 2017; Schito et al., 2021). The VR, Tmax, and D- and G-band shifts of the original and pyrolyzed samples are listed in Table 3. Figure 4 shows a strong positive relationship between VR and D‒G separation; statistical analysis shows that this is a linear relationship with R2 = 0.8901.
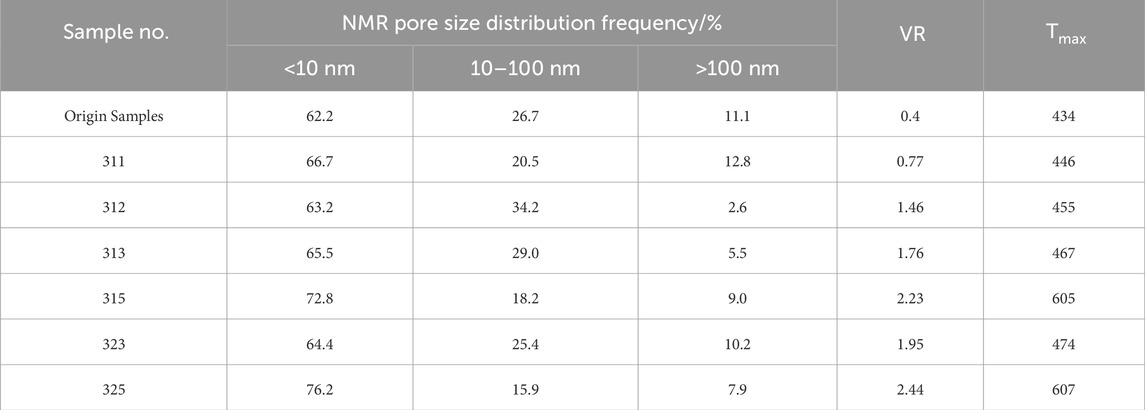
Table 3. Results of pore size distribution in NMR analyses.
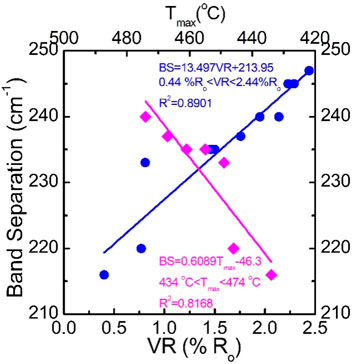
Figure 4. Relationships between VR and D‒G band separation (blue), and Tmax and D‒G band separation (pink).
Generally, the increasing carbon D‒G band separation as organic matter maturity increases is attributed to the D-band shifting towards lower wavenumbers, while the G-band remains largely unchanged. During the initial stages of maturation, D-band shifting increases before gradually stabilizing at the stage of over-maturity, like the trend of coal. Kelemen and Fang (2001) found that the metamorphic grade, like maturity, evolves faster at the catagenesis stage than at the metagenesis stage, for both natural and laboratory matured coal. Moreover, some investigators have also indicated that there is good relationship between D‒G band separation and Tmax values, which represents a good thermal maturity index. However, previous research has suggested that Tmax values may not be an appropriate parameter to quantify the thermal maturity of kerogen with high maturity (≥2.0%Ro) and low S2 values (Lewan and Kotarba, 2014; Wu et al., 2018). A cross-plot of Tmax versus band separation showed good correlation using data from pyrolyzed samples with Tmax ranging from 434°C to 474 °C. Statistical analysis also shows that there was a good linear relationship between Tmax and the D‒G band separation for the pyrolyzed samples with Tmax ranging from 434°C to 474 °C (Figure 4). The band separation increases with increasing Tmax further indicated that the organic compounds in kerogen evolved to larger aromatic clusters and a better-ordered structure.
The FTIR spectra of the organic-rich shales, before and after pyrolysis, had well-resolved peaks and bands, and flat baselines (Figure 5), which indicated that the FTIR spectra were appropriate for further qualitative analysis. Generally, bands at 3,100–3,000 cm−1 and 3,000–2,800 cm−1 have been assigned to aromatic CH stretching vibrations and aliphatic CH stretching vibrations, respectively (Li et al., 2007; Okolo et al., 2015; Chen et al., 2019; Cincinelli et al., 2021; Mastalerz et al., 2021; Phan et al., 2021). As shown in Figure 5, the bands at 3,100–3,000 cm−1 and 3,000–2,800 cm−1 were indiscernible in our pyrolyzed samples; this may indicate that these bands are not suitable for identifying the hydrocarbon potential and maturity of kerogen where there is the influence of large quantities of inorganic minerals within the source rocks.
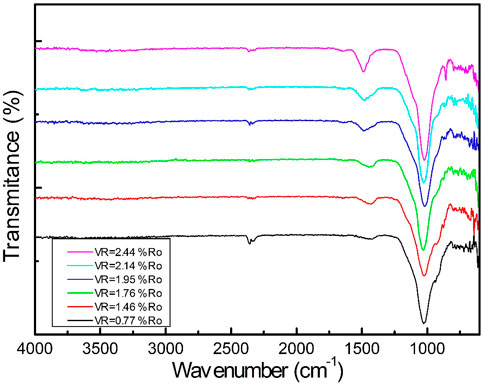
Figure 5. FTIR spectra for the pyrolyzed samples.
The band at ∼2,361 cm−1 may be assigned to adsorbed CO2 and this band becomes broader and the center shifts to a lower wavenumber when 18O is incorporated into CO2 (Liao et al., 2002). The broad bands at ∼2,361 and ∼2,347 cm−1 are due to band overlap of adsorbed C18O2, C16O18O, and C16O2 (Liao et al., 2002). The broad bands at ∼2,361 and ∼2,347 cm−1 are due to band overlap of adsorbed C18O2, C16O18O, and C16O2. Those can be confirmed in previous investigation in which δ13C of CO2 was +0.84 to +1.06‰, suggesting that the adsorbed CO2 was mainly generated from carbonate minerals (Wu et al., 2018), and the inorganic CO2 enrich 18O, comparing with organic CO2 under wet climate, low salinity environments, on the basis that the wet climate and the small mineralization of the shells of the lakes are composed of carbon and oxygen isotopes, which are lightly composed, with the climate drying, the salinity of the lake increases, and the shells are enriched with heavy carbon and oxygen isotopes (Ping, 1990).
A band at ∼1,435 cm−1 was observed in the pyrolyzed samples, representing the aliphatic bending vibration due to CH2 and CH3. This band exhibited more obvious absorbance in the FTIR spectra of the pyrolyzed samples with VRs lower than 1.95%Ro. A shoulder was observed on the left-hand side of the 1,435 cm−1 band, at around 1,460 cm−1. This is generally attributed to the aromatic C=C stretching vibration (Coates, 2000; Van Niekerk et al., 2008; Ding et al., 2021; Wang et al., 2022). The intensity of this shoulder was found to be stronger for pyrolyzed samples with increased VRs from 0.77%Ro to 2.44%Ro and was almost higher than the 1,435 cm−1 peak for pyrolyzed samples with VRs higher than 1.95%Ro (Figure 5). The 1,435 cm−1 peak decreased with increasing maturity for VRs ranging from 0.77%Ro to 2.44%Ro (Figure 5). The ∼1,600 cm−1 band, assigned to stretching vibrations of aromatic rings (Okolo et al., 2015; Phan et al., 2021), became more obvious with increasing maturity for VRs ranging from 0.77%Ro to 2.44%Ro (Figure 5), which was consistent with the behavior of the 1,460 cm−1 peak.
Spectral bands at 1,280–1,000 cm−1 can be assigned to saturated aliphatic skeletal C‒C vibrations, C‒O stretching vibrations of ether groups, and O‒H bending vibrations in phenolic, phenoxy, and hydroxybenzene structures. These bands were also observed in the FTIR spectra of coals (Coates, 2000; Van Niekerk et al., 2008; Okolo et al., 2015; Phan et al., 2021; Wang et al., 2022). The band at 1,030 cm−1 observed in Figure 5 indicates the intensity of C-C stretching vibrations within an aliphatic skeleton (Okolo et al., 2015; Jing et al., 2019; Razavian and Fatemi, 2021; Shang et al., 2021). The 1,280–1,000 cm−1 peak heights of all pyrolyzed samples showed a steady increase with increasing VR, and the narrowing peak width as VR increased indicated that some organic functional groups (such as C‒O and O‒H) were rapidly pyrolyzed and hence sharply decreased; the remaining functional groups (such as C‒C) were slowly pyrolyzed and hence showed less of a decrease.
The out-of-plane aromatic C‒H bending vibrations indicated the presence of substituted aromatic species in aromatic rings; and trans- and cis-CH2 in long, saturated aromatic CH‒CH chains were observed in the 900–700 cm−1 region of the spectra in the entirely pyrolyzed samples (Coates, 2000; Van Niekerk et al., 2008; Malumbazo et al., 2011; Okolo et al., 2015; Jing et al., 2019; Shang et al., 2021; Wang et al., 2022). The peaks in the 900–700 cm−1 region of the spectra became more obvious with increasing VR (Figure 5), indicating an increase in aromatic groups.
In general, the brittleness and adsorption capacity of shale can be affected by its mineralogy. Hence, it is critical for shale evaluation to obtain accurate analysis of the mineral composition of the rocks. Therefore, XRD analysis was performed on the pyrolyzed samples. As can be seen in Figure 6, calcite, albite, and quartz were identified as the main mineral components of the pyrolyzed shale. According to the standard powder diffraction cards of quartz (PDF#85-0795), calcite (PDF#72-1937), albite: Na0.98Ca0.16Al1.16Si2.84O8 (PDF#70-3,752), and albite: Na0.84Ca0.02Al1.02Si2.98O8 (PDF#76-0927), the peaks at 20.8°, 26.7°, 36.6°, and 39.5° were assigned to quartz; peaks at 29.5° and 35.3° were assigned to calcite and Na0.84Ca0.02Al1.02Si2.98O8, respectively; and peaks at 27.9° and 30.5° were assigned to Na0.95Ca0.16Al1.16Si2.84O8 and Na0.84Ca0.02 Al1.02Si2.98O8, respectively.
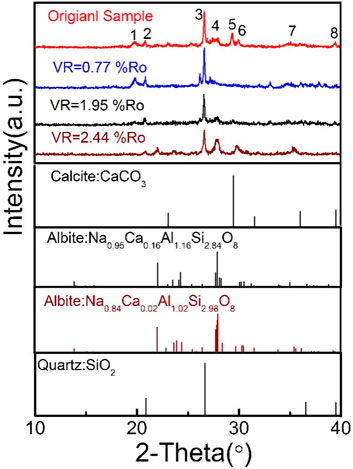
Figure 6. Identification of various mineral phases in pyrolyzed samples. The standard powder diffraction cards of quartz (PDF#85-0795), albite (PDF#70-3,752): Na0.98Ca0.16Al1.16Si2.84O8, albite (PDF#76-0927): Na0.84Ca0.02Al1.02Si2.98O8, and cal. (PDF#72-1937) are also presented.
Calcite is a carbonate mineral, and its peak (29.5°) intensity dramatically decreased with increasing maturity (Figure 6); this could be ascribed to the thermal decomposition of carbonate under hydrous pyrolysis. It is notable that the quartz peak (26.7°) intensity decreased with increasing VR (Figure 6), while the albite peak (27.9°) intensity increased with increasing VR. This appears to indicate that feldspathization was enhanced with an increase in maturity. In addition, the elemental composition of albite changed with increasing VR; the 35.3° peak assigned to Na0.84Ca0.02 Al1.02Si2.98O8 increased with increasing VR, indicating that Na0.95Ca0.16Al1.16Si2.84O8 converted to Na0.84Ca0.02 Al1.02Si2.98O8 with increasing VR (Figure 6). Thus, the XRD results suggest that carbonates were broken down, and quartz and albite (Na0.98Ca0.16Al1.16Si2.84O8) were converted to Na0.84Ca0.02 Al1.02Si2.98O8 as kerogen became more thermally mature. Such inorganic mineral reactions may affect the brittleness and adsorption capacity of the shales.
To quantify the binding forms of oxygen, carbon, nitrogen, aluminum, and silicon during organic matter evolution, high resolution XPS spectra of O 1s, C 1s, N 1s, Al 2p, and Si 2p were de-convoluted using Gaussian‒Lorentzian peaks (Wang et al., 2013; Jing et al., 2019; Liu et al., 2021; Wu and Xu, 2022). The XPS wide energy spectra of the original kerogen sample and the pyrolyzed samples are illustrated in Figure 7. The original sample was found to have low oxygen (12.12%) and high carbon (82.38%) contents. After pyrolysis, the oxygen content increased to 40.15% at VR = 1.46%Ro, 52.01% at VR = 1.95%Ro, and 52.18% at VR = 2.44%Ro, accompanied by a decreasing trend in carbon content (Figure 7A, D, G, J). The trend of a decrease in C 1s suggests that the kerogen gradually broke down and hydrocarbons were generated as VR increased. The increase in O 1s may be attributed to the oxidation of organic carbon or reactions between inorganic minerals during hydrous pyrolysis.

Figure 7. XPS wide scan data from the original kerogen (A–C) and pyrolyzed samples (D–L).
The evolution of carbon content agree with that was found in the ultimate analysis, while evolution of oxygen content showed contrary tendency with that was found in the ultimate analysis of kerogen (Wu et al., 2018). This may indicate that the increase in oxygen content was mainly contained within inorganic material (e.g., albite and quartz) rather than organic matter (e.g., kerogen and retained petroleum). The data shown in Figure 7 directly confirmed the increase in silicon content within feldspar that occurred during feldspathization and organic matter evolution. The decrease in the 533.0 eV binding energy peak corresponding to Si‒O in quartz, and the slight decrease in the 531.5 eV binding energy peak corresponding to Al‒O in albite further confirmed the conversion of Na0.95Ca0.16Al1.16Si2.84O8 to Na0.84Ca0.02 Al1.02Si2.98O8 (Figure 6C,F, I, L).
Figure 7B, E, H, K shows the high resolution XPS spectra of C 1s for calcareous shale. The peak at a binding energy of 284.6 eV corresponds to C‒C or C‒H groups, while that at 285.7 eV corresponds to a C‒O group (alcohol, phenol, or ether) (Buckley and Lamb, 1996; Gong et al., 1998; Jing et al., 2019; Liu et al., 2021; Wu and Xu, 2022). The 288.9–289.5 eV binding energy peaks that appeared at VRs of 1.95%Ro and 2.44%Ro correspond to the COOH (carboxyl) group, which may indicate that water has some oxidability to organic carbon at a high stage of thermal evolution. This is also supported by the binding energy peaks at 531.5 eV in the O 1s XPS spectra increasing at VRs of 1.46%Ro, 1.95%Ro, and 2.44%Ro (Figures 7I, L). This increase in O 1s may partly derive from the oxidation of organic carbon during hydrous pyrolysis.
The Raman, XRD, and XPS results suggested changes in inorganic material and organic matter during hydrous pyrolysis. More information was then needed to directly demonstrate the processes of thermal decomposition of carbonates and organic matter, and conversion of Na0.95Ca0.16Al1.16Si2.84O8 to Na0.84Ca0.02Al1.02Si2.98O8. As shown in Figure 8, the morphology and pore structure of inorganic and organic matter in the original samples and pyrolyzed residues were fully characterized using SEM imaging and SEM-EDS analysis.
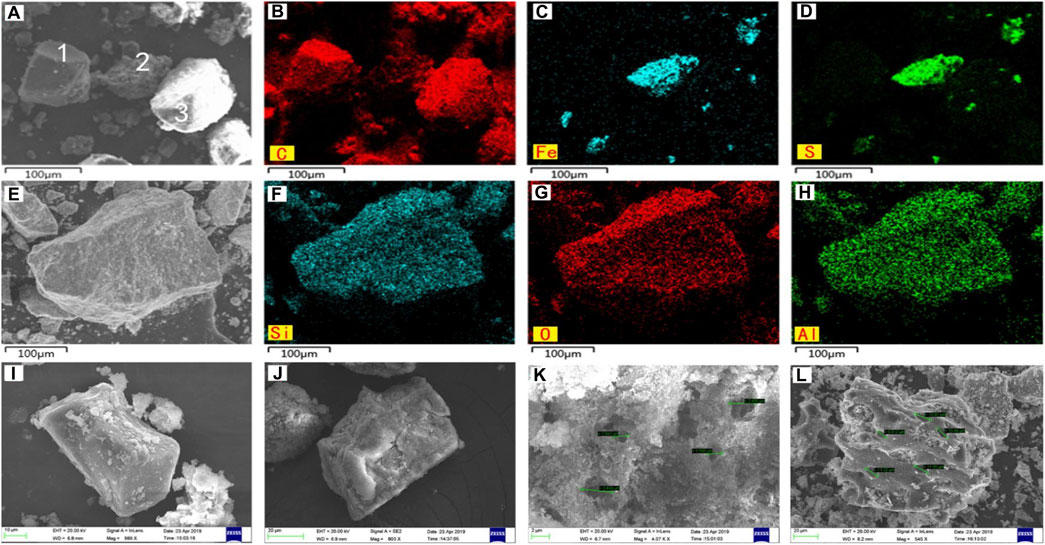
Figure 8. SEM images and SEM-EDS elemental maps showing the morphology and chemistry of inorganic minerals and organic matter. Organic matter (1, 3) and pyrite (2) in the original sample (A). Elemental maps of C (B), Fe (C), and S (D) within the organic matter and pyrite. Feldspar in the original sample (E). Elemental maps of Si (F), O (G), and Al (H) within feldspar. Carbonate before (I) and after (J) pyrolysis at VR=1.5. Morphology of pores in feldspar (K) and organic matter (L) after pyrolysis at VR=1.5.
In the original samples, organic matter and inorganic minerals were observed in SEM images, and C, Fe, and S were also detected by SEM-EDS (Figures 8A–D). The EDS map of carbon distribution (Figure 8B) indicates that the features labeled 1 and 3 in Figure 8A are organic matter. The distributions of Fe and S correspond with each other (Figures 8C, D), which suggests that the feature labeled 2 in Figure 8A is pyrite, a mineral associated with a favorable reduction environment for oil-prone organic matter. The elements Si, O, and Al have distributions that correspond with one another (Figures 8F–H), suggesting that the mineral shown in Figure 8E is feldspar. The results of XRD analysis further indicate that this is albite (Figure 6). Carbonate can also be observed in SEM images (Figure 8I).
After hydrous pyrolysis, decomposition of carbonates was observed in SEM images; fractures formed on the surface of the carbonates, some of which broke down into similar layered blocks (Figure 8J). Many pores also formed on the surface of albite, which may have developed during the transformation of Na0.95Ca0.16Al1.16Si2.84O8 to Na0.84Ca0.02Al1.02Si2.98O8 (Figure 6; Figure 9K). Pore sizes ranged from 1.505 to 3.430 μm (Figure 8K). These pores may be the result of the leaching of Ca2+ and Al3+ during the transformation of albite. More pores developed around organic matter, and these had a size range of 8.412–13.970 μm (Figure 8L). Similar pores were also observed on the surface of high-rank coals (Zheng et al., 2019; Zhang et al., 2021). Organic matter was also decomposed into many porous pieces by pyrolysis (Figure 8L).
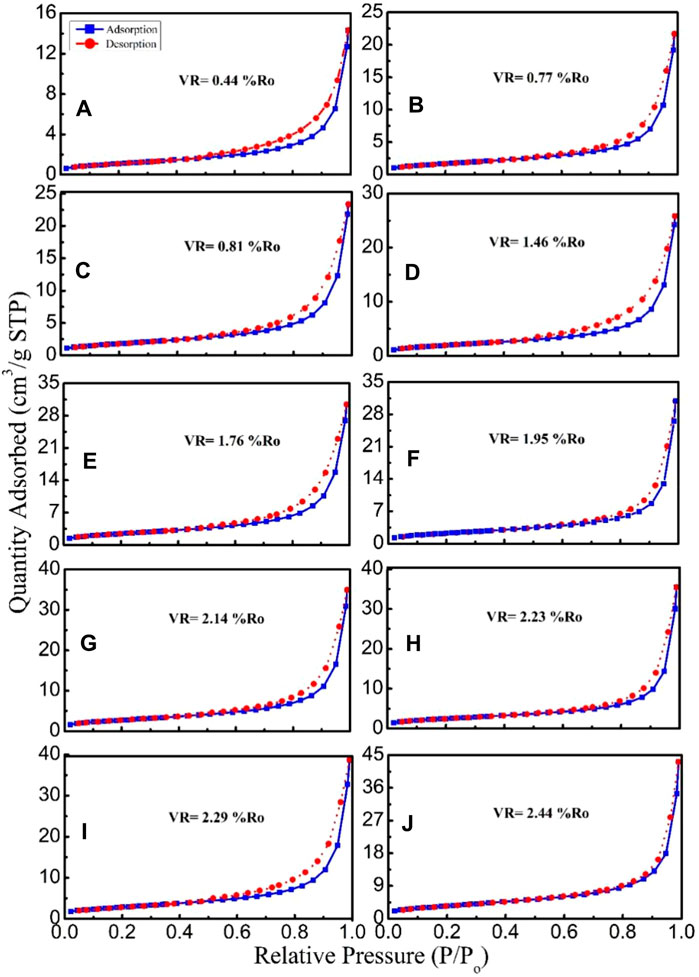
Figure 9. Nitrogen adsorption isotherms for the unheated sample (A) and pyrolyzed samples (B–J) with different VRs.
According to the changes in mineral composition observed using XRD and SEM, the main reason for the change in porosity of inorganic minerals caused by temperature and pressure appears to be the dissolution of soluble minerals, such as plagioclase, and the fragmentation of refractory minerals, such as quartz. Owing to the influence of high temperature, the strength of quartz and other relatively strong particles will be reduced, so that they become more easily broken. With a rise in temperature, cracks gradually increase, and mineral particles gradually become broken. In addition, as temperature increases, feldspar and other easily plastically deformed minerals will not only dissolve, but also be transformed (e.g., into kaolinite). Some investigators have shown that the conversion of feldspar into clay minerals could markedly reduce the volume of feldspar and increase porosity (Worden and Morad, 1999; Yang et al., 2020; Sun et al., 2021). In the process of dissolution and deformation, minerals will be affected by compaction, resulting in closer particle contact and smaller pores. However, the sample pores are filled with high-pressure fluid, which counteracts much of the overlying rock pressure and inhibits compaction, thus protecting the existing and newly generated pores.
SEM images show the micropores that directly reflect the changes in organic matter and inorganic minerals, and store free shale gas (Ji et al., 2017). However, some investigations have suggested that adsorbed gas, the main gas component of shales, is mostly stored in nano-pores (Ji et al., 2017; Memon et al., 2021; Zhu et al., 2021; Zhou et al., 2022). To analyze the nanoporous structure and surface chemistry of the origin samples and pyrolyzed residues, the BET isotherm measurements are carried out. The nitrogen isotherms at different VR are presented in Figure 9. The appearance of hysteresis loops appeared for the different capillary condensation and capillary evaporation under the same pressure (Kruk and Jaroniec, 2001; Sun et al., 2015; Qiu et al., 2021). Generally, the greater the separation between the desorption and adsorption isotherms the larger the pore content, under the same pressure (Fan et al., 2002; Wang et al., 2022). However, the degree of separation between the desorption and adsorption isotherms showed no obvious change in our pyrolyzed residues with increasing VR (Figure 9). As the VR increased, the quantity of adsorbed nitrogen gradually increased, compared with the unheated sample; the quantities adsorbed were 14.32, 21.70, 23.39, 25.84, 30.42, 30.89, 34.94, 35.47, 38.73, and 43.14 cm3/g for the unheated sample and the pyrolyzed samples with VRs of 0.77%Ro, 0.81%Ro, 1.16%Ro, 1.76%Ro, 1.95%Ro, 2.14%Ro, 2.23%Ro, 2.29%Ro, and 2.44%Ro, respectively (Figure 8). There was a good relationship between the nitrogen quantity adsorbed and the VR, with a correlation coefficient (R2) of 0.93 (Figure 10). The cumulative BET surface areas also had a good correlation with VR, with an R2 of 0.86 (Figure 10). This may suggest that the maturation of organic matter plays a positive role in the development of pores in shales. High pore content is helpful to enhance the self-storage capacity of shale gas. This is a possible reason why highly gas-productive shale is generally also highly mature shale.
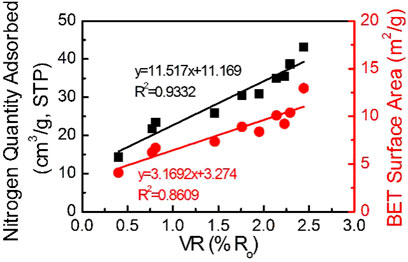
Figure 10. Relationships between VR and nitrogen quantity adsorbed (black), and between VR and BET surface area (red).
The pore size distributions of unheated and pyrolyzed samples are presented in Figure 11. In these samples, the pore sizes were distributed across two main size intervals of 4–30 nm and 30–100 nm, which can be generalized as mesopores (pore diameter: 2–50 nm) and macropores (pore diameter: >50 nm), respectively (Figure 11). The surface area of the unheated sample was relatively low, and the pores were mainly mesopores with 4–30 nm diameters (Figure 11). The pore volume of mesopores gradually increased with an increase in VR from 0.77%Ro to 1.76%Ro (Figure 11). This increase in mesopores may be a response to peak hydrocarbon generation, which appears at a VR of 1.5%Ro (Wu et al., 2018a). At VRs beyond 1.76%Ro, there was no obvious further increase in the pore volume of mesopores; instead, there were merely small fluctuations (Figure 11). For the macropores, pore volume gradually increased with an increase in VR from 0.77%Ro to 2.44%Ro (Figure 11). We suspect that these macropores are related to the decomposition of inorganic minerals during the pyrolysis experiments because they increased with increasing thermal maturity.
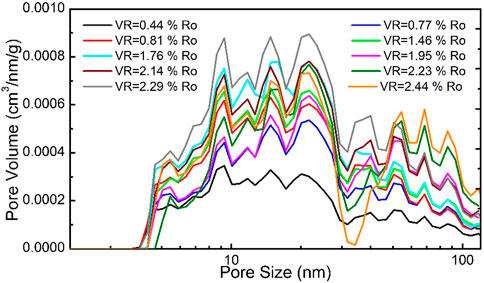
Figure 11. The distributions of the pore volume at different VR.
The changes in pore volume and surface area show that there were two evolutionary stages in the hydrous pyrolysis of the calcareous shale: 1) a rapid increase stage coinciding with the hydrocarbon generation peak; and 2) a relatively stable stage after the hydrocarbon generation peak. The results show that pore structure evolution in the calcareous shale resulted from two different pore type behaviors: the pore volume and surface area of pores over 30 nm increased gradually, while the volume of pores under 30 nm firstly increased and then continuously decreased after the hydrocarbon generation peak.
Nuclear magnetic resonance is an effective method to characterize the pore size distribution (PSD) of source rocks in a non-destructive manner (Xin et al., 2019; Zheng et al., 2019; Nie et al., 2021; Ma et al., 2022). The transverse relaxation time (T2) and pore size (r) are related by r = C*T2, in which C is a constant (μm/ms). Therefore, the T2 measured by NMR can directly reflect the pore size distribution of rock samples, and a higher T2 value corresponds to a larger pore radius (Xu et al., 2018; Meng et al., 2021). In addition, the connectivity among pores can also be obtained using NMR.
Figure 12 presents the NMR analysis results from the calcareous shale, before and after pyrolysis. Overall, NMR peaks occurred at approximately 1, 10–100, and 100–1,000 ms, which indicated that mesopores and micropores in both the calcareous shale and the pyrolyzed samples were more developed (Figure 12). This result is consistent with previous investigations, such as Zheng et al. (2019) and Xin et al. (2019). The T2 distribution of the original calcareous shale showed a trimodal distribution, with the left-hand peak being the highest, indicating a high micropore content and low content of medium‒large pores before the pyrolysis experiment (Figure 12). After pyrolysis, the peak height of the micropores increased, while that of the macropores decreased, and all three peaks gradually shifted to the left, representing an increase in micropores and a decrease in macropores (Xin et al., 2019). These changes may be due to the disappearance of primary pores and the further development of secondary pores and fractures. In subsequent experiments, with an increase in VR, the shape of the T2 spectrum did not change, but the peak height of the main peak kept rising, which confirmed the development of secondary pores and fractures.
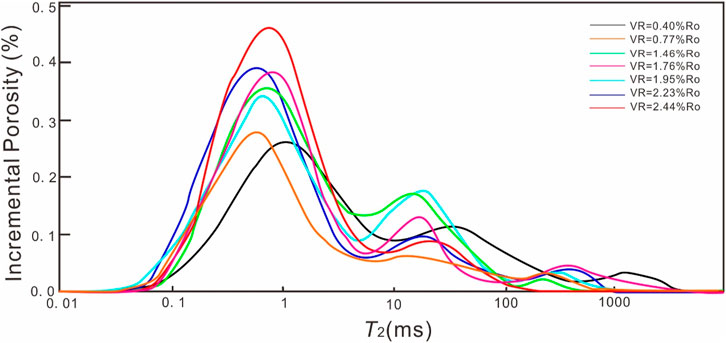
Figure 12. NMR T2 distributions of calcareous shale and pyrolyzed samples.
In addition, the contribution percentages of pore sizes of different scales as VR increased were analyzed and are presented in Figure 14. The peaks at 10–100 ms almost vanished, which suggested that transition pores sharply reduced when VR increased from 0.40%Ro to 0.77%Ro (Figures 13, 14). The highest yields of bitumen (22.6 mg/g TOC; Wu et al., 2018) occur in this %Ro range, which may indicate that the formation of a large quantity of bitumen blocked some micropores, and most of the transition pores and mesopores, ultimately resulting in low pore connectivity as VR increased from 0.40%Ro to 0.77%Ro. The peaks at 10–100 ms reached a maximum at a VR level of 1.46%Ro (Figures 13, 14), indicating that a large quantity of transition pores was generated at this stage. Low bitumen yields (10.0 mg/g TOC) and high oil yields (96.8 mg/g TOC) suggest that bitumen was further pyrolyzed into liquid hydrocarbons with lower molecular weight and viscosity with this increase in maturity (Wu et al., 2018); here, transition pores and mesopores were flushed by hydrocarbon expulsion, which markedly improved pore connectivity. This process continued until the oil yield peak at a VR of 1.95%Ro (Figures 13, 14). As maturity increased, the oil began to crack, which resulted in an increase in micropores. Higher maturity and deeper burial may result in the collapse of transition pores and mesopores, and reduced pore connectivity (Dong and Harris, 2020; Zhang et al., 2020; Liu et al., 2021). ; pore collapse may also be triggered by tectonic deformation (Liu et al., 2020). This process may provide a better shale oil and gas preservation condition.
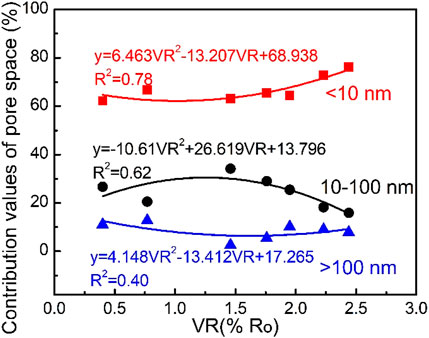
Figure 13. Contribution percentages of pore sizes of different scales in relation to increasing VR.
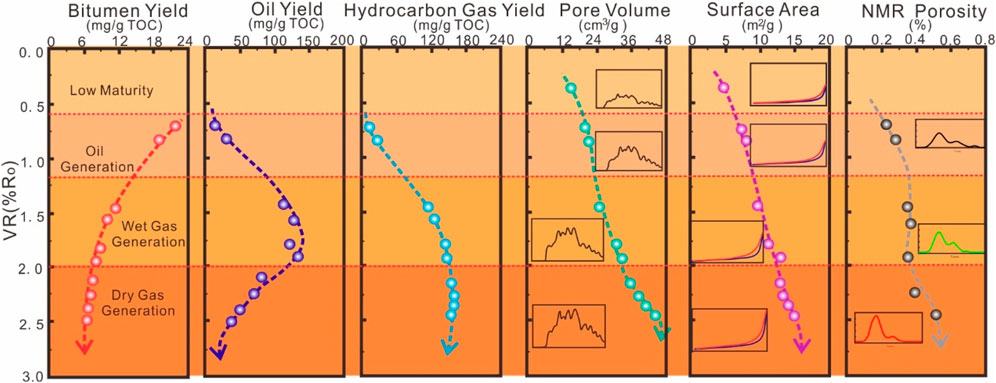
Figure 14. Maturity, hydrocarbon generation, and pore evolution of calcareous shale during pyrolysis experiments. The evolution of hydrocarbon generation is based on Wu et al. (2018).
The variation in pore size distribution of rock samples shows that the primary pores of rocks will gradually decrease with an increase in burial depth. On the other hand, owing to hydrocarbon generation and oil cracking, organic matter is pyrolyzed, minerals are corroded by organic acids generated during hydrocarbon generation, and secondary pores are constantly generated. The results of pore evolution characterized by NMR were essentially consistent with the geological conditions.
Thermal maturity has a marked impact on hydrocarbon generation (Tissot and Welt, 1984; Hunt, 1996; Li et al., 2022; Shao et al., 2022) and pore development (Sun et al., 2015; Sun et al., 2018; Song et al., 2019; Gao et al., 2021; Xu et al., 2021). Pore connectivity, pore size distribution, and pore volume are important for the methane adsorption performance of shale (Karacan et al., 2007; Zou et al., 2015; Xu et al., 2018; Kong et al., 2021). Previous investigations have reported that the formation and development of pore structure is closely related to hydrocarbon generation (Sun et al., 2015; Gao et al., 2021; Xu et al., 2021). Hence, the evolution of hydrocarbon generation and pore structure corresponding to different VR levels were analyzed; this is illustrated in Figure 14.
With an increase in burial depth and thermal maturity, the evolution of hydrocarbon generation from organic matter mainly follows a pathway from bitumen generation to liquid hydrocarbon generation, and then to gaseous hydrocarbon generation, according to the classical theory of hydrocarbon generation from organic matter (Tissot and Welt, 1984; Hunt, 1996; Lewan, 1997; Hill et al., 2003; Uguna et al., 2016). The yields of bitumen, oil, and hydrocarbon gas indicated that the calcareous shale experienced the above stages at VRs from 0.40%Ro to 2.44%Ro, under hydrous pyrolysis, and the yields of oil and gaseous hydrocarbons showed a good quadratic function relationship with VR values (Figure 14; Wu et al., 2018). The peak oil yield occurred at a VR of 1.46%Ro to 1.95%Ro. Gaseous hydrocarbon generation increased markedly between 0.5%Ro and 2.0%Ro, and then stabilized (Figure 14; Wu et al., 2018).
Because of the pyrolysis reactions that occurred during the generation of hydrocarbons, the products had different chemical compositions and physical properties. The bitumen mainly consisted of macromolecular hydrocarbons and heteroatomic functional groups, and thus had high viscosity; oil had better fluidity due to it containing a high proportion of saturated hydrocarbons; gaseous hydrocarbons had the best diffusion ability and provided the largest contribution to pressure increase during pyrolysis for the gas phase. The transformations of kerogen to bitumen, bitumen to oil, and oil to gaseous hydrocarbons with increasing maturity determined the compositions and properties of the hydrocarbons, and markedly affected the evolution of pore structure. The good linear relationships between the nitrogen quantity adsorbed, BET surface area, and the VR indicated that the surface area and pore volume of shale increased with the prolongation of hydrocarbon generation (Figure 10). However, the distributions of the pore volume in BET and NMR at different VRs further suggested that mesopores, transition pores, and micropores in calcareous shale had different evolutionary trends during prolonged hydrocarbon generation (Figures 13, 14).
The highest yields of bitumen corresponded to the lowest mesopore and transition pore volumes, suggesting that some micropores and most of the transition pores and mesopores were plugged by the high-viscosity bitumen, ultimately resulting in poor pore connectivity. Then, mesopores, transition pores, and micropores increased gradually with a decrease in average pore size. This may indicate that the bitumen pyrolyzed into oil that had better fluidity, flushing the mesopores and transition pores; further pyrolysis of organic matter generated more pores and resulted in better pore connectivity. The pores observed on the surface of feldspar and organic matter in SEM images further confirmed the development of pores through organic matter pyrolysis and through the dissolution of feldspar induced by organic acids that formed during the pyrolysis of organic matter (Figures 8I, K). Oil cracking to gaseous hydrocarbons resulted in an increase in micropores, and poor pore connectivity due to the collapse of transition pores and mesopores under prolonged hydrocarbon generation.
Organic matter and mineral properties are the main factors determining the pore characteristics of shale because the development of secondary porosity corresponds to hydrocarbon generation and the transformation/dissolution of minerals (Ji et al., 2017; Wu H. et al., 2021). Generally, the pore structures of shales have been determined by the total organic carbon content (TOC), type of organic matter, mineral composition, and thermal maturity (Ji et al., 2017; Wang et al., 2021; Xu et al., 2021; Guan et al., 2022). Among them, thermal maturity has been most widely used (Liang et al., 2014; Sun et al., 2015; Gao et al., 2021; Xu et al., 2021), because pores induced by the generation of hydrocarbons are the main contributors to secondary porosity in shale. Hence, highly productive shale gas has been strongly associated with high-maturity shales (Chatellier et al., 2011; Hao and Zou, 2013; Kotarba and Lewan, 2013; Ji et al., 2017; Wu et al., 2019; Chen et al., 2020; Song et al., 2021; Zheng et al., 2021; Cao et al., 2022). Rapid and effective characterization of maturity is important for shale gas exploration. Vitrinite reflectance is commonly used to characterize the maturity of organic matter. However, owing to differences in origin, some types of organic matter are amorphous and lack vitrinite, for example, the shales of the Wufeng-Longmaxi Formation (Chen et al., 2019). Such types of organic matter may not be suitable for VR analysis. Whole-rock FTIR, Raman, XRD, XPS, SEM, BET, SEM, and NMR results can provide thermal and pore evolution information, which is useful for understanding the association of pore development with hydrocarbon generation in shale. The evolution of pore structure can be divided into three stages: i) primary pores are filled by high-viscosity bitumen, resulting in poor pore connectivity; ii) development of secondary porosity corresponding to oil generation, with mineral dissolution induced by organic acids also providing some contribution to the generation of secondary pores; iii) further development of secondary porosity at the micropore scale, accompanied by the collapse of transition pores and mesopores, resulting in poor pore connectivity and an improved shale oil and gas preservation condition.
To interpret the evolution of thermal maturity and pore structure of continental organic-rich shales and understand the interaction between organic matter and minerals during thermal evolution, calcareous shale (before and after pyrolysis) was analyzed using Raman, FTIR, XRD, XPS, SEM, BET, and NMR. The DA, SR, SP, DT, and ER of VR, Raman G‒D band separation, Raman ID/IG, Tmax, FTIR, and XPS were also estimated to develop and evaluate a comprehensive new set of maturity indicators. The results indicated that the Raman G‒D band separation and ID/IG ratio, with good DA, low SR, low SP, and short DT, correlated well with VR and Tmax in the pyrolyzed samples. This may indicate that Raman analysis provides good thermal maturity indicators. Vitrinite reflectance and Tmax may be less widely applicable given their moderate SR, complex SP, and long DT. The FTIR and XPS techniques also provided semi-quantitative maturity indicators but had poor DA and high ER. Moreover, SEM allowed direct observation of pore formation accompanying the pyrolysis of organic matter, together with changes in minerals, such as the transformation of Na0.95Ca0.16Al1.16Si2.84O8 to Na0.84Ca0.02Al1.02Si2.98O8, which was confirmed by XRD. The results of BET and NMR further suggested that three stages may exist in the evolution of pore structure, in which secondary porosity developed after primary pores were filled by bitumen generation, then this secondary porosity further developed during oil-cracking. The poor pore connectivity observed at both low and high VR values may be more conducive to the preservation of shale oil and gas. This work is significant for research into the interactions between organic matter and minerals during the thermal evolution of continental shales.
The original contributions presented in the study are included in the article/supplementary material, further inquiries can be directed to the corresponding author.
YL: Conceptualization, Writing–review and editing, Project administration. YW: Methodology, Writing–original draft. RZ: Data curation, Investigation, Writing–review and editing. SJ: Methodology, Supervision, Writing–review and editing. XD: Validation, Writing–review and editing.
The author(s) declare that financial support was received for the research, authorship, and/or publication of this article. This research was supported by Shenzhen Science and Technology Program (Grant Number: KCXST20221021111607018) and Science and Technology Innovation for Youth of Longdong University (Grant Number: XYZK2302).
The authors declare that the research was conducted in the absence of any commercial or financial relationships that could be construed as a potential conflict of interest.
All claims expressed in this article are solely those of the authors and do not necessarily represent those of their affiliated organizations, or those of the publisher, the editors and the reviewers. Any product that may be evaluated in this article, or claim that may be made by its manufacturer, is not guaranteed or endorsed by the publisher.
Al-Hajeri, M., Sauerer, B., Furmann, A., Amer, A., Al-Khamiss, A., and Abdallah, W. (2021). Organic petrography and geochemistry of the prolific source rocks from the Jurassic Najmah and Cretaceous Makhul Formations in Kuwait–Validation and expansion of Raman spectroscopic thermal maturity applications. Int. J. Coal Geol. 236, 103654. doi:10.1016/j.coal.2020.103654
Beyssac, O., Goffé, B., Chopin, C., and Rouzaud, J. N. (2002). Raman spectra of carbonaceous material in metasediments: a new geothermometer. J. Metamorph. Geol. 20 (9), 859–871. doi:10.1046/j.1525-1314.2002.00408.x
Beyssac, O., Goffé, B., Petitet, J. P., Froigneux, E., Moreau, M., and Rouzaud, J. N. (2003). On the characterization of disordered and heterogeneous carbonaceous materials by Raman spectroscopy. Spectrochimica Acta Part A Mol. Biomol. Spectrosc. 59 (10), 2267–2276. doi:10.1016/S1386-1425(03)00070-2
Birdwell, J. E., Jubb, A. M., Hackley, P. C., and Hatcherian, J. J. (2021). Compositional evolution of organic matter in Boquillas Shale across a thermal gradient at the single particle level. Int. J. Coal Geol. 248, 103859. doi:10.1016/j.coal.2021.103859
Borjigin, T., Longfei, L. U., Lingjie, Y. U., Zhang, W., Anyang, P. A. N., Baojian, S. H. E. N., et al. (2021). Formation, preservation and connectivity control of organic pores in shale. Petroleum Explor. Dev. 48 (4), 798–812. doi:10.1016/s1876-3804(21)60067-8
Buckley, A. N., and Lamb, R. N. (1996). Surface chemical analysis in coal preparation research: complementary information from XPS and ToF-SIMS. Int. J. Coal Geol. 32 (1-4), 87–106. doi:10.1016/S0166-5162(96)00032-8
Cao, T., Liu, H., Pan, A., Fu, Y., Deng, M., Cao, Q., et al. (2022). Pore evolution in siliceous shales and its influence on shale gas-bearing capacity in eastern Sichuan-western Hubei, China. J. Petroleum Sci. Eng. 208, 109597. doi:10.1016/j.petrol.2021.109597
Charisiou, N., Siakavelas, I., Papageridis, K., Stavrou, S., Latsiou, A., Sebastian, V., et al. (2018). “Investigating the correlation between deactivation and carbon deposition on Ni/Al2O3 and Ni/CaO-MgO-Al2O3 catalysts during the biogas reforming reaction,” in 11th International Conference on Advanced Nanomaterials, Aveiro, Portuga, 9 - 12 July 2024.
Chatellier, J., Ferworn, K., Larsen, N. L., Ko, S., Flek, P., Molgat, M., et al. (2011). Overpressure in shale gas – when Geochemistry and engineering data meet and agree. Houston: American Association of Petroleum Geologist Annual Meeting.
Chen, Z., Chen, L., Wang, G., Zou, C., Jiang, S., Si, Z., et al. (2020). Applying isotopic geochemical proxy for gas content prediction of Longmaxi shale in the Sichuan Basin, China. Mar. Petroleum Geol. 116, 104329. doi:10.1016/j.marpetgeo.2020.104329
Chen, Z., Song, Y., Jiang, Z., Liu, S., Li, Z., Shi, D., et al. (2019). Identification of organic matter components and organic pore characteristics of marine shale: a case study of Wufeng-Longmaxi shale in southern Sichuan Basin, China. Mar. Petroleum Geol. 109, 56–69. doi:10.1016/j.marpetgeo.2019.06.002
Cheng, Q., You, L., Kang, Y., Zhang, N., and Zhou, Y. (2021). An experimental investigation into the oxidative dissolution of typical organicrich shale from China. Mar. Petroleum Geol. 130, 105117. doi:10.1016/j.marpetgeo.2021.105117
Cincinelli, A., Scopetani, C., Chelazzi, D., Martellini, T., Pogojeva, M., and Slobodnik, J. (2021). Microplastics in the black sea sediments. Sci. Total Environ. 760, 143898. doi:10.1016/j.scitotenv.2020.143898
Coates, J. (2000). “Interpretation of infrared spectra, a practical approach,” in Encyclopedia of analytical chemistry. Editor R. A. Meyers (Chichester, UK: John Wiley &Sons Ltd), 10815–10837.
Craddock, P. R., and Sauerer, B. (2022). Robust determination of kerogen properties in organic-rich mudrocks via Raman spectroscopy. Org. Geochem. 169, 104381. doi:10.1016/j.orggeochem.2022.104381
Curtis, J. B. (2002). Fractured shale-gas systems. AAPG Bull. 86 (11), 1921–1938. doi:10.1306/61eeddbe-173e-11d7-8645000102c1865d
Delarue, F., Tu, T. T. N., Duhamel, R., Paris, C., and Baudin, F. (2021). Chemical degradation of thermally altered silicified organic matter during acid maceration: a case study from the Lower Devonian Rhynie chert. Org. Geochem. 156, 104246. doi:10.1016/j.orggeochem.2021.104246
Ding, H., Ma, Y., Li, S., Wang, Q., Hong, W., Jiang, H., et al. (2021). Pyrolysis characteristics of oil shale semi-coke and its extracted bitumen. J. Anal. Appl. Pyrolysis 156, 105120. doi:10.1016/j.jaap.2021.105120
Dong, T., and Harris, N. B. (2020). The effect of thermal maturity on porosity development in the Upper Devonian–Lower Mississippian Woodford Shale, Permian Basin, US: insights into the role of silica nanospheres and microcrystalline quartz on porosity preservation. Int. J. Coal Geol. 217, 103346. doi:10.1016/j.coal.2019.103346
Evenick, J. C. (2021). Examining the relationship between Tmax and vitrinite reflectance: an empirical comparison between thermal maturity indicators. J. Nat. Gas Sci. Eng. 91, 103946. doi:10.1016/j.jngse.2021.103946
Fan, P., Luo, B., and Huang, R. (1980). Formation and migration of continental oil and gas in China. Sci. China 23, 1286–1295.
Fan, Y. G., Li, Y. H., and Ma, J. B. (2002). Mesoporous properties of porous Crossl inked polystyrene absorbents. Chem. Res. Chin. U 23, 1622–1626. doi:10.1007/s11670-002-0022-7
Fu, J., Sheng, G., and Dehan, L. (1988). “Organic geochemical characteristics of major types of terrestrial petroleum source rocks in China,” in Lacustrine petroleum source rocks. Editors A. J. Fleet, K. Kelts, and M. R. Talbot (Blackwell, Oxford: Geological Society Special Publication), 279–289.
Gao, Z., Xuan, Q., Hu, Q., Jiang, Z., and Liu, X. (2021). Pore structure evolution characteristics of continental shale in China as indicated from thermal simulation experiments. AAPG Bull. 105 (11), 2159–2180. doi:10.1306/06102119229
Ghaffar, A., Zhang, L., Zhu, X., and Chen, B. (2018). Porous PVdF/GO nanofibrous membranes for selective separation and recycling of charged organic dyes from water. Environ. Sci. Technol. 52 (7), 4265–4274. doi:10.1021/acs.est.7b06081
Gong, B., Pigram, P. J., and Lamb, R. N. (1998). Surface studies of low-temperature oxidation of bituminous coal vitrain bands using XPS and SIMS. Fuel 77 (9-10), 1081–1087. doi:10.1016/S0016-2361(98)00002-7
Grice, K., Schouten, S., Peters, K. E., and Damste, J. S. (1998). Molecular isotopic characterisation of hydrocarbon biomarkers in Palaeocene–Eocene evaporitic, lacustrine source rocks from the Jianghan Basin, China. Org. Geochem. 29, 1745–1764. doi:10.1016/s0146-6380(98)00075-8
Guan, M., Liu, X., Jin, Z., Lai, J., Sun, B., Zhang, P., et al. (2022). The evolution of pore structure heterogeneity during thermal maturation in lacustrine shale pyrolysis. J. Anal. Appl. Pyrolysis 163, 105501. doi:10.1016/j.jaap.2022.105501
Hackley, P. C., Jubb, A. M., McAleer, R. J., Valentine, B. J., and Birdwell, J. E. (2021). A review of spatially resolved techniques and applications of organic petrography in shale petroleum systems. Int. J. Coal Geol. 241, 103745. doi:10.1016/j.coal.2021.103745
Hao, F., and Zou, H. (2013). Cause of shale gas geochemical anomalies and mechanisms for gas enrichment and depletion in high-maturity shales. Mar. Petroleum Geol. 44, 1–12. doi:10.1016/j.marpetgeo.2013.03.005
Hao, F., Zou, H., and Lu, Y. (2013). Mechanisms of shale gas storage: implications for shale gas exploration in China. AAPG Bull. 97 (8), 1325–1346. doi:10.1306/02141312091
Hill, R. J., Tang, Y., and Kaplan, I. R. (2003). Insights into oil cracking based on laboratory experiments. Org. Geochem. 34, 1651–1672. doi:10.1016/S0146-6380(03)00173-6
Hou, Y., Zhang, K., Wang, F., He, S., Dong, T., Wang, C., et al. (2019). Structural evolution of organic matter and implications for graphitization in over-mature marine shales, south China. Mar. Petroleum Geol. 109, 304–316. doi:10.1016/j.marpetgeo.2019.06.009
Ji, L., Su, L., Wu, Y., and He, C. (2017). Pore evolution in hydrocarbon-generation simulation of organic matter-rich muddy shale. Petroleum Res. 2 (2), 146–155. doi:10.1016/j.ptlrs.2017.07.002
Jing, Z., Rodrigues, S., Strounina, E., Li, M., Wood, B., Underschultz, J. R., et al. (2019). Use of FTIR, XPS, NMR to characterize oxidative effects of NaClO on coal molecular structures. Int. J. Coal Geol. 201, 1–13. doi:10.1016/j.coal.2018.11.017
Karacan, C. Ö., Esterhuizen, G. S., Schatzel, S. J., and Diamond, W. P. (2007). Reservoir simulation-based modeling for characterizing longwall methane emissions and gob gas venthole production. Int. J. Coal Geol. 71 (2-3), 225–245. doi:10.1016/j.coal.2006.08.003
Katz, B. J., and Lin, F. (2021). Consideration of the limitations of thermal maturity with respect to vitrinite reflectance, Tmax, and other proxies. AAPG Bull. 105 (4), 695–720. doi:10.1306/09242019261
Kelemen, S. R., and Fang, H. L. (2001). Maturity trends in Raman spectra from kerogen and coal. Energy & fuels 15 (3), 653–658. doi:10.1021/ef0002039
Khatibi, S., Ostadhassan, M., Tuschel, D., Gentzis, T., Bubach, B., and Carvajal-Ortiz, H. (2018). Raman spectroscopy to study thermal maturity and elastic modulus of kerogen. Int. J. Coal Geol. 185, 103–118. doi:10.1016/j.coal.2017.11.008
Khatibi, S., Ostadhassan, M., Hackley, P., Tuschel, D., Abarghani, A., and Bubach, H. (2019). Understanding organic matter heterogeneity and maturation rate by Raman spectroscopy. Int. J. Coal Geol. 206, 46–64. doi:10.1016/j.coal.2019.03.009
Kong, X., Lu, S., Xiao, D., Fan, H., Mu, P., and Jiang, S. (2021). Analysis of adsorption characteristics and influencing factors of wufeng–longmaxi formation shale in Sichuan Basin. Energy & Fuels 35 (6), 4925–4942. doi:10.1021/acs.energyfuels.1c00273
Kotarba, M. J., and Lewan, M. D. (2013). Sources of natural gases in Middle Cambrian reservoirs in Polish and Lithuanian Baltic Basin as determined by stable isotopes and hydrous pyrolysis of Lower Palaeozoic source rocks. Chem. Geol. 345, 62–76. doi:10.1016/j.chemgeo.2013.02.023
Kruk, M., and Jaroniec, M. (2001). Gas adsorption characterization of ordered organic− inorganic nanocomposite materials. Chem. Mater. 13 (10), 3169–3183. doi:10.1021/cm0101069
Lewan, M. D. (1997). Experiments on the role of water in petroleum formation. Geochim. Cosmochim. Acta 61, 3691–3723. doi:10.1016/s0016-7037(97)00176-2
Lewan, M. D., Henry, M. E., Higley, D. K., and Pitman, J. K. (2002). Material-balance assessment of the New Albany — chesterian petroleum system of the Illinois basin: AAPG. Bull 86, 745–777.
Lewan, M. D., and Kotarba, M. J. (2014). Thermal-maturity limit for primary thermogenic-gas generation from humic coals as determined by hydrous pyrolysis. AAPG Bull. 98, 2581–2610. doi:10.1306/06021413204
Li, J., Tang, X., Yi, H., Yu, Q., Gao, F., Zhang, R., et al. (2017). Effects of copper-precursors on the catalytic activity of Cu/graphene catalysts for the selective catalytic oxidation of ammonia. Appl. Surf. Sci. 412, 37–44. doi:10.1016/j.apsusc.2017.03.227
Li, S., Guo, X., and Zheng, L. (2022). Semi-closed artificial thermal maturation of type I source rock with the presence of natural formation water: hydrocarbon generation and individual n-alkane stable carbon isotope partitioning pattern. Mar. Petroleum Geol. 138, 105535. doi:10.1016/j.marpetgeo.2022.105535
Li, Z., Fredericks, P. M., Rintoul, L., and Ward, C. R. (2007). Application of attenuated total reflectance micro-Fourier transform infrared (ATR-FTIR) spectroscopy to the study of coal macerals: examples from the Bowen Basin, Australia. Int. J. Coal Geol. 70 (1-3), 87–94. doi:10.1016/j.coal.2006.01.006
Liang, C., Jiang, Z., Zhang, C., Guo, L., Yang, Y., and Li, J. (2014). The shale characteristics and shale gas exploration prospects of the Lower Silurian Longmaxi shale, Sichuan Basin, South China. J. Nat. Gas Sci. Eng. 21, 636–648. doi:10.1016/j.jngse.2014.09.034
Liao, L. F., Lien, C. F., Shieh, D. L., Chen, M. T., and Lin, J. L. (2002). FTIR study of adsorption and photoassisted oxygen isotopic exchange of carbon monoxide, carbon dioxide, carbonate, and formate on TiO2. J. Phys. Chem. B 106 (43), 11240–11245. doi:10.1021/jp0211988
Liu, R., Zheng, J., Hao, F., Nie, Z., Heng, D., Tan, X., et al. (2020). Variation in pore systems with tectonic stress in the overthrust Wufeng-Longmaxi shale of the southern Sichuan Basin, China. J. Nat. Gas Sci. Eng. 83, 103617. doi:10.1016/j.jngse.2020.103617
Liu, X., Kong, X., Nie, B., Song, D., He, X., and Wang, L. (2021). Pore fractal dimensions of bituminous coal reservoirs in north China and their impact on gas adsorption capacity. Nat. Resour. Res. 30 (6), 4585–4596. doi:10.1007/s11053-021-09958-7
Liu, Y., Liu, S., Zhang, R., and Zhang, Y. (2021a). The molecular model of Marcellus shale kerogen: experimental characterization and structure reconstruction. Int. J. Coal Geol. 246, 103833. doi:10.1016/j.coal.2021.103833
Löhr, S. C., Baruch, E. T., Hall, P. A., and Kennedy, M. J. (2015). Is organic pore development in gas shales influenced by the primary porosity and structure of thermally immature organic matter? Org. Geochem. 87, 119–132. doi:10.1016/J.ORGGEOCHEM.2015.07.010
Lünsdorf, N. K. (2016). Raman spectroscopy of dispersed vitrinite—methodical aspects and correlation with reflectance. Int. J. Coal Geol. 153, 75–86. doi:10.1016/j.coal.2015.11.010
Ma, C., Zhao, X., Yang, T., Jiang, W., Guo, B., Han, G., et al. (2022). Mineralogy, organic geochemistry, and microstructural characterization of lacustrine Shahejie Formation, Qikou Sag, Bohai Bay Basin: contribution to understanding microcosmic storage mechanism of shale oil. J. Petroleum Sci. Eng. 209, 109843. doi:10.1016/j.petrol.2021.109843
Malumbazo, N., Wagner, N. J., Bunt, J. R., Van Niekerk, D., and Assumption, H. (2011). Structural analysis of chars generated from South African inertinite coals in a pipe-reactor combustion unit. Fuel Process. Technol. 92 (4), 743–749. doi:10.1016/j.fuproc.2010.09.009
Marshall, C. P., Edwards, H. G., and Jehlicka, J. (2010). Understanding the application of Raman spectroscopy to the detection of traces of life. Astrobiology 10 (2), 229–243. doi:10.1089/ast.2009.0344
Mastalerz, M., Drobniak, A., and Hower, J. C. (2021). Changes in chemistry of vitrinite in coal through time: insights from organic functional group characteristics. Int. J. Coal Geol. 235, 103690. doi:10.1016/j.coal.2021.103690
Memon, A., Li, A., Memon, B. S., Muther, T., Han, W., Kashif, M., et al. (2021). Gas adsorption and controlling factors of shale: review, application, comparison and challenges. Nat. Resour. Res. 30 (1), 827–848. doi:10.1007/s11053-020-09738-9
Meng, Z., Sun, W., Liu, Y., Luo, B., and Zhao, M. (2021). Effect of pore networks on the properties of movable fluids in tight sandstones from the perspective of multi-techniques. J. Petroleum Sci. Eng. 201, 108449. doi:10.1016/j.petrol.2021.108449
Muirhead, D. K., Kedar, L., Schito, A., Corrado, S., Bond, C. E., and Romano, C. (2021). Raman spectral shifts in naturally faulted rocks. Geochem. Geophys. Geosyst. 22 (10), e2021GC009923. doi:10.1029/2021GC009923
Nie, R. S., Zhou, J., Chen, Z., Liu, J., and Pan, Y. (2021). Pore structure characterization of tight sandstones via a novel integrated method: a case study of the Sulige gas field, Ordos Basin (Northern China). J. Asian Earth Sci. 213, 104739. doi:10.1016/j.jseaes.2021.104739
Okolo, G. N., Neomagus, H. W., Everson, R. C., Roberts, M. J., Bunt, J. R., Sakurovs, R., et al. (2015). Chemical–structural properties of South African bituminous coals: insights from wide angle XRD–carbon fraction analysis, ATR–FTIR, solid state 13C NMR, and HRTEM techniques. Fuel 158, 779–792. doi:10.1016/j.fuel.2015.06.027
Phan, V. T., Quirico, E., Beck, P., Le Brech, Y., Jovanovic, L., Le Guillou, C., et al. (2021). Infrared spectroscopy quantification of functional carbon groups in kerogens and coals: a calibration procedure. Spectrochimica Acta Part A Mol. Biomol. Spectrosc. 259, 119853. doi:10.1016/j.saa.2021.119853
Ping, L. (1990). Lacustrine environmental and climatic evolution recorded by isotope of inorcanic carbon and oxygen. Acta Sedimentol. Sin.
Qiu, X., Yang, H., Dejam, M., Tan, S. P., and Adidharma, H. (2021). Experiments on the capillary condensation/evaporation hysteresis of pure fluids and binary mixtures in cylindrical nanopores. J. Phys. Chem. C 125 (10), 5802–5815. doi:10.1021/acs.jpcc.0c10840
Razavian, M., and Fatemi, S. (2021). Catalytic evaluation of metal azolate framework-6 in pristine and metal doped modes in upgrading heavy residual fuel oil. J. Anal. Appl. Pyrolysis 156, 105093. doi:10.1016/j.jaap.2021.105093
Sauerer, B., Craddock, P. R., AlJohani, M. D., Alsamadony, K. L., and Abdallah, W. (2017). Fast and accurate shale maturity determination by Raman spectroscopy measurement with minimal sample preparation. Int. J. Coal Geol. 173, 150–157. doi:10.1016/j.coal.2017.02.008
Schito, A., Guedes, A., Valentim, B., Vergara Sassarini, A., and Corrado, S. (2021). A predictive model for maceral discrimination by means of Raman spectra on dispersed organic matter: a case study from the carpathian fold-and-thrust belt (Ukraine). Geosciences 11 (5), 213. doi:10.3390/geosciences11050213
Schito, A., Romano, C., Corrado, S., Grigo, D., and Poe, B. (2017). Diagenetic thermal evolution of organic matter by Raman spectroscopy. Org. Geochem. 106, 57–67. doi:10.1016/j.orggeochem.2016.12.006
Shang, F., Tang, X., Hu, Q., Wang, Y., Meng, X., and Zhu, Y. (2021). Chemical structure transformations in kerogen from longmaxi shales in response to tectonic stress as investigated by HRTEM, FTIR, and 13C NMR. Energy & Fuels 35 (23), 19496–19506. doi:10.1021/acs.energyfuels.1c03409
Shao, D., Zhang, T., Zhang, L., Li, Y., and Meng, K. (2022). Effects of pressure on gas generation and pore evolution in thermally matured calcareous mudrock: insights from gold-tube pyrolysis of the Eagle Ford Shale using miniature core plugs. Int. J. Coal Geol. 252, 103936. doi:10.1016/j.coal.2022.103936
Shi, S., Wang, Y., Guo, H., Chen, C., and Deng, R. (2021). Variations in pore structure of marine shale from the same horizon of the Longmaxi Formation with changing position in a small-scale anticline: implications for the influence of structural deformation. Mar. Petroleum Geol. 124, 104837. doi:10.1016/j.marpetgeo.2020.104837
Song, D., Tuo, J., Zhang, M., Wu, C., Su, L., Li, J., et al. (2019). Hydrocarbon generation potential and evolution of pore characteristics of Mesoproterozoic shales in north China: results from semi-closed pyrolysis experiments. J. Nat. Gas Sci. Eng. 62, 171–183. doi:10.1016/j.jngse.2018.12.011
Song, D., Wu, C., Tuo, J., Wang, X., Zhang, M., He, W., et al. (2021). Evolution of carbon isotopic compositions for gas generated in semi-closed pyrolysis system: reflections on the formation of isotopic abnormal gases. J. Petroleum Sci. Eng. 201, 108516. doi:10.1016/j.petrol.2021.108516
Sun, H., Feng, D., Sun, S., Zhao, Y., Zhang, L., Chang, G., et al. (2021). Thermal evolution of gas-liquid-solid products and migration regulation of C/H/O elements during biomass pyrolysis. J. Anal. Appl. Pyrolysis 156, 105128. doi:10.1016/j.jaap.2021.105128
Sun, L., Tuo, J., Zhang, M., Wu, C., Wang, Z., and Zheng, Y. (2015). Formation and development of the pore structure in Chang 7 member oil-shale from Ordos Basin during organic matter evolution induced by hydrous pyrolysis. Fuel 158, 549–557. doi:10.1016/j.fuel.2015.05.061
Sun, Y., He, L., Kang, S., Guo, W., Li, Q., and Deng, S. (2018). Pore evolution of oil shale during sub-critical water extraction. Energies 11 (4), 842. doi:10.3390/en11040842
Sun, Y., Wei, L., Dai, C., Yu, Z., and Xin, Y. (2021). The carbonic acid-rock reaction in feldspar/dolomite-rich tightsand and its impact on CO2-water relative permeability during geological carbon storage. Chem. Geol. 584, 120527. doi:10.1016/j.chemgeo.2021.120527
Tissot, B. P., and Welte, D. H. (1984). Petroleum formation and occurrence. Springer-Verlag: Berlin Heidelberg
Uguna, C. N., Carr, A. D., Snape, C. E., Meredith, W., Scotchman, I. C., Murray, A., et al. (2016). Impact of high water pressure on oil generation and maturation in Kimmeridge clay and Monterey source rocks: implications for petroleum retention and gas generation in shale gas systems. Mar. Pet. Geol. 7, 72–85. doi:10.1016/j.marpetgeo.2016.02.028
Van Niekerk, D., Pugmire, R. J., Solum, M. S., Painter, P. C., and Mathews, J. P. (2008). Structural characterization of vitrinite-rich and inertinite-rich Permian-aged South African bituminous coals. Int. J. Coal Geol. 76 (4), 290–300. doi:10.1016/j.coal.2008.08.014
Waliczek, M., Machowski, G., Poprawa, P., Świerczewska, A., and Więcław, D. (2021). A novel VRo, Tmax, and S indices conversion formulae on data from the fold-and-thrust belt of the Western Outer Carpathians (Poland). Int. J. Coal Geol. 234, 103672. doi:10.1016/j.coal.2020.103672
Wang, H., Leaukosol, N., He, Z., Fei, G., Si, C., and Ni, Y. (2013). Microstructure, distribution and properties of conductive polypyrrole/cellulose fiber composites. Cellulose 20 (4), 1587–1601. doi:10.1007/s10570-013-9945-z
Wang, K., Ma, L., and Taylor, K. G. (2022a). Nanoscale geochemical heterogeneity of organic matter in thermally-mature shales: an AFM-IR study. Fuel 310, 122278. doi:10.1016/j.fuel.2021.122278
Wang, Y., Liu, L., and Cheng, H. (2021). Gas adsorption characterization of pore structure of organic-rich shale: insights into contribution of organic matter to shale pore network. Nat. Resour. Res. 30 (3), 2377–2395. doi:10.1007/s11053-021-09817-5
Wang, Z., Cheng, Y., Wang, G., Ni, G., and Wang, L. (2022b). Comparative analysis of pore structure parameters of coal by using low pressure argon and nitrogen adsorption. Fuel 309, 122120. doi:10.1016/j.fuel.2021.122120
Worden, R. H., and Morad, S. (1999). Clay minerals in sandstones: controls on formation, distribution and evolution. Clay mineral Cem. Sandst., 1–41. doi:10.1002/9781444304336.ch1
Wu, H., Zhao, J., Wu, W., Li, J., Huang, Y., and Chen, M. (2021b). Formation and diagenetic characteristics of tight sandstones in closed to semi-closed systems: typical example from the Permian Sulige gas field. J. Petroleum Sci. Eng. 199, 108248. doi:10.1016/j.petrol.2020.108248
Wu, L., Lu, Y., Jiang, S., Lu, Y., Liu, X., and Hu, H. (2018). Pore structure characterization of different lithofacies in marine shale: a case study of the Upper Ordovician Wufeng-Lower Silurian Longmaxi formation in the Sichuan Basin, SW China. J. Nat. Gas Sci. Eng. 57, 203–215. doi:10.1016/j.jngse.2018.07.009
Wu, Y., Li, Y., Zhang, Z., and Sun, L. (2021a). Effect of water pressure and expulsion on hydrocarbon generation of kerogen under semi-closed conditions. Arabian J. Geosciences 14 (14), 1333–1415. doi:10.1007/s12517-021-07724-w
Wu, Y., Zhang, Z., Sun, L., Li, Y., He, C., Ji, L., et al. (2018). Hydrocarbon generation and potential in continental organic-rich shales at the highly-mature stage, as determined by hydrous pyrolysis under supercritical conditions. Int. J. Coal Geol. 187, 83–93. doi:10.1016/j.coal.2018.01.006
Wu, Y., Zhang, Z., Sun, L., Li, Y., Zhang, M., and Ji, L. (2019). Stable isotope reversal and evolution of gas during the hydrous pyrolysis of continental kerogen in source rocks under supercritical conditions. Int. J. Coal Geol. 205, 105–114. doi:10.1016/j.coal.2019.03.004
Wu, Z., and Xu, Z. (2022). Experimental and molecular dynamics investigation on the pyrolysis mechanism of Chang 7 type-II oil shale kerogen. J. Petroleum Sci. Eng. 209, 109878. doi:10.1016/j.petrol.2021.109878
Xie, L., Sun, Y., Uguna, C. N., Li, Y., Snape, C. E., and Meredith, W. (2016). Thermal cracking of oil under water pressure up to 900 bar at high thermal maturities. 1. gas compositions and carbon isotopes. Energy Fuels 30, 2617–2627. doi:10.1021/acs.energyfuels.5b02792
Xin, F., Xu, H., Tang, D., Yang, J., Chen, Y., Cao, L., et al. (2019). Pore structure evolution of low-rank coal in China. Int. J. Coal Geol. 205, 126–139. doi:10.1016/j.coal.2019.02.013
Xu, H., Tang, D., Chen, Y., Ming, Y., Chen, X., Qu, H., et al. (2018). Effective porosity in lignite using kerosene with low-field nuclear magnetic resonance. Fuel 213, 158–163. doi:10.1016/j.fuel.2017.10.112
Xu, L., Yang, K., Zhang, L., Liu, L., Jiang, Z., and Li, X. (2021). Organic-induced nanoscale pore structure and adsorption capacity variability during artificial thermal maturation: pyrolysis study of the Mesoproterozoic Xiamaling marine shale from Zhangjiakou, Hebei, China. J. Petroleum Sci. Eng. 202, 108502. doi:10.1016/j.petrol.2021.108502
Yang, R., He, S., Hu, Q., Hu, D., and Yi, J. (2017). Geochemical characteristics and origin of natural gas from Wufeng-Longmaxi shales of the Fuling gas field, Sichuan Basin (China). Int. J. Coal Geol. 171, 1–11. doi:10.1016/j.coal.2016.12.003
Yang, S., Bao, Z., Wang, N., Qu, X., Lin, Y., Shen, J., et al. (2020). Diagenetic evolution and its impact on reservoir quality of tight sandstones: a case study of the Triassic Chang 6 Member, Ordos Basin, northwest China. Mar. Petroleum Geol. 117, 104360. doi:10.1016/j.marpetgeo.2020.104360
Yang, W., Zuo, R., Jiang, Z., Chen, D., Song, Y., Luo, Q., et al. (2018). Effect of lithofacies on pore structure and new insights into pore-preserving mechanisms of the over-mature Qiongzhusi marine shales in Lower Cambrian of the southern Sichuan Basin, China. Mar. Petroleum Geol. 98, 746–762. doi:10.1016/j.marpetgeo.2018.09.020
Zhang, C., Yao, Y., Elsworth, D., Liu, D., Ju, Y., Dong, Y., et al. (2021b). Microstructure characterization of kerogen in mature shale: molecular investigation of micropore development. J. Nat. Gas Sci. Eng. 95, 104239. doi:10.1016/j.jngse.2021.104239
Zhang, D., Wang, L., Su, L., Wu, Y., Sun, R., Wu, C., et al. (2020). The chemical kinetics of the semi-open hydrous pyrolysis system: time series analysis of lithostatic pressure and fluid pressure. Int. J. Coal Geol. 220, 103418. doi:10.1016/j.coal.2020.103418
Zhang, K., Peng, J., Wang, X., Jiang, Z., Song, Y., Jiang, L., et al. (2020). Effect of organic maturity on shale gas genesis and pores development: a case study on marine shale in the upper Yangtze region, South China. Open Geosci. 12 (1), 1617–1629. doi:10.1515/geo-2020-0216
Zhang, K., Song, Y., Jia, C., Jiang, Z., Han, F., Wang, P., et al. (2022). Formation mechanism of the sealing capacity of the roof and floor strata of marine organic-rich shale and shale itself, and its influence on the characteristics of shale gas and organic matter pore development. Mar. Petroleum Geol. 140, 105647. doi:10.1016/j.marpetgeo.2022.105647
Zhang, M., Duan, C., Li, G., Fu, X., Zhong, Q., Liu, H., et al. (2021a). Determinations of the multifractal characteristics of the pore structures of low-middle-and high-rank coal using high-pressure mercury injection. J. Petroleum Sci. Eng. 203, 108656. doi:10.1016/j.petrol.2021.108656
Zheng, H., Yang, F., Guo, Q., Pan, S., Jiang, S., and Wang, H. (2022). Multi-scale pore structure, pore network and pore connectivity of tight shale oil reservoir from Triassic Yanchang Formation, Ordos Basin. J. Petroleum Sci. Eng. 212, 110283. doi:10.1016/j.petrol.2022.110283
Zheng, S., Yao, Y., Liu, D., Cai, Y., and Liu, Y. (2019). Nuclear magnetic resonance surface relaxivity of coals. Int. J. Coal Geol. 205, 1–13. doi:10.1016/j.coal.2019.02.010
Zheng, Y., Fu, D., Qin, J., Liu, X., Tian, B., and Sun, L. (2021). Exploring the coupling relationship between hydrocarbon generation of continental shale and nanopore structure evolution—a case study of Shahejie formation in Bohai Bay Basin. J. Petrol Explor Prod. Technol. 11, 4215–4225. doi:10.1007/s13202-021-01315-x
Zhou, N., Lu, S., Zhang, P., Wang, M., Xiao, D., Li, J., et al. (2022). Continental shale gas dynamic enrichment and evolution over geological time. Int. J. Coal Geol. 251, 103914. doi:10.1016/j.coal.2021.103914
Zhu, L., Ma, Y., Zhang, C., Wu, S., and Zhou, X. (2021). New parameters for charactering the gas-bearing properties of shale gas. J. Petroleum Sci. Eng. 201, 108290. doi:10.1016/j.petrol.2020.108290
Keywords: continental organic-rich shales, evaluation, maturity, pore structures, SEM, NMR
Citation: Li Y, Wu Y, Zhao R, Jiang S and Du X (2024) Characterization of the evolution of thermal maturity and pore structure of continental organic-rich shales. Front. Earth Sci. 12:1399541. doi: 10.3389/feart.2024.1399541
Received: 12 March 2024; Accepted: 02 May 2024;
Published: 16 May 2024.
Edited by:
Yunyan Ni, China University of Petroleum, ChinaReviewed by:
Qingyong Luo, China University of Petroleum, ChinaCopyright © 2024 Li, Wu, Zhao, Jiang and Du. This is an open-access article distributed under the terms of the Creative Commons Attribution License (CC BY). The use, distribution or reproduction in other forums is permitted, provided the original author(s) and the copyright owner(s) are credited and that the original publication in this journal is cited, in accordance with accepted academic practice. No use, distribution or reproduction is permitted which does not comply with these terms.
*Correspondence: Yanju Li, bHlqODkwNjA5QGVtYWlsLmN1Z2IuZWR1LmNu
Disclaimer: All claims expressed in this article are solely those of the authors and do not necessarily represent those of their affiliated organizations, or those of the publisher, the editors and the reviewers. Any product that may be evaluated in this article or claim that may be made by its manufacturer is not guaranteed or endorsed by the publisher.
Research integrity at Frontiers
Learn more about the work of our research integrity team to safeguard the quality of each article we publish.