 Li-Ping Guo1
 Xin-Bao Gu2*
- 1School of Architecture, Nanyang Institute of Technology, Nanyang, Henan, China
- 2School of Civil Engineering, Nanyang Institute of Technology, Nanyang, Henan, China
Accurate evaluation of surrounding rock quality grade can help guarantee the safety of tunnel design and construction; hence, it has great significance in the construction of mine shafts. Accordingly, the uniaxial saturated compressive strength of the rock block
1 Introduction
Given the rapid development of Chinese infrastructure, the number and scale of construction projects in underground engineering have also grown. As essential components of underground engineering, the surrounding rocks in subway tunnels play vital roles in the entire subway system (Gu X. B. et al., 2021). The surrounding rocks in a tunnel constitute a complex geological body, and the quality of such surrounding rocks is affected by the rock mass structure, geological characteristics, and other factors (Gu and Wu, 2019). Accurate evaluation of the surrounding rock quality grade can provide safety guarantees for tunnel design and construction, reduce safety risks, promote efficient construction operations, and reduce cost and economic losses. Therefore, it is of great practical significance to evaluate the quality grades of the surrounding rocks in subway tunnel constructions (Gu et al., 2021b).
There is abundant literature on evaluating surrounding rock quality grade (Zhou et al., 2016). Li et al. (2014) assessed the stability of the surrounding rock mass using a fuzzy comprehensive evaluation method combined with rock mass characteristics and support parameters. Wang F. F. et al. (2019) used unascertained measure theory to evaluate the surrounding rock quality of a subway tunnel. Zhong et al. (2019) assessed the stability of tunnel surrounding rocks using a combination of game and extension theories. Based on the European distance method, Wang J. C. et al. (2019) evaluated the toughness of surrounding rocks in a subway tunnel. Xue et al. (2020) used a two-dimensional cloud model combined with an apriori algorithm to determine the stability grade of surrounding rocks. Geng et al. (2014) investigated the influence of tunnel span on rock mass quality and provided a basis for tunnel design and construction using the improved rock mass quality index method. Wu et al. (2020) applied a continuous interval mathematical model to evaluate the rock mass quality of a slope. Liu et al. (2018) applied a deep learning technique to classify the surrounding rocks. In recent years, experts and scholars have attempted to use the extension theory method (Zhengzheng et al., 2024), fuzzy comprehensive evaluation method (Yang, 2018), cloud model method (He et al., 2021), rough set theory method (Yang et al., 2018), unknown measure method (Zhou et al., 2021), and ideal point method (Jiang and Wang, 2021) to evaluate the stabilities of surrounding rocks in tunnels.
The above models and methods have improved the development of quality assessments for surrounding rocks. These research efforts have first enriched the classification and evaluation theories of surrounding rock quality; second, the randomness and fussiness of the evaluation indicators are considered to enhance the accuracies of the evaluation results; third, evaluations of the non-linearities of the surrounding rock quality have been performed to provide solutions for the evaluation indicators that are otherwise difficult to quantify, while reducing the influences of human factors (Zhao et al., 2024).
However, these approaches have some shortcomings (Shao et al., 2022) in terms of three aspects. 1) A single weighting method is used in these approaches, and the weighting process does not include the subjective importances of the influencing factors, objective relationships between the factors, and differences in the factors themselves. 2) The evaluation processes are complex; for example, the membership functions are difficult to determine. 3) Upon commencing the evaluation and grading processes, subjective influences cannot be exerted on the evaluations based on actual engineering needs, and the evaluations therefore lack flexibility. The above limitations greatly restrict the evaluations of surrounding rock quality.
To overcome the abovementioned drawbacks, the game gray target model was applied in this work to assess the surrounding rock quality. Gray target decision-making is a type of uncertainty system used to obtain information when there are very few samples or if the data are poor (Tan et al., 2019). This method can be used to mine and develop data to the maximum extent possible based on known information from a small number of samples. This technique has been applied in finance, military, and other fields to achieve good results (Li and Wu, 2017). Hence, this approach is applied in this study to evaluate and analyze the quality levels of surrounding rocks in a mine shaft.
The remainder of this paper is organized as follows: Section 2 introduces the theory and methodology of the game gray target model. Section 3 provides an engineering example of the surrounding rocks considered in this work. Section 4 presents the assessment model and results analyses. Section 5 presents the conclusions of this study.
2 Methodology
2.1 Principles of the game gray target model
Gray target decision-making is an important method for solving multiattribute decision-making problems from an objective perspective, and it can effectively reduce the loss of original information in the decision-making process (Zhou et al., 2014). Its basic idea is that an optimal data sequence is found from an existing set of sequences to construct a standard model. Then, the standard model is applied as the target, and the gray target model is built by comparing other models with the standard; the degree of likeness between the models is then evaluated to assess the target before calculating the target distance to determine the evaluation grade. Considering the errors in accuracy based on single-weight gray target models, the combination weighting method based on game theory was adopted in this work; then, the combined weights of the critic and entropy methods were optimized to obtain the optimal weight.
2.2 Establishment of the decisive matrix
Assuming that there are
Suppose that
where
Let
For the cost-type indicator, this formula becomes
From Eqs 1–3, the decisive matrix is expressed as
2.3 Calculation of the target center distance
For the decisive matrix
where
The positive target center distance
The negative target center distance
The distance from any sample point
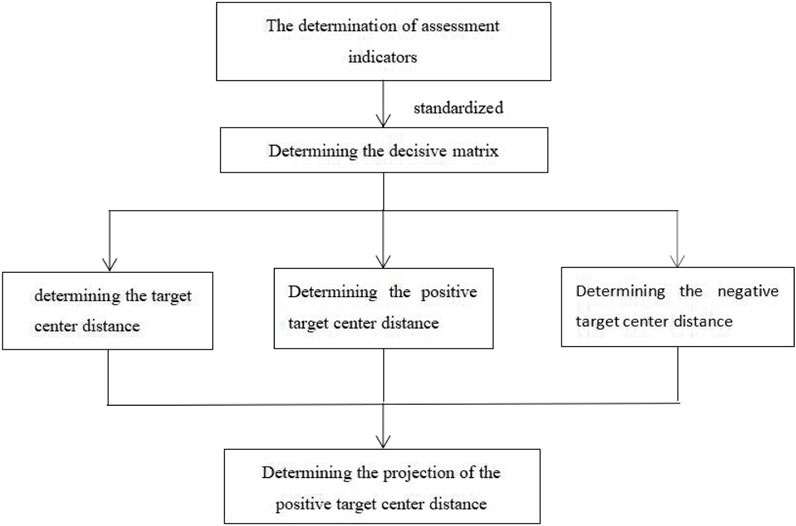
Figure 1. Calculation of the target center distances.
2.4 Classification of the quality grade
From the definitions of the target center distances, it is found that the comprehensive target distance quantitatively reflects the quality grade of a sample. Assuming that the samples to be evaluated have
2.5 Determination of the index weights
(1) Critic method
The critic method is a kind of weight-assignment method (Zhou et al., 2008) that uses the variability and conflict between different evaluation indexes for weighting to comprehensively measure the evaluation index. Its procedure is as follows:
① Standardization processing of the data
Each evaluation index is quantified to be dimensionless to eliminate the influences of different variables. If the evaluation index is of the benefit type, then the calculation formula is
If the evaluation index is of the cost type, then the calculation formula is
Here,
② The variability among the evaluation indexes is generally expressed using the standard deviation
where
③ The correlation coefficient of the evaluation index is calculated as
④ The conflict coefficient of the evaluation index is calculated as
⑤ The weight coefficient
(2) Entropy method
The entropy weighting method is used to determine the entropy value of an index according to the variance of the evaluation index, and its specific calculation method is based on a previously reported approach (Gu et al., 2019).
(3) Game theory combination weighting method
To avoid information loss caused by using a single weighting method and improve the accuracies of the weights, the combination weighting method based on game theory (Gu et al., 2021c) is applied to optimize the weights obtained from several other weighting methods to obtain the optimal weight as follows.
① The weight sets
② Based on game theory, the linear combination coefficients
③ Based on the differential properties of a matrix, the linear differential equations for optimizing the first derivative condition of Eq. 15 is
④ The optimal combination coefficients
3 Engineering overview
The new main shaft of the mine shaft project considered in this work was located in a denudation low mountain and hill area (Figure 2), with a designed depth of 1,135 m and diameter of 6.0 m. The new main shaft passed through nine types of rocks, namely, altered trachyte, albite granite, altered diabase, albite quartz syenite porphyry, fault breccia, albite granite porphyry, cataclastic granite, k-feldspar granite, and k-feldspar quartz diorite. There were five types of joints with different occurrences in the surrounding rocks as well as many alteration weak zones and fracture zones. There was uniform fractured water in the surrounding rocks of the shaft, whose upper part was a weak absorbent layer and the lower high-stress area was a relatively water-resistant layer. The field tests demonstrated that in most cases, the vertical stresses were similar for the quality of the overlying strata (
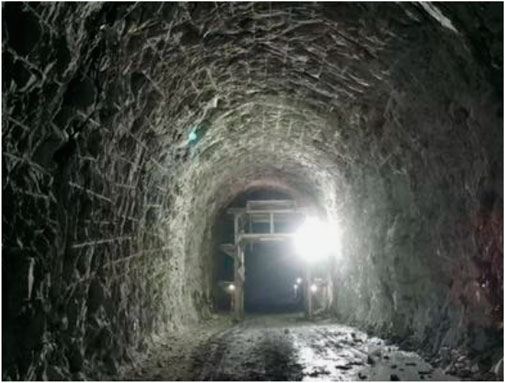
Figure 2. Mine shaft considered in this study.
4 Construction of the assessment model
4.1 Determination of the evaluation indexes
The selection of indicators should consider the ease of access of the site, convenience, and practices. Accordingly, eight influential factors were selected as the assessment indexes: uniaxial saturated compressive strength of the rock block
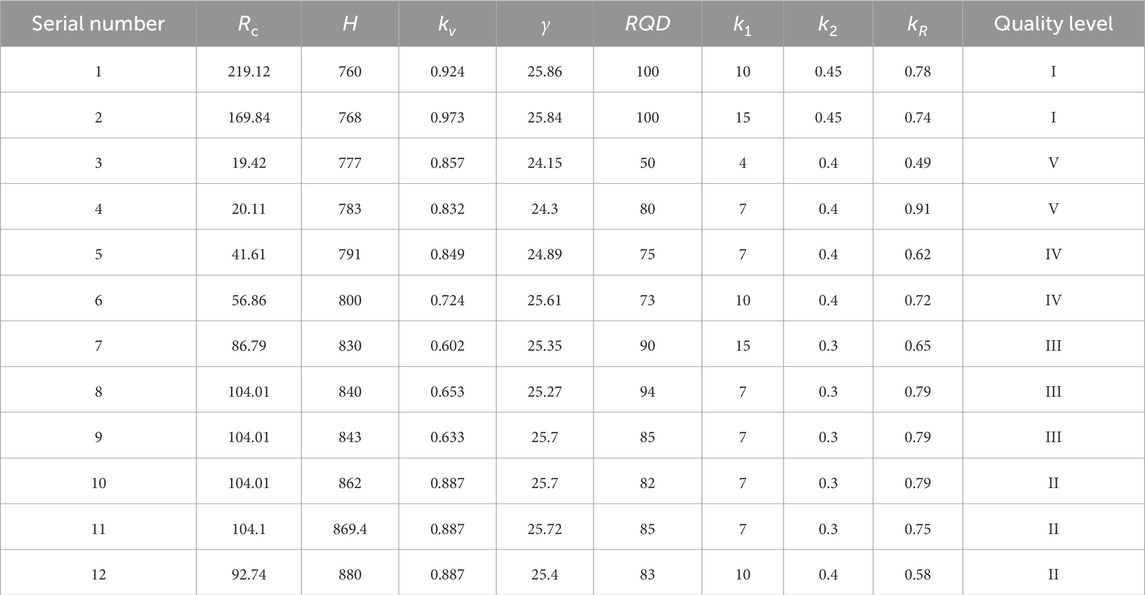
Table 1. Learning samples for the surrounding rock quality evaluation indexes.
4.2 Construction of the assessment frame
The flowchart depicting the determination of the quality levels of the surrounding rocks in the mine shaft is shown in Figure 3, and the specific procedures are as follows.
(1) The sample matrix of the origin matrix is constructed;
(2) the decisive matrix of original data is established based on Eqs 2, 3;
(3) the optimal combination weights of the different samples are obtained according to Eqs 9–17;
(4) the target centers of the different samples are found using the decisive matrix and Eq. 4;
(5) the positive and negative target center distances of the different samples are determined according to Eqs 5, 6;
(6) the target center distances of the different samples are determined using Eq. 7;
(7) the quality levels are partitioned according to the target center distance ranges in combination with Eq. 8;
(8) the final quality grade of the surrounding rocks is determined.
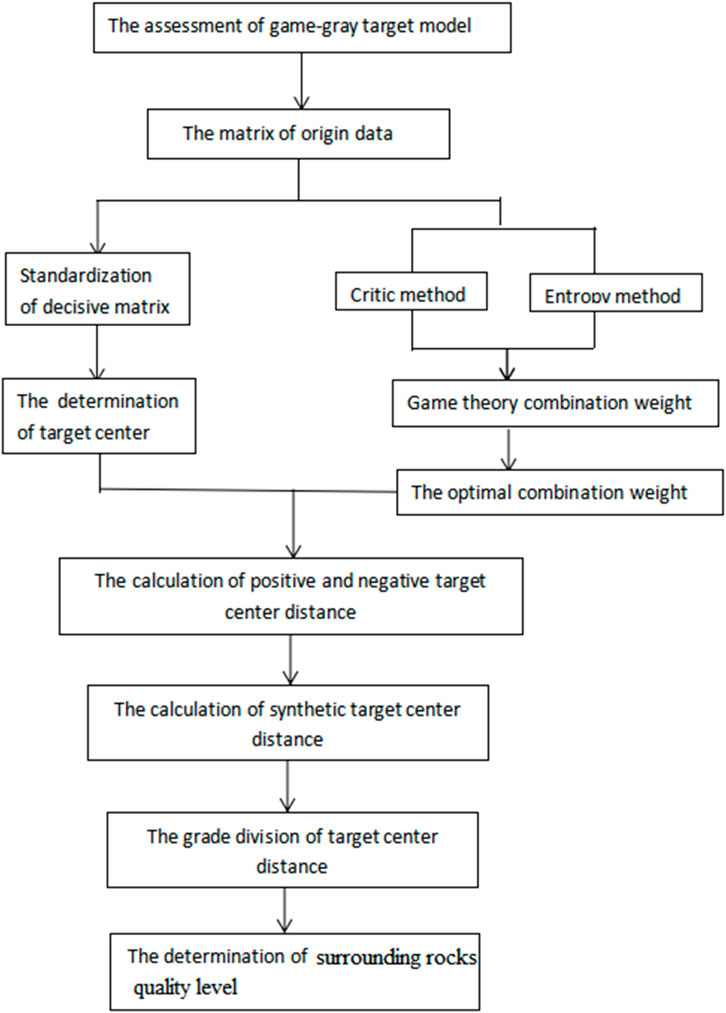
Figure 3. Flowchart of the assessment framework.
4.3 Determination of the standard decisive matrix values
Four of the indicators listed in Table 1 are of the benefit type. Using Eqs 1–3 and the information in Table 1, the decisive matrix values are obtained as shown in Table 2.

Table 2. Decisive matrix values for the evaluation indexes.
4.4 Determination of the index weights
1) Determining the weight coefficients
From Table 2, the corresponding set of weight coefficients is obtained as
2) Calculating the weight coefficients
From Eqs 9–11 and the information in Table 1, the correlation coefficients are calculated as
Using Eq. 12, the standard deviations of the individual columns are obtained as
Similarly, using Eq. 13 the set of weights of the evaluation indexes is obtained as
3) Determining the combined weights
From Eqs. 14–18, the combined set of weights
The individual and combined weights are graphically depicted in Figure 4.
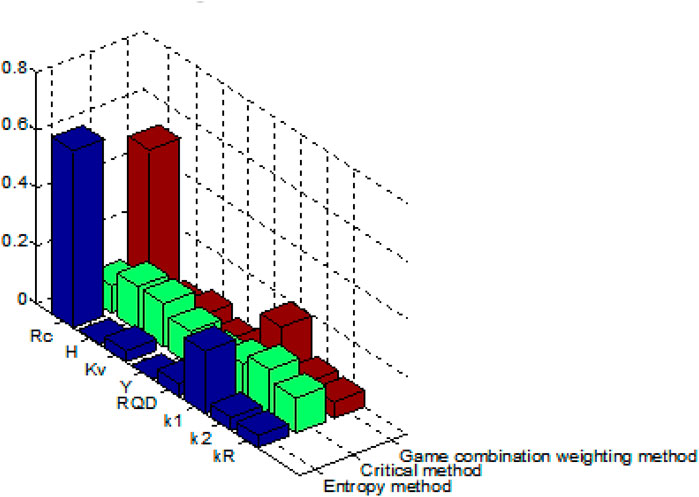
Figure 4. Graphical depiction of the individual and combined weight coefficients.
4.5 Determination of the target center distances
The positive and negative target centers are respectively obtained as
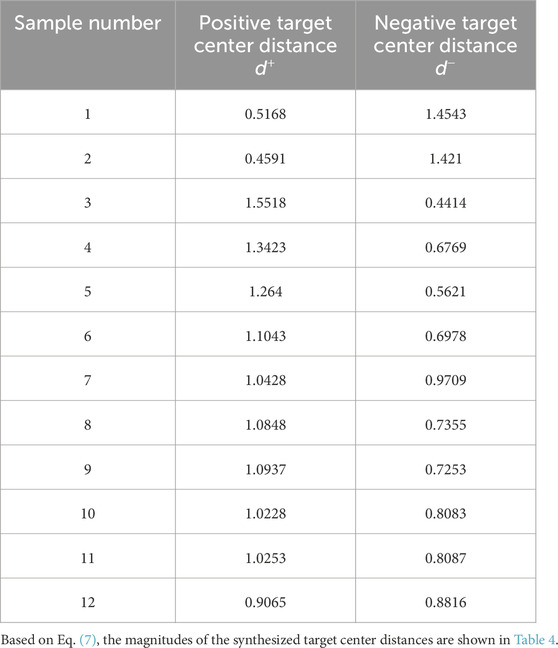
Table 3. Positive and negative target center distances for the different rock samples.
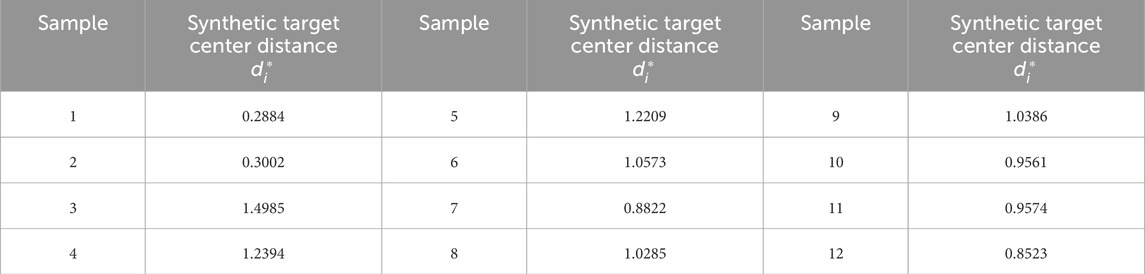
Table 4. Synthesized target center distances for the rock samples.
4.6 Determination of the quality grade of the surrounding rocks
The comprehensive target distance of each sample was arranged according to the quality grade, and the critical value of the target distance for each quality grade was obtained, as shown in Table 5. Using Eq. 8, the target distance for each quality grade can be derived, as plotted in Figure 5.
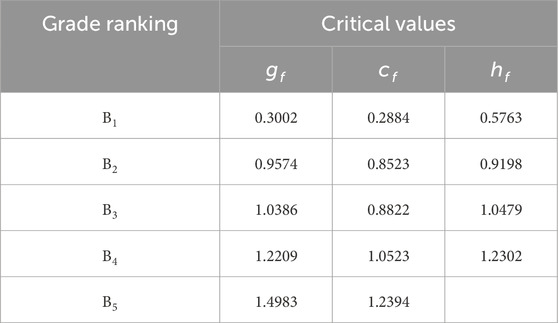
Table 5. Critical values of the synthesized target center distances.
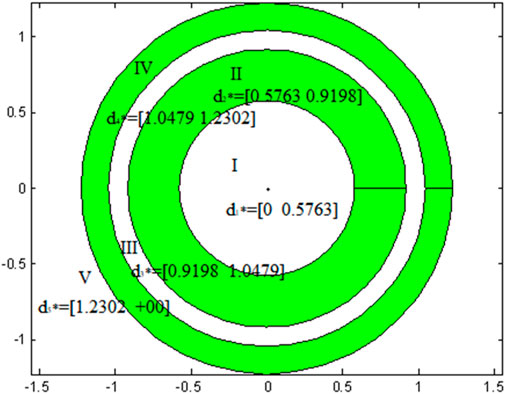
Figure 5. Grade target distances for surrounding rock quality.
4.7 Quality grade prediction of the surrounding rocks
To test the rationality and accuracy of the gray target evaluation model established in this study, a mine shaft project was selected as the example; the monitoring data for 13-17# samples are shown in Table 6. Different parameters are obtained and substituted into the game gray target evaluation model, and the corresponding comprehensive target distances
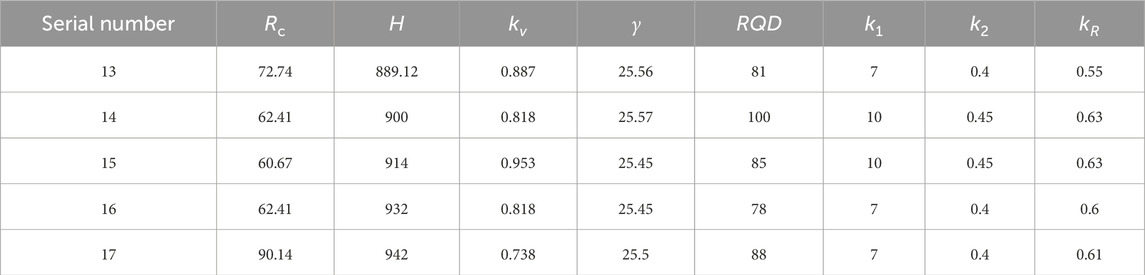
Table 6. Monitoring data for the evaluation indexes.

Table 7. Synthesized target distances of the predicted grades.
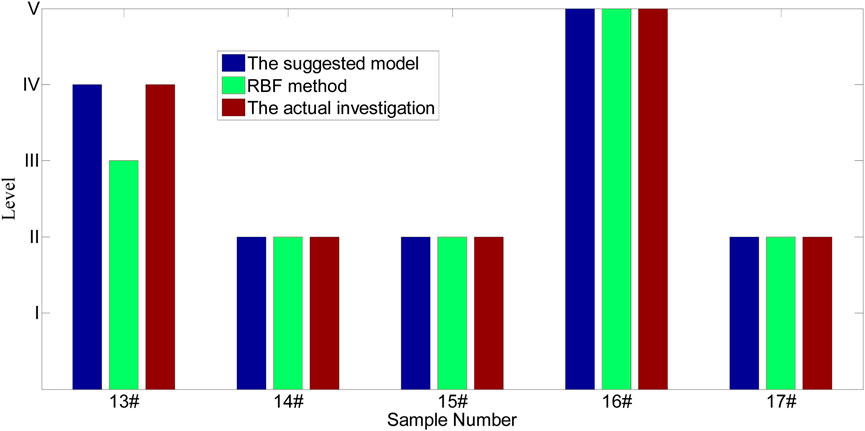
Figure 6. Comparison of results from three methods.
The game gray target model was used to evaluate the quality levels of the surrounding rocks, and the assessment results are depicted in Table 7; it is seen from this table that the quality grades of the surrounding rocks for the 13–17# samples differ greatly. The quality levels for the 13# sample is IV, 16# sample is V, and the remaining samples are II; this means that the 13# sample is of inferior quality, 16# sample is of bad quality, and the rest are of good quality, for a combined quality rate of 60%. For the 13# and 16# samples, corresponding consolidation measures should be implemented; for example, shotcrete and anchor supports should be adopted to enhance the stabilities of the surrounding rocks, and no measures need to be adopted for the other samples.
The comparative results of the assessment models in Figure 6 indicate that the proposed method is consistent with the actual investigations for the five different samples and that its accuracy is 100%, which is greater than the accuracy of the RBF (Radial Basis Function) method (80%) (Zhou et al., 2012). Therefore, estimating the quality levels of surrounding rocks is feasible using the proposed game gray target model. The proposed approach also provides additional details for assessing the quality levels of the surrounding rocks. For example, the quality of the 15# sample is more likely to be level II as its synthetic target distance (0.8241) is greater than that for the 17# sample (0.7019) that could likely be closer to level III. Thus, the results of the proposed model can accurately demonstrate the quality grades of the surrounding rocks and further determine the risk grade rankings for different samples at the same levels.
5 Results and discussion
Considering the uniaxial saturated compressive strength of the rock block
(1) The proposed method was used to assess the quality levels of surrounding rocks in a new mine shaft, and the results obtained were consistent with those of actual investigations for five different samples. The accuracy with the proposed method reached 100%, which is more significant than the results of the backpropagation neural network method (80%). Therefore, it is highly feasible to estimate the quality levels of surrounding rocks using the game gray target model.
(2) The quality grades of the surrounding rocks for the 13–17# samples differ greatly; the quality levels for the 13# sample is IV, 16# sample is V, and the remaining samples are II, for a combined quality rate of 60%. For the 13# and 16# samples, corresponding consolidation measures are suggested to be implemented; for example, shotcrete and anchor supports should be adopted to enhance the stability of the surrounding rocks.
(3) The game gray target grade evaluation model can be used to mine small data sample to the maximum extent possible, thereby minimizing the information shortage caused by the small sample to a certain extent. The final quality grades of surrounding rocks can also be evaluated quantitatively using this model.
(4) The proposed method can accurately assess the water quality grade with higher reliability and efficiency. However, the calculation process is complex, so the randomness of the evaluation indexes are not considered. Hence, the proposed method can be further improved in the future. In the future work, a three-dimensional gray target model will be developed and applied to assess the water quality levels.
The results from the proposed model have been shown to accurately predict the quality levels of surrounding rocks and further help determine the quality level rankings for different samples at the same level. Thus, the suggested method is expected to provide a new avenue for quality level assessments of surrounding rocks in the future.
Data availability statement
The original contributions presented in the study are included in the article/supplementary material, and any further inquiries may be directed to the corresponding author.
Author contributions
L-PG: Conceptualization, Formal analysis, Resources, Supervision, Writing–review and editing. X-BG: Funding acquisition, Investigation, Methodology, Writing–original draft.
Funding
The author(s) declare that financial support was received for the research, authorship, and/or publication of this article. This work was supported by the Opening Project of Sichuan Province University Key Laboratory of Bridge Non-destruction Detecting and Engineering Computing (nos. 2022QYJ02, 2022QYY02, and 2022QYJ02) and Key Scientific Research Projects of Colleges and Universities in Henan Province (no. 23B560019).
Conflict of interest
The authors declare that the research was conducted in the absence of any commercial or financial relationships that could be construed as a potential conflict of interest.
Publisher’s note
All claims expressed in this article are solely those of the authors and do not necessarily represent those of their affiliated organizations or those of the publisher, editors, and reviewers. Any product that may be evaluated in this article, or claim that may be made by its manufacturer, is not guaranteed or endorsed by the publisher.
References
Geng, X. J., Du, X. W., and Yan, Q. (2014). Research on influence of span on surrounding rock quality of tunnels. Adv. Mater. Res. 919/920/921, 869–872. doi:10.4028/www.scientific.net/amr.919-921.869
Gu, X. B., Ma, Y., Wu, Q. H., Ji, X. J., and Bai, H. (2021a). The risk assessment of landslide hazards in Shiwangmiao based on intuitionistic fuzzy sets-Topsis model. Nat. Hazards 111, 283–303. doi:10.1007/s11069-021-05053-5
Gu, X. B., Shao, J. L., Wu, S. T., Wu, Q. H., and Bai, H. (2021b). The risk assessment of debris flow hazards in zhouqu based on the projection pursuit classification model. Geotechnical Geol. Eng. 8 (2), 4–17.
Gu, X. B., and Wu, Q. H. (2019). Seismic stability analysis of waterfront rock slopes using the modified pseudodynamic method. Geotech. Geol. Eng. 37 (3), 1743–1753. doi:10.1007/s10706-018-0718-1
Gu, X. B., Wu, Q. H., and Zhu, Y. H. (2019). The experimental investigation on the propagation process of crack for brittle rock similar material. Geotechnical Geol. Eng. 37 (6), 4731–4740. doi:10.1007/s10706-019-00934-w
Gu, X. B., Wu, S. T., Ji, X. J., and Zhu, Y. H. (2021c). The risk assessment of debris flow hazards in Banshanmen gully based on the entropy weight normal cloud method. Adv. Civ. Eng. 2 (1), 1–11. doi:10.1155/2021/8841310
He, L. P., Luo, S. Y., Hu, Q. J., Cai, Q. J., and Li, Y. H. (2021). Stability evaluation of tunnel surrounding rock based on ideal point-extension cloud model. Chin. J. Geol. Hazard Control. 32 (2), 126–134. doi:10.16031/j.cnki.issn.1003-8035.2021.02.17
Jiang, P. F., and Wang, X. R. (2021). Evaluation of surrounding rocks quality based on composite weight grey relationship analysis. People Pearl River 42 (6), 112–116.
Li, J. L., Li, J. C., and Sui, B. (2014). Application of the multi- variate compositive fuzzy judgement in assessment of surrounding rock mass stability. Build. Sci. 30 (9), 98–102.
Li, S. C., and Wu, J. (2017). A multi-factor comprehensive risk assessment method of karst tunnels and its engineering application. Bull. Eng. Geol. Environ. 78 (6), 1761–1776. doi:10.1007/s10064-017-1214-1
Liu, H. X., Li, W. S., and Zha, H. Y. (2018). Method for surrounding rock mass classification of highway tunnels based on deep learning technology. Chin. J. Geotechnical Eng. 40 (10), 1809–1817.
Shao, J. L., Gao, L., Wu, Q. H., and Gu, X. B. (2022). The application of variable fuzzy sets theory on the quality assessment of surrounding rocks. Adv. Mater. Sci. Eng. 2022, 1–10. doi:10.1155/2022/5441829
Tan, Z., Jian-hua, H., and Ye, K. (2019). Rock mass quality evaluation method and application based on fuzzy RES-multidimensional cloud model. Chin. J. Nonferrous Metals 29 (8), 1771–1780.
Wang, F. F., Wang, E. M., and Xu, T. Q. (2019a). Evaluation of metro tunnel based on combined weighting-unascer-tained measurement theory. Railw. Stand. Des. 63 (6), 129–134.
Wang, J. C., Zhao, F. Q., and He, X. S. (2019b). Evaluation of surrounding rock resilience of subway tunnel based on Euclidean distance. Railw. Stand. Des. 63 (10), 106–111.
Wu, L. X., Liu, D. X., and Cao, P. A. (2020). A new method for evaluating rock mass quality of slopes based on interval continuous mathematical models. Bull. Eng. Geol. Environ. 79 (3), 1357–1364. doi:10.1007/s10064-019-01661-5
Xue, L. M., Li, C. M., and Zheng, and Z. X. (2020). Classification of stability of surrounding rock based on two-dimensional cloud and apriori. J. China Railw. Soc. 42 (6), 121–128.
Yang, J. H. (2018). Stability classification of surrounding rock in shield TBM construction based on fuzzy comprehensive evaluation. J. Jilin Univ. Sci. Earth Sci. Ed. 48 (05), 1596–1602. doi:10.13278/j.cnki.jjuese.20180159
Yang, R. G., Meng, L. J., and Hu, L. C. (2018). Hybrid reliability analysis for the multiple source uncertainty of the dominant girder structure of the bridge frame crane. J. Saf. Environ. 18 (4), 1251–1257.
Zhao, B., Shao, Y.-B., Yang, C., and Zhao, C. (2024). The application of the game theory combination weighting-normal cloud model to the quality evaluation of surrounding rocks. Front. Earth Sci. 12, 1346536. doi:10.3389/feart.2024.1346536
Zhengzheng, C., Qiang, S., Zhenhua, L., and Feng, D. (2024). Abnormal ore pressure mechanism of working face under the influence of overlying concentrated coal pillar. Sci. Rep. 14, 626. doi:10.1038/s41598-024-51148-x
Zhong, L. M., Xie, Q. M., and Luo, Y. (2019). Stability evaluation of tunnel surrounding rock based on game-extension theory. J. Saf. Sci. Technol. 15 (1), 56–61.
Zhou, X. P., Cheng, H., and Feng, Y. F. (2014). An experimental study of crack coalescence behaviour in rock-like materials containing multiple flaws under uniaxial compression. ROCK Mech. ROCK Eng. 47 (6), 1961–1986. doi:10.1007/s00603-013-0511-7
Zhou, X. P., Gu, X. B., and Qian, Q. H. (2016). Seismic bearing capacity of shallow foundations resting on rock masses subjected to seismic loads. KSCE J. Civ. Eng. 20 (1), 216–228. doi:10.1007/s12205-015-0283-6
Zhou, X. P., Pan, X. K., and Cheng, H. (2021). The nonlinear creep behaviors of sandstone under the different confining pressures based on NMR Technology. Rock Mech. Rock Eng. 54 (9), 4889–4904. doi:10.1007/s00603-021-02557-1
Zhou, X. P., Zhang, Y. X., Ha, Q. L., and Zhu, K. S. (2008). Micromechanical modelling of the complete stress-strain relationship for crack weakened rock subjected to compressive loading. ROCK Mech. ROCK Eng. 41 (5), 747–769. doi:10.1007/s00603-007-0130-2
Keywords: quality assessment, surrounding rocks, mine shaft, game gray target model, level
Citation: Guo L-P and Gu X-B (2024) Quality evaluation of surrounding rocks in a mine shaft based on the game gray target model. Front. Earth Sci. 12:1399095. doi: 10.3389/feart.2024.1399095
Received: 11 March 2024; Accepted: 20 May 2024;
Published: 02 July 2024.
Edited by:
Fanyu Zhang, Lanzhou University, ChinaReviewed by:
Dan Ma, China University of Mining and Technology, ChinaZhengzheng Cao, Henan Polytechnic University, China
Copyright © 2024 Guo and Gu. This is an open-access article distributed under the terms of the Creative Commons Attribution License (CC BY). The use, distribution or reproduction in other forums is permitted, provided the original author(s) and the copyright owner(s) are credited and that the original publication in this journal is cited, in accordance with accepted academic practice. No use, distribution or reproduction is permitted which does not comply with these terms.
*Correspondence: Xin-Bao Gu, MTU4MjM0MDU5NTJAMTYzLmNvbQ==