 Haoxuan Tang
 Chunsheng Jia
 Hao Lu2
 Baiyu Zhu
- 1School of Petroleum Engineering, Southwest Petroleum University, Chengdu, China
- 2School of Earth Science and Technology, Southwest Petroleum University, Chengdu, China
- 3Chengdu Northern Petroleum Exploration and Development Technology Co. Ltd., Chengdu, China
- 4Petroleum Engineering Research Institute, Jianghan Oilfield, Wuhan, China
Carbonate reservoirs are characterized by abundant reserves and are currently focal points for development in oil and gas producing regions such as the Ahdab oilfield, Tarim Basin, Sichuan Basin, and Ordos Basin. The primary method for exploiting carbonate reservoirs is waterflooding. However, due to the complex pore structure and pronounced heterogeneity of carbonate rocks, the waterflooding process often leads to an unclear distribution of remaining oil and low waterflooding recovery efficiency, significantly impacting the stable and high production of carbonate reservoirs. This paper presents a two-phase flow model of oil and water in distinct pore structures by integrating fluid flow equations and interface tracking equations. It visually represents the waterflooding process at the pore scale, elucidates the distribution and formation mechanism of remaining oil, and discusses the mechanism of microscopic displacement efficiency change. The study reveals that: 1) After waterflooding, the distribution patterns of remaining oil can be categorized into dead-end remaining oil, pressure balance remaining oil, wall-bound remaining oil, Jamin effect remaining oil, and water-encapsulating remaining oil, which are governed by microscopic pore structure, wettability, and preferential flow paths; 2) From the perspective of actual reservoir displacement efficiency, intergranular pores > intergranular dissolved pores > visceral foramen > mould pore, with this trend being more pronounced under hydrophilic wetting conditions; 3) Given the oil-wet to strong oil-wet wettability characteristics of these carbonate rocks, capillary forces pose significant resistance during waterflooding. The conclusion underscores the importance of leveraging the reservoir’s microscopic pore structure and wettability characteristics for actual oil wells, elucidating the evolutionary law of the mechanical mechanism of oil-water interface advancement, clarifying oil-water percolation characteristics at the pore scale, and understanding the microscopic displacement physical mechanism, all of which are crucial for guiding the design of schemes aimed at enhancing reservoir recovery efficiency.
1 Introduction
Carbonate reservoirs occupy an important position in the exploration and development of the world’s oil and gas resources, with reserves and production accounting for more than half of the global total, such as the oil and gas producing areas of the Tarim Basin, Sichuan Basin, and Ordos Basin in China (Zhiwen et al., 2020; Zeng et al., 2022). The main technology for exploiting carbonate rock oil reservoirs is waterflooding development, which involves injecting water into the reservoir to displace the crude oil originally enriched in the pores of the carbonate rock reservoirs (Wang et al., 2020; Xu et al., 2020; Baiyu et al., 2022). However, as the development of carbonate rock oil reservoirs deepens and the strong heterogeneity of carbonate rock reservoirs becomes apparent, a series of development problems emerge, including unclear distribution of residual oil and low waterflooding recovery efficiency (Dordzie and Dejam, 2021; Li et al., 2021; Sagbana et al., 2022). These issues pose a serious threat to the stable and high production of reservoirs, necessitating a rapid clarification of the mechanism and pattern of waterflooding development in carbonate rock oil reservoirs.
The strong heterogeneity of carbonate rock oil reservoirs, complex pore throat structure, pronounced anisotropy, and significant wettability differences pose great challenges to efficient reservoir development (Mogensen and Masalmeh, 2020; Radwan et al., 2021; Yao et al., 2021). Anisotropy and heterogeneity significantly impact the pattern of waterflooding and the distribution of residual oil in carbonate rock oil reservoirs, prompting scholars to study these phenomena. Currently, the main research methods for reservoir development include numerical simulation, production dynamic analysis, and physical experimental simulation (Hao et al., 2019; Bisweswar et al., 2020; Tetteh et al., 2020; Snosy et al., 2022). Production dynamic analysis is based on interpreting the internal waterflooding situation of reservoirs directly from development dynamic data (Dou et al., 2019; Lee et al., 2020; Li et al., 2023). This method is simple, direct, and low-cost, but overly dependent on subjective human experience, resulting in conclusions that lack evidence support.
The earliest physical simulation experiments relied on core displacement experiments, later incorporating fluorescence dyes and other visual analysis techniques to observe the waterflooding oil process. With advancements in research methods, online CT and NMR analysis technologies have gradually been applied to the analysis of oil displacement efficiency (Tawfik et al., 2019; Guo et al., 2020; Selem et al., 2021; Zhang et al., 2023). Li et al. (2018) and others conducted waterflooding, gas flooding, and alternating gas-water flooding simulation experiments using long cores to evaluate the impact of different displacement methods on the recovery efficiency of carbonate rock oil reservoirs; Guo et al. (2020) used nuclear magnetic resonance technology to evaluate the gas-water two-phase seepage law during water invasion in carbonate rock gas reservoirs. However, rock displacement experiments and nuclear magnetic resonance experiments cannot directly observe the dynamic movement and distribution characteristics of gas-water phases, lacking intuitiveness. With advancements in micro-pore structure research methods, many scholars have directly observed the micro-pore structure of carbonate rocks through rock cast thin sections or CT scans, combined with laser etching technology or micro-electronic lithography, to establish glass etched models that reflect the real underground porous media (Song et al., 2014; Wang et al., 2017; Mohammadi and Mahani, 2020; Yang et al., 2020; Haghighi et al., 2022). Based on this model, physical simulation of oil-water two-phase flow is conducted to observe the distribution and two-phase seepage characteristics during gas driving oil and water driving oil processes (Lv et al., 2022). Visualization experiments show that water driving gas forms trapped gas through mechanisms such as finger penetration, cutoff, pore blind ends and corners, H channels, and flow around. Image processing technology can also be used for quantitative analysis of gas-water distribution patterns.
Compared to physical simulations, researchers can also directly conduct Computational Fluid Dynamics (CFD) numerical simulations within the pore spaces of porous media, revealing the seepage laws of single or multiphase fluids at the pore scale more flexibly and finely. Many scholars have studied the multiphase seepage characteristics during waterflooding oil, gas driving oil, and imbibition processes through different numerical simulation methods, such as level set, phase field, lattice Boltzmann, and pore network simulation (Nandwani et al., 2019; Mehraban et al., 2020; Jia et al., 2022; Cheng et al., 2023; Yang et al., 2023). The LBM holds inherent advantages in studying the interaction between micro/nano matrices and fractures. However, it exhibits significant limitations in simulating non-miscible flow with high viscosity ratios, and its research scale is severely restricted by computational power. Porous network models were widely used in multiphase flow simulation studies of porous media in previous years. This method typically employs geometrically simple pore networks, which have limitations in addressing fluid flow in complex pore structures. Both the level set method and phase field method can handle complex pore geometries and topological changes. However, the level set method imposes stricter conditions on the establishment of numerical models and requires longer simulation times. Compared to the level set method, the phase field method can more accurately describe fluid flow in complex porous media, and the pressure gradient distribution and fluid distribution better match reality. By coupling the Cahn-Hilliard equation and the Navier-Stokes equation, the phase field method accurately describes fluid flow in porous media while ensuring mass conservation. Particularly for complex porous media with uneven pore distribution or fractal characteristics, the phase field method can address flow problems involving complex moving interfaces and complex pore structures. These studies have provided a theoretical basis for understanding the microscopic pore-scale flow mechanisms in porous media and have significant implications for the development of oil and gas fields, especially in complex carbonate reservoirs where traditional macroscopic models may not fully capture the nuances of fluid flow and rock-fluid interactions.
2 Pore-scale simulation of oil-water flow
To establish a simulation method for water-oil flow at the pore scale, this study assumes that the oil and water phases are immiscible and incompressible, and their flow through porous media adheres to the principles of isothermal laminar flow.
2.1 Interface tracking equation
The CFD method for multiphase flow describes the mechanism of multiphase fluid flow through the Navier-Stokes equations, while simultaneously coupling convection-diffusion equations regarding phase variables to achieve interface tracking, such as Level Set method, Phase Field method, and Volume of Fluid method, etc. Many studies have shown that the Phase Field method is more suitable for simulating non-miscible oil-water two-phase flow in porous media. Essentially, it remains a continuous method. This method describes the two-phase mixing interface as a diffusion interface layer with a certain thickness. On this interface layer, the phase variable gradually transitions from the oil phase to the water phase. The evolution equation of the phase variable is the Cahn-Hilliard equation derived from the free energy, describing the phase separation process under the influence of convection and diffusion:
In the equation,
Phase field method is an incompressible two-phase flow interface diffusion model, suitable for mixed-phase, non-miscible, and partially miscible flows. The phase field model identifies different phase regions and transition regions between phases by introducing a phase field variable
2.2 Fluid motion equations
The fluid motion equations consist of the mass and momentum conservation equations, which are the continuity equation and the Navier-Stokes equations, respectively.
In the equation,
The viscous stress tensor is defined by the following expression:
The model presented in this article is based on the built-in phase field two-phase flow basic model in Comsol. Its solution method relies on finite element method. Additionally, in order to achieve rapid solution of high-quality grids under complex pore structures, this article introduces the density and viscosity equivalent models in the mixed-phase region, which can be calculated by the following equations:
Where, Subscripts 1 and 2 represent fluid one and fluid 2. In the phase field method,
Where,
It can be seen that utilizing the dimensionless phase field variable
2.3 Wettability and surface tension
The solid boundary condition for the motion equations is a no-slip boundary, and the phase variable does not cross the solid boundary, which is described as:
In the equation,
2.4 Validation
The visualization experiment used to compare the numerical simulations is sourced from Karadimitriou et al. (2012, 2013). The experimental parameters are fully characterized and the model is easy to accurately reconstruct. Therefore, this reference selects its experimental results for comparison. At the same time, this experiment is used for verification in many two-phase flow numerical simulations, such as SPH et al. (Kunz et al., 2016).
Karadimitriou et al. (2013) studied the displacement flow behavior of internal fluorinated liquids and water using visualized microscopic models. This paper compares the established phase-field method model with their experimental results to validate the numerical simulation method. The microscopic model used for experiments is a rectangle with dimensions of 2.5×1 mm. It consists of several circular pillars of varying sizes representing the skeletal particles of the porous medium, with an average pore diameter of 160 µm. The fabrication involves photolithography on a silicon wafer, followed by covering the microscopic model with a PDMS sheet and bonding. The experimental setup consists of three main parts: an optical acquisition system, a pressure sensor, and a pumping system. More details about the experimental setup can be found in the work of Karadimitriou et al. (2013). During the experiment, the initial state fills the geometric model with water as the displaced phase, and the walls of the microscopic model are hydrophilic, then fluorinated liquid is injected for displacement. The microscopic model has a contact angle of 45°, a density of 1800 kg/m³, a viscosity of 4.7 mPa·s for the fluorinated liquid, a density of 1,000 kg/m3, a viscosity of 1 mPa·s for water, and a surface tension of 0.055 N·m⁻1, with a displacement pressure difference of 1860 Pa. The basic parameters of the verification model are consistent with the experiment, and the results show that most of the residual displaced water phases obtained from the experiment and simulation are similar, indicating that the phase-field method can largely simulate the distribution state of two-phase fluids (Figure 1).
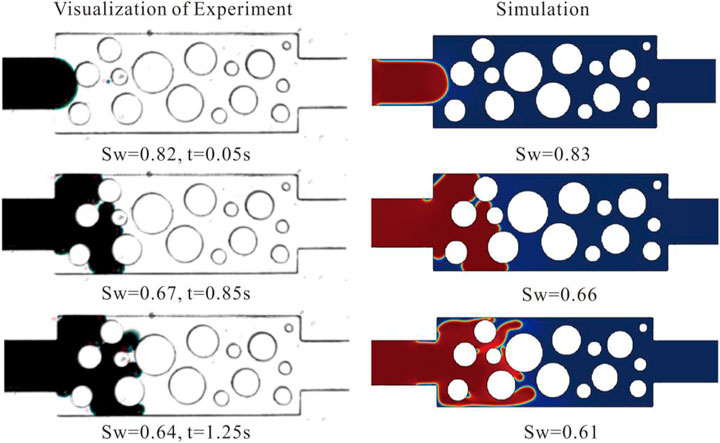
Figure 1. Comparison between experimental results from Karadimitriou et al. (2013) and simulation results.
3 Complex pore structure construction and boundary conditions
The carbonate reservoirs exhibit highly complex pore structures and significant variations in wettability. However, previous numerical simulations of water flooding in oil recovery have largely overlooked the complex pore structures and wettability variations characteristic of carbonate reservoirs. The models employed thus far have been relatively homogeneous and have insufficiently accounted for wettability and pore structure, thereby constraining the development of complex carbonate oil and gas reservoirs. It is commonly accepted that the flow of fluids in micro-pores within laminar flow regimes generally conforms to Darcy’s Law. Considering that the study focuses on oil-water two-phase flow within a two-dimensional planar flow domain, a laminar flow model is selected to reduce computational difficulty and enhance model convergence. The two-phase flow process of waterflooding includes oil and water, with parameters for oil and water as below. The model is initially saturated with oil, assuming water is connected to the left side, with the water phase entering at a constant flow rate from the left end at 0.01 m/s, and both oil and water phases exiting from the right end at a static pressure of 0 Pa. From the perspective of wettability, the composition of carbonate rocks is relatively simple, dominated by calcite with a partial affinity for oil. Most carbonate rock samples in the wettability experiment exhibit oil-philic to strongly oil-philic characteristics, with a few neutral to hydrophilic characteristics (Wang, 2019). This paper discusses the impact of different water contact angle (CA=30°–150°), ranging from water-wet to oil-wet, with no slip at the fluid-rock interface. The oil phase density is set to 800 kg/m3, oil phase viscosity at 2.3 mPa·s, water phase density at 1,000 kg/m3, water phase viscosity at 1 mPa·s, and interfacial tension of 25 mN/m.
Based on the characteristic features of typical carbonate reservoirs in the Ahdab oilfield and previous experiences with water flooding experiments, a series of analyses were conducted using cast thin sections. Firstly, different intergranular pore models with varying throat/pore size ratios were selected to quantitatively analyze the impact of wettability and throat size on oil displacement efficiency and residual oil types. Subsequently, models representing fracture-type and fracture-pore-type structures were created to analyze the influence of fractures on water flooding. Finally, considering the typical pore structure types in the study area, models representing mould pores, visceral foramen, intergranular pores, and intergranular dissolution pores were constructed to analyze the impact of actual pore structures in the study area on water flooding efficiency. The initial pore structure was identified by binarizing cast thin sections, followed by manual repairs through image stitching and other methods, and removing ineffective dead pores. The resulting physical model is shown in Figure 2, where the independent irregular shapes represent the rock matrix, and the interconnected channels represent the pores. The model dimensions are 0.5 mm × 0.3 mm. To study the distribution of residual oil and factors influencing residual oil distribution in a two-dimensional plane post oil displacement, a mathematical model was solved using the finite element method. The geometric model was meshed using Delaunay triangulation to discretize the porous media geometry. Mesh sizes in this study ranged from 0.0001 to 0.01 mm, meeting the requirements for investigating displacement details in depth.
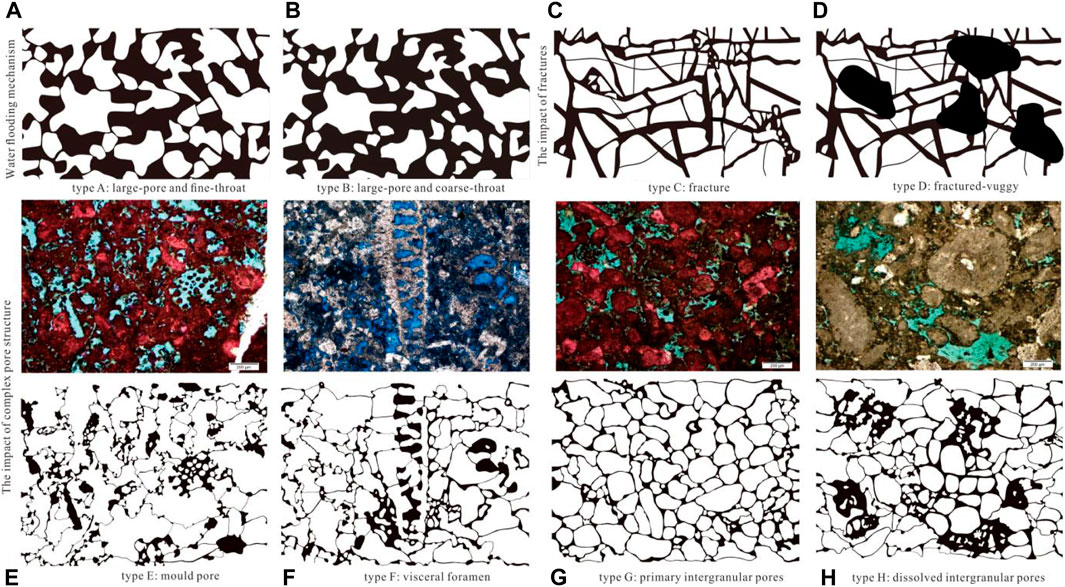
Figure 2. Typical pore structure types.
In order to quantify the impact of parameters such as wettability on displacement efficiency during the design of porous structures, idealized treatments were applied to pore structure parameters. For instance, in the case of large pore with narrow throat and large pore with wide throat, the pore sizes and distributions remained consistent, with only the throat sizes being altered to investigate the effect of throat size and distribution on water flooding efficiency. Similarly, for fracture type and fracture-pore type structures, the distribution and size of fractures remained consistent, with the fracture-pore type having additional large pores at certain locations to examine the effect of hole presence on water flooding efficiency.
Specifically, for the large pore with narrow throat type, the peak throat distribution ranged from 1 to 2 μm, with a minimum throat of 0.88 μm, maximum throat of 4.83 μm, and an average throat radius of 2.44 μm, resulting in a throat/pore diameter ratio of 0.060, subsequently named Type A. For the large pore with wide throat type, the peak throat distribution ranged from 4 to 5 μm, with a minimum throat distribution of 1–2 μm, maximum throat distribution of 13–14 μm, an average throat radius of 6.65 μm, resulting in a throat/pore diameter ratio of 0.167, subsequently named Type B. For the fracture type, the peak fracture width distribution ranged from 2 to 7 μm, with a minimum fracture width of 1.94 μm, maximum fracture width of 16.21 μm, and an average fracture width of 6.23 μm, subsequently named Type C. In the fracture-pore type model, the average hole size was 121 μm, subsequently named Type D (Figure 3A–D).
The pore structure and wettability test data of the Ahdab Oilfield in the study area primarily originate from the author’s previous analysis and testing results, as detailed in references Wang (2019) and Wang et al. (2020b). The Kh2-1 and Kh2-3 sublayers of the Ahdab Oilfield are dominated by sandstone limestone and bioclastic algal mudstone limestone, with primary pores dominated by (residual) intergranular pores, biological pores, and biological framework pores. Secondary pore types are dominated by biological mould pores, intergranular (intraclast) dissolved pores, and intercrystalline (dissolved) pores. For the mould pore model, the average pore diameter was 41 μm, with an average throat radius of 1.7 μm, resulting in a throat/pore diameter ratio of 0.042, subsequently named Type E. Similarly, for the visceral foramen model, the average pore diameter was 41 μm, with an average throat radius of 1.84 μm, resulting in a throat/pore diameter ratio of 0.045, subsequently named Type F. For the intergranular pore model, the average pore diameter was 29 μm, with an average throat radius of 3.8 μm, resulting in a throat/pore diameter ratio of 0.132, subsequently named Type G. Lastly, for the intergranular dissolution pore model, the average pore diameter was 70 μm, with an average throat radius of 2.6 μm, resulting in a throat/pore diameter ratio of 0.038, subsequently named Type H (Figure 3E–H).
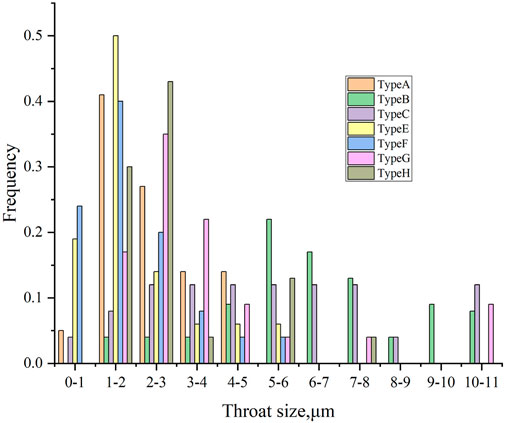
Figure 3. Distribution of throat sizes in typical pore structure models.
4 Results and discussion
4.1 Distribution of remaining oil and its formation mechanism
Figure 4 presents the distribution of remaining oil at different displacement moments, where white represents rock particles, red represents the oil phase, and blue represents the water phase. Initially, when water is injected, the interface advances relatively uniformly. Subsequently, the water entering from each inlet rapidly flows outward in search of exit channels. Once an exit channel is found in any direction, a continuous flow forms in that direction, overcoming the frictional resistance of the oil phase. Water in other directions might undergo backflow and then enter the established flow channels, leading to convergence. Additionally, when water passes through the throats, capillary valve effects and capillary fingering effects occur. At the entrance of a throat, capillary force acts as a resistance, making it difficult for water to pass and even resulting in Jamin effect; when water passes through the throat, capillary force acts as a driving force. The displacement pressure difference and strong capillary dynamics facilitate flow, overcoming the inhibitory effect of viscous resistance, allowing water to pass quickly and be easily segmented into discrete droplets. In most simulations in this study, the rock matrix is assumed to be oil-wet; therefore, the wetting phase easily forms film flow on the wall, and the oil film on the throat wall interrupts the water phase.

Figure 4. Typical types of residual oil (red represents oil phase, blue represents water phase).
Ultimately, six types of remaining oil distributions are observed. The distribution patterns of remaining oil can be categorized into dead-end remaining oil, pressure balance remaining oil, wall-bound remaining oil, Jamin effect remaining oil, water-encapsulating remaining oil, and remaining oil in the direction perpendicular to displacement. Their proportions and scales are controlled by the micro-pore structure, wettability, and dominant channels.
The formation of dead-end remaining oil is mainly due to the lack of expulsion channels for the oil phase, and its distribution depends on the pore structure, being relatively dispersed (Figure 4A). In oil-wet conditions, dead-end remaining oil primarily results from the inability of the water phase to enter; in water-wet conditions, under the action of capillary forces, the water phase invades along the walls into the dead ends, separating the oil phase in the dead ends. Thus, in oil-wet conditions, there are basically no effective methods to enhance recovery of dead-end remaining oil; in water-wet conditions, reducing the displacement speed allows the water phase to infiltrate into the dead ends under the action of capillary forces, gradually expelling the oil phase within the dead ends.
Pressure balance remaining oil refers to the scenario during the displacement process where the pressure at both ends of the pore throats is equal, failing to establish a positive pressure differential, resulting in the oil phase within the pore throats being unable to be effectively expelled due to a lack of driving force (Figure 4B). Similarly, there is residual oil in the direction perpendicular to displacement, where the pressure gradient across the pore throats is also minimal, and due to the velocity direction of the water phase being perpendicular to the direction of the pore throats during displacement, it is difficult for the water phase to enter these pore throats and displace the oil phase.
Wall-bound residual oil refers to the condition in an oil-wetting state where the oil phase on the surfaces of pore throats experiences significant capillary resistance (Figure 4C). In situations of low displacement velocity, the driving force is insufficient to overcome the wall capillary resistance, resulting in a thin layer of oil phase remaining on the surfaces.
The Jamin effect residual oil refers to a condition in an oil-wetting state where the volume of oil droplets is large, and when passing through finer throats, they encounter significant capillary resistance (Figure 4D). Despite repeated deformation, the oil droplets are unable to pass through and return to the previous pore space, forming isolated oil droplets.
Water-encapsulated residual oil refers to the phenomenon during the displacement process in complex porous media where, due to the uneven velocity within the water phase, after some of the water phase passes through the throats, the remaining oil phase in the pores is squeezed out and rapidly occupies the position previously held by the water phase, resulting in the formation of isolated water droplets and the occurrence of the water encapsulation phenomenon (Figure 4E).
The residual vuggy oil refers to a scenario where the vugs are relatively large, facilitating rapid advancement of the water phase through the central region of the vug, creating preferential pathways. Consequently, due to the influence of surface tension, a significant amount of residual oil gets trapped on the vug walls, making it challenging to displace (Figure 4F).
4.2 Microscopic oil displacement efficiency change mechanism
In this paper, a constant flow rate displacement is set, thus the water flooding efficiency is divided into three stages. The first stage is the linear growth phase before the water phase reaches the outlet; the second stage occurs when the water phase has reached the outlet, but the oil phase in the model has not yet equilibrated; the third stage is the equilibrium phase, where the displacement efficiency no longer changes, and the crude oil remaining in the pores can no longer be displaced. In the simulation process, the length and slope of the first stage are related to the flow rate, while the occurrence of the second and third stages is related to the number of dominant percolation channels. With only one dominant percolation channel, there appears to be one plateau; when there are multiple dominant percolation channels, there are multiple plateaus. The reason for the plateau in stage3 is due to the water phase reaching the outlet and the formation of dominant migration channels, at which point the water phase on other paths recirculates to the dominant migration channels. In this large pore and coarse throat model, when the wettability is oil-wet and the CA is 30°, the final displacement efficiency is close to 37%, with most of the crude oil far from the dominant percolation channels remaining untouched (Figure 5).
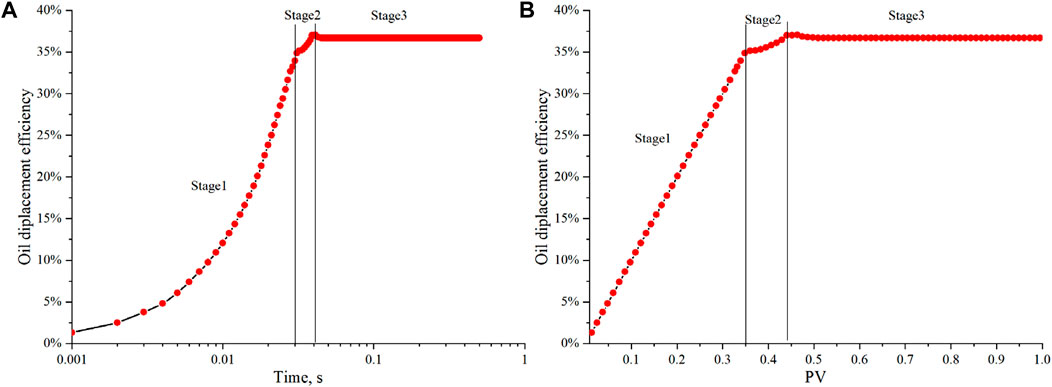
Figure 5. Microscopic displacement process with time and pore volume (PV).
4.3 Microscopic oil displacement efficiency influencing factors
(1) Influence of Throat Size
Figure 6 shows the oil-water distribution and microscopic oil removal efficiency changes under different throat sizes, where red, blue, and white represent the oil phase, water phase, and rock matrix, respectively. The transition zone between red and blue is the oil-water interface. It can be observed that when the pore structure consists of large pores and coarse throats, at a timestep of 0.02 s, water enters from each inlet, with three injection points at the upper inlet converging into one flow channel, and the two injection points at the lower part gradually converging and branching. Then, the water phase begins to seek the path of least resistance, where the front end of the water phase shows finger-like features, even developing branches perpendicular to the direction of injection velocity. At a timestep of 0.04 s, the first batch of water has reached the outlet, and a dominant flow channel has been formed. The pressure gradient in other flow channels decreases, and the early branching water seeking paths gradually retract back to the flow channel, with some of the water that did not retract in time forming isolated droplets. Overall, in a water-wet state, besides the dominant flow channel, it is difficult to mobilize the oil phase in other locations, with the main types of remaining oil being pressure equilibrium residual oil, followed by dead-end residual oil and water-encapsulating residual oil.
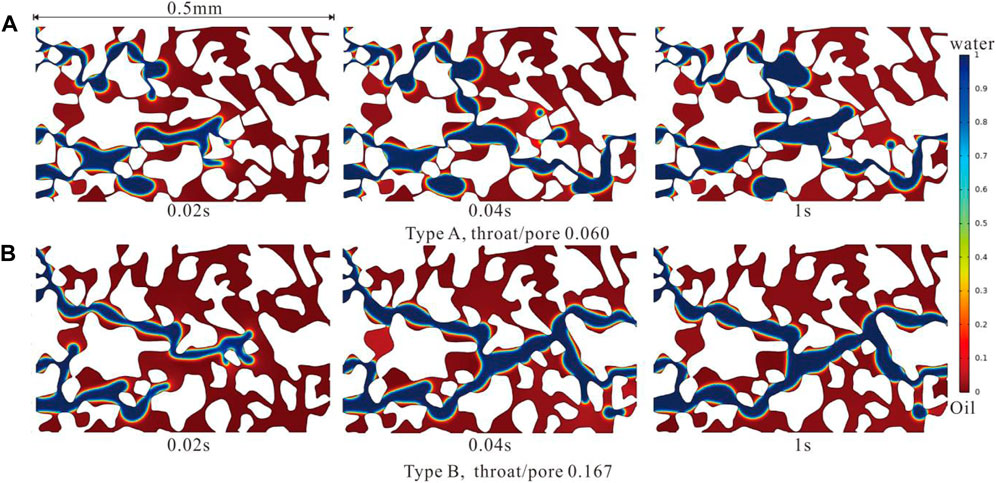
Figure 6. Distribution of residual oil under different throat size (injection velocity 0.01 m/s, CA150°).
When the pore structure consists of large pores and fine throats, the water phase migration behaves similarly to that in structures with large pores and coarse throats, exhibiting characteristics such as bifurcation, convergence, and contraction of the water phase front. However, overall, the water phase migration path becomes more tortuous and complex, leading to potentially more throats being affected. Nevertheless, due to the smaller size of the throats, capillary resistance increases, necessitating higher breakthrough pressures. In a time step of 0.5 s, the majority of the crude oil remains unused, with the predominant type of remaining oil being pressure equilibrium residual oil, followed by dead-end residual oil, pore residual oil, and water-encapsulated residual oil (Figure 7).
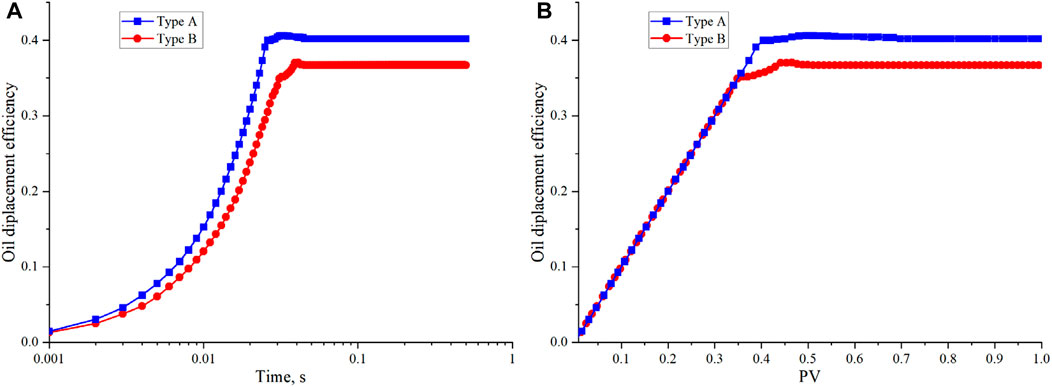
Figure 7. Microscopic oil displacement efficiency under different throat size.
Comparing the microscopic displacement efficiency of structures with large pores and coarse throats, it is observed that the overall shape of the curves is similar and can be divided into three stages. The quantities in stage 2 and stage 3 are the same because ultimately only one dominant migration pathway exists. Despite the finer throats in structures with large pores and fine throats and the more tortuous water phase displacement routes, they reach the outlet earlier than structures with large pores and coarse throats. From the perspective of final oil displacement efficiency, the oil displacement efficiency for structures with large pores and coarse throats is 37%, while for structures with large pores and fine throats, it is 40%. This implies that smaller pore/throat sizes lead to higher oil displacement efficiency, contrary to traditional understanding. This discrepancy may be related to the results of the constant injection velocity displacement discussed in this study. The constant injection velocity leads to the generation of pressure building, resulting in higher pressure differentials within Type B. This will be further discussed in subsequent analyses.
(2) Influence of Wettability
As indicated in section 4.3.1, the efficiency of oil displacement depends on whether the oil-water interface advances uniformly. The movement of the oil-water interface is influenced by various forces, including inertia, displacement pressure, capillary force, wet phase viscosity, non-wet phase viscosity, gravity, and inlet effects. For oil-water flow in porous media, inertia and gravity effects can be neglected at low Reynolds numbers. Assuming the case of a single capillary as a straight cylindrical shape, the capillary force below the single capillary can be derived from the Laplace-Young equation:
Therefore, in the hydrophilic state (CA 0°–90°), the capillary force is positive, manifesting as driving force; whereas, when wetting transitions to hydrophobic (CA 90°–180°), the capillary force becomes negative, representing resistance. Capillary force acts as the driving force in water-wet media, while in neutrally wet or oil-wet media, it presents resistance due to dynamic contact angle. Therefore, water-wet media exhibit higher final oil recovery efficiency, and the microscopic oil displacement efficiency in neutrally wet or oil-wet media is more sensitive to water phase breakthrough.
Figure 8 shows the distribution of remaining oil as the wettability gradually changes from strongly oil-wet to strongly water-wet in the large-pore fine-throat model under an injection velocity of 0.01 m/s. Comparing Figure 6 and Figure 8, it can be observed that when the system is strongly oil-wet, the main driving force for displacement is the displacement pressure differential. The water phase tends to spread along the dominant migration pathway, and the remaining oil mainly consists of pressure equilibrium residual oil, with the majority of the remaining oil in the pores unused. When the system exhibits weak oil-wettability, the displacement pressure remains the primary driving force, but the capillary resistance decreases significantly. Consequently, the area covered by the water phase increases substantially, and the remaining oil mainly consists of pressure equilibrium and dead-end types. When the system reaches a neutral wettability state, the capillary resistance further diminishes, leading to a slight increase in the area covered by the water phase, with the remaining oil predominantly comprising pressure equilibrium and dead-end types. In the water-wet state, the main driving forces are displacement pressure and capillary force, resulting in a larger area covered by the water phase, with dead-end residual oil being the primary type of remaining oil.
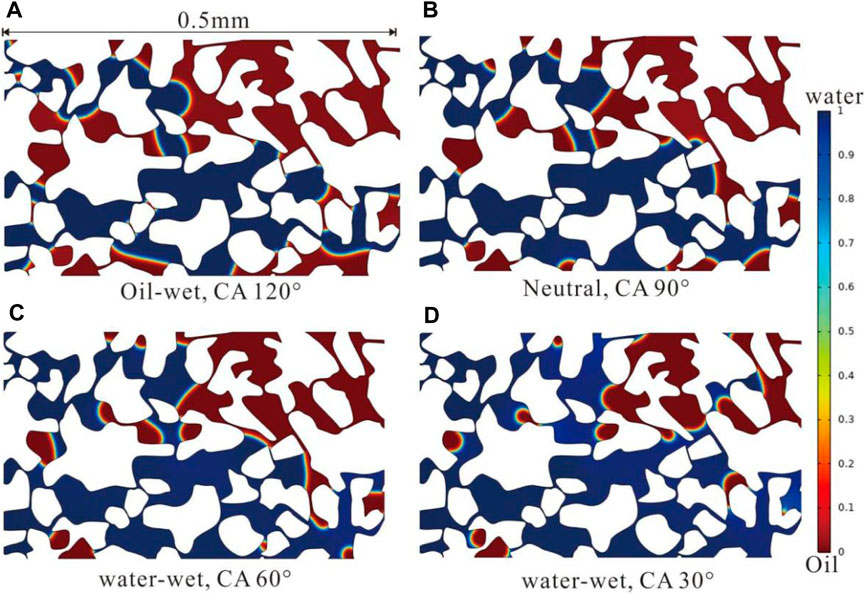
Figure 8. Oil water distribution under different wettability conditions (Type A, injection velocity 0.01 m/s).
From the perspective of oil recovery efficiency, due to capillary force being the driving force in water-wet media, the ultimate oil recovery efficiency is higher in water-wet media. In an oil-wet reservoir with CA 150°, the final oil recovery efficiency is 40%, while in a water-wet reservoir with CA 30°, the final oil recovery efficiency is 75%. Regarding the change in curves, the shape of the curve in Stage 1 remains consistent, and the time taken for the water phase to reach the outlet is essentially the same. However, there is a significant difference in the shape of Stage 2. In strongly oil-wet reservoirs, Stage 2 appears as a single step, and due to water phase refluxing to the dominant migration pathway, there is a noticeable drop between Stage 2 and Stage 3. As the reservoir transitions to water-wet conditions, Stage 2 exhibits distinct multiple slope characteristics, indicating the opening of new migration pathways connecting to the outlet during the displacement process (Figure 9).
(3) Influence of Injection Velocity
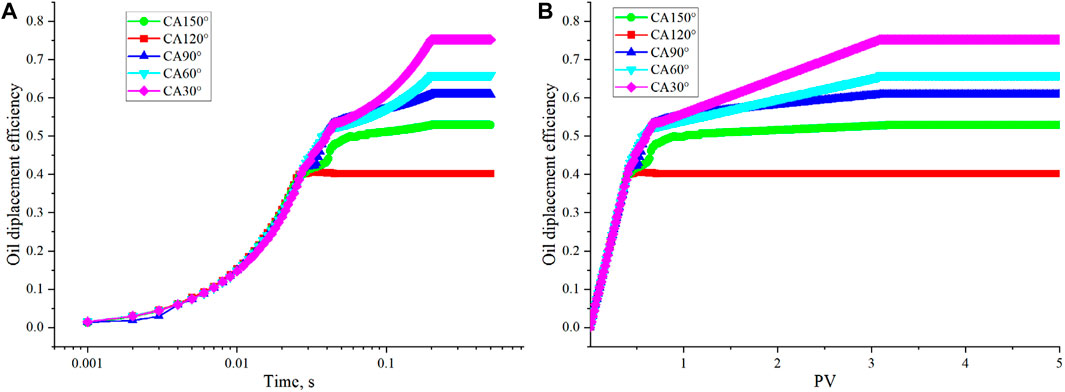
Figure 9. Microscopic oil displacement efficiency under different wettability conditions.
Under the strong displacement force conditions of water flooding, the displacement force is more significant than capillary force, and the viscosity in small pores is stronger. Therefore, the leading edge propagation velocity in large pores is greater than in small pores, thereby trapping oil in the small pores. Conversely, under hydrophilic conditions, in the weak displacement force conditions of water flooding, capillary force plays a more significant role, with clear capillary advancement, often showing faster advancement in small pores and slower advancement in large pores. However, in reservoirs with small throats, the associated viscous resistance is also stronger, even exceeding capillary force, so capillary advancement does not always occur. To achieve a more uniformly advancing water flooding interface, it is necessary to comprehensively analyze the evolution of water flooding oil based on the combined characteristics of capillary diameter, displacement rate, and wettability, thereby improving reservoir development efficiency.
However, under oil-wet conditions, capillary forces act as resistance. Therefore, when the displacement velocity increases, the displacement pressure can overcome capillary resistance and viscous resistance, potentially displacing the oil phase into more fine throats. Figure 10 illustrates the oil-water distribution under different displacement velocities. It can be observed that when the displacement velocity increases from 0.01 m/s to 0.02 m/s, the isolated water phase originally produced by backflow in the lower-left corner is broken through, adding a new migration pathway, but the overall difference is not significant. As the displacement velocity continues to increase to 0.05 m/s and 0.1 m/s, another migration pathway is added, and the water phase coverage area increases slightly, but the increase is not significant. Although the oil recovery efficiency increases, the predominant type of remaining oil remains pressure balance.
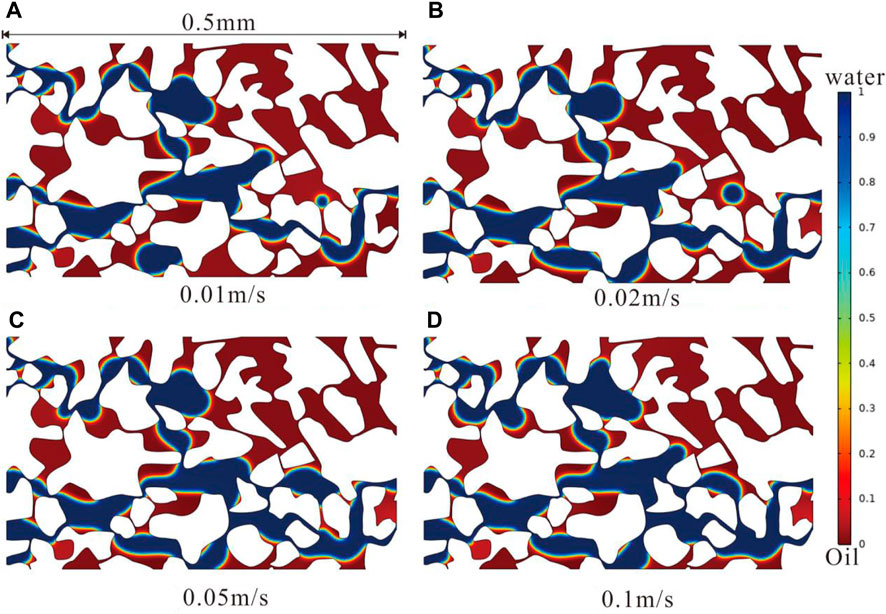
Figure 10. Oil water distribution under different displacement velocities (Type A, CA150°).
Figure 11 compares the microscopic oil displacement efficiency under different displacement velocities. It can be observed that under oil-wet conditions, as the displacement velocity increases, the water phase reaches the outlet earliest and the equilibrium section appears earliest. When the displacement velocity is 0.1 m/s, the characteristics of Stage 2 are not prominent. From the perspective of final oil recovery efficiency, as the displacement velocity increases, the final oil recovery efficiency increases. When the displacement velocity increases from 0.01 m/s to 0.1 m/s, the oil recovery efficiency increases from 40% to 55%. In other words, in oil-wet carbonate reservoirs, higher speed water flooding is more suitable.
(4) Characteristics of Water Flooding in Fractured and Fractured-Vuggy Reservoirs
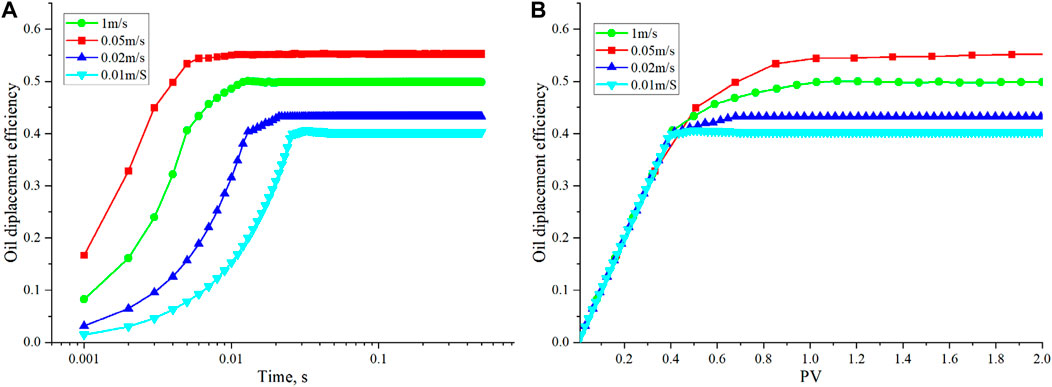
Figure 11. Oil displacement efficiency under different injection velocity.
Under strongly oil-wet conditions, although the fracture width distribution in fractured reservoirs is relatively uniform compared to pore-type reservoirs, the water phase still moves rapidly along the main fracture towards the outlet. The water in the upper fractures advances approximately 0.2 mm forward before the water phase reaches the outlet, but as the dominant migration pathway through the lower main fracture is established, the water phase in the upper fractures communicates through the vertical fractures and no longer advances forward. In fractured-vuggy reservoirs, the overall migration pathway is similar to that in fractured reservoirs, but most of the oil in the pores on the dominant migration pathway is displaced, and the oil away from the dominant migration pathway cannot be mobilized (Figure 12).
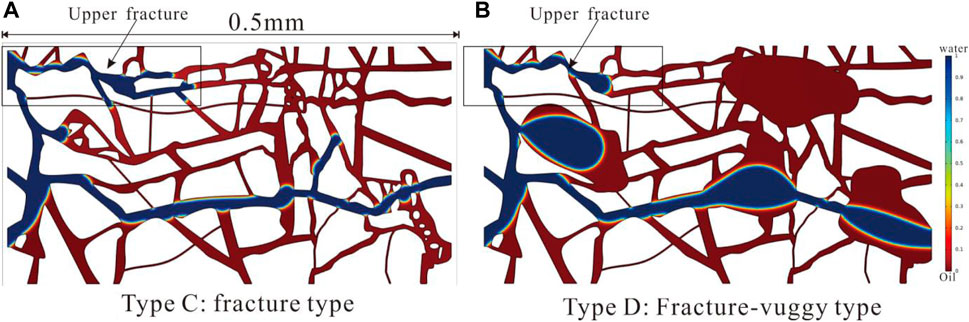
Figure 12. Oil and water distribution in fractured and fracture-vuggy reservoirs (injection velocity 0.01 m/s, CA150°).
From a microscopic perspective, the oil displacement efficiency of fractured-pore reservoirs (33%) is slightly higher than that of fractured reservoirs (30%). Comparing with pore-type reservoirs, it is found that the presence of Stage 2 is almost indistinguishable in fractured and fractured-pore reservoirs. This is because the capillaries in fractured reservoirs are relatively wide, resulting in lower capillary resistance and the absence of backflow situations (Figure 13). The early high oil displacement efficiency in fractured reservoirs may not result from involving a larger pore space but could be related to the pore space area. Fracture-pore type reservoirs have larger pore area, potentially leading to a relatively smaller oil displacement efficiency ratio, with a larger area occupied by the water phase.
(5) Influence of Pore structure

Figure 13. Microscopic oil displacement efficiency in fractured and fracture-vuggy reservoirs.
The pore structures within the study area reservoirs are significantly more complex than those described in the previous model. These reservoirs typically include cast mould pores (Type E), visceral foramen (Type F), primary intergranular pores (Type G), and intergranular dissolution pores (Type H), each exhibiting substantial differences in pore structure and consequent oil displacement efficiency.
Firstly, under constant velocity boundary conditions (0.05 m/s) and CA 90°, the water displacement efficiency of different pore structures is compared. In mould pores, most of the oil phase remains unrecovered, especially those distant from dominant migration pathways, with remaining oil primarily of the pressure equilibrium type. In visceral foramen, most remaining oil is concentrated within biological pore, with significant residual oil in almost every large pore, resulting in relatively higher overall displacement efficiency, primarily pressure equilibrium residual oil. In primary intergranular pores, there is minimal remaining oil, as most crude oil is effectively displaced, which is attributed to their homogeneity, with remaining oil mainly comprising pressure equilibrium and dead-end residual oil. In intergranular dissolution pores, remaining oil is also minimal, with most crude oil effectively displaced and primarily concentrated within dissolution pores, mainly comprising pressure equilibrium residual oil (Figure 14).
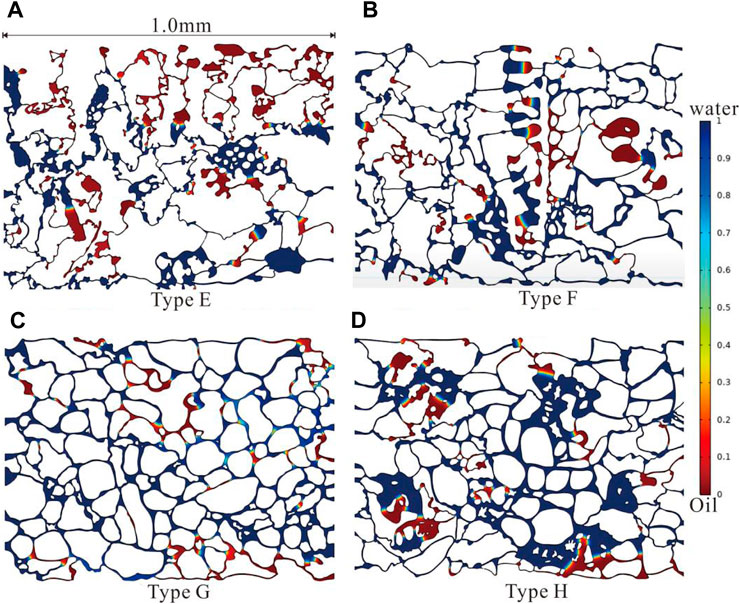
Figure 14. Oil and water distribution in complex pore structure (injection velocity 0.05 m/s, CA90°).
Contrary to traditional beliefs, smaller throat/pore sizes exhibit higher oil displacement efficiency, possibly influenced by the results of constant flow displacement, which generates backpressure. Therefore, this paper discusses the pressure drop conditions under constant velocity displacement in different types of pore structures (Figure 15; Figure 16). It is evident that while each pore structure type exhibits driving capabilities, mould pores demonstrate a backpressure reaching 12 MPa, increasing to 70 MPa under oleophilic conditions (CA120°), rendering displacement impractical for actual reservoir water flooding processes, especially when CA reaches 150°, making displacement impossible. In visceral foramen, as fluid exits, pressure differentials reach 1.6 MPa, increasing nearly tenfold when wetting transitions from neutral to strongly oleophilic. However, in primary intergranular pores and intergranular dissolution pores, pressure drops remain below 0.1 MPa under CA90°, increasing to only 0.5 MPa under strongly oleophilic conditions (CA30°).
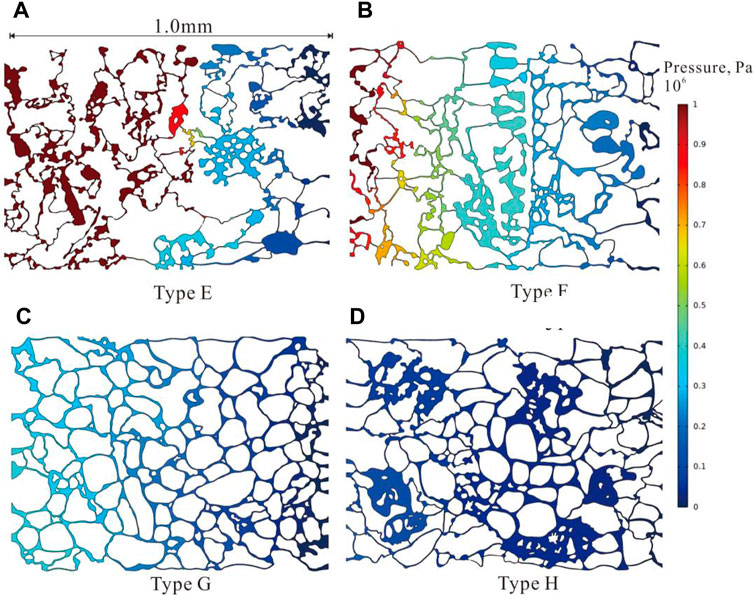
Figure 15. Pressure building in complex pore structure (injection velocity 0.05 m/s, CA90°).
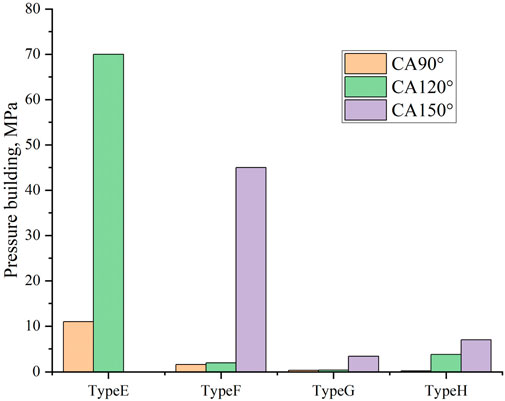
Figure 16. Pressure building in complex pore structure at different CA (injection velocity 0.05 m/s).
Next, the injection condition is altered to constant pressure displacement (0.2 MPa). It can be observed that under neutral conditions, crude oil in mould pores remains completely immobile, with capillary resistance far exceeding the displacement pressure. In visceral foramen, most crude oil within biological pores remains stagnant, with the aqueous phase only infiltrating along dominant pathways. In primary intergranular pores, there is minimal remaining oil, as most crude oil is effectively displaced, primarily comprising pressure equilibrium residual oil. In intergranular dissolution pores, the water displacement situation is inferior to that of intergranular pores, with significant residual oil remaining within numerous dissolution pores, primarily comprising pressure equilibrium residual oil (Figure 17).
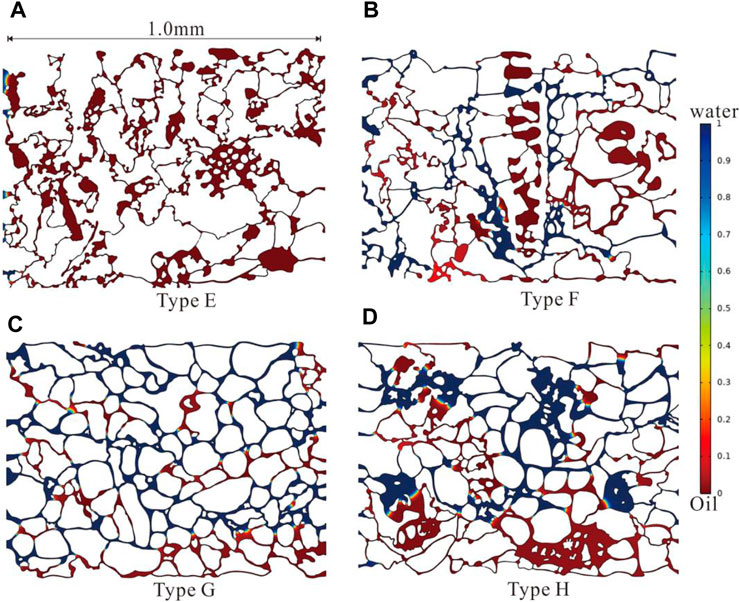
Figure 17. Oil and water distribution in complex pore structure (pressure 0.2 MPa, CA90°).
Finally, a comprehensive comparison was made between the oil displacement efficiency of different types of pore structures under constant velocity displacement and constant pressure displacement. From the perspective of actual reservoir displacement efficiency, intergranular pores > intergranular dissolved pores > visceral foramen > mould pore, with this trend being more pronounced under oleophilic wetting conditions (Figure 18).
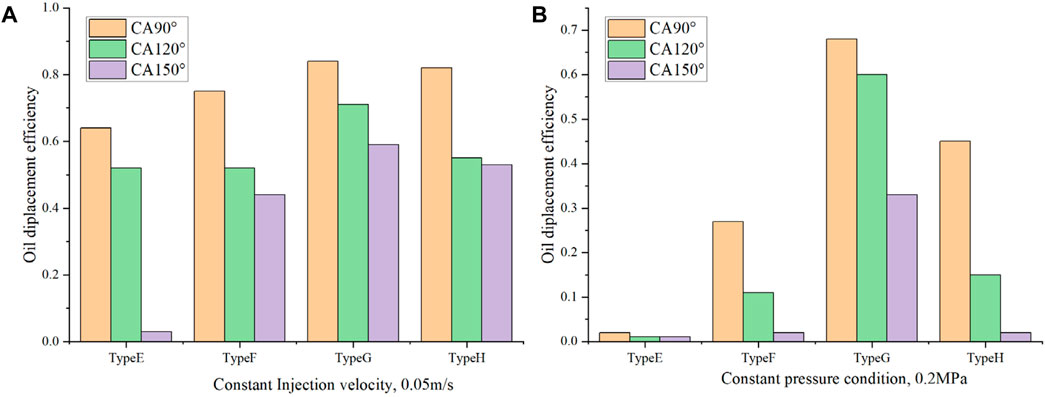
Figure 18. Oil displacement efficiency in complex pore structure at different CA and boundary condition.
5 Conclusion
This study, from the perspective of numerical simulation of pore-scale, utilizes the phase field method to investigate the characteristics of water flooding in complex carbonate reservoirs and explores the main controlling factors determining microscopic oil recovery efficiency. The following conclusions are drawn:
1. The distribution pattern of remaining oil can be categorized into dead-end residual oil, pressure balance residual oil, wall-bound residual oil, Jamin effect residual oil, and water-enveloped residual oil, with their proportions and scales jointly controlled by microscopic pore structures, wettability, and dominant pathways.
3. The most critical factor affecting oil recovery efficiency is wettability. Due to capillary force being the driving force in water-wet media, the final oil recovery efficiency is greater in water-wet media. When the contact angle in oil-wet reservoirs is 30°, the final oil recovery efficiency is 40%, while in water-wet reservoirs, it is 75%.
4. Under oil-wet conditions, capillary forces act as resistance. Therefore, as the displacement velocity increases, the displacement pressure can overcome capillary resistance and viscous resistance, potentially allowing water phase to enter more fine throats for displacing oil phase. In oil-wet carbonate reservoirs, higher injection water flooding is more suitable.
5. In fractured and fracture-vuggy reservoirs, compared to pore-type reservoirs, although the fracture widths are relatively wider than throats, the oil recovery efficiency is lower. The water phase mainly spreads along the main fractures, with poor mobilization of oil phase in other areas.
5. From the perspective of actual reservoir displacement efficiency, intergranular pores > intergranular dissolved pores > visceral foramen > mould pore, with this trend being more pronounced under oleophilic wetting conditions.
Data availability statement
The original contributions presented in the study are included in the article/Supplementary Material, further inquiries can be directed to the corresponding author.
Author contributions
HT: Conceptualization, Data curation, Formal Analysis, Funding acquisition, Writing–original draft, CJ: Data curation, Formal Analysis, Methodology, Project administration, Writing–review and editing. HL: Conceptualization, Data curation, Investigation, Methodology, Writing–review and editing. YD: Data curation, Methodology, Validation, Writing–review and editing. BZ: Supervision, Validation, Visualization, Writing–review and editing.
Funding
The author(s) declare that financial support was received for the research, authorship, and/or publication of this article. This work is supported by the National Natural Science Foundation of China (No. 51674211; No. 41502126); Major Program of National Natural Science Foundation of China (51534006). Supported By Open Fund (2022–19) of State Key Laboratory of Oil and Gas Reservoir Geology and Exploitation Southwest Petroleum University.
Conflict of interest
Author YD was employed by Chengdu Northern Petroleum Exploration and Development Technology Co. Ltd.
Author BZ was employed by Jianghan Oilfield.
The remaining authors declare that the research was conducted in the absence of any commercial or financial relationships that could be construed as a potential conflict of interest.
Publisher’s note
All claims expressed in this article are solely those of the authors and do not necessarily represent those of their affiliated organizations, or those of the publisher, the editors and the reviewers. Any product that may be evaluated in this article, or claim that may be made by its manufacturer, is not guaranteed or endorsed by the publisher.
References
Baiyu, Z., Hongming, T., Senlin, Y., Gongyang, C., Feng, Z., and Ling, L. (2022). Experimental and numerical investigations of particle plugging in fracture-vuggy reservoir: a case study. J. Petroleum Sci. Eng. 208, 109610. doi:10.1016/j.petrol.2021.109610
Bisweswar, G., Al-Hamairi, A., and Jin, S. (2020). Carbonated water injection: an efficient EOR approach. A review of fundamentals and prospects. J. Petroleum Explor. Prod. Technol. 10, 673–685. doi:10.1007/s13202-019-0738-2
Cheng, Z., Meng, Q., Zhao, J., Gao, H., and Dou, L. (2023). Editorial: mechanisms and applications of chemical techniques for effective development of unconventional reservoirs. Front. Earth Sci. 11, 1142032. doi:10.3389/feart.2023.1142032
Dordzie, G., and Dejam, M. (2021). Enhanced oil recovery from fractured carbonate reservoirs using nanoparticles with low salinity water and surfactant: a review on experimental and simulation studies. Adv. Colloid Interface Sci. 293, 102449. doi:10.1016/j.cis.2021.102449
Dou, H., Zhang, H., and Shen, S. (2019). Correct understanding and application of water flooding characteristic curve. Petroleum Explor. Dev. 46 (4), 755–762. doi:10.1016/S1876-3804(19)60237-5
Guo, C., Li, H., Tao, Y., Lang, L. y., and Niu, Z. x. (2020). Water invasion and remaining gas distribution in carbonate gas reservoirs using core displacement and NMR. J. Central South Univ. 27 (2), 531–541. doi:10.1007/s11771-020-4314-1
Haghighi, A. N., Nabipour, M., Azdarpour, A., and Honarvar, B. (2022). Mechanistic investigation of using optimum saline water in carbonate reservoirs low asphaltenic crude oil with high resin content: a carbonate-coated microfluidic study. J. Mol. Liq. 368, 120806. doi:10.1016/j.molliq.2022.120806
Hao, J., Mohammadkhani, S., Shahverdi, H., Esfahany, M. N., and Shapiro, A. (2019). Mechanisms of smart waterflooding in carbonate oil reservoirs-A review. J. Petroleum Sci. Eng. 179, 276–291. doi:10.1016/j.petrol.2019.04.049
Jia, P., Guo, H., Wang, Y., Peng, C., Cheng, L., and Ke, X. (2022). COMSOL-based investigation of the characteristics of microscopic water flooding and residual oil distribution in carbonate reservoirs. Front. Earth Sci. 10, 1016941. doi:10.3389/feart.2022.1016941
Karadimitriou, N. K., Joekar-Niasar, V., Hassanizadeh, S. M., Kleingeld, P. J., and Pyrak-Nolte, L. J. (2012). A novel deep reactive ion etched (DRIE) glass micro-model for two-phase flow experiments. Lab. Chip 12 (18), 3413–3418. doi:10.1039/c2lc40530j
Karadimitriou, N. K., Musterd, M., Kleingeld, P., Kreutzer, M. T., Hassanizadeh, S. M., and Joekar-Niasar, V. (2013). Onthe fabrication of PDMS micromodels by rapid prototyping, and their use in two-phase flow studies. Water Recourse. Res. 49 (4), 2056–2067. doi:10.1002/wrcr.20196
Kunz, P., Zarikos, I. M., Karadimitriou, N. K., Huber, M., Nieken, U., and Hassanizadeh, S. M. (2016). Study of multi-phase flow in porous media: comparison of SPH simulations with micro-model experiments. Transp. Porous Media 114 (2), 581–600. doi:10.1007/s11242-015-0599-1
Lee, Y., Kim, S., Wang, J., and Sung, W. (2020). Relationship between oil production and CO2 storage during low-salinity carbonate water injection in acid carbonate reservoirs. J. Industrial Eng. Chem. 88, 215–223. doi:10.1016/j.jiec.2020.04.016
Li, S., Feng, Q., Zhang, X., Yu, C., and Huang, Y. (2023). A new water flooding characteristic curve at ultra-high water cut stage. J. Petroleum Explor. Prod. Technol. 13 (1), 101–110. doi:10.1007/s13202-022-01538-6
Li, S., Liu, Y., Xue, L., Yang, L., Yuan, Z., and Jian, C. (2021). An investigation on water flooding performance and pattern of porous carbonate reservoirs with bottom water. J. Petroleum Sci. Eng. 200, 108353. doi:10.1016/j.petrol.2021.108353
Li, W., Chen, J., Tan, X., Liu, P., Li, Y., and Wang, L. (2018). Long-core experimental study of different displacement modes on fractured-vuggy carbonate reservoirs. Geosystem Eng. 21 (2), 61–72. doi:10.1080/12269328.2017.1360215
Lv, Q., Zheng, R., Zhou, T., Guo, X., Wang, W., Li, J., et al. (2022). Visualization study of CO2-EOR in carbonate reservoirs using 2.5 D heterogeneous micromodels for CCUS. Fuel 330, 125533. doi:10.1016/j.fuel.2022.125533
Mehraban, M. F., Rostami, P., Afzali, S., Ahmadi, Z., Sharifi, M., and Ayatollahi, S. (2020). Brine composition effect on the oil recovery in carbonate oil reservoirs: a comprehensive experimental and CFD simulation study. J. Petroleum Sci. Eng. 191, 107149. doi:10.1016/j.petrol.2020.107149
Mogensen, K., and Masalmeh, S. (2020). A review of EOR techniques for carbonate reservoirs in challenging geological settings. J. Petroleum Sci. Eng. 195, 107889. doi:10.1016/j.petrol.2020.107889
Mohammadi, M., and Mahani, H. (2020). Direct insights into the pore-scale mechanism of low-salinity waterflooding in carbonates using a novel calcite microfluidic chip. Fuel 260, 116374. doi:10.1016/j.fuel.2019.116374
Nandwani, S. K., Chakraborty, M., and Gupta, S. (2019). Chemical flooding with ionic liquid and nonionic surfactant mixture in artificially prepared carbonate cores: a diffusion controlled CFD simulation. J. Petroleum Sci. Eng. 173, 835–843. doi:10.1016/j.petrol.2018.10.083
Radwan, A. E., Trippetta, F., Kassem, A. A., and Kania, M. (2021). Multi-scale characterization of unconventional tight carbonate reservoir: insights from October oil filed, Gulf of Suez rift basin, Egypt. J. Petroleum Sci. Eng. 197, 107968. doi:10.1016/j.petrol.2020.107968
Sagbana, P. I., Sarkodie, K., and Nkrumah, W. A. (2022). A critical review of carbonate reservoir wettability modification during low salinity waterflooding. Petroleum 9, 317–330. doi:10.1016/j.petlm.2022.01.006
Selem, A. M., Agenet, N., Gao, Y., Raeini, A. Q., Blunt, M. J., and Bijeljic, B. (2021). Pore-scale imaging and analysis of low salinity waterflooding in a heterogeneous carbonate rock at reservoir conditions. Sci. Rep. 11 (1), 15063. doi:10.1038/s41598-021-94103-w
Snosy, M. F., Abu El Ela, M., El-Banbi, A., and Sayyouh, H. (2022). Comprehensive investigation of low salinity waterflooding in carbonate reservoirs. J. Petroleum Explor. Prod. Technol. 12, 701–724. doi:10.1007/s13202-021-01330-y
Song, W., de Haas, T. W., Fadaei, H., and Sinton, D. (2014). Chip-off-the-old-rock: the study of reservoir-relevant geological processes with real-rock micromodels. Lab a Chip 14 (22), 4382–4390. doi:10.1039/c4lc00608a
Tawfik, M. S., Karpyn, Z., and Johns, R. (2019). Multiscale study of chemically-tuned waterflooding in carbonate rocks using micro-computed tomography. IOR 2019–20th Eur. Symposium Improv. Oil Recovery. Eur. Assoc. Geoscientists Eng. 2019 (1), 1–23. doi:10.3997/2214-4609.201900074
Tetteh, J. T., Brady, P. V., and Ghahfarokhi, R. B. (2020). Review of low salinity waterflooding in carbonate rocks: mechanisms, investigation techniques, and future directions. Adv. Colloid Interface Sci. 284, 102253. doi:10.1016/j.cis.2020.102253
Wang, J., Song, H., and Wang, Y. (2020a). Investigation on the micro-flow mechanism of enhanced oil recovery by low-salinity water flooding in carbonate reservoir. Fuel 266, 117156. doi:10.1016/j.fuel.2020.117156
Wang, W., Chang, S., and Gizzatov, A. (2017). Toward reservoir-on-a-chip: fabricating reservoir micromodels by in situ growing calcium carbonate nanocrystals in microfluidic channels. ACS Appl. Mater. interfaces 9 (34), 29380–29386. doi:10.1021/acsami.7b10746
Wang, Y., Tang, H., Lu, H., and Weiming, Y. (2020b). A study on the pore structure of carbonate rocks and its effect on oil movability in the Kh2 Member of Upper Cretaceous Khasib Formation in X oilfield. Iraq, Geol. Rev. 66 (5), 1412–1430. (in Chinese). doi:10.16509/j.georeview.2020.05.023
Wang, Y. (2019). Research on the reservoir pore structure and crude oil production law of ahdeb oilfield in Iraq. Southwest Petroleum University Dissertation. (in Chinese).
Xu, Z. X., Li, S. Y., Li, B. F., Chen, D. Q., and Liu, Z. Y. (2020). A review of development methods and EOR technologies for carbonate reservoirs. Petroleum Sci. 17, 990–1013. doi:10.1007/s12182-020-00467-5
Yang, B., He, J., Lyu, D., Tang, H., Zhang, J., Li, X., et al. (2020). Production optimization for water flooding in fractured-vuggy carbonate reservoir–From laboratory physical model to reservoir operation. J. Petroleum Sci. Eng. 184, 106520. doi:10.1016/j.petrol.2019.106520
Yang, S., Yang, H., Peng, X., Lan, X., Yang, Y., Zhao, Y., et al. (2023). Research of influencing factors on permeability for carbonate rocks based on LBM simulation: a case study of low-permeability gas reservoir of Sinian Dengying Formation in Sichuan Basin. Front. Earth Sci. 11, 1091431. doi:10.3389/feart.2023.1091431
Yao, Y., Wei, M., and Kang, W. (2021). A review of wettability alteration using surfactants in carbonate reservoirs. Adv. Colloid Interface Sci. 294, 102477. doi:10.1016/j.cis.2021.102477
Zeng, L., Keshavarz, A., Xie, Q., and Iglauer, S. (2022). Hydrogen storage in Majiagou carbonate reservoir in China: geochemical modelling on carbonate dissolution and hydrogen loss. Int. J. Hydrogen Energy 47 (59), 24861–24870. doi:10.1016/j.ijhydene.2022.05.247
Zhang, G., Regaieg, M., Blunt, M. J., and Bijeljic, B. (2023). Primary drainage and waterflood capillary pressures and fluid displacement in a mixed-wet microporous reservoir carbonate. J. Hydrology 625, 130022. doi:10.1016/j.jhydrol.2023.130022
Zhiwen, D., Rujun, W., Fangfang, C., Yang, J., Zhu, Z., Yang, Z., et al. (2020). Origin, hydrocarbon accumulation and oil-gas enrichment of fault-karst carbonate reservoirs: a case study of Ordovician carbonate reservoirs in South Tahe area of Halahatang oilfield, Tarim Basin. Petroleum Explor. Dev. 47 (2), 306–317. doi:10.1016/s1876-3804(20)60048-9
Keywords: waterflooding, carbonate rocks, pore structure, oil-wet, numerical simulation
Citation: Tang H, Jia C, Lu H, Deng Y and Zhu B (2024) Numerical simulation of residual oil distribution characteristic of carbonate reservoir after water flooding. Front. Earth Sci. 12:1395483. doi: 10.3389/feart.2024.1395483
Received: 04 March 2024; Accepted: 18 June 2024;
Published: 09 July 2024.
Edited by:
Shuai Yin, Xi’an Shiyou University, ChinaReviewed by:
Chuanyao Zhong, University of Alberta, CanadaYue Shi, China University of Geosciences, China
Copyright © 2024 Tang, Jia, Lu, Deng and Zhu. This is an open-access article distributed under the terms of the Creative Commons Attribution License (CC BY). The use, distribution or reproduction in other forums is permitted, provided the original author(s) and the copyright owner(s) are credited and that the original publication in this journal is cited, in accordance with accepted academic practice. No use, distribution or reproduction is permitted which does not comply with these terms.
*Correspondence: Haoxuan Tang, MTA0NDA5MTEzMUBxcS5jb20=