
94% of researchers rate our articles as excellent or good
Learn more about the work of our research integrity team to safeguard the quality of each article we publish.
Find out more
ORIGINAL RESEARCH article
Front. Earth Sci., 10 April 2024
Sec. Geohazards and Georisks
Volume 12 - 2024 | https://doi.org/10.3389/feart.2024.1394439
This article is part of the Research TopicMonitoring, Early Warning and Mitigation of Natural and Engineered Slopes – Volume IVView all 30 articles
 Junqi Guo1
 Wenfei Xi1,2*
 Guangcai Huang3*
 Guangxiong He1,2,4,5,6Liangtao Shi4,5,6Zhengrong Yang1Zitian Ding1Lixia Wang1Ruihan Cao1
The Yuanmou dry-hot valley has been confirmed as a typical area subjected to severe soil erosion in southwestern China. The research on the soil erosion deformation exhibited by the dry-red soil that is extensively distributed in this region takes on critical significance in deepening the investigation of soil and water loss control efforts in the Yuanmou dry-hot valley. In this study, a time series of soil erosion deformation was established at different altitudinal gradients from March 2018 to October 2022 using Small Baseline Subset InSAR (SBAS-InSAR) technology to explore the deformation patterns exhibited by soil erosion in the dry-red soil of the Yuanmou dry-hot valley. Next, the time series of fractional vegetation cover (FVC) and monthly average rainfall in the identical period were analyzed comprehensively. The result of this study are presented as follows: 1) The dry-red soil regions in the Yuanmou dry-hot valley, which were observed in the line of sight (LOS) direction, attained the deformation rates ranging from −101.683 mm/yr to 30.57 mm/yr (Ascending),-79.658 mm/yr to 41.942 mm/yr (Descending). In general, areas with significant surface erosion were concentrated in the Longchuan River basin flowing through the north and south of Yuanmou County as well as in the river confluence zones. Uplifted areas have been more widely reported in the central and northern regions of Yuanmou (e.g., the Wudongde hydroelectric power station reservoir area). 2) A significant altitudinal gradient effect was exerted by soil erosion in the dry-red soil of the Yuanmou dry-hot valley. The valley-dam area and the medium and low mountain areas were subjected to the most severe soil erosion, and the maximum erosion reached over 80 mm. Erosion was mitigated in the low mountain areas around the dam and the medium and high mountain areas, and the maximum erosion reached 60 mm and 30 mm, respectively. At an altitude of 1,350 m, soil erosion in the dry-red soil was more significantly affected by rainfall. Nevertheless, at an altitude over 1,350 m, variations in FVC become the primary factor for soil erosion in the dry-red soil. The results of this study can scientifically support soil and water loss control efforts in the Yuanmou dry-hot valley.
Soil has been reported as a vital natural resource. Nearly 95% of the food worldwide originates from soil. Moreover, soil conserves at least a quarter of global biodiversity, offering ecosystems and humanity a wide variety of services (Rong et al., 2019; Borrelli et al., 2021; Pei et al., 2023). Soil erosion has been posing the most significant threat to soil, which results in soil loss or degradation. Consequently, shallower, less fertile, and infertile soil layers are triggered (Chen, Yang, et al., 2023), and even non-arable desertified areas have been formed (Vanwalleghem et al., 2017; Qiu et al., 2024). As revealed by existing research, changes in soil erosion are primarily driven by variations in rainfall and FVC. Under the variations in rainfall and vegetation cover, the process of soil erosion can either be slowed down or accelerated (Alatorre et al., 2012; Zhang et al., 2022; Zhao et al., 2022). However, under different altitude gradients, there are different types of vegetation distributed, and the vegetation coverage varies greatly, and the influence of precipitation and vegetation coverage on soil erosion is different. According to previous studies (Ou, 2017), the study area was divided into four different altitude gradients. Remote sensing was used to explore the response relationship between dry red soil erosion and precipitation and vegetation coverage under different altitude gradients in the dry hot valley of Yuanmo, and to distinguish the contribution degree of precipitation and vegetation coverage to dry red soil erosion under different altitude gradients in the dry hot valley of Yuanmo. It provides scientific basis for soil and water loss control and ecological restoration in Yuanmou dry-hot river Valley.
A total of three main categories of methods are capable of for monitoring surface deformation arising from erosion. The first category comprises conventional monitoring techniques (e.g., the use of precise leveling instruments and Global Navigation Satellite Systems (GNSS)). The above-mentioned methods are straightforward and offer high precision, whereas they are commonly limited by field conditions. Besides, these methods are time-consuming and may not conform to the requirements of large-scale surface deformation monitoring research (Zheng et al., 2018; Hu et al., 2019). The second category covers monitoring methods based on optical remote sensing imagery. Optical remote sensing is capable of capturing extensive surface information, and it is combined with a wide variety of machine learning algorithms for surface deformation monitoring (Ye et al., 2019). It has been extensively employed to identify geological hazards (e.g., landslides and debris flows) (Qiu et al., 2022; W. Yang et al., 2020), such that it serves as a crucial tool for Earth observations. Compared with conventional methods, optical remote sensing has overcome a range of drawbacks (e.g., low efficiency and hazardous working environments), whereas it can still be affected by weather conditions, especially in cloud-prone high-altitude regions. The third category involves InSAR-based ground monitoring techniques. The InSAR technology is characterized by its advantages of wide coverage, all-weather capabilities, and high accuracy (Liu et al., 2022), It has achieved widespread applications in a wide range of fields (e.g., landslide identification (Wang et al., 2022), mining subsidence monitoring (Z. Yang et al., 2020), urban deformation monitoring (Z. Zhang et al., 2018), glacier displacement tracking (Reinosch et al., 2021; Liu et al., 2024), and earthquake and volcano hazard monitoring (Wang et al., 2018). The time-series InSAR technology is capable of observing the identical area over extended time periods using repeat orbit passes. It identifies stable phase observations in interferograms, while it extracts deformation information after phase unwrapping. Notably, the SBAS-InSAR technology enhances coherence by combining multiple master images to constrain interferometric baseline, such that the millimeter-level monitoring accuracy can be attained (Yu et al., 2019; Ye et al., 2024). Moreover, since the launch of the SeaSat satellite carrying synthetic aperture radar by NASA in 1978, many countries have launched SAR satellites that exhibited different frequency bands for Earth observation (Born et al., 1979; Chen, Liang, et al., 2023). The above-described satellites with more scanning modes, shorter revisit cycles, and higher resolutions continuously provide more data support for radar interferometry’s theoretical and applied research. Furthermore, data sources have been enriched with the European Space Agency’s Sentinel-1A/B satellite radar data from the Copernicus program and the increasing availability of “cloud + edge” SAR data processing platforms (Bonì et al., 2020). This considerable data sources and a wide variety of processing methods highlight the unique advantages and significant potential application of the InSAR technology in monitoring surface deformation arising from erosion.
The Yuanmou dry-hot valley has been confirmed as a distinctive geographical unit in China’s southwestern mountainous region. It serves as a vital area for agricultural development for its high heat and ample sunlight (Duan et al., 2016). However, this region is also subjected to several challenges (e.g., extreme high temperatures, drought, uneven rainfall, low FVC, and fragile ecological environment). It is noteworthy that dry-red soil in the region, which is characterized by high clay content, poor soil structure, and weak water-holding capacity, displays a widespread distribution. As a result, the soil turns out to be highly susceptible to erosion. As a result, the Yuanmou dry-hot valley has become a typical area of severe soil and water loss in the southwestern mountainous region of China (Chen et al., 2015; Ding et al., 2017). Since 2010, local farmers in Yuanmou County have spontaneously organized the construction of flat ditches for orchard planting, integrating soil and water loss control, land development, and fruit garden establishment (Lin et al., 2020). The cultivated land area and land use benefits in Yuanmou County have been notably increased over the past decade. However, increasingly pronounced conflicts between human and environmental needs have been triggered with the growth of the local population, the advancement of flat ditch projects, and intensified human activities. This has led to reduced FVC, coupled with the unique climatic influences of the area, contributing to the escalating level of soil erosion in the Yuanmou dry-hot valley. In the 21st century, both national and local governments have enacted a wide variety of policies to promote soil and water loss control, consistently emphasizing its importance. Accordingly, conducting research on the correlation between soil erosion of dry-red soil at different altitudinal gradients and variations in rainfall and FVC in the Yuanmou dry-hot valley takes on critical significance in regional sustainable development and soil and water conservation efforts.
In brief, given the sophisticated relationship between soil erosion and variations in rainfall and FVC, this study primarily aimed at exploring the response relationship between soil erosion of dry-red soil and variations in rainfall and FVC at different altitudinal gradients in the Yuanmou dry-hot valley. First, the SBAS-InSAR technology was employed to develop the surface deformation information of dry-red soil at different altitudinal gradients in the Yuanmou dry-hot valley between March 2018 and October 2022. Subsequently, the time series of FVC in the identical period was determined on the Google Earth Engine (GEE) platform. Lastly, with the aim of distinguishing the contributions of rainfall and FVC to soil erosion of dry-red soil at different altitudinal gradients in the Yuanmou dry-hot valley, a comprehensive analysis was conducted by combining the dry-red soil deformation information, FVC, and rainfall data. The ultimate objective of this study was to lay a scientific basis for soil and water loss control and ecological restoration efforts in Yuanmou and even the entire dry-hot valley region.
In this study, the focus was placed on the Yuanmou dry-hot valley as the research area (Figure 1). The Yuanmou dry-hot valley is located in the Chuxiong Yi Autonomous Prefecture of Yunnan Province, China (25°25′–26°07′N, 101°35′–102°05′E), along the lower reaches of the Longchuan River, i.e., a major tributary of the Jinsha River (Deng et al., 2015). The valley covers a total area of approximately 2021.46 km2. The overall altitude ranges from 889 to 2,833 m, with a relative difference of 1,944 m. Due to the above-mentioned notable altitude difference, different landform types (e.g., river valleys, hills, and plateaus) have developed in the area (Ou et al., 2018). Moreover, landforms in the region displays a distinct vertical distribution, such that the entire Yuanmou dry-hot valley has been divided into four vertical zones (Table 1); (Li, 2021).
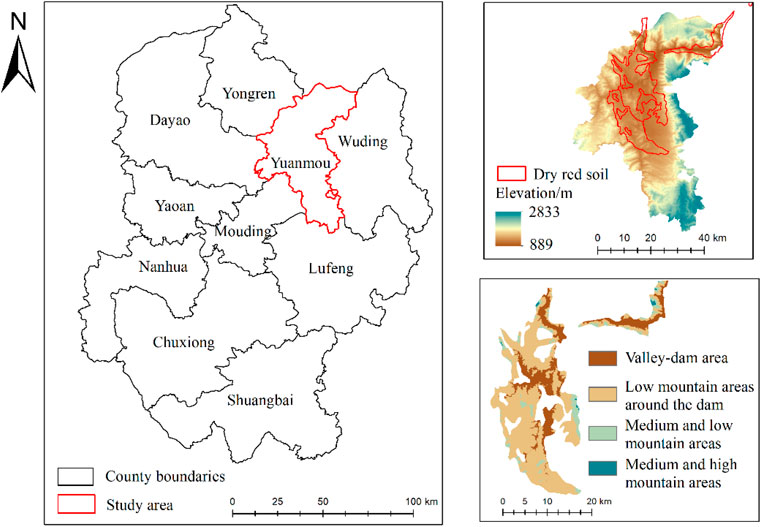
Figure 1. Location of the study area.

Table 1. Vertical area division of Yuanmou dry-hot valley.
The Yuanmou dry-hot valley is subjected to distinct wet and dry seasons, with an average annual temperature of 22°C and extreme temperatures reaching over 40°C. The average annual rainfall reaches 634 mm, with approximately 90% of rainfall occurring in the rainy season from May to October (B. Zhang et al., 2018). The average annual potential evapotranspiration is around 6 times the rainfall amount (Dong et al., 2013). The soils in the area have been classified into nine soil orders, 14 suborders, 25 great groups, as well as 51 soil species. The most prevalent among these divisions is dry-red soil with high clay content. To be specific, dry-red soil is typically red or reddish-orange in color, characterized by poor soil structure, weak water-holding capacity, low nutrient content. Furthermore, it is highly susceptible to erosion, leading to soil and water loss (Peng et al., 2013).
The natural vegetation in the Yuanmou dry-hot valley is primarily characterized by sparse shrubs and grasses, with a few shrubs and trees, which can be broadly divided into three layers (i.e., trees, shrubs, and grasses). The above-mentioned vegetation composition has adapted to the extreme natural conditions of the dry-hot valley in the long term. The plant communities in this area exhibit several traits (e.g., small stature, thorny surfaces, as well as well-developed root systems) (Du et al., 2022). The surface of the Yuanmou dry-hot valley is highly susceptible to erosion and damage since this valley region has the unique geographical environment and soil hydrological conditions, such that it is challenging to carry out ecological restoration in this region. As a result, the Yuanmou dry-hot valley has become a relatively typical area of severe soil and water loss in the upper reaches of the Yangtze River.
The main data employed in this study are elucidated in the following: ① C-band Sentinel-1A radar images downloaded freely from the European Space Agency (ESA). The above-mentioned images were in Interferometric Wide (IW) mode and Single Look Complex (SLC) format. The time span covered March 2018 to October 2022, with a swath width of 250 km. The polarization was VV, and the spatial resolution reached 5 m × 20 m. The above-described images were employed to determine the time series of surface deformation information regarding land erosion in the research area. They can be accessed online at https://search.asf.alaska.edu/#/. ② Sentinel-2 data: The Sentinel-2 satellite series comprised high-resolution multispectral imaging satellites equipped with the Multispectral Imager (MSI). The above-mentioned satellites flew at an altitude of 786 km, covering 13 spectral bands with a swath width of nearly 290 km. Level-2A products were adopted in this study, especially including the red, green, blue, and near-infrared bands, to determine the FVC in the research area. The above-described data can be accessed and downloaded from https://scihub.copernicus.eu/. ③ Precise Orbit Determination (POD) ephemeris data from the Copernicus Sentinels POD Data Hub to increase the satellite orbit accuracy, https://scihub.copernicus.eu/gnss/#/home. ④ 30-m resolution Digital Elevation Model (DEM) provided by JAXA ALOS WORLD 3D (https://www.eorc.jaxa.jp/ALOS/en/aw3d30/data/index.htm) to remove terrain phase effects from Sentinel-1A data processing. ⑤ Google Earth satellite images were utilized for high-resolution imagery comparison and analysis with InSAR results. The above-mentioned images can be accessed through http://www.google.cn/intl/zh-CN/earth/. ⑥ Monthly average rainfall data for Yuanmou County, which can be obtained from the China Meteorological Data Service Center: https://data.cma.cn/. Table 2 lists the detailed data descriptions.
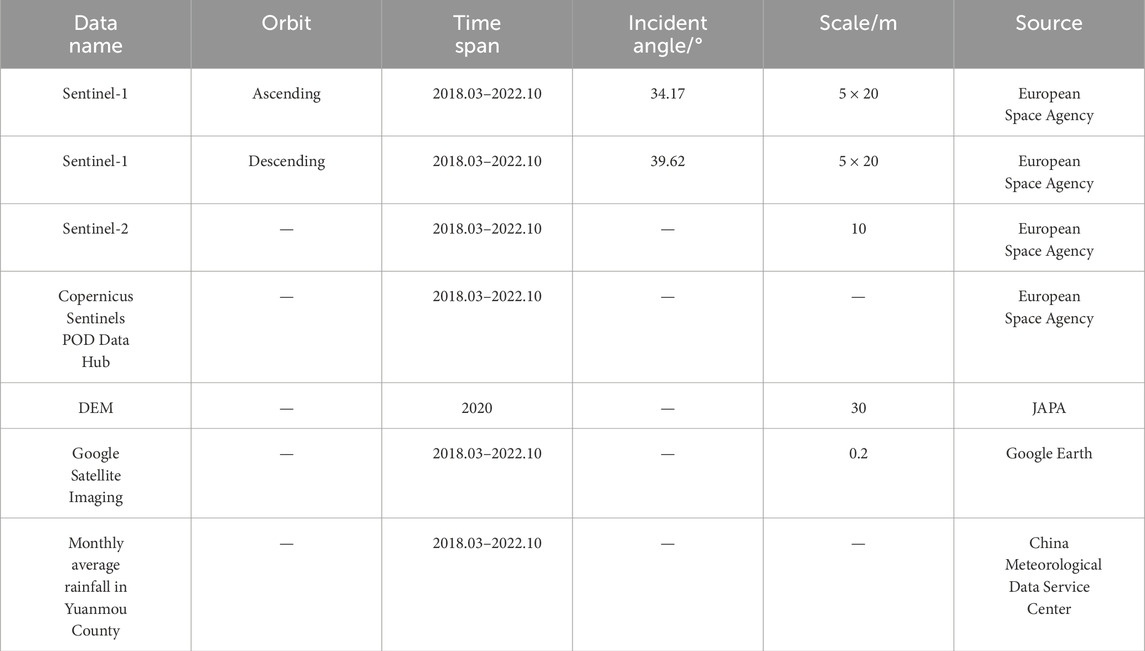
Table 2. Data introduction.
Figure 2 illustrates the overall technical method of this study. The primary technical processes are elucidated as follows: 1) Processing Sentinel-1A data using the SBAS-InSAR technology; 2) Calculating FVC on the Google Earth Engine (GEE) platform.
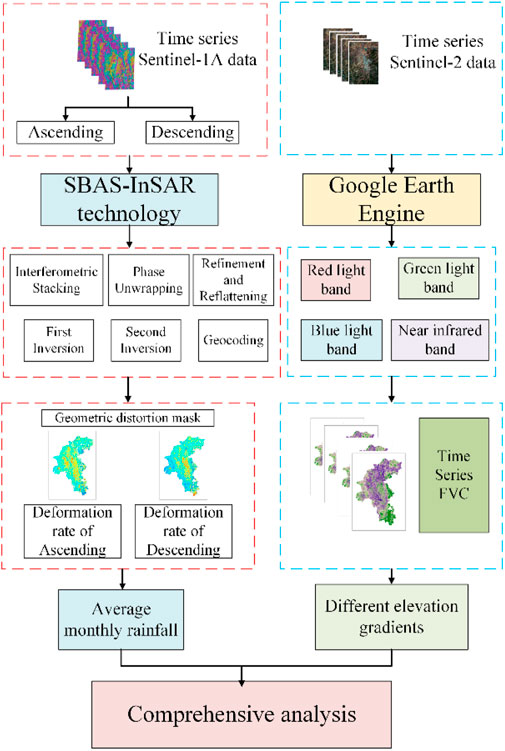
Figure 2. Technical roadmap.
The SBAS-InSAR technology, proposed by Berardino and Lanari based on differential InSAR, refers to a time-series InSAR method (Berardino et al., 2002; Ma et al., 2023). This technology is capable of reducing phase noise and errors by constraining multiple small baseline subsets based on time and spatial baseline thresholds, which can be adopted to retrieve surface deformation information from centimeters to millimeters. Compared with conventional D-InSAR technologies, the SBAS-InSAR technology exhibits a higher temporal sampling rate, which can be used to perform long-term time-series observations and extract non-linear ground deformation information (Chen et al., 2021). Compared with PS-InSAR technologies, the SBAS-InSAR technology is not required to consider temporal and spatial baselines or select master images, and it raises less rigorous requirements for the number of images (Osmanoğlu et al., 2016).
It is assumed that N+1 SAR images are acquired for the identical study area, one of these images was selected as the master image, and the others were co-registered to this master image. Under the combination conditions, a range of interferometric pairs M can be expressed as Eq. 1 (Tizzani et al., 2007):
For the
Where
With the aim of obtaining a settlement sequence with physical significance, the product of the average phase velocity and time between two acquisition times is defined as Eq. 3
The phase value of the j interferogram is defined as Eq. 4
The integral of the speed between the master and slave images in the respective time period is rewritten into an M×N as Eq. 5
Matrix B will be prone to rank defects since a multi main image strategy is applied in differential interferograms of SBAS-InSAR technology. Thus, singular value decomposition (SVD) can be adopted to develop the generalized inverse matrix of matrix B. On that basis, the minimum norm solution of the velocity vector can be yielded. Lastly, the shape variables of the respective time period can be derived (Cigna et al., 2021; Su et al., 2022) by integrating the velocity in each time period.
The SBAS-InSAR technology was employed to process Sentinel-1A data for ascending and descending orbits in the study area. First, the precise orbit determination ephemeris of the Copernican Sentinel-1A satellite was adopted to correct its orbital parameters, as an attempt to reduce the effect exerted by orbital errors on the interference phase. Subsequently, the maximum percentage of critical baseline and the maximum time baseline thresholds were set to 5% and 36days, respectively. The multi aspect ratio was set to 1:4, such that speckle noise can be effectively suppressed. Minimum Cost Flow unwrapping and Goldstein filtering were applied to interference workflow processing, the interference maps were generated, and pairs with unsatisfactory interference effects were eliminated. Moreover, deformation inversion was performed using the least squares method and the singular value decomposition method. Lastly, the radar line of sight (LOS) deformation information under the ascending and descending orbits in the research area was yielded after geocoding.
Since radar side imaging exhibits the inherent characteristics, imaging was recorded following the order of ground object reflection information in the distance direction, and even small variations in altitude can trigger considerable distortion. The above-described inducing factors comprised perspective shrinkage, overlap, and shadows (Dun et al., 2021; Guo et al., 2021), (Figure 3).

Figure 3. Geometric distortion of radar imaging.
To ensure the accuracy of InSAR deformation monitoring, based on the local incidence angle
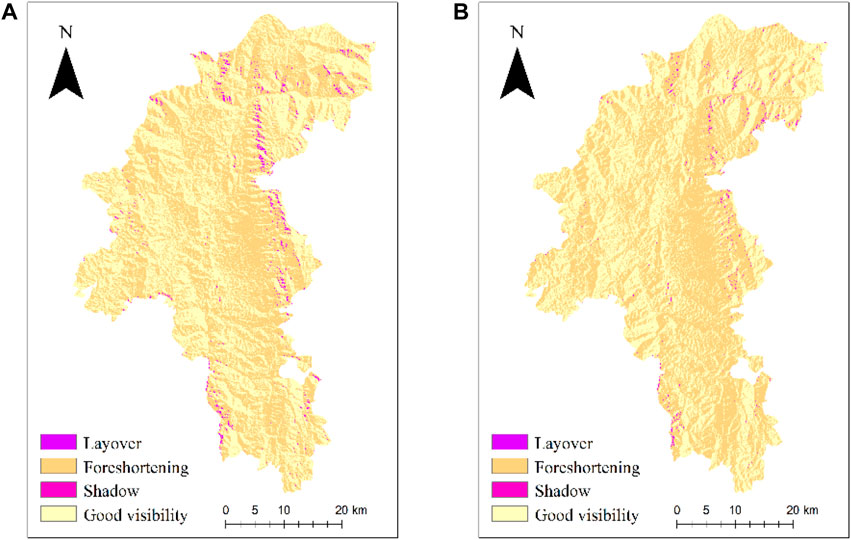
Figure 4. Analysis of radar visibility in the study area, (A) is the result of ascending, (B) is the result of descending.
As depicted in Figure 4, both ascending and descending orbit data displayed certain geometric distortions. Ascending orbit data mainly exerted layover effects, while descending orbit data displayed shadows predominantly. As indicated by the result, certain geometric distortions were inevitable during InSAR data processing in the complex geological conditions of the Yuanmou dry-hot valley region, due to the effect of radar satellite characteristics and the terrain morphology of the study area. Accordingly, prior to analyzing InSAR results, masking should be applied to the identified shadow and layover areas, as shown in Figure 5. This method can retain the valid InSAR observation areas and use a combined ascending and descending orbit method for comprehensive deformation analysis, thus ensuring the accuracy of land surface erosion and deformation monitoring.
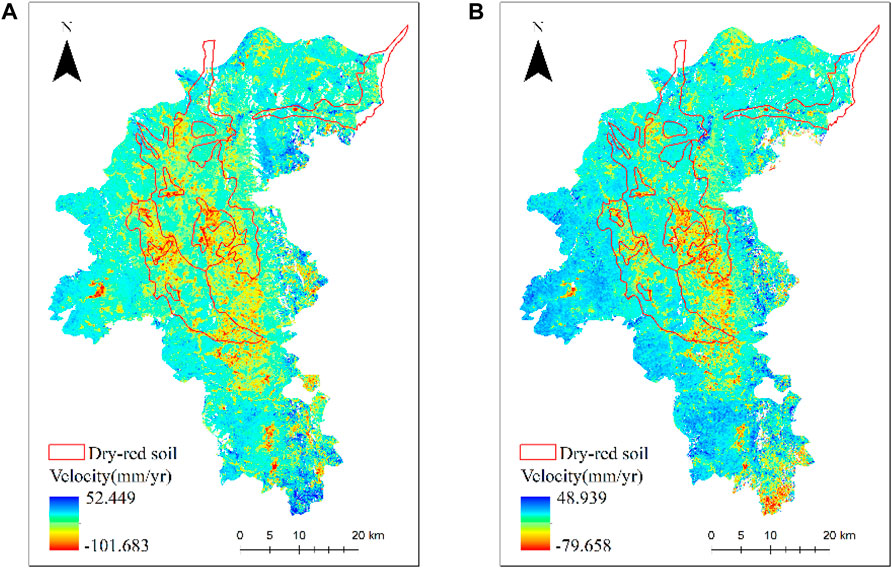
Figure 5. Deformation rate of the study area after mask processing, (A) is the result of ascending, (B) is the result of descending.
Due to the lack of on-site monitoring data in the identical period, the InSAR results were validated using cross validation of the ascending and descending orbit deformation rates. The LOS deformation rate of the descending orbit data in the study area was taken as the X-axis, and the LOS deformation rate of the ascending orbit data was taken as the Y-axis. A scatter density map was drawn for a total of 5,297,742 points, as shown in Figure 6. The correlation coefficient R = 0.55 between the LOS deformation rate at the same point of the ascent and descent data, and most of the deformation rate values at the same point are not significantly different, suggesting a high correlation between the monitoring results of the two data in the study area, proving the feasibility of joint analysis of ascent and descent data.
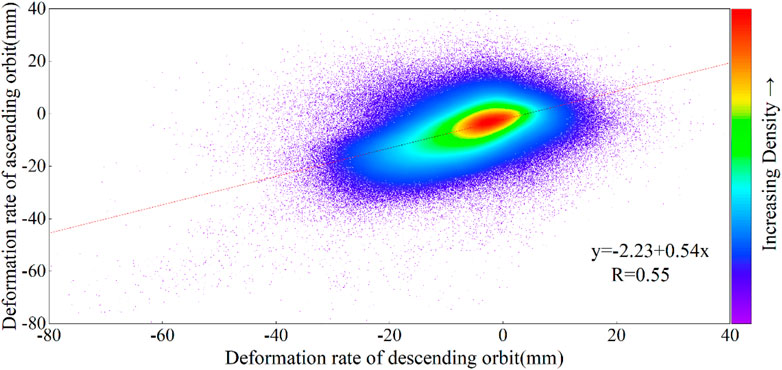
Figure 6. Scatter density map of points with the same name for ascending and descending.
Vegetation has been reported as an indispensable component of the geographical environment, and it takes on critical significance in the ecological system (Prach et al., 2001). Moreover, it is vital for surface energy exchange and the global water cycle. Vegetation is endowed with a crucial function of protecting against soil erosion, whereas soil erosion hinders vegetation from growing and developing. In general, FVC has been defined as the percentage of the vertical projected area of vegetation (e.g., leaves, stems, and branches) on the ground to the total study area. Moreover, FVC can represent the growth trend of vegetation to a certain extent, and it has been extensively employed in research regarding climate, hydrology, and soil (Zhang et al., 2019; Gao et al., 2020).
The pixel dichotomy model was presented as a linear model by Adams, Smith, and Johnson for the first time (Adams et al., 1986). The fundamental idea of this model aims at progressively approaching the roots of equations by repeatedly narrowing the interval where the potential root lies. It is assumed that the surface information of a pixel only comprises vegetation and soil, such that the proportion of vegetation information in the pixel is expressed as Eq. 7 (Li et al., 2014; Yang et al., 2023):
Where
The Normalized Difference Vegetation Index (NDVI) is effective in representing vegetation status. Thus, with NDVI as a single pixel information, setting NDVIsoil as a pixel cumulative NDVI value of approximately 2% (i.e., soil information content), and adopting NDVIveg as a pixel cumulative NDVI value of 98% (i.e., vegetation information content), Eq. 7 is rewritten as Eq. 8:
The normalized difference vegetation index (NDVI) for the study area was calculated monthly on the Google Earth Engine platform, using Sentinel-2 optical remote sensing images from March 2018 to October 2022. Subsequently, the time series FVC for the study area was computed in accordance with the pixel dichotomy model principle. Figure 7 illustrates a portion of the FVC for the study area.
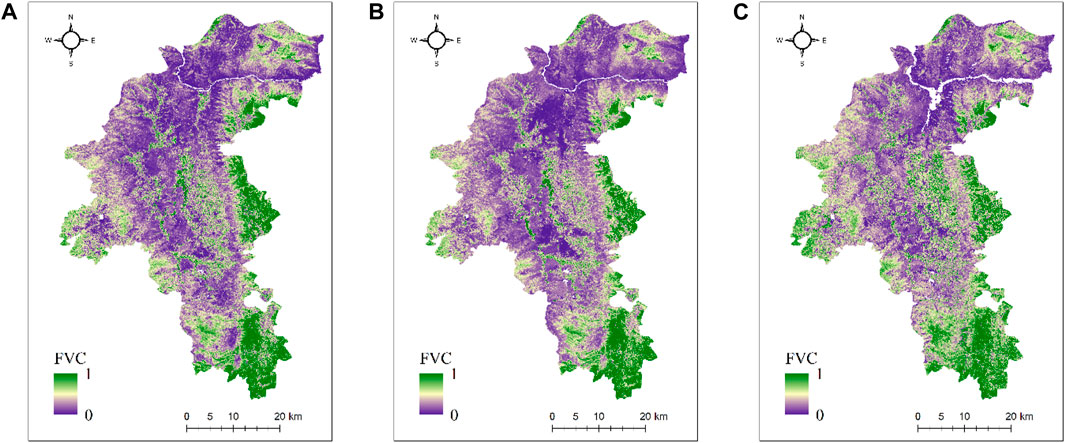
Figure 7. Partial FVC in the Study Area, (A) is the result for May 2018, (B) is the result for April 2020, (C) is the result for January 2022.
Figure 8 presents the radar line of sight (LOS) surface deformation information of dry-red soil of the Yuanmou dry-hot valley, obtained using the SBAS-InSAR technology from March 2018 to October 2022. The overall deformation rate for the ascending orbit data ranged from −101.683 mm/yr to 30.570 mm/yr; for the descending orbit data, it ranges from −79.658 mm/yr to 41.942 mm/yr. It's important to note that InSAR results represent true surface deformation projected onto the LOS direction. A positive deformation rate indicates uplift towards the satellite, while a negative value indicates subsidence or erosion away from the satellite. The surface deformation information obtained from the ascending and descending orbit datasets does not perfectly correspond due to the side-looking imaging geometry of the Sentinel-1A satellite and the topographic variations in the study area. The Sentinel-1A satellite’s ascending orbit data is acquired with the satellite flying from south to north, with the radar LOS direction on the right side of the satellite, while for the descending orbit, the situation is reversed. Thus, for detecting surface deformation in the complex geological conditions of the dry-hot valley area, a combination of data from different orbits should be utilized to ensure more accurate acquisition of surface deformation information.
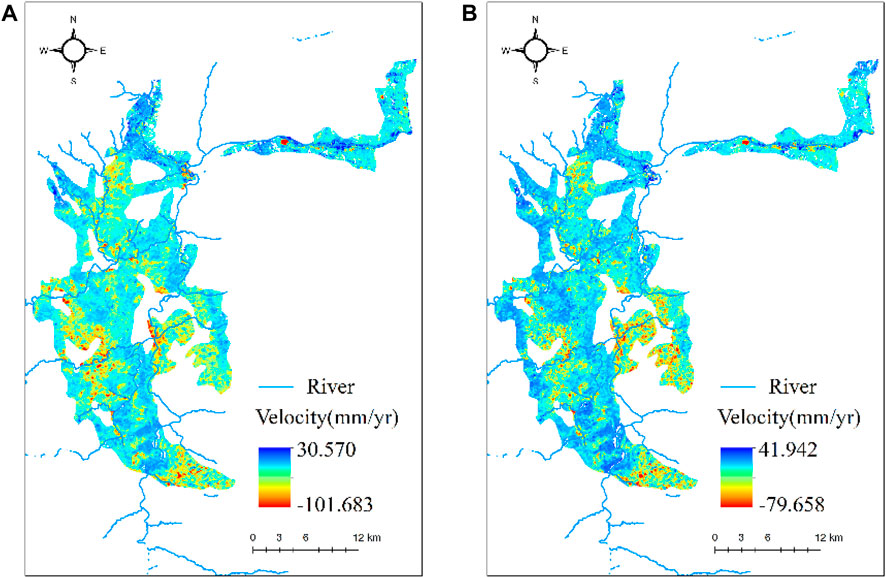
Figure 8. Surface deformation information of dry-red soil, (A) is the result of ascending, (B) is the result of descending.
To analyze the spatial distribution characteristics displayed by surface deformation in the Yuanmou dry-hot valley, the distribution of water systems in the study area was overlaid with the ascending and descending orbit deformation information (Figure 8). As depicted in Figure 8, the deformation features of the ascending and descending orbit data can be generally correlated spatially. In the region of dry-red soil distribution in the Yuanmou dry-hot valley, areas of surface uplift are mainly located in the northern Wudongde hydropower station reservoir area and the central region. The possible reason for this is the Wudongde hydropower station, situated at the border of Luliang County in Yunnan Province and Huidong County in Sichuan Province, which began reservoir filling at the end of 2019. Due to the larger particle size and loose structure of the dry-red soil, it can quickly absorb and store considerable water. Soil absorption and swelling can cause mountain uplift. When uplift reaches a critical threshold, the possibility of reservoir bank landslide disasters is significantly high. Thus, this area should be a focal point of observation in subsequent research. Erosion-prone areas are primarily situated along the southern side of riverbanks and at the confluence of rivers. Yuanmou County is traversed by the Longchuan River from south to north, carrying away substantial sediment, sand, and gravel when flowing through. The water-absorbing and swelling nature of dry-red soil makes it more susceptible to erosion from river scouring, particularly at the confluence of rivers where the flow rate and velocity increase. Vortices and whirlpools can be formed sometimes, exerting a greater effect on the soil on the banks, thus enhancing the erosive capacity of the water on the soil.
In the four altitudinal gradients where dry-red soil is distributed, representative areas of erosion deformation were selected from both ascending and descending orbit data. Among these, A-D represent the selected typical erosion deformation areas from the ascending orbit data, while E-H represent those from the descending orbit data. It is worth noting that the main objective of this study is to explore the correlation between dry-red soil erosion at different altitudinal gradients in the Yuanmou dry-hot valley and its response to rainfall and FVC in its natural state. To eliminate the effect of non-natural factors such as human activities on soil erosion, the selection of typical erosion deformation areas attempts to avoid human-activity areas (e.g., farmlands and urban regions) as much as possible. Furthermore, a synchronous comparative analysis of surface deformation information from both ascending and descending orbits was employed for mutual validation (Figures 9, 10). The deformation rate monitoring points from the selected typical erosion deformation areas were overlaid with high-resolution optical images (Figures 11, 12).
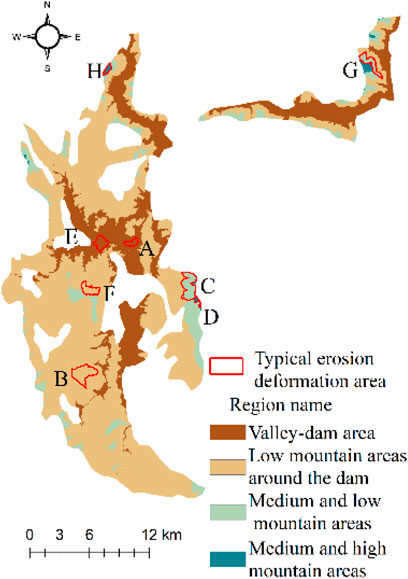
Figure 9. Typical erosion deformation areas at different altitudinal gradients.
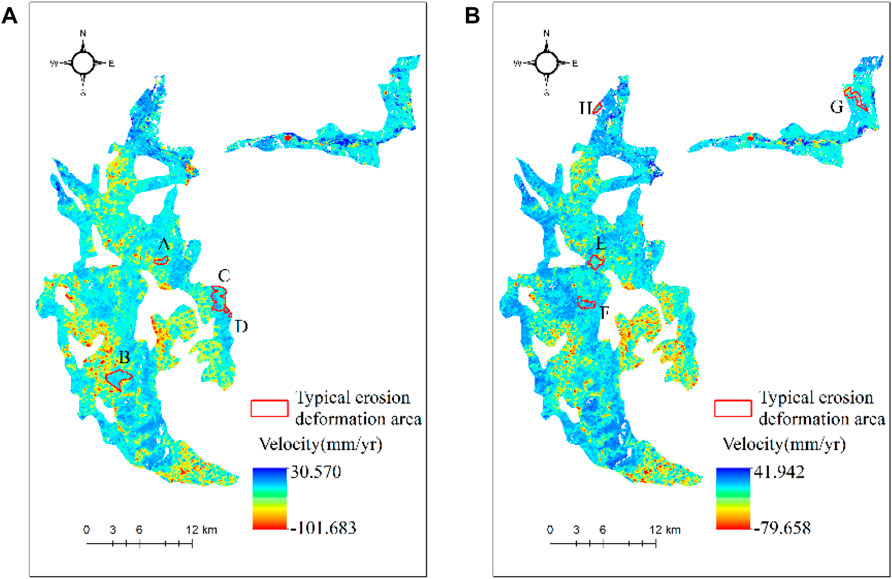
Figure 10. Typical erosion and deformation area for ascending and descending, (A) is the result of ascending, (B) is the result of descending.
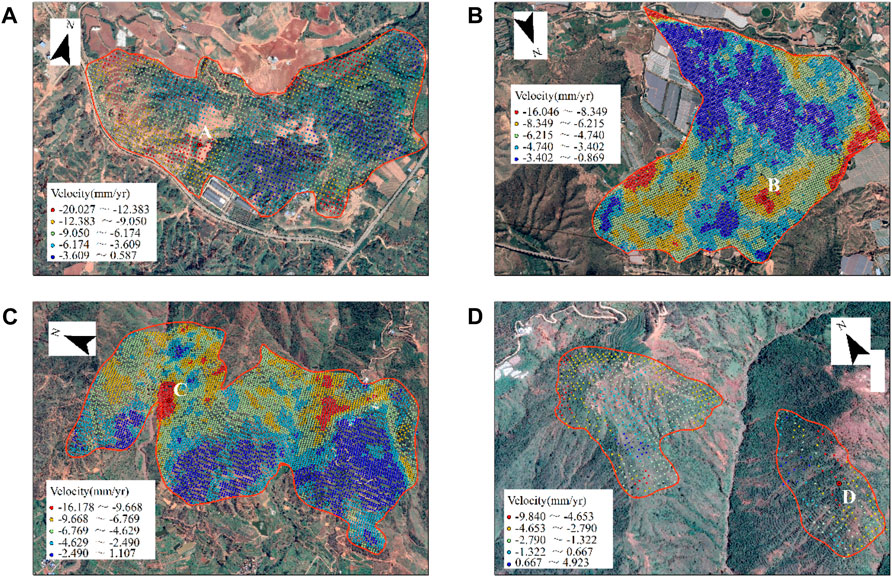
Figure 11. Typical erosion area deformation rate of ascending. (A) Typical erosion deformation zone A, (B) Typical erosion deformation zone B, (C) Typical erosion deformation zone C, (D) Typical erosion deformation zone D.
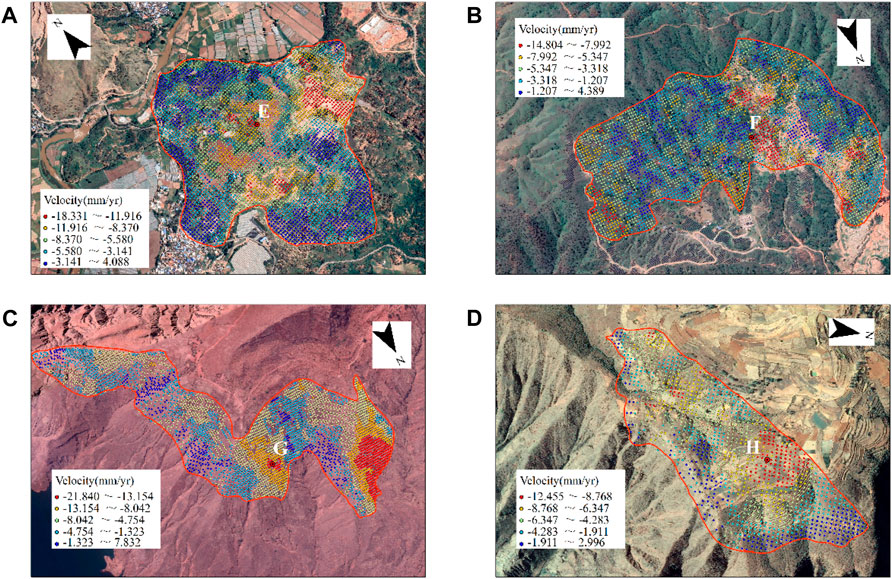
Figure 12. Typical erosion area deformation rate of descending. (A) Typical erosion deformation zone E, (B) Typical erosion deformation zone F, (C) Typical erosion deformation zone G, (D) Typical erosion deformation zone H.
To further analyze the response relationship between dry-red soil erosion at different altitudinal gradients in the Yuanmou dry-hot valley and rainfall and FVC, characteristic deformation points were selected in several typical erosion deformation areas. The above-mentioned points are numbered consistently with the typical erosion deformation areas. In conjunction with monthly average rainfall and time series FVC, time series curves of erosion deformation points from March 2018 to October 2022 were plotted, as shown in Figures 13–16. In addition, the average slope within the four altitude gradients was counted separately, and the slope factor was combined for auxiliary analysis. The statistical results are shown in Table 3.
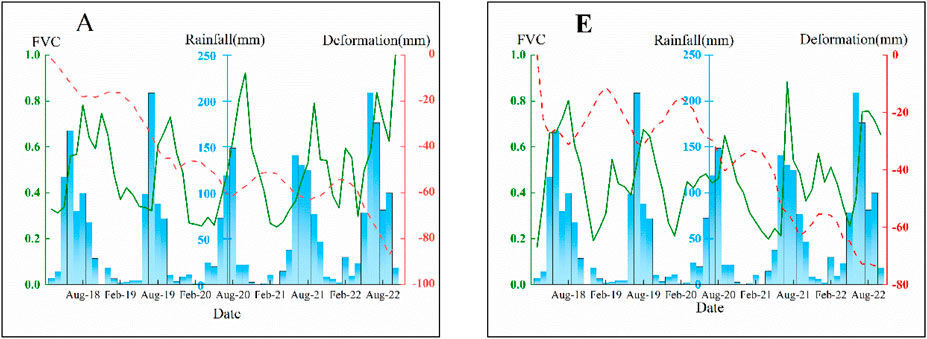
Figure 13. Time series curve of typical erosion deformation points in the valley-dam area. (A) Time series curve of typical erosion deformation point A, (B) Time series curve of typical erosion deformation point E.
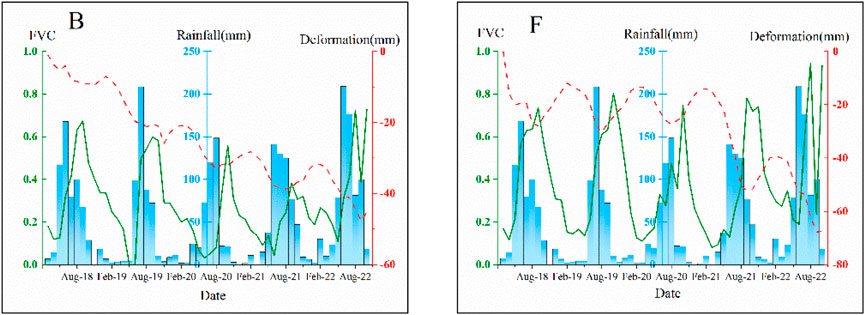
Figure 14. Time series curve of typical erosion deformation points in low mountain areas around the dam. (A) Time series curve of typical erosion deformation point B, (B) Time series curve of typical erosion deformation point F.
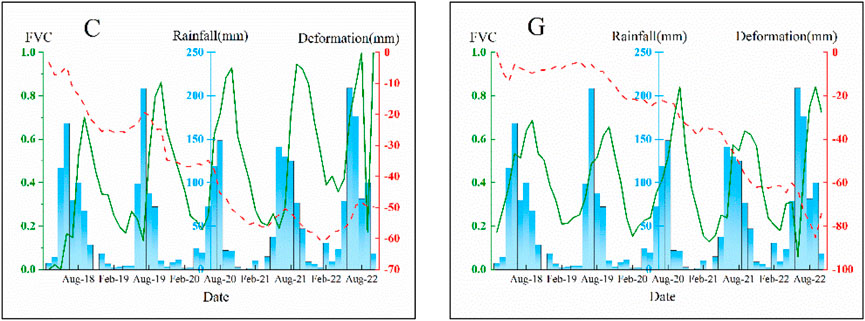
Figure 15. Time series curve of typical deformation points of dry-red soil in medium and low mountain areas. (A) Time series curve of typical erosion deformation point C, (B) Time series curve of typical erosion deformation point G.
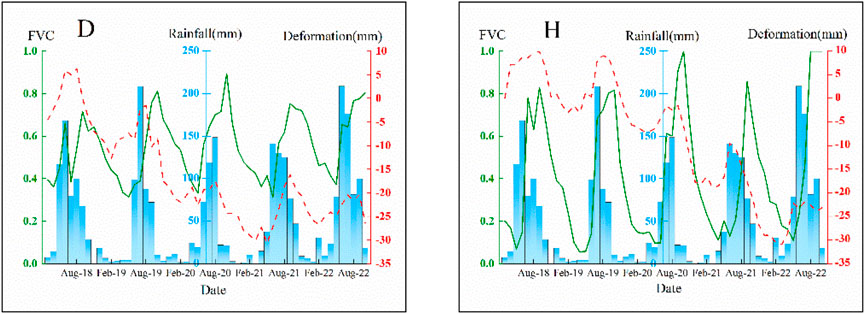
Figure 16. Time series curve of typical deformation points of dry-red soil in medium and high mountain areas. (A) Time series curve of typical erosion deformation point D, (B) Time series curve of typical erosion deformation point H.
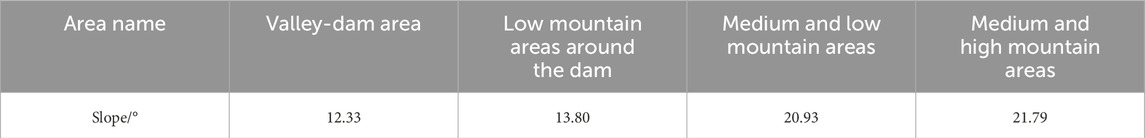
Table 3. The average gradient of four different elevations.
A and E are the typical erosion deformation points of the ascending and descending orbits in the valley-dam area below 1,100 m elevation, respectively, and the maximum erosion amounts are about 80 mm. B and F are the typical deformation points of the ascending and descending orbits of the low mountain areas around the dam at elevations from 1,100 to 1,350 m, respectively. Compared with the valley-dam area, the erosion has slowed down somewhat, and the maximum amount of erosion is about 60 mm. The valley-dam area and the low mountain areas around the dam account for about 90% of the dry-red soil area in the Yuanmou dry-hot valley, and the average slope is 12.33° and 13.80°, respectively. Because the slope is slow, the sediment is less likely to be carried away by other erosion effects. The time series curve of typical erosion deformation points shows periodic changes, and the erosion and uplift amounts are roughly the same. Soil erosion intensifies during high vegetation coverage in rainy season, while soil erosion slows down during low vegetation coverage in dry season.
In general, under low FVC, the surface was mostly exposed and more susceptible to erosion and settling. When vegetation conditions were better, the soil’s erosion resistance turned out to be stronger (Jacquemart and Tiampo, 2021; Yan et al., 2023). However, even during the rainy season with the higher FVC, soil erosion remained more pronounced. In contrast, in the dry season, erosion was reduced under low vegetation cover. As revealed by the above result, in the Yuanmou dry-hot valley below an altitude of 1,350 m, the response of dry-red soil erosion to rainfall became more pronounced, and vegetation cover exerted a limited effect on soil and water conservation. The reason is that vegetation below 1,350 m above sea level in Yuanmo dry-hot valley is mostly sparsely irrigated grass with short plants and underdeveloped roots. Under the action of rain, it is difficult to effectively fix soil and slow down erosion even if vegetation coverage is high. In addition, the surface temperature of the dry-hot valley is higher, especially in the low altitude area, the evapotranspiration capacity is stronger, and the soil water loss is faster. Therefore, during the dry season, the vegetation coverage decreases, and the soil water is lost under the action of strong evapotranspiration, resulting in soil expansion and surface uplift. Once continuous heavy rainfall occurs, the soil erosion amount will increase significantly.
C and G are the typical erosion deformation points of the ascending and descending orbits of the medium and low mountain areas at an altitude of 1,350–1,600 m, respectively. The medium and low mountain areas accounts for about 7% of the dry-red soil area of the Yuanmo dry-hot valley, with an average slope of 20.93°. Compared with the valley-dam area and the low mountain areas around the dam, the soil is more vulnerable to erosion due to the increase of slope. The time series curve of typical erosion deformation points shows a continuous and oscillating decline. During the high vegetation coverage in rainy season, soil erosion slows down, while during the low vegetation coverage in dry season, soil erosion intensifies. It shows that vegetation coverage change is the main factor affecting soil erosion of dry-red soil in the medium and low mountain areas of Yuanmou dry-hot valley. The reason is that some evergreen broad-leaved forests with large plants begin to appear in the area above 1,350 m above sea level in Yuanmo dry-hot Valley. Vegetation develops during the rainy season with high vegetation coverage, and leaves play a certain role in intercepting the precipitation and slowing down soil erosion. During the dry season, the vegetation coverage decreases, and the water in the soil is lost under the action of evapotranspiration, resulting in the soil becoming loose. In the absence of vegetation protection, the soil is more difficult to resist the impact of external forces such as wind and water flow, and the erosion is intensified. Although vegetation slowed down soil erosion in the medium and low mountain areas to a certain extent, soil erosion increased year by year due to the steep slope in this area.
D and H are typical deformation points in the ascending and descending orbits of medium and high mountain areas with elevations above 1,600 m. These areas account for only 3% of the Yuanmou dry-hot valley with dry-red soil regions. With an average slope of 21.79°, they are the areas with the weakest soil erosion among the four elevation gradients. The time series curve of typical erosion deformation points shows a periodic continuous decline. During the rainy season, when vegetation coverage is high, soil erosion slows down, while during the dry season, when vegetation coverage is low, soil erosion intensifies. Similar to the medium and low mountain areas, soil erosion in the medium and high mountain areas of the Yuanmou dry-hot valley is mainly influenced by vegetation coverage. During the rainy season, with higher vegetation coverage, soil erosion is weaker, but during the dry season, soil erosion worsens due to reduced vegetation coverage. With the steepest slopes, overall, soil erosion increases year by year.
In this altitude range, besides evergreen broad-leaved forests, there were also some larger plant species of subtropical coniferous forests (e.g., pine and fir trees). Coniferous trees have well-developed root systems that penetrate deep into the soil, stabilizing soil structure and reducing soil loosening and collapse. Compared with broad-leaved forests, the needle-like leaves and branch structure of coniferous trees are more effective in intercepting rainfall, preventing direct contact of rainwater with the ground, and reducing water impact. As a result, the water flow velocity can be reduced. Furthermore, due to the higher altitude, surface temperature and evapotranspiration are relatively weaker compared with lower altitudes. Therefore, even in the dry season with low vegetation coverage, soil erosion is much less compared to the medium and low mountain areas.
In this study, the response relationship between dry-red soil erosion and rainfall and FVC was investigated using remote sensing techniques at different altitudinal gradients in the Yuanmou dry-hot valley. This study aimed at differentiating the contributions of rainfall and FVC to dry-red soil erosion in different altitudinal gradients. Accordingly, the accuracy and reliability of erosion deformation monitoring results using InSAR technology can directly affect the accuracy of this study. Given the lack of simultaneous ground measurement data, a cross-validation method using ascending and descending orbit datasets was adopted to validate the InSAR results. A comparison was drawn with InSAR results obtained by other researchers in the identical region (Peng, 2022) to further verify the accuracy of the InSAR results in this study, and the main differences are listed in Table 4. As depicted in the table, the InSAR results in this study were consistent in magnitude with previous research findings. Moreover, the error distribution curve was generated for the 5,297,742 co-located deformation points from ascending and descending orbit data in the study area (Figure 17). The measurement errors for ascending and descending data were primarily distributed between -5 mm and 5 mm, with a maximum error not exceeding 15 mm. The distribution conformed to a normal distribution curve, and the probability density of errors exceeding 5 mm was below 0.05. Furthermore, the dry-red soil erosion deformation patterns detected by ascending and descending data in the four different altitudinal gradients correspond to each other, with similar erosion rates, thus verifying the accuracy and effectiveness of the results in this study.
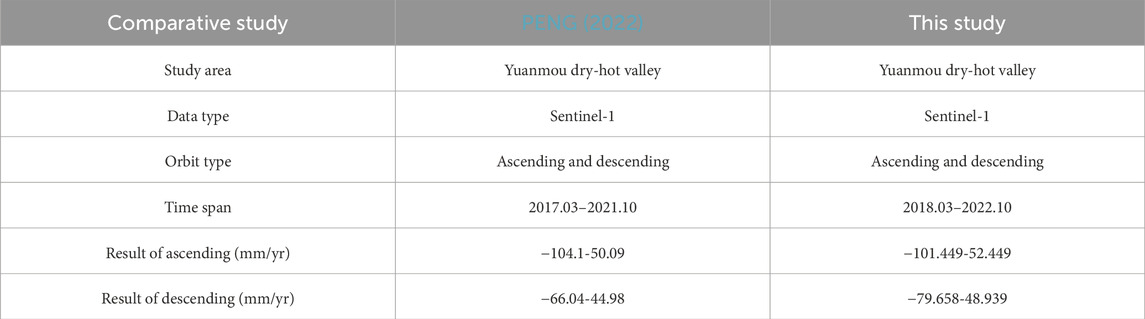
Table 4. Comparative study differences.
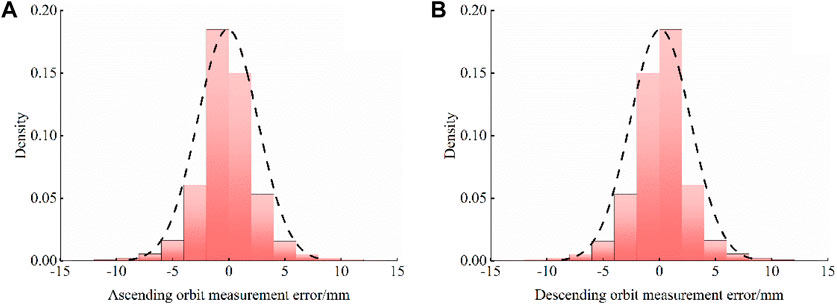
Figure 17. Measurement error of orbit ascending and descending data, (A) is the result of ascending, (B) is the result of descending.
In this study, we employed SBAS-InSAR technology to investigate the relationship between soil erosion of dry-red soil and precipitation and vegetation coverage gradients in the Yuanmou dry-hot valley. Due to the unique geographical and climatic conditions of the Yuanmou dry-hot valley, different types of vegetation develop within different altitude gradients, exerting varying degrees of inhibition and protection against soil erosion of dry-red soil. Below an altitude of 1,350 m, the vegetation consists mainly of sparse shrubs and grasses. Even with relatively high vegetation coverage, it is difficult to effectively prevent soil erosion, with rainfall being the primary factor influencing erosion of dry-red soil—the greater the rainfall, the more severe the soil erosion. Above 1,350 m, larger vegetation begins to develop. When vegetation coverage is high, it effectively slows down soil erosion. Changes in vegetation coverage are the primary factor affecting soil erosion of dry-red soil—increased vegetation coverage leads to reduced soil erosion.
To further analyze the response relationship between dry-red soil erosion and rainfall and FVC in the Yuanmou dry-hot valley, our research results were compared with published similar studies, and the contributions and limitations of our study to existing research were summarized. SUN(Sun et al., 2013), in a study of the contribution of rainfall and vegetation cover to soil erosion in the Loess Plateau, suggested that variations in vegetation cover contribute more to soil erosion than rainfall. SUN’s research covered the Loess Plateau as a whole, suggesting that in most areas of the Loess Plateau, variations in vegetation cover more signficiantly affected soil erosion than rainfall. In contrast, this study focused on different altitudinal gradients in the Yuanmou dry-hot valley, providing a more detailed spatial differentiation of the contributions of rainfall and vegetation cover to dry-red soil erosion. XU (Xu et al., 2019), in a study of Chen Town in Sanming City, Fujian Province, quantified the response relationship between vegetation cover and rainfall on soil erosion using a power-law regression model. XU proposed that when vegetation cover was less than 40%, and rainfall exceeded 80 mm, the risk of soil erosion increases sharply. When vegetation cover exceeded 40%, even heavy rainfall would not cause significant soil loss. In contrast, the contributions of vegetation cover and rainfall to soil erosion was only spatially differentiated, without further quantifying the relationships among the three factors. Exploring the quantitative relationship between rainfall, vegetation cover, and soil erosion in different altitudinal gradients is an important avenue for future research.
Furthermore, to further validate the accuracy of the results of this study, field investigations were carried out in the middle and low mountain areas (altitude range: 1350m–1600 m) of Yuanmou. Field photographs were taken (Figure 18). As depicted in the photographs, dry-red soil with better vegetation cover was less susceptible to erosion, whereas areas without vegetation cover formed gullies and exhibited distinct signs of soil erosion.
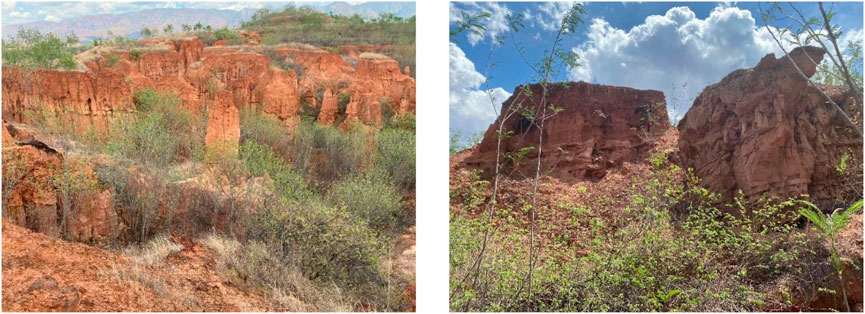
Figure 18. Field survey photos.
In this study, the response relationship between dry-red soil erosion and rainfall and FVC was explored using remote sensing techniques at different altitudinal gradients in the Yuanmou dry-hot valley to clarify the sophisticated relationship between soil erosion, rainfall, and FVC. The study aimed to distinguish the contributions of rainfall and FVC to dry-red soil erosion at different altitudinal gradients. First, the SBAS-InSAR technology was used to acquire the surface deformation rates of dry-red soil erosion in the Yuanmou dry-hot valley from March 2018 to October 2022. Subsequently, a time series of FVC for the same period was calculated and extracted using pixel-based classification in the Google Earth Engine platform. Lastly, a comprehensive analysis was conducted, combining the surface deformation rates, time series of FVC, and rainfall data, to study the patterns of dry-red soil erosion at different altitudinal gradients. The results indicate that the dry-red soil erosion patterns detected by ascending and descending data at four distinct altitudinal gradients correspond to each other, with similar erosion magnitudes. The overall dry-red soil erosion deformation rates in the Yuanmou dry-hot valley range from −101.683 mm/yr to 30.57 mm/yr (Ascending),-79.658 mm/yr to 41.942 mm/yr (Descending). Areas with severe surface erosion are concentrated in the Longchuan River basin and a wide variety of river confluence zones, while areas with surface uplift are mostly found in the central and northern parts, specifically the Wudongde hydropower station reservoir area. The study reveals a noticeable altitudinal gradient effect on dry-red soil erosion in the Yuanmou dry-hot valley. The valley-dam area and the medium and low mountain areas were subjected to the most serious soil erosion, and the maximum erosion reached over 80 mm. Erosion was mitigated in the low mountain areas around the dam, with a maximum erosion of 60 mm. The medium and high mountain areas exhibit the weakest erosion, with a maximum erosion of only 30 mm. The correlation between dry-red soil erosion, rainfall, and FVC is divided by an altitude threshold of 1,350 m. Below 1,350 m, soil erosion is more strongly influenced by rainfall, whereas above 1,350 m, variations in FVC are the primary factors affecting soil erosion.
The original contributions presented in the study are included in the article/Supplementary Material, further inquiries can be directed to the corresponding authors.
JG: Writing–original draft. WX: Writing–review and editing. GHu: Writing–review and editing. GHe: Methodology, Writing–review and editing. LS: Validation, Writing–review and editing. ZY: Methodology, Writing–review and editing. ZD: Software, Writing–review and editing. LW: Data curation, Writing–review and editing. RC: Writing–review and editing.
The author(s) declare that financial support was received for the research, authorship, and/or publication of this article. This research was funded by the Scientific Research Fund Project of the Yunnan Provincial Department of Education (2024Y175); General Program of basic research plan of Yunnan Province; Yunnan Provincial Key Science and Technology Basic Research Programs (No. 202001AS070070); Major scientific and technological projects of Yunnan Province: Research on Key Technologies of ecological environment monitoring and intelligent management of natural resources in Yunnan (No: 202202AD080010); “Study on High-Level Hidden Landslide Identification Based on Multi-Source Data” of Key Laboratory of Early Rapid Identification, Prevention and Control of Geological Diseases in Traffic Corridor of High Intensity Earthquake Mountainous Area of Yunnan Province (KLGDTC-2021-02) and Guizhou Scientific and Technology Fund [QKHJ-ZK (2023) YB 193]; Yunnan Normal University Graduate Student Research Innovation Fund (No. YJSJJ23-B151); Key Project of Basic Research Program of Yunnan Province (Grant Num. 202101AS070019); Yunnan Normal University Graduate Student Research Innovation Fund (Grant No. YJSJJ23-B140).
We thank the European Space Agency for providing Sentinel-1 and Sentinel-2 data for free; 30 m resolution DEM data provided free of charge by Japan’s JAXA; High resolution optical image data provided free of charge by Google Earth and rainfall data provided by China Meteorologi-cal Data Service Center.
The authors declare that the research was conducted in the absence of any commercial or financial relationships that could be construed as a potential conflict of interest.
All claims expressed in this article are solely those of the authors and do not necessarily represent those of their affiliated organizations, or those of the publisher, the editors and the reviewers. Any product that may be evaluated in this article, or claim that may be made by its manufacturer, is not guaranteed or endorsed by the publisher.
Adams, J. B., Smith, M. O., and Johnson, P. E. (1986). Spectral mixture modeling: a new analysis of rock and soil types at the Viking Lander 1 site. J. Geophys. Res. Solid Earth 91 (B8), 8098–8112. doi:10.1029/JB091iB08p08098
Alatorre, L., Beguería, S., Lana-Renault, N., Navas, A., and García-Ruiz, J. M. (2012). Soil erosion and sediment delivery in a mountain catchment under scenarios of land use change using a spatially distributed numerical model. Hydrology Earth Syst. Sci. 16 (5), 1321–1334. doi:10.5194/hess-16-1321-2012
Berardino, P., Fornaro, G., Lanari, R., and Sansosti, E. (2002). A new algorithm for surface deformation monitoring based on small baseline differential SAR interferograms. IEEE Trans. geoscience remote Sens. 40 (11), 2375–2383. doi:10.1109/TGRS.2002.803792
Bonì, R., Bordoni, M., Vivaldi, V., Troisi, C., Tararbra, M., Lanteri, L., et al. (2020). Assessment of the Sentinel-1 based ground motion data feasibility for large scale landslide monitoring. Landslides 17, 2287–2299. doi:10.1007/s10346-020-01433-3
Born, G., Dunne, J., and Lame, D. (1979). Seasat mission overview. Science 204 (4400), 1405–1406. doi:10.1126/science.204.4400.1405
Borrelli, P., Alewell, C., Alvarez, P., Anache, J. A. A., Baartman, J., Ballabio, C., et al. (2021). Soil erosion modelling: a global review and statistical analysis. Sci. total Environ. 780, 146494. doi:10.1016/j.scitotenv.2021.146494
Chen, A., Zhang, D., Yan, B., Lei, B., and Liu, G. (2015). Main types of soil mass failure and characteristics of their impact factors in the Yuanmou Valley, China. Catena 125, 82–90. doi:10.1016/j.catena.2014.10.011
Chen, C., Liang, J., Yang, G., and Sun, W. (2023). Spatio-temporal distribution of harmful algal blooms and their correlations with marine hydrological elements in offshore areas, China. Ocean Coast. Manag. 238, 106554. doi:10.1016/j.ocecoaman.2023.106554
Chen, C., Yang, X., Jiang, S., and Liu, Z. (2023). Mapping and spatiotemporal dynamics of land-use and land-cover change based on the Google Earth Engine cloud platform from Landsat imagery: a case study of Zhoushan Island, China. Heliyon 9 (9), e19654. doi:10.1016/j.heliyon.2023.e19654
Chen, Y., Yu, S., Tao, Q., Liu, G., Wang, L., and Wang, F. (2021). Accuracy verification and correction of D-InSAR and SBAS-InSAR in monitoring mining surface subsidence. Remote Sens. 13 (21), 4365. doi:10.3390/rs13214365
Cigna, F., Esquivel Ramírez, R., and Tapete, D. (2021). Accuracy of sentinel-1 PSI and SBAS InSAR displacement velocities against GNSS and geodetic leveling monitoring data. Remote Sens. 13 (23), 4800. doi:10.3390/rs13234800
Deng, Q., Qin, F., Zhang, B., Wang, H., Luo, M., Shu, C., et al. (2015). Characterizing the morphology of gully cross-sections based on PCA: a case of Yuanmou Dry-Hot Valley. Geomorphology 228, 703–713. doi:10.1016/j.geomorph.2014.10.032
Ding, L., Qin, F.-c., Fang, H.-d., Liu, H., Zhang, B., Shu, C.-q., et al. (2017). Morphology and controlling factors of the longitudinal profile of gullies in the Yuanmou dry-hot valley. J. Mt. Sci. 14, 674–693. doi:10.1007/s11629-016-4189-7
Dong, Y., Xiong, D., Su, Z. a., Li, J., Yang, D., Zhai, J., et al. (2013). Critical topographic threshold of gully erosion in Yuanmou dry-hot valley in southwestern China. Phys. Geogr. 34 (1), 50–59. doi:10.1080/02723646.2013.778691
Du, S., Tang, G., Liu, Y., Lei, C., Xu, Y., Ruan, C., et al. (2022). Plant diversity in various sections of Jinsha River dry-hot valley under different site environments. J. Zhejiang A F Univ. 39 (04), 742–749. doi:10.11833/j.issn.2095-0756.20210572
Duan, X., Liu, B., Gu, Z., Rong, L., and Feng, D. (2016). Quantifying soil erosion effects on soil productivity in the dry-hot valley, southwestern China. Environ. Earth Sci. 75, 1164–1169. doi:10.1007/s12665-016-5986-6
Dun, J., Feng, W., Yi, X., Zhang, G., and Wu, M. (2021). Detection and mapping of active landslides before impoundment in the Baihetan Reservoir area (China) based on the time-series InSAR method. Remote Sens. 13 (16), 3213. doi:10.3390/rs13163213
Gao, L., Wang, X., Johnson, B. A., Tian, Q., Wang, Y., Verrelst, J., et al. (2020). Remote sensing algorithms for estimation of fractional vegetation cover using pure vegetation index values: a review. ISPRS J. Photogrammetry Remote Sens. 159, 364–377. doi:10.1016/j.isprsjprs.2019.11.018
Guo, R., Li, S., Chen, Y. n., Li, X., and Yuan, L. (2021). Identification and monitoring landslides in Longitudinal Range-Gorge Region with InSAR fusion integrated visibility analysis. Landslides 18, 551–568. doi:10.1007/s10346-020-01475-7
Hu, B., Chen, J., and Zhang, X. (2019). Monitoring the land subsidence area in a coastal urban area with InSAR and GNSS. Sensors 19 (14), 3181. doi:10.3390/s19143181
Jacquemart, M., and Tiampo, K. (2021). Leveraging time series analysis of radar coherence and normalized difference vegetation index ratios to characterize pre-failure activity of the Mud Creek landslide, California. Nat. Hazards Earth Syst. Sci. 21 (2), 629–642. doi:10.5194/nhess-21-629-2021
Li, F., Chen, W., Zeng, Y., Zhao, Q., and Wu, B. (2014). Improving estimates of grassland fractional vegetation cover based on a pixel dichotomy model: a case study in Inner Mongolia, China. Remote Sens. 6 (6), 4705–4722. doi:10.3390/rs6064705
Li, J. (2021). Study on drought stress adaptation mechanism of jatropha curcas L. Plantation in Yuanmou dry-hot valley [Doctor, Yunnan Normal University], Kunming, China.
Lin, L., Donghong, X., Wenduo, Z., Wanxin, L., Yong, Y., Baojun, Z., et al. (2020). Benefits and ecological risks of gully reclamation project in Yuanmou dry-hot valley region. Trans. Chin. Soc. Agric. Eng. 36 (04), 251–258. doi:10.11975/j.issn.1002-6819.2020.04.030
Liu, Y., Qiu, H., Kamp, U., Wang, N., Wang, J., Huang, C., et al. (2024). Higher temperature sensitivity of retrogressive thaw slump activity in the Arctic compared to the Third Pole. Sci. total Environ. 914, 170007. doi:10.1016/j.scitotenv.2024.170007
Ma, S., Qiu, H., Zhu, Y., Yang, D., Tang, B., Wang, D., et al. (2023). Topographic changes, surface deformation and movement process before, during and after a rotational landslide. Remote Sens. 15 (3), 662. doi:10.3390/rs15030662
Osmanoğlu, B., Sunar, F., Wdowinski, S., and Cabral-Cano, E. (2016). Time series analysis of InSAR data: methods and trends. ISPRS J. Photogrammetry Remote Sens. 115, 90–102. doi:10.1016/j.isprsjprs.2015.10.003
Ou, Z. (2017). Study on ecological security evaluation of Yuanmou dry-hot vally region [Doctor, Beijing Forestry University, Beijing, China].
Ou, Z., Zhu, Q., and Sun, Y. (2018). Temporal and spatial variation of landscape ecological security in Yuanmou Dry-hot Valley. Sci. Soil Water Conservation 16 (01), 131–140. doi:10.16843/j.sswc.2018.01.017
Pei, Y., Qiu, H., Yang, D., Liu, Z., Ma, S., Li, J., et al. (2023). Increasing landslide activity in the Taxkorgan River Basin (eastern Pamirs Plateau, China) driven by climate change. Catena 223, 106911. doi:10.1016/j.catena.2023.106911
Peng, S., Chen, A., Fang, H., Wu, J., and Liu, G. (2013). Effects of vegetation restoration types on soil quality in Yuanmou dry-hot valley, China. Soil Sci. Plant Nutr. 59 (3), 347–360. doi:10.1080/00380768.2013.785918
Peng, Y. (2022). Study on present activity characteristicsof Yuanmou fault (Jiangyi-Huatong). Kunming, China: Master, YunnanUniversity.
Prach, K., Bartha, S., Joyce, C. B., Pyšek, P., Van Diggelen, R., and Wiegleb, G. (2001). The role of spontaneous vegetation succession in ecosystem restoration: a perspective. Appl. Veg. Sci. 4 (1), 111–114. doi:10.1111/j.1654-109X.2001.tb00241.x
Qiu, H., Su, L., Tang, B., Yang, D., Ullah, M., Zhu, Y., et al. (2024). The effect of location and geometric properties of landslides caused by rainstorms and earthquakes. Earth Surf. Process. Landforms. doi:10.1002/esp.5816
Qiu, H., Zhu, Y., Zhou, W., Sun, H., He, J., and Liu, Z. (2022). Influence of DEM resolution on landslide simulation performance based on the Scoops3D model. Geomatics, Nat. Hazards Risk 13 (1), 1663–1681. doi:10.1080/19475705.2022.2097451
Reinosch, E., Gerke, M., Riedel, B., Schwalb, A., Ye, Q., and Buckel, J. (2021). Rock glacier inventory of the western Nyainqêntanglha Range, Tibetan Plateau, supported by InSAR time series and automated classification. Permafr. Periglac. Process. 32 (4), 657–672. doi:10.1002/ppp.2117
Rong, L., Duan, X., Zhang, G., Gu, Z., and Feng, D. (2019). Impacts of tillage practices on ephemeral gully erosion in a dry-hot valley region in southwestern China. Soil tillage Res. 187, 72–84. doi:10.1016/j.still.2018.11.012
Su, X., Zhang, Y., Meng, X., Rehman, M. U., Khalid, Z., and Yue, D. (2022). Updating inventory, deformation, and development characteristics of landslides in hunza valley, NW karakoram, Pakistan by SBAS-InSAR. Remote Sens. 14 (19), 4907. doi:10.3390/rs14194907
Sun, W., Shao, Q., and Liu, J. (2013). Soil erosion and its response to the changes of precipitation and vegetation cover on the Loess Plateau. J. Geogr. Sci. 23, 1091–1106. doi:10.1007/s11442-013-1065-z
Tizzani, P., Berardino, P., Casu, F., Euillades, P., Manzo, M., Ricciardi, G., et al. (2007). Surface deformation of long valley caldera and mono basin, California, investigated with the SBAS-InSAR approach. Remote Sens. Environ. 108 (3), 277–289. doi:10.1016/j.rse.2006.11.015
Vanwalleghem, T., Gómez, J., Amate, J. I., De Molina, M. G., Vanderlinden, K., Guzmán, G., et al. (2017). Impact of historical land use and soil management change on soil erosion and agricultural sustainability during the Anthropocene. Anthropocene 17, 13–29. doi:10.1016/j.ancene.2017.01.002
Wang, L., Qiu, H., Zhou, W., Zhu, Y., Liu, Z., Ma, S., et al. (2022). The post-failure spatiotemporal deformation of certain translational landslides may follow the pre-failure pattern. Remote Sens. 14 (10), 2333. doi:10.3390/rs14102333
Wang, T., DeGrandpre, K., Lu, Z., and Freymueller, J. T. (2018). Complex surface deformation of Akutan volcano, Alaska revealed from InSAR time series. Int. J. Appl. earth observation geoinformation 64, 171–180. doi:10.1016/j.jag.2017.09.001
Xu, C., Yang, Z., Qian, W., Chen, S., Liu, X., Lin, W., et al. (2019). Runoff and soil erosion responses to rainfall and vegetation cover under various afforestation management regimes in subtropical montane forest. Land Degrad. Dev. 30 (14), 1711–1724. doi:10.1002/ldr.3377
Yan, L., Gong, Q., Wang, F., Chen, L., Li, D., and Yin, K. (2023). Integrated methodology for potential landslide identification in highly vegetation-covered areas. Remote Sens. 15 (6), 1518. doi:10.3390/rs15061518
Yang, W., Wang, Y., Wang, Y., Ma, C., and Ma, Y. (2020). Retrospective deformation of the Baige landslide using optical remote sensing images. Landslides 17, 659–668. doi:10.1007/s10346-019-01311-7
Yang, Z., Li, Z., Zhu, J., Wang, Y., and Wu, L. (2020). Use of SAR/InSAR in mining deformation monitoring, parameter inversion, and forward predictions: a review. IEEE Geoscience Remote Sens. Mag. 8 (1), 71–90. doi:10.1109/MGRS.2019.2954824
Yang, Z., Xi, W., Shi, Z., Yang, Z., and Xiao, B. (2023). Study on the relationship between landslide creep and vegetation cover in mountainous areas with complex vegetation. Sci. Surv. Mapp. 48 (01), 157–165+175. doi:10.16251/j.cnki.1009-2307.2023.01.018
Ye, B., Qiu, H., Tang, B., Liu, Y., Liu, Z., Jiang, X., et al. (2024). Creep deformation monitoring of landslides in a reservoir area. J. Hydrology 632, 130905. doi:10.1016/j.jhydrol.2024.130905
Ye, C., Li, Y., Cui, P., Liang, L., Pirasteh, S., Marcato, J., et al. (2019). Landslide detection of hyperspectral remote sensing data based on deep learning with constrains. IEEE J. Sel. Top. Appl. Earth Observations Remote Sens. 12 (12), 5047–5060. doi:10.1109/JSTARS.2019.2951725
Yu, H., Lan, Y., Yuan, Z., Xu, J., and Lee, H. (2019). Phase unwrapping in InSAR: a review. IEEE Geoscience Remote Sens. Mag. 7 (1), 40–58. doi:10.1109/MGRS.2018.2873644
Zhang, B., Xiong, D., Zhang, G., Zhang, S., Wu, H., Yang, D., et al. (2018). Impacts of headcut height on flow energy, sediment yield and surface landform during bank gully erosion processes in the Yuanmou Dry-hot Valley region, southwest China. Earth Surf. Process. Landforms 43 (10), 2271–2282. doi:10.1002/esp.4388
Zhang, S., Chen, H., Fu, Y., Niu, H., Yang, Y., and Zhang, B. (2019). Fractional vegetation cover estimation of different vegetation types in the Qaidam Basin. Sustainability 11 (3), 864. doi:10.3390/su11030864
Zhang, X., Song, J., Wang, Y., Sun, H., and Li, Q. (2022). Threshold effects of vegetation coverage on runoff and soil loss in the Loess Plateau of China: a meta-analysis. Geoderma 412, 115720. doi:10.1016/j.geoderma.2022.115720
Zhang, Z., Wang, C., Wang, M., Wang, Z., and Zhang, H. (2018). Surface deformation monitoring in Zhengzhou city from 2014 to 2016 using time-series InSAR. Remote Sens. 10 (11), 1731. doi:10.3390/rs10111731
Zhao, J., Wang, Z., Dong, Y., Yang, Z., and Govers, G. (2022). How soil erosion and runoff are related to land use, topography and annual precipitation: insights from a meta-analysis of erosion plots in China. Sci. total Environ. 802, 149665. doi:10.1016/j.scitotenv.2021.149665
Keywords: soil erosion, SBAS-InSAR, fractional vegetation cover, Yuanmou dry-hot valley, dry-red soil
Citation: Guo J, Xi W, Huang G, He G, Shi L, Yang Z, Ding Z, Wang L and Cao R (2024) Study on erosion deformation of dry-red soil in Yuanmou dry-hot valley with different elevation gradients based on SBAS-InSAR technology. Front. Earth Sci. 12:1394439. doi: 10.3389/feart.2024.1394439
Received: 01 March 2024; Accepted: 25 March 2024;
Published: 10 April 2024.
Edited by:
Haijun Qiu, Northwest University, ChinaReviewed by:
Jie Liu, Henan Polytechnic University, ChinaCopyright © 2024 Guo, Xi, Huang, He, Shi, Yang, Ding, Wang and Cao. This is an open-access article distributed under the terms of the Creative Commons Attribution License (CC BY). The use, distribution or reproduction in other forums is permitted, provided the original author(s) and the copyright owner(s) are credited and that the original publication in this journal is cited, in accordance with accepted academic practice. No use, distribution or reproduction is permitted which does not comply with these terms.
*Correspondence: Wenfei Xi, d2VuZmVpeGlAeW5udS5lZHUuY24=; Guangcai Huang, Z3VhbmdjYWkyMDIwQDE2My5jb20=
Disclaimer: All claims expressed in this article are solely those of the authors and do not necessarily represent those of their affiliated organizations, or those of the publisher, the editors and the reviewers. Any product that may be evaluated in this article or claim that may be made by its manufacturer is not guaranteed or endorsed by the publisher.
Research integrity at Frontiers
Learn more about the work of our research integrity team to safeguard the quality of each article we publish.