 Fátima Viveiros
 Catarina Silva
 Catarina Goulart1
 Teresa Ferreira
94% of researchers rate our articles as excellent or good
Learn more about the work of our research integrity team to safeguard the quality of each article we publish.
Find out more
ORIGINAL RESEARCH article
Front. Earth Sci., 09 May 2024
Sec. Volcanology
Volume 12 - 2024 | https://doi.org/10.3389/feart.2024.1392722
This article is part of the Research TopicWomen in Science: Volcanology 2022View all 14 articles
Carbon dioxide released permanently from soils in diffuse degassing areas may constitute a permanent hazard for the population. Several villages in the Azores archipelago (Portugal) are placed in areas with anomalous soil CO2 degassing and lethal indoor CO2 concentration (>10 vol%) has been already recorded in some buildings. The 2021-2022 dislodgements of population at Vulcano (Italy) and La Palma (Spain) volcanic islands due to high soil CO2 degassing highlight the importance of defining criteria to produce human CO2 exposure risk maps, which are useful to mitigate the risk and should constitute valuable tools for land-use planners. Risk is assessed in the current study by combining susceptibility, exposure, and vulnerability maps. The defined criteria were applied to two villages in Furnas Volcano (São Miguel Island, Azores), showing that 58% and 98% of the buildings, respectively, at Furnas and Ribeira Quente villages are at high risk of CO2 exposure.
Volcanic gases can pose a permanent threat to the population not only during eruptive episodes but also in quiescent volcanic phases, since gases may be continuously released from the volcanic edifice (Blong, 1984; Hansell and Oppenheimer, 2004; Edmonds et al., 2015; Fischer and Chiodini, 2015; Williams-Jones and Rymer, 2015). Some volcanic gases are toxic even in low concentrations (e.g., H2S, HF, HCl, and SO2), while others, such as CO2, are dangerous only if present in such concentrations that act as an inert asphyxiant and displace oxygen in the air down to dangerously low levels (Weinstein and Cook, 2005).
Carbon dioxide, an odorless and colorless gas, is immediately dangerous to human life above 10 vol%, causing rapid loss of consciousness, asphyxiation, and death (NIOSH, 1976; Le Guern et al., 1982; Blong, 1984; Wong, 1996; NIOSH, 2019; IVHHN, 2024). Symptoms associated with CO2 exposure include breathing acceleration, dyspnea, increased heart rate, headaches, sweating, dizziness, ringing in the ears, vertigo, vomiting, and muscular weakness (e.g., Blong, 1984; Wong, 1996; IVHHN, 2024). A CO2 concentration of 3 vol% has been defined as the Short-Term Exposure Limit (STEL), and 0.5 vol% as the limit for an 8 h exposure (TWA—Time-Weighted Average) (NIOSH, 2019).
CO2 is one of the most abundant volcanic volatiles and it is the main gas released in diffuse degassing areas. It may accumulate hazardously in poorly ventilated or depressed zones since it is denser than air at standard temperature and pressure (STP) (NIOSH, 1976; Chiodini et al., 1998; Viveiros et al., 2016). Together with the fumarolic fields, soil diffuse degassing areas are potentially one of the main hazardous zones in quiescent volcanic regions since the gases (usually CO2, H2S, and 222Rn) are continuously released from soils and can ingress into buildings without being acknowledged by the population (e.g., Barberi et al., 2007; Edmonds et al., 2015; Viveiros et al., 2016; Barberi et al., 2019; Carapezza et al., 2020; Carapezza et al., 2023).
Even considering that CO2 is often a neglected natural risk (D'Alessandro, 2006), in the last decades more than 2,000 deaths were reported in volcanic areas associated with this gas (Hansell and Oppenheimer, 2004; Weinstein and Cook, 2005; Hansell et al., 2006; Edmonds et al., 2015). The most tragic events were the Dieng Plateau (Indonesia) gas cloud emission, which caused the death of at least 142 persons (Le Guern et al., 1982; Allard et al., 1989), and the gas release from lakes Monoun (1984) and Nyos (1986) in Cameroon, responsible for the death of about 39 and 1700 persons, respectively (Barberi et al., 1989; Baxter and Kapila, 1989; Brown et al., 2017). CO2 has been also responsible for fatal incidents in quiescent areas of Central Italy (Annunziatellis et al., 2003; Beaubien et al., 2003; Carapezza et al., 2003; Barberi et al., 2007; Costa et al., 2008; Barberi et al., 2019; Carapezza et al., 2023), United States (Mammoth Mountain) (Farrar et al., 1995; Sorey et al., 1998) or Japan (Hakkoda volcanic complex) (Hernández et al., 2003). Deaths are also commonly associated with the so-known “mazuku” in DR Congo, associated with the diffuse degassing processes of the Nyiragongo and Nyamulagira active volcanoes. The number of fatalities in these areas is difficult to quantify (Smets et al., 2010; Balagizi et al., 2018; Boudoire et al., 2022).
In what concerns the Azores archipelago (Figure 1), during non-eruptive phases, in 1992, two visitors of Furna do Enxofre lava cave (Graciosa Island) died due to the silent and permanent emission of CO2 occurred. CO2 concentrations above 15 vol% were measured on the day after the incident in the deepest and non-ventilated area of the cave (Gaspar et al., 1998; Viveiros, 2003). A fatality inside an abandoned water well at Mosteiros village (São Miguel Island) at the end of the 1980 s seems to be also attributed to high CO2 concentrations, even if no measurements were performed at that time. In addition to the deaths associated with the diffuse degassing areas, incidents in the hydrothermal fumarolic fields also occurred in the last decades causing the death of at least two persons due to severe burns. Five of the 250 syn-eruptive fatalities were also associated with inhalation of volcanic gases (Viveiros, 2003; Gaspar et al., 2015). In the last 25 years, several families in the islands of S. Miguel and Faial were dislodged due to hazardous indoor CO2 concentrations (Viveiros et al., 2015).
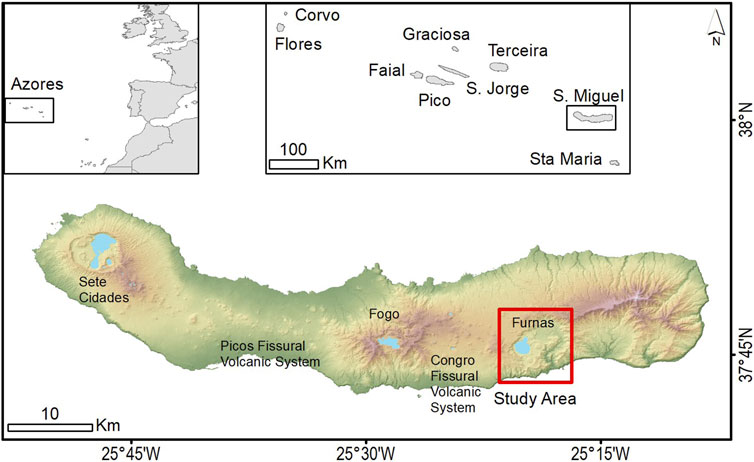
Figure 1. Azores location and Study area on São Miguel Island using the vectorial base cartography of the Azores by Instituto Geográfico do Exército (IgeoE), 2001. DEM of São Miguel Island built using the same source altimetry themes. The active volcanic systems that form São Miguel Island are identified. World countries theme from ArcGISonline. GCS—WGS1984.
The discomfort higher indoor CO2 may cause on the population is usually associated with the so-called “sick building syndrome” (e.g., Wittczak et al., 2001) and it is not necessarily applied to volcanic environments, but mainly due to occupation coupled with reduced ventilation. The impact higher indoor CO2 levels may have on human health has been already highlighted (e.g., Erdmann and Apte, 2004; Satish et al., 2012) in several non-volcanic environments. Recently, Stewart et al. (2022) carried out a review on the impacts volcanic air pollution may have on human health, and most of the effects were associated with the acidic SO2, and the only studies focusing on CO2 were carried out in the Azores archipelago, specifically at Furnas Volcano (Amaral and Rodrigues, 2007; Linhares et al., 2015). More recently, Carapezza et al. (2023) also discriminated potential health impacts (increased risk of mortality and diseases of the central nervous system) due to significantly higher CO2 emission in an Italian residential area.
Given the possible impact CO2 may have on human health, and the silent ingress of the gas in buildings located in diffuse degassing areas, identification of anomalous soil CO2 is crucial to reduce the risk of exposure on the volcanic degassing sites (Viveiros et al., 2009; 2010). In what concerns outdoor environments, CO2 usually dilutes in the atmosphere, as shown by several gas dispersion models applied in diffuse degassing sites (Pareschi et al., 1999; Costa et al., 2008; Chiodini et al., 2010; Granieri et al., 2013; Massaro et al., 2021; Massaro et al., 2022; Rave-Bonilla et al., 2023; Viveiros et al., 2023). However, under certain circumstances and in confined spaces, hazardous concentrations may still be detected (Diliberto et al., 2021; Viveiros et al., 2023). Hazard maps produced based on the dispersion models do not account for indoor CO2 exposure, where lethal concentrations may be detected (Viveiros et al., 2009; Viveiros et al., 2015; Barberi et al., 2019; Carapezza et al., 2023).
Indoor CO2 measurements are difficult to assess due to permits and the general unavailability of the population. Literature shows indoor measurements, up to the moment, mainly in the Azores archipelago (Viveiros et al., 2009; Silva et al., 2015a; Viveiros et al., 2015; Viveiros et al., 2016), and in some Italian areas (Carapezza et al., 2003; Barberi et al., 2019; Carapezza et al., 2023; Carapezza et al., 2015). Few studies (Baxter et al., 1999; Annunziatellis et al., 2003; Viveiros et al., 2015; Barberi et al., 2019; Carapezza et al., 2023) show that soil CO2 flux/concentration maps have been used to identify anomalous zones in volcanic/hydrothermal areas and infer potential indoor CO2 exposure. Nevertheless, as far as we are aware, criteria to produce this indoor hazard and/or risk maps based on diffuse degassing are not found in the literature.
This study thus aims to define criteria to produce indoor CO2 risk maps based on the Furnas Volcano study case, which can be extrapolated to other diffuse degassing areas. The criteria are discussed and the results are validated based on indoor CO2 measurements.
Risk is complex and may have several definitions (Aven, 2016; Poljanšek et al., 2017). Risk is applied in the current study as the potential for a loss (e.g., life, property, productive capacity) (Fournier d'Albe, 1979; Corominas et al., 2003; Poljanšek et al., 2017) and will result from the combination of exposure/vulnerability and hazard/susceptibility.
Hazard is set as the probability of occurrence of a potentially damaging event within a specific period and a given area. When the component time is not available, the hazard may be replaced by susceptibility, which is the propensity of an area to be affected by a certain phenomenon independently of the time component (ISDR, 2004; Reichenbach et al., 2018).
On the other side, the United Nations Office for Disaster Risk Reduction expressed exposure as any element (people, edifices, structures, systems, etc.) that is subject to a potential loss (Poljanšek et al., 2017). Vulnerability corresponds to the propensity to damage considering the intrinsic characteristics of the exposed elements (Bonadonna et al., 2021 and references therein).
Furnas Volcano is a trachytic central volcano located in the eastern part of S. Miguel Island (Azores archipelago, Portugal) (Guest et al., 1999). Two subplinian volcanic eruptions occurred since the settlement of the island in the 15th Century, one in 1,439-43 and other in 1,630 (Guest et al., 1999). Two parishes from Povoação County, Furnas and Ribeira Quente, are located, respectively, inside the caldera and in the southern flank of the volcano. Currently various hydrothermal manifestations are observed in this volcanic system, which include low temperature fumaroles, thermal and cold CO2-rich springs (Figure 2A) (Ferreira et al., 2005; Viveiros et al., 2010; Silva et al., 2015a; Silva et al., 2015b; Caliro et al., 2015). Despite the visible gas emissions, an important CO2 diffuse degassing area was recognized below Furnas village in the early nineties (Baxter et al., 1999). Studies carried out in the last two decades showed that the anomalous CO2 degassing areas remained stable (Sousa, 2003; Viveiros et al., 2010; 2012; Pedone et al., 2015; Bagnato et al., 2018; Girault et al., 2022). Viveiros et al. (2010) also identified an important mantle-derived CO2 degassing zone at Ribeira Quente village. A value around 954 t d−1 was estimated for the hydrothermal CO2 diffusely released by the soils at Furnas Volcano (Viveiros et al., 2010; Viveiros et al., 2012). The diffuse degassing studies showed that anomalous zones are essentially associated with the WNW-ESE tectonic structures found out at Furnas Volcano (Viveiros et al., 2010; Carmo et al., 2015). Silva et al. (2015a), Silva et al. (2015b) mapped soil radon (222Rn) anomalies in both villages showing also a good correlation between the anomalous CO2 and 222Rn areas. Hazardous indoor CO2 and 222Rn concentrations were detected in several buildings (Baxter et al., 1999; Viveiros et al., 2009; Silva et al., 2015a; Viveiros et al., 2015; Viveiros et al., 2016), and most of the anomalous indoor CO2 were associated with extreme meteorological conditions, namely decreases in the barometric pressure and periods of rainfall (Viveiros et al., 2009; Viveiros et al., 2016).
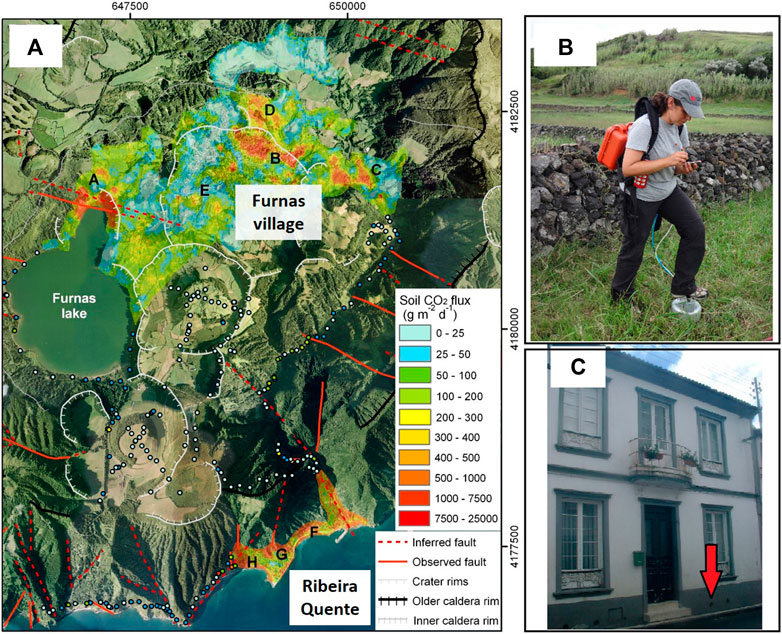
Figure 2. (A) Furnas Volcano soil CO2 flux map based on the sequential Gaussian simulation. The interpolated map results from the average values of 100 equiprobable simulations and the cell size is 10 m. Dots indicate soil CO2 flux measurements that were not interpolated due to the large distances and lack of spatial coverage. The capital letters from “A” to “H” represent the DDS recognized by Viveiros et al., 2010. The base map is the orthophotograph of Furnas Volcano from 2005 by the Regional Government of the Azores (1:5000), coordinate system—UTM; (B) soil CO2 flux measurement using the accumulation chamber methodology; (C) Building with the so-called suspended floor (red arrow points to the vented space between the soil and the edifice’ ground floor).
According to the 2011 survey of population and housing, the two villages located in the Furnas geographical area had 2,206 inhabitants and slightly decreased to 2,081 in the last survey (Censos, 2021). Nevertheless, these numbers, the significant increase of tourists in the last decade in the Azores call the attention that these numbers may be significantly higher during the summer season. Resendes (2004) surveyed Povoação municipality to evaluate the vulnerability of buildings to several geological hazards (explosive volcanic eruptions, earthquakes).
Hazard and/or susceptibility maps will be produced based on the integration of soil CO2 diffuse degassing surveys (Figure 2B) with the identification of the carbon source.
Identification of soil CO2 anomalous zones may be done using different methodologies (such as soil gas fluxes or concentrations) (Gurrieri and Valenza, 1988; Chiodini et al., 1998). Measurements of the soil gas concentration, by inserting a probe in the soil and pumping out the gas from the soil atmosphere to a detector have been used in some volcanic areas (Silva et al., 2015b and references therein). In what concerns the soil gas fluxes, two main methodologies have been used, the so-known accumulation chamber method (Chiodini et al., 1998) and the dynamic concentration method (Gurrieri and Valenza, 1988). Hazard maps can be produced based on either soil CO2 concentration or fluxes. However, we consider that flux measurements are the most adequate to produce the hazard/susceptibility maps since they correspond to the gas released from the soil and that can eventually enter into the buildings. High soil CO2 concentrations may result from gas trapped at a certain depth due to the existence of impermeable layers that do not allow the gas to escape. Thus, in the current study, we use CO2 flux distribution maps as the more appropriate tools to produce CO2 hazard/susceptibility maps. The most widely applied methodology in the last 30 years in volcanic/hydrothermal areas is based on the so-called accumulation chamber method (Chiodini et al., 1998). In this method, an inverted chamber with known volume is placed on the surface and the increment of gas during a certain time corresponds to the gas flux. This method is easily applied and does not need to account with the soil characteristics (e.g., porosity, permeability) (Chiodini et al., 1998).
Together with the selection of the measurement type, the survey strategy is crucial to carry out maps that best represent the anomalous areas. In what concerns the measurements, Lewicki et al. (2005) made some recommendations to survey and analyze the soil CO2 fluxes without disturbing the natural flux. The number of surveyed sites is also relevant to have enough measurements that represent the short-distance degassing structures since gas emission spatial heterogeneity can be high (Tamburello et al., 2018 and references therein). The application of variography allows evaluating the quality of the survey strategy (Isaaks and Srivastava, 1989; Deutsch and Journel, 1998). Cardellini et al. (2003) defined an empirical relation to assess the adequacy of the sampling based on the number of measurements falling in the area contained by a circle with a radius equal to the range of the CO2 flux variogram. These geostatistical tools are important to estimate how representative the survey is of the study site.
The use of a GNSS receiver to plot the measurement location is common in any survey, however, due to the error associated with the receiver (up to a few meters), we suggest that the location is complemented by signing the position in a detailed orthophotograph from the area. This should reduce potential errors of location.
Several studies also showed that environmental factors, such as barometric pressure, wind speed, rainfall, snow coverage, soil and air temperature, might interfere with the CO2 released from soils (e.g., Granieri et al., 2003; Viveiros et al., 2008; Granieri et al., 2010; Rinaldi et al., 2012; Oliveira et al., 2018), causing significant increases even indoor, as showed by Viveiros et al. (2009), Viveiros et al. (2016). Due to these influences, CO2 emissions may also show daily and seasonal variations (Viveiros et al., 2014a; Oliveira et al., 2018). Consequently, degassing maps need to account with these potential variations, and surveys should be performed with stable and similar weather conditions (e.g. Viveiros et al., 2010; Viveiros et al. 2020; Viveiros et al. 2023). Definition of control points are also crucial to evaluate intra-survey variabilities (Viveiros et al., 2020; 2023).
Single points resulting from the gas surveys are plotted on a map and are then interpolated to produce the diffuse degassing maps. Several possible interpolation methods (e.g., Isaaks and Srivastava, 1989) can be selected. The sequential Gaussian simulation (sGs) is performed using the algorithm described by Deutsch and Journel (1998) and has been commonly used as the preferable method to produce the diffuse degassing maps and to estimate the soil CO2 fluxes after Cardellini et al. (2003). This stochastic simulation methodology produces several realizations of the attribute without smoothing the maximum measured values and preserves the spatial variation of the measured variable (Deutsch and Journel, 1998). This methodology allows also estimating the uncertainty of the final map and, for all these reasons, it will be the preferred methodology to apply in the current study. This methodology, however, requests normality of the attribute (interpolated variable), which means frequently transforming the data, using, for example, the normal score (Deutsch and Journel, 1998; Goovaerts et al., 2005). The free WinGslib package (Deutsch and Journel, 1998) is frequently used to perform these simulations. Nevertheless, the application of this method is not exclusive, and any adequate interpolation method that will model the structure of the original data and that is frequently used in gas geochemistry can be selected.
Carbon released from soils in volcanic areas may have different origins: biogenic CO2 includes organic matter decomposition, plants, and fauna respiration, and non-biogenic sources refer to degassing of the terrestrial mantle and magma bodies or even hydrothermal to metamorphic reactions involving carbonates (Irwin and Barnes, 1980; Luo and Zhou, 2006). Discrimination of different carbon sources based on the isotopic composition of the carbon in the CO2 is the preferred methodology (Hoefs, 2004). Chiodini et al. (2008) developed a method that associates the carbon isotopic composition (δ13CCO2) to the efflux, which has been already successfully applied in several areas. When carbon isotopic data is not available, statistical methodologies based on the presence of different populations are an alternative approach to distinguish CO2 origins (Sinclair, 1974; Chiodini et al., 1998).
CO2 is not uniformly released from soils in a volcanic area, but it is restricted to some areas that usually represent fractures or faults in the volcano. Chiodini et al. (2001) defined the areas where the CO2 flux values are anomalously high as diffuse degassing structures (DDS) and represent areas where the gas should have a deep-derived origin. These zones should be the ones prone to accumulate the gas released in hazardous concentrations since are the ones that have a deep contribution. The thresholds to identify DDS are site-dependent and need to be selected based on the data acquired in each area, similar to the biogenic threshold that depends on the existing vegetation.
Production of hazard maps should account with a probabilistic estimation of the gas emitted in space and time. This would imply a time series for the different ranges of CO2 gas concentrations/fluxes, or at least for the biogenic vs deep-derived CO2 contributions. Since several areas may not have this type of register, we suggest considering the diffuse degassing as a permanent emission and evaluating per site if the amount of gas release is somewhat stable, or if it shows significant changes with time (resulting, for instance, of unrest periods of activity). In any of the cases, the available diffuse degassing maps can be used to represent the CO2 emission in the studied period, and we suggest that they can be converted into susceptibility maps, i.e., the prone areas to be affected by the deep-derived CO2 degassing without accounting with the time factor.
We recommend that degassing maps are reconverted in susceptibility areas, which are defined based on the values associated with the biogenic and deep-derived contributions. For easier management of the resulting interpolated maps, and reconversion on the susceptibility zones, other GIS software is usually used (e.g., ArcGIS, QGIS).
We suggest three levels of susceptibility:
a) Low susceptibility zone: soil CO2 flux/concentration < biogenic value
b) Moderate susceptibility zone: biogenic value ≤ soil CO2 flux/concentration < DDS limit
c) High susceptibility zone: soil CO2 flux/concentration ≥ DDS limit
CO2 does not have a direct effect on the materials that constitute the structures but instead acts as an asphyxiant. Consequently, the main exposed elements to be weighted in this analysis are persons due to the possible impact CO2 may have on human health/life. Animals and plants can also be affected but, in the current study, the aim is to evaluate the risk of human exposure to volcanic CO2.
Considering that even if the number of persons exposed in an area can be estimated through the Census, their exact location is not easily assessed, and it would be ethically disapproved. An indirect measure of the exposure of population is accounting for the location of the buildings as CO2 released from soils easily introduces into the buildings and may accumulate in hazardous levels indoors (Viveiros et al., 2009; 2016). On the other side, in outdoor environments, CO2 commonly dilutes and only accumulates in harmful concentrations close to the soil, in depressions, caves, pits, and/or in low-ventilated zones. Thus, in outdoor environments, we suggest that the exposure is evaluated based on the existence of any of these confined spaces.
CO2 released from soil may enter some buildings more easily than in others, depending on the building’s characteristics. We are aware that CO2 may increase indoor due to occupational activities, but this study focuses on the anomalous CO2 that is released from volcanic/hydrothermal soils and that can be an additional contribution to any building, independently of the occupation.
Hazardous indoor CO2 concentrations may be reached indoor when the gas is introduced into the buildings through cracks and irregularities in the wood or concrete floor, and/or through the various piping systems. Buildings may however be prepared with some “gas-resistant” strategies that decrease their vulnerability (Viveiros et al., 2016), such as the implementation of impermeable membranes between the soil and the ground floor. Other measures to decrease the vulnerability include sealing eventual gaps and cracks that exist in the pavement, and installation of natural and artificial ventilation systems (e.g., Viveiros et al., 2015; Viveiros et al., 2016; Gal et al., 2017; Boudoire et al., 2022). Depending on the CO2 emission, it may be needed to implement more than one strategy to reduce the risk and, for this reason, it is crucial to test if the mitigation strategies implemented are effective and reduce the vulnerability of the buildings. Testing these types of measures is out of the scope of the current study, but a detailed evaluation of the buildings with concomitant indoor measurements is useful in future studies.
Considering CO2 is denser than atmospheric air at STP conditions, high CO2 concentrations are also more frequently reached at underground levels, in cellars and basements (Oskarsson et al., 1999; Viveiros et al., 2015; Viveiros et al., 2016). A building with this type of compartment is more vulnerable to the ingress of soil gases.
In the current study, we do not account for the functional vulnerability of the buildings, but only for their location and the potential to have any kind of occupation. Based on the above mentioned, we combine exposure and vulnerability layers and suggest four classes, which are mentioned as “vulnerability”:
a) Low vulnerability: outdoor environment
b) Moderate vulnerability: buildings with mitigation measure for gas hazard (e.g., natural and artificial ventilation systems, impermeable layers)
c) High vulnerability: buildings without any mitigation measure for gas hazard
d) Very high vulnerability: buildings with underground structures and any outdoor structure that may accumulate gas (e.g., depressions, excavations, caves, pits).
We assume in the current study a homogeneous distribution of population by the buildings. The risk associated with human exposure to volcanic CO2 in diffuse degassing areas results, in the current study, from the combination of the CO2 susceptibility and exposure/vulnerability classes (Figure 3).
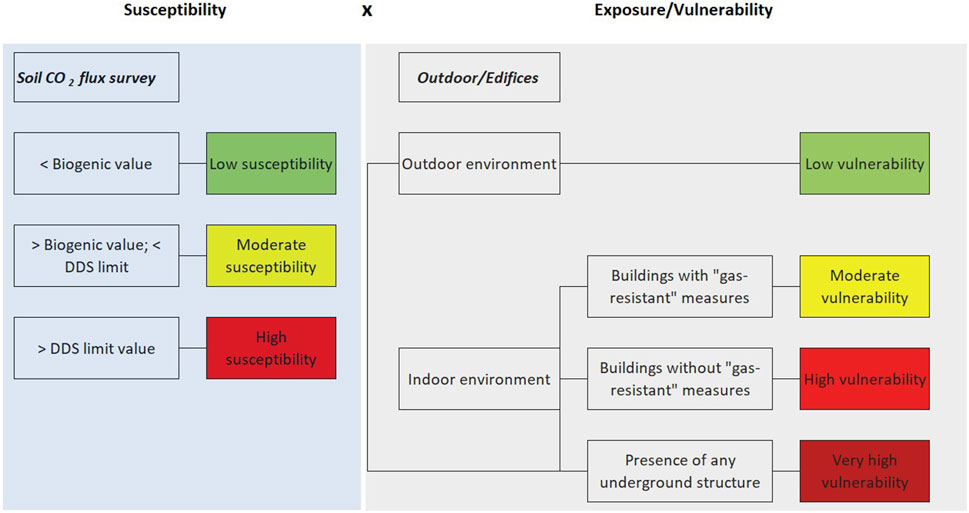
Figure 3. Schematic methodology and criteria used to produce the CO2 risk maps.
We propose a risk scale based on Table 1, where numerical values ranging from 0 to 1 were attributed to the different levels of susceptibility and vulnerability, and four main risk classes were then defined. Final CO2 risk maps should be elaborated by combining susceptibility and vulnerability scales, through GIS software. A third layer named “risk” is added and results from multiplying the values assigned to each vulnerability and susceptibility class, as shown in Table 1.
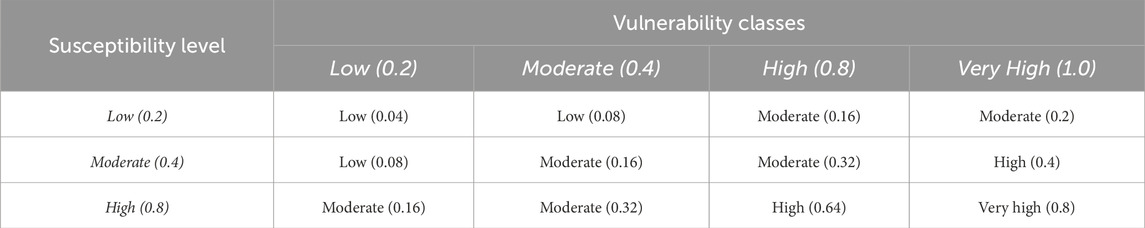
Table 1. Volcanic CO2 exposure risk levels.
Considering that the risk maps for the indoor environment are based on the soil CO2 degassing maps, and not on direct indoor concentrations, the adequacy of the implemented methodology may be evaluated through a cross-check between indoor CO2 concentrations measured in some buildings (when available) and the risk levels defined. For this evaluation, we suggest recording, when possible, time series of the indoor gas variations to best represent short-term and long-term oscillations (Viveiros et al., 2016). Measurements should be done at the ground level and, considering the asphyxiant effect of the CO2 in a few minutes (NIOSH, 1976; IVHHN, 2024), maximum CO2 concentrations during non-ventilated periods are relevant.
Two villages (Furnas and Ribeira Quente) (Figure 2A) located on Furnas Volcano were used as study cases to show the implementation of the above-described method and evaluate its adequacy.
A total of 2,605 soil CO2 flux measurements, using the accumulation chamber method, were performed at Furnas Volcano. Measurements were done in an area with about 6.15 km2 and, due to the anthropic structures existing in the area, an irregular grid was used. The distance between points varied between 50 and 100 m for the areas without buildings, and the measurement spacing decreased to distances between 10 and 15 m for the inhabited areas. The surveys were done with portable CO2 flux instruments manufactured by West Systems S.r.l., which have an infrared CO2 detector (LICOR LI-800) that measures CO2 concentrations in the range from 0 to 20,000 ppm.
Surveys were done in days with stable and similar weather conditions, and in the absence of rain (Viveiros et al., 2010). Permanent soil CO2 flux stations installed in Furnas Volcano (Viveiros et al., 2008) were used as control points to evaluate intra-survey variability, which showed to be within the uncertainty of the portable instruments used.
We interpolated the data with the sequential Gaussian simulation, and we used the WinGslib package (Deutsch and Journel, 1998). However, this method requires normal distribution of the data. Since the original datasets did not show normal distribution, the data was normal score transformed before applying the simulation. The spatial structure of the data was modelled through omnidirectional variograms. The variograms used for Furnas caldera and Ribeira Quente village showed nested structures with spherical and exponential models (Viveiros et al., 2010). Nugget varied between 0.38 and 0.47 confirming the good structure of the surveyed data. The soil CO2 degassing map (Figure 2A) was elaborated based on 100 equiprobable sequential Gaussian simulations and the defined cell grid was 10 m. For more details, see Viveiros et al. (2010).
CO2 was sampled for isotopic analyses through the methodology described by Chiodini et al. (2008), and the analyses were carried out at the INGV—Osservatorio Vesuviano.
Soil CO2 fluxes varied between 0 and values higher than 25,000 g m−2 d−1 at Furnas Volcano (Viveiros et al., 2010) (Figure 2A).
Two main sources of CO2 were identified based on both carbon isotopic data and statistical approaches (Viveiros et al., 2010). Cumulative probability plots applied to the soil CO2 flux data showed different populations indicating the presence of both a biogenic and a volcanic origin for the CO2 released. Carbon isotopic composition of the CO2 varied between −12.28 and −3.11‰ vs. PDB, also pointing to two carbon origins. A value of 25 g m−2 d−1 was modeled as the more reliable biogenic contribution for CO2 emission at Furnas Volcano (Viveiros et al., 2010). Integration of the statistical and carbon isotopic analyses (Figure 5 from Viveiros et al., 2010) allowed us to set up a value of 50 g m−2 d−1 as the limit to identify the DDS.
The soil CO2 degassing maps (Figure 2) were reclassified to produce the CO2 degassing susceptibility maps (Figures 4A, B), based on the thresholds defined for Furnas Volcano. This procedure was applied using the ArcGIS software.

Figure 4. Soil CO2 susceptibility maps for Furnas caldera (A) and Ribeira Quente village (B). Vulnerability maps for Furnas (C), and Ribeira Quente (D) villages. Risk maps for Furnas (E) and Ribeira Quente (F) villages. São Miguel Island vector cartography by Instituto Geográfico do Exército (IGeoE), 2001 (contour lines spaced 5 m; UTM-WGS84, zone 26S).
About 56% and 98% of the sampled areas at Furnas caldera and Ribeira Quente village, respectively, are classified as high soil CO2 susceptibility zones (Figures 4A, B).
The susceptibility maps do not account with the temporal evolution of the CO2 emission, however, and for the specific case of Furnas Volcano, CO2 anomalies seem to have remained stable in the last decades (Baxter et al., 1999; Viveiros et al., 2010; Viveiros et al., 2012; Pedone et al., 2015; Bagnato et al., 2018; Girault et al., 2022).
In what concerns exposure and vulnerability at Furnas Volcano, Resendes (2004) carried out a survey to evaluate buildings’ vulnerability in what concerns natural hazards (essentially earthquakes and volcanic eruptions) at Furnas and Ribeira Quente villages, where, respectively, 1,024 and 443 buildings were surveyed. During this survey, the existence of underground structures in buildings (basements, pits) was also checked.
In terms of mitigation measures to avoid gas hazards, in the Azores archipelago, and especially in some more rural villages, such as the ones under study, artificial ventilation is uncommon. However, as regards natural ventilation, due to the high humidity that affects Furnas village, some edifices have an open ventilated space between the ground and the pavement (Figure 2C), which consists of an old construction type strategy to avoid humidity. This vented space delays gas migration to the buildings, as already demonstrated (Viveiros et al., 2009). Resendes (2004) did not evaluate the presence of these ventilated spaces between the soil and the ground floor (we name it as “suspended floor”), but previous surveys performed during 2000 at Furnas village reported the existence of such type of structural feature (G. Queiroz, Personal Communication, IVAR). That information was recovered and the buildings’ databases were updated.
These previous surveys were used to define the vulnerability classes and the maps concerning human exposure to volcanic CO2 (Figures 4C, D). Respectively, 3% and 7% of the buildings at Furnas and Ribeira Quente villages have basements. Approximately 4% of the surveyed houses at Furnas village have suspended floors. This mitigation measure can be considered as a natural ventilation strategy, as mentioned before. No information about the existence of artificial ventilation was recorded in the above-mentioned surveys.
In what concerns the outdoor environment, no caves are known/mapped in these areas. Pits and confined depressions were not mapped for this study, and a detailed field survey should be scheduled with that scope.
The resulting volcanic/hydrothermal CO2 diffuse risk maps for the Furnas and Ribeira Quente areas are shown in Figures 4E, F. By combining susceptibility and vulnerability levels, respectively, 58% and 98% of the buildings at Furnas and Ribeira Quente villages are in at least high volcanic CO2 risk (Table 2).
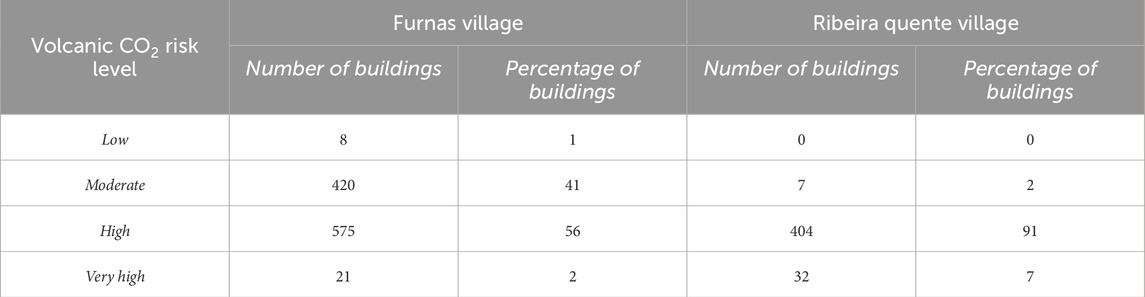
Table 2. Number of buildings within the different volcanic CO2 exposure risk levels for Furnas and Ribeira Quente villages.
CO2 concentrations recorded in some buildings at Furnas Village (Viveiros et al., 2014b; Viveiros et al., 2015 and references therein) were used to evaluate the adequacy of the methodology here proposed. All these measurements were done with detectors from the Geotechnical Instruments (model GA2000 or GA2000 Plus), which have an infrared CO2 detector that measures in the range between 0 and 100 vol%. All the data correspond to measurements carried out at least during 48 h. Gas is pumped through a tube to the detector, and the tube is placed at the ground level for any of the studied compartments.
Table 3 shows the maximum CO2 concentrations measured in six buildings and compares them with the different levels of assigned risk, which vary from moderate to very high. Indoor CO2 concentrations varied from 1.1 vol% to 20.8 vol%, and accounted for different ranges of soil CO2 fluxes (<25 up to 7,500 g m−2 d−1).
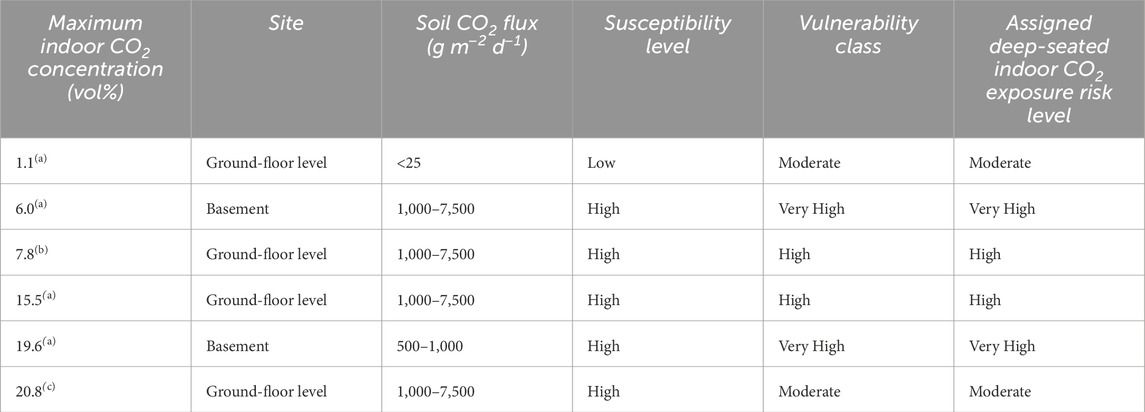
Table 3. Cross-check between the maximum indoor CO2 concentration values measured in some buildings at Furnas village and the CO2 susceptibility and risk levels assigned in this study, as well as the vulnerability classes. (a)Indoor CO2 concentrations as Viveiros et al. (2015) (a), Viveiros et al. (2014b)(b), and Viveiros et al. (2009)(c).
This study constitutes the first approach to produce risk maps of human exposure to anomalous deep-seated (volcanic/hydrothermal) CO2 with criteria that can be extrapolated to any diffuse degassing environment. As far as we are aware, no other studies are found in the literature that attempt to propose risk maps for indoor environments based on soil degassing mapping. Considering the recent unrest period at Vulcano Island (Italy) (Diliberto et al., 2021; Di Martino et al., 2022) as well as the anomalous CO2 degassing detected in La Bombilla and Puerto Naos (La Palma, Spain) after the 2021 volcanic eruption, the application of these methodologies to define susceptibility and risk maps may be helpful tools to be used by authorities and land-use planners.
In the last three decades, a significant amount of diffuse degassing areas have been mapped with various methodologies, and numerous anomalous zones recognized (Werner et al., 2019 and references therein). Soil CO2 fluxes measured with the accumulation chamber method have been the prevalent methodology and these studies are mainly used for volcano monitoring, identification of tectonic structures, and/or quantification of the Earth’s carbon budget (e.g., Chiodini et al., 1998; Cardellini et al., 2017; Tamburello et al., 2018; Werner et al., 2019). In addition to these applications, when buildings are located above CO2 anomalous zones, gases may ingress indoors and frequently reach hazardous concentrations. Soil CO2 concentration/flux maps have been in some cases used as hazard maps (Baxter et al., 1999; Annunziatellis et al., 2003; Carapezza et al., 2011; Carapezza et al., 2012; Viveiros et al., 2015; Diliberto et al., 2021; Di Martino et al., 2022). However, no criteria to define the susceptibility/hazard levels have been discussed in the literature and no attempt to infer the indoor risk of exposure was made.
An ideal approach would be to measure continuously and in real-time indoor and outdoor CO2 concentrations in areas that are recognized as degassing deep-derived CO2. However, together with the cost of such systems, difficulties in having permits to record indoor CO2 data, especially in private buildings, make this task challenging. This study thus aims to obviate this problem by using the already available CO2 degassing maps.
The criteria here defined were tested at Furnas Volcano residential areas, where several soil CO2 degassing maps were available (Baxter et al., 1999; Viveiros et al., 2010; 2012; Pedone et al., 2015; Bagnato et al., 2018; Girault et al., 2022), and showed that spatial CO2 anomalies have remained stable during the last three decades. In addition, hazardous CO2 concentrations have been recorded indoors (Viveiros et al., 2009; Viveiros et al., 2014a; Silva et al., 2015b; Viveiros et al., 2015; Viveiros et al., 2016). The study carried out by Viveiros et al. (2010) accomplishes with the larger areas and, for this reason, the CO2 degassing map was reclassified and converted in a susceptibility map. The three susceptibility classes were allotted based on the CO2 origin and the existence of DDS, criteria that can be easily extended to any other degassing areas. The definition of the biogenic contribution and the DDS threshold is site-dependent and must be set considering for instance the type of vegetation, CO2 fluxes, state of volcanic activity, and existence of impermeable structures (faults, fractures).
Previous studies (Baxter et al., 1999; Sousa, 2003) have estimated that about one-third of Furnas village buildings were located over important deep-derived degassing and, consequently, residents were at risk of exposure to volcanic/hydrothermal CO2. This study encompasses a larger area and not only increases the number of buildings at high risk of exposure to anomalous CO2 at Furnas village (58%) but also shows that approximately 98% of the buildings at Ribeira Quente village have a high or very high risk of anomalous indoor CO2. These results suggest the importance of accounting with CO2 degassing maps for land-use planning and the need to evaluate the presence of diffuse soil gases previously to setting edifices in degassing areas.
The vulnerability classes represent both the exposure and the vulnerability of the exposed elements and were here defined based on the indoor/outdoor environments, as well as on the existence of “gas-resistant” construction strategies in the buildings. Crosscheck tests were done at Furnas village to validate the methodological approach and a good correspondence was obtained between indoor gas concentration and the risk levels assigned (Table 3). Nevertheless, the moderate risk level assigned to a building studied by Viveiros et al. (2009), where indoor CO2 values as high as 20.8 %vol. were measured at the ground floor level, which may put into question the adequacy of the method. The susceptibility level in this case was assigned as high, but the lower vulnerability of the building associated with the vented space between the soil and the ground floor reduced the risk to moderate. As demonstrated before (Viveiros et al., 2009), the existence of these vented spaces reduces and delays the ingress of soil gases into the building, but during persistent and extreme meteorological conditions hazardous, CO2 concentrations can still be measured indoor if no natural/artificial ventilation system is activated. For this reason, we mentioned the need to evaluate the efficiency of the mitigation strategies implemented in the buildings and in some cases, as the one mentioned above, it can be necessary to set up more than one “gas-resistant” code. Further studies need to focus on the vulnerability classes and better characterize the buildings as well as evaluate the adequacy of each mitigation strategy implemented. The vulnerability classes will probably need to consider more than one mitigation strategy but, even considering these limitations, we still decided to present this proposal based on the recommendations from the Disaster Risk Management Knowledge Centre that mentions that it is better to start performing a risk assessment and analysis than wait until better data become available (Poljanšek et al., 2017).
We would like to highlight, however that, based on the CO2 degassing map, all the checked buildings resulted in adequate CO2 susceptibility levels, which suggests the appropriateness of not only the criteria and levels defined but also the survey and methodological approaches used to elaborate the maps. Considering that CO2 fluxes may highly variate at short distances (e.g., Chiodini et al., 1998; Chiodini et al., 2001; Cardellini et al., 2003), it is important that the grid design is detailed enough to account for the variability and well represents the anomalous areas. The study used as a basis to carry out the susceptibility maps (Viveiros et al., 2010) seems adequate for this purpose. In other degassing areas, and even if there is no information about the exposure and/or vulnerability, we suggest that the susceptibility maps can still be used as tools for land-use planners. We are aware of the low number of buildings used in the current study to validate the method, but as mentioned earlier, indoor measurements may be challenging to obtain. It will thus be important to test this methodology in several other degassing areas, and Colli Albani area or Vulcano (Italy), or even the recent degassing episodes at La Palma (Spain) are good candidates for testing.
Due to the characteristics of the CO2, which is denser than air at STP, any underground structure (basements, pits, depressions, excavations, mines) increases the vulnerability, as previously discussed. Consequently, CO2 risk may increase with the presence of any of these underground structures (vulnerability class set up as very high). In some cases, and as a consequence of the increased vulnerability, the high risk of CO2 zones may be associated with moderate susceptibility levels. For this reason, we suggest that construction should be allowed only in the areas defined as low-risk zones. This is particularly relevant if one considers not only the significant increases in the CO2 flux due to meteorological variations (Viveiros et al., 2009; Viveiros et al., 2015; Viveiros et al., 2016) but also that seismic events may cause sudden rises in the soil gas flux, as recently showed by Gresse et al. (2016).
Previous studies carried out in various degassing areas of the Azores (Viveiros et al., 2015) showed hazardous indoor CO2 concentrations in areas identified as “moderate” risk zones (defined based on soil CO2 concentrations >1.5 vol% and <5 vol%), highlighting the need to be restrictive in the authorizations to new constructions. Levels defined for the Azores in what concerns the soil CO2 concentrations (high risk >5 vol%) are in agreement with an Italian regional law from 2012 (N. A00271 19/01/2012). This decree considered that only areas with soil CO2 concentration below 1 vol% are considered suitable for construction, and areas above 5 vol% should be classified as non-building areas (Barberi et al., 2019 and references therein). In between these two CO2 limits, those authors suggested the possibility of applying several mitigation actions. We suggest that similar laws are applied to any degassing area and that limits are set up based not only on the CO2 concentrations but also on the soil CO2 fluxes, which most of the time constitute the available gas data.
Land-use planning legislation must account both with the susceptibility maps as mentioned, but also consider the vulnerability of the buildings and, for this reason, “gas-resistant” construction rules need to be taken into consideration by civil engineers, architects, and any decision-making responsible.
Other hazardous gases, such as 222Rn and H2S, with severe impact on human health (Durand and Scott, 2005; Kim et al., 2016; Kristbjornsdottir et al., 2016), are released from volcanic soils highlighting the need to produce exposure risk maps also for these volatiles. A resulting risk of exposure map for various gases should account for the integration of the individual gas species. For the particular case of Furnas Volcano, 222Rn studies have already been developed on Furnas Volcano (Silva et al., 2015a) showing that 87% of the buildings at Furnas and 99% at Ribeira Quente villages are over anomalous radon degassing. In what concerns H2S, no detailed soil survey was performed, but some punctual soil H2S concentration measurements were done along the main soil diffuse degassing areas showing that this gas is detected essentially near the fumarolic fields. Future studies also need to identify the thermal anomalous zones, since soil gases may show different behaviors associated with the temperature: when soil temperature is high, the CO2 may migrate to the upper floors of the buildings due to the decrease in density, and this should be tested in future studies too.
For outdoor environments, we consider that the best approach is the application of gas dispersion models (e.g., Costa et al., 2008; Massaro et al., 2021; Massaro et al., 2022; Rave-Bonilla et al., 2023; Viveiros et al., 2023), which may identify, based on probabilistic evaluation areas, where CO2 may accumulate in hazardous concentrations. However, Viveiros et al. (2023) recently showed that even if the dispersion models do not display hazardous outdoor CO2 concentrations, some dead animals and high CO2 concentrations were still measured. For this reason, we suggest that the final CO2 risk map for diffuse degassing areas should intersect the methodology now applied with the dispersion models, essentially to identify potential hazardous areas that the dispersion models may miss due to the scale used.
Risk assessment is a complex task that accounts for several variables and criteria. As far as we know this study presents for the first time an approach to estimate the indoor deep-seated (volcanic/hydrothermal) CO2 risk in diffuse degassing areas by combining susceptibility and exposure/vulnerability maps. The tests carried out at Furnas and Ribeira Quente villages (São Miguel, Azores) show that residents from the majority of buildings are at least at high risk of exposure to anomalous CO2 concentrations Susceptibility classes were defined based on the CO2 sources and the existence of diffuse degassing structures (DDS). In order to establish the susceptibility maps based on the degassing CO2 values, it is important to carry out detailed surveys that result in a map as much closer as possible to the CO2 distribution.
Vulnerability classes were performed based on human exposure in outdoor/indoor environments, considering the structure of buildings and the existence of “gas-resistant” codes. By combining the above-mentioned maps, a risk exposure to volcanic-hydrothermal CO2 is estimated. The results need to be validated by performing indoor CO2 measurements. In addition, this methodological approach should be tested in several other degassing areas that may affect edifices.
Some mitigation actions may be applied to reduce the risk of CO2 exposure as mentioned before. Forbidden construction in anomalous degassing areas, usually with susceptibility higher than moderate, should be the more advisable recommendation. However considering the areas where construction already exists, as Furnas and Ribeira Quente villages, some mitigation strategies to reduce the vulnerability can be implemented. Dislodgement of the residents in the high and very high-risk zones may also be a solution difficult to apply due to economic, social, cultural, and political reasons. However, depending on the recorded indoor CO2 concentrations, displacement may be mandatory. “Gas-resistant” codes should be implemented in buildings located in diffuse degassing zones to reduce the gas entry and/or to ventilate the ambient air. Some of these measures include the introduction of natural and/or artificial ventilation systems, such as the installation of under-floor ventilation systems or positive-pressure air-conditioning, for example, and the implementation of impermeable membranes on the ground floor to reduce gas ingress. Other mitigation actions include the installation of permanent real-time monitoring and alarm systems in the buildings located in high and very high-risk zones, as it is already implemented in Caldeiras da Ribeira Grande degassing area (Fogo Volcano, Azores) or Puerto Naos (Cumbre Vieja, Canaries).
Publicly available datasets were analyzed in this study. This data can be found here: Part of the datasets are available in previous publications and were reworked. Databases associated with the exposure/vulnerability will be available under request.
FV: Conceptualization, Data curation, Formal Analysis, Investigation, Methodology, Software, Writing–original draft, Writing–review and editing. CS: Methodology, Writing–original draft, Writing–review and editing. CG: Methodology, Software, Writing–original draft, Writing–review and editing. JG: Formal Analysis, Methodology, Supervision, Writing–original draft, Writing–review and editing. TF: Conceptualization, Funding acquisition, Supervision, Writing–original draft, Writing–review and editing.
The author(s) declare that financial support was received for the research, authorship, and/or publication of this article. This work was partially supported by the project VOLRISKMAC II—Fortalecimiento de las capacidades de I+D+i para el desarrollo de la resiliencia frente a emergencias volcánicas en la Macaronesia (INTERREG MAC MAC2/3.5b/328).
The authors would like to thank G. Queiroz (IVAR—Universidade dos Açores) for sharing results associated with the characterization of the buildings located at Furnas Volcano and that contribute to defining vulnerability classes.
The authors declare that the research was conducted in the absence of any commercial or financial relationships that could be construed as a potential conflict of interest.
All claims expressed in this article are solely those of the authors and do not necessarily represent those of their affiliated organizations, or those of the publisher, the editors and the reviewers. Any product that may be evaluated in this article, or claim that may be made by its manufacturer, is not guaranteed or endorsed by the publisher.
Allard, P., Dajlevic, D., and Delarue, C. (1989). Origin of carbon dioxide emanation from the 1979 Dieng eruption, Indonesia: implications for the origin of the 1986 Nyos catastrophe. J. Volcanol. Geotherm. Res. 39, 195–206. doi:10.1016/0377-0273(89)90058-9
Amaral, A. F., and Rodrigues, A. S. (2007). Chronic exposure to volcanic environments and chronic bronchitis incidence in the Azores, Portugal. Environ. Res. 103, 419–423. doi:10.1016/j.envres.2006.06.016
Annunziatellis, A., Ciotoli, G., Lombardi, S., and Nolasco, F. (2003). Short- and long-term gas hazard: the release of toxic gases in the Alban Hills volcanic area (central Italy). J. Geochem Explor 77, 93–108. doi:10.1016/S0375-6742(02)00272-8
Aven, T. (2016). Risk assessment and risk management: review of recent advances on their foundation. Eur. J. Oper. Res. 253 (1), 1–13. doi:10.1016/j.ejor.2015.12.023
Bagnato, E., Viveiros, F., Pacheco, J. E., D'agostino, F., Silva, C., and Zanon, V. (2018). Hg and CO2 emissions from soil diffuse degassing and fumaroles at Furnas Volcano (São Miguel, Azores): gas flux and thermal energy output. J. Geochem Explor 190, 39–57. doi:10.1016/j.gexplo.2018.02.017
Balagizi, C. M., Kies, A., Kasereka, M. M., Tedesco, D., Yalire, M. M., and McCausland, W. A. (2018). Natural hazards in goma and the surrounding villages, east african rift system. Nat. Hazards 93, 31–66. doi:10.1007/s11069-018-3288-x
Barberi, F., Carapezza, M. L., Ranaldi, M., and Tarchini, L. (2007). Gas blowout from shallow boreholes at Fiumicino (Rome): induced hazard and evidence of deep CO2 degassing on the Tyrrhenian margin of Central Italy. J. Volcanol. Geotherm. Res. 165, 17–31. doi:10.1016/j.jvolgeores.2007.04.009
Barberi, F., Carapezza, M. L., Tarchini, L., Ranaldi, M., Ricci, T., and Gattuso, A. (2019). Anomalous discharge of endogenous gas at Lavinio (Rome, Italy) and the lethal accident of 5 September 2011. GeoHealth 3, 407–422. doi:10.1029/2019GH000211
Barberi, F., Chelini, W., Marinelli, G., and Martini, M. (1989). The gas cloud of Lake Nyos (Cameroon, 1986): results of the Italian technical mission. J. Volcanol. Geotherm. Res. 39, 125–134. doi:10.1016/0377-0273(89)90053-X
Baxter, P., Baubron, J. C., and Coutinho, R. (1999). Health hazards and disaster potential of ground gas emissions at Furnas Volcano, São Miguel, Azores. J. Volcanol. Geotherm. Res. 92, 95–106. doi:10.1016/S0377-0273(99)00070-0
Baxter, P., and Kapila, M. (1989). Acute health impact of the gas release at Lake Nyos, Cameroon, 1986. J. Volcanol. Geotherm. Res. 39, 265–275. doi:10.1016/0377-0273(89)90064-4
Beaubien, S. E., Ciotoli, G., and Lombardi, S. (2003). Carbon dioxide and radon gas hazard in the Alban Hills area (central Italy). J. Volcanol. Geotherm. Res. 123, 63–80. doi:10.1016/S0377-0273(03)00028-3
Blong, R. J. (1984). Volcanic hazards. A sourcebook on the effects of eruptions. Academic Pres, 424.
Bonadonna, C., Frischknecht, C., Menoni, S., Romerio, F., Gregg, C. E., Rosi, M., et al. (2021). Integrating hazard, exposure, vulnerability and resilience for risk and emergency management in a volcanic context: the ADVISE model. J. Appl. Volcanol. 10, 7. doi:10.1186/s13617-021-00108-5
Boudoire, G., Calabrese, S., Colacicco, A., Sordini, P., Habakaramo Macumu, P., Rafflin, V., et al. (2022). Scientific response to the 2021 eruption of Nyiragongo based on the implementation of a participatory monitoring system. Sci. Rep. 12, 7488. doi:10.1038/s41598-022-11149-0
Brown, S. K., Jenkins, S. F., Sparks, R. S. J., Odbert, H., and Auker, M. R. (2017). Volcanic fatalities database: analysis of volcanic threat with distance and victim classification. J. Appl. Volcanol. 6, 15. doi:10.1186/s13617-017-0067-4
Caliro, S., Viveiros, F., Chiodini, G., and Ferreira, T. (2015). Gas geochemistry of hydrothermal fluids of the S. Miguel and terceira islands, Azores. Geochim. Cosmochim. Acta 168, 43–57. doi:10.1016/j.gca.2015.07.009
Carapezza, M. L., Badalamenti, B., Cavarra, L., and Scalzo, A. (2003). Gas hazard assessment in a densely inhabited area of Colli Albani Volcano (Cava dei Selci, Roma). J. Volcanol. Geotherm. Res. 123, 81–94. doi:10.1016/S0377-0273(03)00029-5
Carapezza, M. L., Barberi, F., Ranaldi, M., Ricci, T., Tarchini, L., Barrancos, J., et al. (2012). Hazardous gas emissions from the flanks of the quiescent Colli Albani volcano (Rome, Italy). Appl. Geochem 27, 1767–1782. doi:10.1016/j.apgeochem.2012.02.012
Carapezza, M. L., Barberi, F., Ranaldi, M., Ricci, T., Tarchini, L., Barrancos, J., et al. (2011). Diffuse CO2 soil degassing and CO2 and H2S concentrations in air and related hazards at Vulcano Island (Aeolian arc, Italy). J. Volcanol. Geotherm. Res. 207 (3), 130–144. doi:10.1016/j.jvolgeores.2011.06.010
Carapezza, M. L., Ranaldi, M., Tarchini, L., Gattuso, A., Pagliuca, N. M., Vinci, M., et al. (2020). Dangerous emissions of endogenous CO2 and H2S from gas blowouts of shallow wells in the Rome Municipality (Italy). Appl. Geochem 123, 104769. doi:10.1016/j.apgeochem.2020.104769
Carapezza, M. L., Tarchini, L., Ancona, C., Forastiere, F., Ranaldi, M., Ricci, T., et al. (2023). Health impact of natural gas emission at Cava dei Selci residential zone (metropolitan city of Rome, Italy). Environ. Geochem Health 45 (3), 707–729. doi:10.1007/s10653-022-01244-6
Carapezza, M. L., Tarchini, L., Granieri, D., Martelli, M., Gattuso, A., Pagliuca, N., et al. (2015). Gas blowout from shallow boreholes near Fiumicino International Airport (Rome): gas origin and hazard assessment. Chem. Geol. 407, 54–65. doi:10.1016/j.chemgeo.2015.04.022
Cardellini, C., Chiodini, G., and Frondini, F. (2003). Application of stochastic simulation to CO2 flux from soil: mapping and quantification of gas release. J. Geophys Res. 108 (B9), 2425. doi:10.1029/2002JB002165
Cardellini, C., Chiodini, G., Frondini, F., Avino, R., Bagnato, E., Caliro, S., et al. (2017). Monitoring diffuse volcanic degassing during volcanic unrests: the case of Campi Flegrei (Italy). Sci Rep. 7 (10), 6757. doi:10.1038/s41598-017-06941-2
Carmo, R., Madeira, J., Ferreira, T., Queiroz, G., and Hipólito, A. (2015). “Volcano-Tectonic structures of S. Miguel island, Azores,” in Volcanic geology of S. Miguel island (Azores archipelago). Editors J. L. Gaspar, J. E. Guest, A. M. Duncan, F. J. A. S. Barriga, and D. K. Chester (London: Geological Society), 65–86. doi:10.1144/M44.6
Censos (2021). Instituto Nacional de Estatística, Recenseamento Geral da População e Habitação. Available at: https://www.pordata.pt/censos/resultados/emdestaque-portugal-1075.
Chiodini, G., Caliro, S., Cardellini, C., Avino, R., Granieri, D., and Schmidt, A. (2008). Carbon isotopic composition of soil CO2 efflux, a powerful method to discriminate different sources feeding soil CO2 degassing in volcanic-hydrothermal areas. Earth Planet Sci. Lett. 274, 372–379. doi:10.1016/j.epsl.2008.07.051
Chiodini, G., Cioni, R., Guidi, M., Raco, B., and Marini, L. (1998). Soil CO2 flux measurements in volcanic and geothermal areas. Appl. Geochem 13, 543–552. doi:10.1016/S0883-2927(97)00076-0
Chiodini, G., Frondini, F., Cardellini, C., Granieri, D., Marini, L., and Ventura, G. (2001). CO2 degassing and energy release at solfatara volcano, campi flegrei, Italy. J. Geophys Res. 106, 16213–16221. doi:10.1029/2001JB000246
Chiodini, G., Granieri, D., Avino, R., Caliro, S., Costa, A., Minopoli, C., et al. (2010). Non volcanic CO2 earth degassing: the case of Mefite di Ansanto (Southern Apennines), Italy. Geophys Res. Lett. 7, L11303. doi:10.1029/2010GL042858
Corominas, J., Copons, R., Vilaplana, J. M., Altimir, J., and Amigó, J. (2003). Integrated landslide susceptibility analysis and hazard assessment in the principality of Andorra. Nat. Hazards 30, 421–435. doi:10.1023/B:NHAZ.0000007094.74878.d3
Costa, A., Chiodini, G., Granieri, D., Folch, A., Hankin, R. K. S., Caliro, S., et al. (2008). A shallow layer model for heavy gas dispersion from natural sources: application and hazard assessment at Caldara di Manziana, Italy. Geochem Geophys Geosys 9, Q03002. doi:10.1029/2007GC001762
D'Alessandro, W. (2006). Gas hazard: an often neglected natural risk in volcanic areas. Wit Trans. Ecol. Envir 89, 369–378. doi:10.2495/GEO060371
Deutsch, C. V., and Journel, A. G. (1998). GSLIB: geostatistical software library and user’s guide. New York: Oxford Univ. Press, 369.
Diliberto, I. S., Cangemi, M., Gagliano, A. L., Inguaggiato, S., Paz, M. P. J., Madonia, P., et al. (2021). Volcanic Gas Hazard Assessment in the Baia di Levante Area (Vulcano Island, Italy) Inferred by Geochemical Investigation of Passive Fluid Degassing. Geosciences 11 (11), 478. doi:10.3390/geosciences11110478
Di Martino, R. M. R., Gurrieri, S., Camarda, M., Capasso, G., and Prano, V. (2022). Hazardous changes in soil CO2 emissions at Vulcano, Italy, in 2021. J. Geophys. Res. Solid Earth 127 (11), e2022JB024516. doi:10.1029/2022JB024516
Durand, M., and Scott, B. J. (2005). Geothermal ground gas emissions and indoor air pollution in Rotorua, New Zealand. Sci. Total Environ. 345, 69–80. doi:10.1016/j.scitotenv.2004.10.023
Edmonds, M., Grattan, J., and Michnowicz, S. (2015). “Volcanic gases: silent killers,” in Observing the volcano world. Advances in Volcanology. Editors C. J. Fearnley, D. K. Bird, K. Haynes, W. J. McGuire, and G. Jolly (Cham: Springer), 65–83. doi:10.1007/11157_2015_14
Erdmann, C. A., and Apte, M. G. (2004). Mucous membrane and lower respiratory building related symptoms in relation to indoor carbon dioxide concentrations in the 100-building BASE dataset. Indoor air 14 (Suppl. 8), 127–134. doi:10.1111/j.1600-0668.2004.00298.x
Farrar, C. D., Sorey, M. L., Evans, W. C., Howle, J. F., Kerr, B. D., Kennedy, B. M., et al. (1995). Forest-killing diffuse CO2 emission at Mammoth Mountain as a sign of magmatic unrest. Nature 376, 675–678. doi:10.1038/376675a0
Ferreira, T., Gaspar, J. L., Viveiros, F., Marcos, M., Faria, C., and Sousa, F. (2005). Monitoring of fumarole discharge and CO2 soil degassing in the Azores: contribution to volcanic surveillance and public health risk assessment. Ann. Geophys 48 (N.4/5), 787–796.
Fischer, T. P., and Chiodini, G. (2015). “Volcanic gases,” in The encyclopedia of volcanoes. Editor H. Sigmundsson 2nd ed (Academic Press), 779–797. doi:10.1016/B978-0-12-385938-9.00045-6
Fournier d'Albe, E. M. (1979). Objectives of volcanic monitoring and prediction. Journ. Geol. Soc. Lond 136, 321–326. doi:10.1144/gsjgs.136.3.0321
Gal, F., Proust, E., Bentivegna, G., Leconte, S., De Lary De Latour, L., Loschetter, A., et al. (2017). What may be the consequences of a CO2 leakage? Insights from soil gas measurements in an urban area – clermont-ferrand, French massif central. Energy Procedia 114, 3006–3019. doi:10.1016/j.egypro.2017.03.1429
Gaspar, J. L., Ferreira, T., Queiroz, G., Baubron, J. C., and Baxter, P. (1998). High levels of CO2 in the atmosphere of Furna do Enxofre lava cave (Graciosa Island, Azores): a case of public health risk. EC Advanced Study Course 1998. Volcanic Hazard Assessment, Monitoring and Risk Mitigation. European Commission, Environment and Climate Programme (abstract).
Gaspar, J. L., Queiroz, G., Ferreira, T., Medeiros, A. R., Goulart, C., and Medeiros, J. (2015). “Earthquakes and volcanic eruptions in the Azores region: geodynamic implications from major historical events and instrumental seismicity,” in Volcanic geology of São Miguel island (Azores archipelago). Editors J. L. Gaspar, J. E. Guest, A. M. Duncan, F. J. A. S. Barriga, and D. K. Chester (London: Geological Society), 33–49. doi:10.1144/M44.4
Girault, F., Viveiros, F., Silva, C., Thapa, S., Pacheco, J. E., Adhikari, L. B., et al. (2022). Radon signature of CO2 flux constrains the depth of degassing: Furnas volcano (Azores, Portugal) versus Syabru-Bensi (Nepal Himalayas). Sci. Rep. 12, 10837. doi:10.1038/s41598-022-14653-5
Goovaerts, P., Avruskin, G., Meliker, J., Slotnick, M., Jacquez, G. M., and Nriagu, J. (2005). Geostatistical modeling of the spatial variability of arsenic in groundwater of Southeast Michigan. Water Resour. Res. 41 (7), W07013. doi:10.1029/2004WR003705
Granieri, D., Avino, R., and Chiodini, G. (2010). Carbon dioxide diffuse emission from the soil: ten years of observations at Vesuvio and Campi Flegrei (Pozzuoli), and linkages with volcanic activity. Bull. Volcanol. 72, 103–118. doi:10.1007/s00445-009-0304-8
Granieri, D., Chiodini, G., Marzocchi, W., and Avino, R. (2003). Continuous monitoring of CO2 soil diffuse degassing at Phlegraean Fields (Italy): influence of environmental and volcanic parameters. Earth Planet. Sci. Lett. 212, 167–179. doi:10.1016/S0012-821X(03)00232-2
Granieri, D., Costa, A., Macedonio, G., Bisson, M., and Chiodini, G. (2013). Carbon dioxide in the urban area of Naples: Contribution and effects of the volcanic source. J. Volcanol. Geotherm. Res. 260, 52–61. doi:10.1016/j.jvolgeores.2013.05.003
Gresse, M., Vandemeulebrouck, J., Byrdina, S., Chiodini, G., and Bruno, P. P. (2016). Changes in CO2 diffuse degassing induced by the passing of seismic waves. J. Volcanol. Geotherm. Res. 320, 12–18. doi:10.1016/j.jvolgeores.2016.04.019
Guest, J., Gaspar, J. L., Cole, P., Queiroz, G., Duncan, A. M., Wallenstein, N., et al. (1999). Volcanic geology of Furnas Volcano, São Miguel, Azores. J. Volcanol. Geotherm. Res. 92, 1–29. doi:10.1016/S0377-0273(99)00064-5
Gurrieri, S., and Valenza, M. (1988). Gas transport in natural porous mediums: a method for measuring CO2 flows from the ground in volcanic and geothermal areas. Rendiconti della Soc. Ital. Mineral. Petrol. 43, 1151–1158.
Hansell, A., Horwell, C., and Oppenheimer, C. (2006). The health hazards of volcanoes and geothermal areas. Occup. Environ. Med. 63, 149–156. doi:10.1136/oem.2005.022459
Hansell, A., and Oppenheimer, C. (2004). Health hazards from volcanic gases: a systematic literature review. Arch. Environ. Health 59 (No.12), 628–639. doi:10.1080/00039890409602947
Hernández, P., Notsu, K., Tsurumi, M., Mori, T., Ohno, M., Shimoike, Y., et al. (2003). Carbon dioxide emissions from soils at Hakkoda, north Japan. J. Geophys Res. 108 (B4), 2210. doi:10.1029/2002JB001847
Irwin, W. P., and Barnes, I. (1980). Tectonic relations of carbon dioxide discharges and earthquakes. J. Geophys Res. 85, 3115–3121. doi:10.1029/JB085iB06p03115
Isaaks, E. H., and Srivastava, R. M. (1989). An introduction to applied geostatistics. New York: Oxford University Press, 413.
ISDR (2004). Living with risk. A global review of disaster reduction initiatives, volume II. United Nations, New York and Geneva: UN, 127.
IVHHN (2024). Ash pamphlets. Available at: https://www.ivhhn.org/ash-pamphlets.
Kim, S.-H., Hwang, W. J., Cho, J.-S., and Kang, D. R. (2016). Attributable risk of lung cancer deaths due to indoor radon exposure. Ann. Occup. Environ. Med. 28, 8. doi:10.1186/s40557-016-0093-4
Kristbjornsdottir, A., Aspelund, T., and Rafnsson, V. (2016). Association of cancer incidence and duration of residence in geothermal heating area in Iceland: an extended follow-up. PLoS ONE 11 (5), e0155922. doi:10.1371/journal.pone.0155922
Le Guern, F., Tazieff, H., and Faivre Pierret, R. (1982). An example of health hazard: people killed by gas during a phreatic eruption: Dieng Plateau (Java, Indonesia), February 20th 1979. Bull. Volcanol. 45 (2), 153–156. doi:10.1007/BF02600430
Lewicki, J. L., Bergfeld, D., Cardellini, C., Chiodini, G., Granieri, D., Varley, N., et al. (2005). Comparative soil CO2 flux measurements and geostatistical estimation methods on Masaya volcano. Nicar. Bull. Volcanol. 68, 75–90. doi:10.1007/s00445-005-0423-9
Linhares, D., Garcia, P. V., Viveiros, F., Ferreira, T., and Rodrigues, A. S. (2015). Air pollution by hydrothermal volcanism and human pulmonary function. Biomed. Res. Int. 2015, 1–9. doi:10.1155/2015/326794
Massaro, S., Dioguardi, F., Sandri, L., Tamburello, G., Selva, J., Moune, S., et al. (2021). Testing gas dispersion modelling: a case study at La Soufrière volcano (Guadeloupe, Lesser Antilles). J. Volcanol. Geotherm. Res. 417, 107312. doi:10.1016/j.jvolgeores.2021.107312
Massaro, S., Stocchi, M., Tamburello, G., Costa, A., Sandri, L., Caliro, S., et al. (2022). Validating gas dispersion modelling at La solfatara (campi flegrei, south Italy). Nuovo Cimento Soc. Ital. Fis. C 45 (6), 186. doi:10.1393/ncc/i2022-22186-4
NIOSH (1976). NIOSH: criteria for a recommended standard - occupational exposure to carbon dioxide. Available at: https://stacks.cdc.gov/view/cdc/19367.
NIOSH (2019). Immediately dangerous to life or health (IDLH) values. Available at: https://www.cdc.gov/niosh/idlh/default.html.
Oliveira, S., Viveiros, F., Silva, C., and Pacheco, J. E. (2018). Automatic filtering of soil CO2 flux data; different statistical approaches applied to long time series. Front. Earth Sci. 6, 208. doi:10.3389/feart.2018.00208
Oskarsson, N., Pálsson, K., Ólafsson, H., and Ferreira, T. (1999). Experimental monitoring of carbon dioxide by low power IR-sensors: soil degassing in the Furnas Volcanic Centre, Azores. J. Volcanol. Geotherm. Res. 92, 181–193. doi:10.1016/S0377-0273(99)00075-X
Pareschi, M. T., Ranci, M., Valenza, M., and Graziani, G. (1999). The assessment of volcanic gas hazard by means of numerical models: an example from Vulcano Island (Sicily). Geophys Res. Lett. 26 (10), 1405–1408. doi:10.1029/1999GL900248
Pedone, M., Viveiros, F., Aiuppa, A., Giudice, G., Grassa, F., Gagliano, A. L., et al. (2015). Total (fumarolic + diffuse soil) CO2 output from Furnas volcano. Earth Planets Space 67, 174. doi:10.1186/s40623-015-0345-5
Poljanšek, K., Marín Ferrer, M., De Groeve, T., Clark, I., Faivre, N., Peter, D., et al. (2017). Science for disaster risk management 2017: knowing better and losing less. Luxembourg: Publications Office of the European Union. Executive Summary. EUR 28034 EN. doi:10.2760/451402,JRC102482
Rave-Bonilla, Y. P., Jessop, D. E., Moune, S., Garbin, C., and Moretti, R. (2023). Numerical modelling of the volcanic plume dispersion from the hydrothermal system of La Soufrière de Guadeloupe. Volcanica 6 (2), 459–477. doi:10.30909/vol.06.02.459477
Reichenbach, P., Rossi, M., Malamud, B. D., Mihir, M., and Guzzetti, F. (2018). A review of statistically based landslide susceptibility models. Earth-Science Rev. 180, 60–91. doi:10.1016/j.earscirev.2018.03.001
Resendes, J. P. (2004). Contribuição para o estudo dos riscos geológicos no concelho da Povoação (S. Miguel, Açores) e suas implicações em termos de planeamento de emergência Master Thesis. Ponta Delgada, Azores: University of the Azores. (in Portuguese).
Rinaldi, A. P., Vandemeulebrouck, J., Todesco, M., and Viveiros, F. (2012). Effects of atmospheric conditions on surface diffuse degassing. J. Geophys. Res. 117, B11201. doi:10.1029/2012JB009490
Satish, U., Mendell, M. J., Shekhar, K., Hotchi, T., Sullivan, D., Streufert, S., et al. (2012). Is CO2 an indoor pollutant? Direct effects of low-to-moderate CO2 concentrations on human decision-making performance. Environ. Health Perspect. 120 (12), 1671–1677. doi:10.1289/ehp.1104789
Silva, C., Ferreira, T., Viveiros, F., and Allard, P. (2015a). Soil radon (222Rn) monitoring at Furnas Volcano (São Miguel, Azores): applications and challenges. Eur. Phys. J. Spec. Top. 224 (4), 659–686. doi:10.1140/epjst/e2015-02398-6
Silva, C., Viveiros, F., Ferreira, T., Gaspar, J. L., and Allard, P. (2015b). “– diffuse soil emanations of radon and hazard implications at Furnas Volcano, São Miguel island (Azores),” in Volcanic geology of São Miguel island (Azores archipelago). Editors J. L. Gaspar, J. E. Guest, A. M. Duncan, F. J. A. S. Barriga, and D. K. Chester (London: Geological Society of London Memoir), 197–211. doi:10.1144/M44.15
Sinclair, A. J. (1974). Selection of threshold values in geochemical data using probability graphs. J. Geochem Explor 3, 129–149. doi:10.1016/0375-6742(74)90030-2
Smets, B., Tedesco, D., Kervyn, F., Kies, A., Vaselli, O., and Yalire, M. M. (2010). Dry gas vents (“mazuku”) in Goma region (North-Kivu, Democratic Republic of Congo): formation and risk assessment. J. Afr. Earth Sci. 58 (5), 787–798. doi:10.1016/j.jafrearsci.2010.04.008
Sorey, M. L., Evans, W. C., Kennedy, B. M., Farrar, C. D., Hainsworth, L. J., and Hausback, B. (1998). Carbon dioxide and helium emissions from a reservoir of magmatic gas beneath Mammoth Mountain, California. J. Geophys Res. 103 (B7), 15303–15323. doi:10.1029/98JB01389
Sousa, F. (2003). Cartografia de anomalias geoquímicas associadas a processos de desgaseificação difusa no Vulcão das Furnas (S. Miguel, Açores): contribuição para a avaliação de riscos vulcânicos Master Thesis. Ponta Delgada, Azores: University of Azores. (In Portuguese).
Stewart, C., Damby, D. E., Horwell, C. J., Elias, T., Ilyinskaya, E., Tomašek, I., et al. (2022). Volcanic air pollution and human health: recent advances and future directions. Bull. Volcanol. 84, 11. doi:10.1007/s00445-021-01513-9
Tamburello, G., Pondrelli, S., Chiodini, G., and Rouwet, D. (2018). Global-scale control of extensional tectonics on CO2 earth degassing. Nat. Commun. 9, 4608. doi:10.1038/s41467-018-07087-z
Viveiros, F. (2003). Contribuição para o estudo dos processos de desgaseificação difusa nos Açores no âmbito da monitorização sismovulcânica e da avaliação do risco: discriminação de factores que influenciam a variação do fluxo de CO2 Master Thesis. Ponta Delgada, Azores: University of the Azores. (in Portuguese).
Viveiros, F., Baldoni, E., Massaro, S., Stocchi, M., Costa, A., Caliro, S., et al. (2023). Quantification of CO2 degassing and atmospheric dispersion at Caldeiras da Ribeira Grande (São Miguel Island, Azores). J. Volcanol. Geotherm. Res. 438, 107807. doi:10.1016/j.jvolgeores.2023.107807
Viveiros, F., Cardellini, C., Ferreira, T., Caliro, S., Chiodini, G., and Silva, C. (2010). Soil CO2 emissions at Furnas volcano, São Miguel Island, Azores archipelago: volcano monitoring perspectives, geomorphologic studies, and land use planning application. J. Geophys Res. 115, B12208. doi:10.1029/2010jb007555
Viveiros, F., Cardellini, C., Ferreira, T., and Silva, C. (2012). Contribution of CO2 emitted to the atmosphere by diffuse degassing from volcanoes: the Furnas Volcano case study. Int. J. Glob. Warm. 4 (3/4), 287–304. doi:10.1504/ijgw.2012.049444
Viveiros, F., Chiodini, G., Cardellini, C., Caliro, S., Zanon, V., Silva, C., et al. (2020). Deep CO2 emitted at Furnas do Enxofre geothermal area (Terceira Island, Azores archipelago). An approach for determining CO2 sources and total emissions using carbon isotopic data. J. Volcanol. Geotherm. Res. 401, 106968. doi:10.1016/j.jvolgeores.2020.106968
Viveiros, F., Ferreira, T., Cabral Vieira, J., Silva, C., and Gaspar, J. L. (2008). Environmental influences on soil CO2 degassing at Furnas and fogo volcanoes (São Miguel island, Azores archipelago). J. Volcanol. Geotherm. Res. 177, 883–893. doi:10.1016/j.jvolgeores.2008.07.005
Viveiros, F., Ferreira, T., Silva, C., and Gaspar, J. L. (2009). Meteorological factors controlling soil gases and indoor CO2 concentration: a permanent risk in degassing areas. Sci. Tot Environ. 407, 1362–1372. doi:10.1016/j.scitotenv.2008.10.009
Viveiros, F., Gaspar, J. L., Ferreira, T., and Silva, C. (2016). Hazardous indoor CO2 concentrations in volcanic environments. Environ. Pollut. 214, 776–786. doi:10.1016/j.envpol.2016.04.086
Viveiros, F., Gaspar, J. L., Ferreira, T., Silva, C., Marcos, M., and Hipólito, A. (2015). “Mapping of soil CO2 diffuse degassing at São Miguel Island and its public health implications,” in Volcanic geology of S. Miguel island (Azores archipelago). Editors J. L. Gaspar, J. E. Guest, A. M. Duncan, F. J. A. S. Barriga, and D. K. Chester (London: Geological Society), 185–195. doi:10.1144/M44.14
Viveiros, F., Silva, C., and Ferreira, T. (2014a). Caracterização do ar interior (CO2 e 222Rn) no edifício do Observatório Microbiano das Furnas (freguesia das Furnas, ilha de S. Miguel, Açores), 8. DTC.30/CVARG/CIVISA/14.
Viveiros, F., Vandemeulebrouck, J., Rinaldi, A. P., Ferreira, T., Silva, C., and Cruz, J. V. (2014b). Periodic behavior of soil CO2 emissions in diffuse degassing areas of the Azores archipelago: application to seismovolcanic monitoring. J. Geophys. Res. 119 (10), 7578–7597. doi:10.1002/2014JB011118
Weinstein, P., and Cook, A. (2005). “Volcanic emissions and health,” in Essentials of medical geology – impacts of the natural environment on public health. Editors J. A. Centeno, R. B. Finkelman, and O. Selinus (Elsevier), 203–226.
Werner, C., Fischer, T., Aiuppa, A., Edmonds, M., Cardellini, C., Carn, S., et al. (2019). “Carbon dioxide emissions from subaerial volcanic regions: two decades in review,” in Deep carbon: past to present. Editors B. Orcutt, I. Daniel, and R. Dasgupta (Cambridge: Cambridge University Press), 188–236. doi:10.1017/9781108677950.008
Williams-Jones, G., and Rymer, H. (2015). “Hazards of volcanic gases,” in The encyclopedia of volcanoes. Editors H. Sigurdsson, B. Houghton, H. Rymer, J. Stix, and S. McNutt 2nd Ed (USA: American Press), 985–991. doi:10.1016/B978-0-12-385938-9.00057-2
Wittczak, T., Walusiak, J., and Pałczyński, C. (2001). Sick building syndrome - a new problem of occupational medicine. Med. P. R. 52 (5), 369–373. Polish. PMID: 11828852.
Keywords: carbon dioxide, diffuse degassing areas, air pollution, land-use planning, vulnerability, risk assessment
Citation: Viveiros F, Silva C, Goulart C, Gaspar JL and Ferreira T (2024) Soil CO2 flux maps as tools to reduce the risk on soil diffuse degassing areas. Front. Earth Sci. 12:1392722. doi: 10.3389/feart.2024.1392722
Received: 28 February 2024; Accepted: 19 April 2024;
Published: 09 May 2024.
Edited by:
Severine Moune, UMR6524 Laboratoire Magmas et Volcans (LMV), FranceReviewed by:
Paolo Madonia, National Institute of Geophysics and Volcanology (INGV), ItalyCopyright © 2024 Viveiros, Silva, Goulart, Gaspar and Ferreira. This is an open-access article distributed under the terms of the Creative Commons Attribution License (CC BY). The use, distribution or reproduction in other forums is permitted, provided the original author(s) and the copyright owner(s) are credited and that the original publication in this journal is cited, in accordance with accepted academic practice. No use, distribution or reproduction is permitted which does not comply with these terms.
*Correspondence: Fátima Viveiros, bWFyaWEuZmIudml2ZWlyb3NAYXpvcmVzLmdvdi5wdA==
Disclaimer: All claims expressed in this article are solely those of the authors and do not necessarily represent those of their affiliated organizations, or those of the publisher, the editors and the reviewers. Any product that may be evaluated in this article or claim that may be made by its manufacturer is not guaranteed or endorsed by the publisher.
Research integrity at Frontiers
Learn more about the work of our research integrity team to safeguard the quality of each article we publish.