 Hongyue Zhang1,2*
- 1Department of Surveying and Mapping Engineering, College of Geography and Oceanography, Minjiang University, Fuzhou, China
- 2Key Laboratory of Spatial Data Mining and Information Sharing, Ministry of Education, Fuzhou University, Fuzhou, China
The GRACE (Gravity Recovery and Climate Experiment) satellite, operational from its launch in 2002 until October 2017, documented critical changes in global terrestrial water storage, significantly advancing the fields of gravity field analysis, hydrological variations, and environmental monitoring. This study investigates the thematic evolution of 2,966 SCIE-indexed publications on GRACE satellite applications from 2002 to 2022, utilizing co-occurrence network mapping and complex network analysis. Our results indicate a steady growth in GRACE satellite application research, with early publications (2002–2004) achieving an average citation rate exceeding 100, underscoring their substantial impact. Keyword clustering identified four primary research themes: Hydrology and Water Resources, Atmospheric and Environmental Science, Geophysical and Temporal Analysis, and Polar and Glaciological Studies. Over time, these themes have expanded and deepened, transitioning from initial focuses on gravity field computations to hydrological applications, sea level studies, and more specific investigations into water resources, climate change, and advancements in satellite geodesy. Recent research has particularly concentrated on groundwater and water storage issues. Geographically, the United States leads in publication output, impact, and international collaborations, with China following in publication count and network centrality, albeit with potential for improved impact. European countries demonstrate significant influence and centrality within the cooperation network. The evolution index of the international cooperation network shows a significant increase in connectivity from 2002 to 2022, with closer cooperation between countries. There is notable growth in both the number and intensity of collaborations, as evidenced by the rising average degree and average weighted degree. Overall, these indices underscore the evolution towards a more connected and globally integrated research network in GRACE satellite research. Looking forward, technological advancements, enhanced international collaboration, and integration with other data sources will drive future research in GRACE satellite application research, with important implications for addressing global environmental and climate challenges.
1 Introduction
Traditional ground-based gravity monitoring instruments are typically restricted to detecting local gravitational changes, a limitation particularly pronounced in regions with complex terrain. The launch of the GRACE (Gravity Recovery and Climate Experiment) satellites in 2002, however, marked a transformative milestone in the field of satellite gravity research. Developed jointly by NASA and the German Aerospace Center (DLR), this dual-satellite system orbits approximately 500 km above the earth, maintaining a separation of about 220 km (Tapley et al., 2019). Originally tasked with studying variations in Earth’s size, shape, and rotational axis, the applications of GRACE have expanded significantly as satellite resolution technologies advanced. Today, GRACE is integral to a variety of geodetic and environmental monitoring tasks, such as tracking changes in terrestrial water resources, observing the melting of ice caps and glaciers, monitoring sea level fluctuations, and assessing the dynamics of ocean currents and significant seismic events (Yancey, 1997). These capabilities have not only enhanced our understanding of Earth’s gravitational field but also underscored the satellites’ role in a broad range of scientific and practical applications.
Over the past few decades, the Gravity Recovery and Climate Experiment (GRACE) and GRACE Follow-On missions have provided unparalleled insights into Earth’s hydrological cycle, ice sheet dynamics, sea-level trends, and broader climate changes. Initial research primarily focused on developing and validating methodologies for using GRACE data to detect changes in Earth’s surface mass (Swenson and Wahr, 2002; Swenson and Wahr, 2006; Velicogna and Wahr, 2006; Othman et al., 2022), with foundational work by Swenson and Wahr (2002) exploring terrestrial water and ice sheet variations. Subsequent studies, notably by Velicogna and Wahr (2006) and Chen et al. (2006);, advanced our understanding of mass losses in the Antarctic and Greenland ice sheets, underscoring GRACE’s critical role in climate research (Chen et al., 2009). With technological progress, the scope of GRACE satellite applications in monitoring global water resources, particularly groundwater storage, has expanded. Integrating GRACE data with other hydrological and meteorological datasets, Niu et al. (2007); Feng et al. (2013a) evaluated the impacts of human activity and climate change on groundwater depletion, offering fresh insights into global water resource challenges (Mohamed et al., 2024). A review by Tapley et al. (2019) highlighted the contributions of the GRACE project to our comprehension of Earth’s hydrological processes, ice melt, sea-level rise, and climate dynamics, emphasizing the unique value of GRACE data in monitoring global environmental changes. Moreover, the GRACE Follow-On mission introduced cutting-edge advances in satellite gravimetry, as demonstrated by Kvas et al. (2020); Landerer et al. (2020), fostering new opportunities for Earth system science research. In summary, GRACE and its subsequent missions have enriched our understanding of Earth’s physical processes, providing a robust scientific foundation for addressing global environmental challenges.
Despite significant contributions, the integration of GRACE data across different scientific domains remains fragmented. Furthermore, the full potential of GRACE data to inform policy decisions and resource management has yet to be fully realized, presenting critical areas for further investigation and application. This paper overcomes these limitations by employing scientometric methods to conduct a quantitative analysis of the research landscape associated with the GRACE satellites. Scientometrics, a field increasingly utilized across various scientific domains, offers quantitative insights into the development of specific research sub-domains (Li et al., 2021). This approach involves visualizing metrics that provide detailed information about a domain, thus enabling scientometric mapping to reveal diverse aspects of the field. Developed methodologies specifically cater to answering particular research questions, with a focus on analyzing collaboration networks, thematic research clusters, historical evolution patterns, and prevailing topic trends (Chen and Song, 2019). From its origins as a narrowly focused theoretical discipline, scientometrics has expanded into a broadly applied field of indicator research, encompassing diverse areas such as biomedicine, food science, geographic information science, computer science, and remote sensing. Scientometric analyses yield valuable insights into the foundational knowledge, emerging topics, and research trends within these disciplines (Ke et al., 2020; Kodonas et al., 2020; Konur, 2020). Our study specifically aims to identify trends, collaboration patterns, and thematic clusters within GRACE-related research.
To explore the applications of the GRACE and GRACE Follow-On satellites, this study employs bibliometric methods and geographic information visualization technology. We systematically extract, count, and analyze scientific and technological literature related to the GRACE satellite theme, spanning from its initial launch in 2002–2022. This research utilizes kernel density visualization and complex network analysis to characterize the global publication patterns and trends in collaborative networks over time.
The structure of this paper is organized as follows: Section 2 outlines the methodology, describing the data sources and approaches utilized. Section 3 analyzes publication trends and identifies high-impact publications. Section 4 explores research hotspots and the evolution of topics over time. Finally, Section 5 examines spatial differentiation and patterns of collaborative evolution.
2 Data sources and approaches
2.1 Data sources
Given that the GRACE satellite was launched in 2002, the start date for our literature search is set at 1 January 2002. To allow for the accumulation of citations and to assess the influence of the publications, the end date for the papers considered in this study is 31 December 2022. The research involved a comprehensive literature search in the Web of Science SCI-E database focused on the field of remote sensing with specific search terms related to the Gravity Recovery and Climate Experiment (GRACE) and limited to English-language publications. The search, conducted on 29 March 2024. Due to the acronym GRACE encompassing a wide range of literature not directly related to the core topic, discussions with bibliometric experts led to the establishment of a precise search formula.
The finalized search string is as follows:TS=((Gravity Recovery and Climate Experiment) OR (GRACE NEAR/3 satellite*) OR (GRACE NEAR/3 product*) OR (GRACE NEAR/1 gravity) OR (GRACE NEAR/3 data) OR (GRACE NEAR/3 observation)) AND Language=(English). This query is designed to filter out literature that is not relevant to the topic of the GRACE satellite. This approach ensures the retrieval of documents specifically associated with the GRACE missions and their related data, observations, and products, thereby enhancing the relevance and accuracy of the search results in the context of GRACE satellite research. The search results were restricted to documents published in English.
After filtering out records unrelated to the specified themes, a total of 2,966 records were obtained and included in this analysis.
2.2 Tools and approaches
To facilitate the analysis of bibliometric data, several specialized software tools were utilized, each serving a specific function in the research process. Bibexcel is a tool designed for processing bibliographic data, which assists in the creation of co-occurrence matrices and citation networks. References to Bibexcel can often be found in the works of scholars who specialize in bibliometrics, such as Persson (2009). Pajek is a program used for large network analysis and visualization, particularly effective in handling complex data structures. It was developed by Batagelj and Mrvar (1998). Excel, a widely recognized spreadsheet application by Microsoft, supports data manipulation and statistical analysis through its robust functions and intuitive interface. It is frequently used in various research disciplines for data analysis. HistCite is a software designed to visualize the citation links within a collection of scientific papers, helping to trace the development of research topics over time. This tool was developed by Eugene Garfield, a pioneer in the field of bibliometrics (Garfield, 2009). Lastly, VOSviewer is a software tool for constructing and viewing bibliometric networks, which may include journals, researchers, or individual articles, based on co-citations, bibliographic couplings, or co-authorships. It was created by Van Eck and Waltman (2010) who have extensively documented its use and application in scientific mapping.
The tools mentioned above collectively facilitated a comprehensive analysis and visualization of the bibliometric data associated with GRACE satellite research publications. This study utilizes keyword co-occurrence, thematic clustering, and bibliometric statistical methods to identify thematic hotspots and trace evolutionary trends in the application research of the GRACE satellite. Additionally, it employs spatial kernel density analysis and social network analysis to quantify regions with significant research output and identify countries exerting substantial influence in this field.
3 Publication trend analysis
3.1 Publication overview
A statistical analysis of the metadata fields for 2,966 literature records on the topic of GRACE satellite research reveals key information presented in Table 1. Author Keywords, extracted from the ‘DE’ metadata field, and Supplementary Keywords, drawn from the ‘ID’ field, are provided by the Web of Science database. Keywords Plus represents additional keywords supplied by Web of Science, generated based on the titles and abstracts of the cited articles. Author Keywords are those supplied by the authors to succinctly summarize the content of their work and are among the most indicative of the research theme in bibliometric studies.
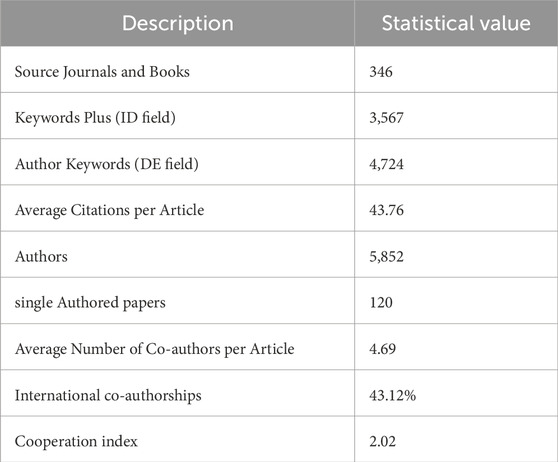
Table 1. Statistics of SCIE literature on GRACE atellite applications.
The data from Table 1 show that the average number of co-authors per GRACE satellite research article is 4.69, and the rate of international co-authorships stands at 43.12%. The cooperation index, calculated as the number of co-authors divided by the number of collaborative publications, is 2.02. This index highlights the degree of collaboration within the field.
3.2 Publication time series analysis
The annual number of publications (NP) and citations per paper (CPP) related to GRACE satellite applications from 2002 to 2022 are illustrated in Figure 1. There is a notable upward trend in the number of publications during this period, indicating a growing interest and activity in the field of GRACE satellite applications. Publications tend to accumulate citations and influence over time; therefore, articles published earlier generally achieve higher impact and receive more citations. Consequently, the period from 2002 to 2004 shows higher average citations per paper (CPP). The year 2004 stands out particularly, with seminal research that utilized GRACE data attracting a significant number of citations, leading to the highest CPP of that year. Following 2004, the general trend in CPP displays a decline, though there are modest increases in 2006 relative to 2005, and in 2009 compared to 2008. This pattern highlights the dynamic nature of research impact and citation practices in the domain of GRACE satellite research.
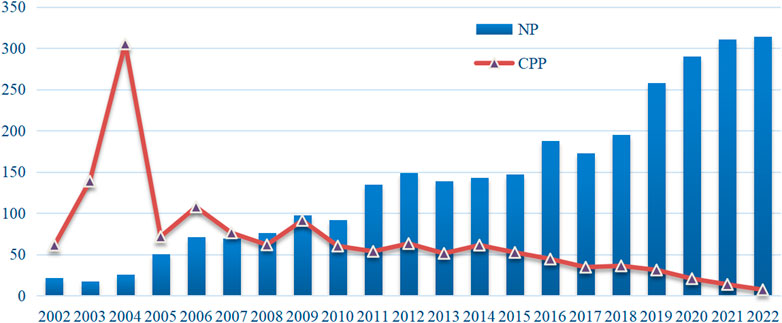
Figure 1. Statistical analysis of the number of published SCIE papers and average citation frequency per paper related to GRACE Satellite from 2002 to 2022 (NP- number of publications; CPP-citations per paper).
The period of GRACE relevant literature from 2002 to 2022 were divided into 3-year time slice to analyze the number of publications and the citations per paper during each time slices, as shown in Figure 2. The quadratic polynomial (
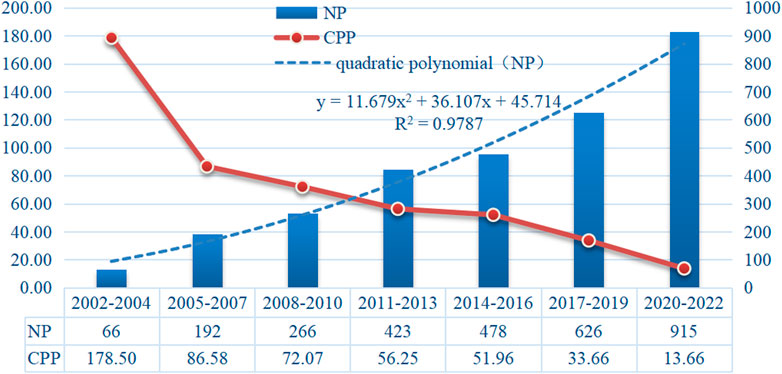
Figure 2. Publication volume and average citations per paper over a 3-year window in GRACE satellite technology literature.
The work of Swenson et al. (2003) demonstrates the precision with which GRACE can detect regional water storage changes, highlighting its utility in refining regional hydrological cycle models. Peltier (2004) study integrates GRACE data with the ICE-5G(VM2) model to investigate the effects of glacial isostatic adjustments on Earth’s surface during the ice age, providing critical insights into the historical climatic impacts on global topography and gravity fields. Similarly, Tapley et al. (2004a) detail the objectives and early results of the GRACE mission in a publication in Geophysical Research Letters, emphasizing its critical role in refining measurements of Earth’s gravity field. These efforts collectively underscore the value of GRACE in advancing our understanding of significant environmental and geological transformations, providing crucial data for ongoing climate research and environmental monitoring.
3.3 High-impact publications
In this study, we utilized HistCite to conduct a citation history analysis of SCIE papers on GRACE satellite applications. Following this analysis, the themes of the 10 most influential articles were identified through a detailed manual review. The top 10 articles were identified based on their Local Citation Score (LCS). LCS indicates the number of times a paper is cited by other papers in a local literature set.
The applications of the GRACE satellites, as demonstrated in a series of high-impact studies in Table 2, showcase its extensive monitoring capabilities across a diverse range of significant fields, from groundwater storage changes to global climate dynamics. The research by Tapley et al. (2004b), published in Science, illustrates GRACE’s ability to detect variations in Earth’s mass, particularly in relation to water resources and climatic phenomena. Subsequently, Rodell et al. (2009) in Nature reported an assessment of groundwater depletion in India using GRACE data, highlighting not only the crisis in groundwater resources but also the value of GRACE data in regional water resource management. Further enhancements in the precision of surface mass change observations were achieved through the studies by Watkins (2015); Save et al. (2016), both published in the Journal of Geophysical Research-Solid Earth. These studies advanced new mascon solutions to reduce data errors and improve measurement accuracy. Moreover, the works of Rodell et al. (2018); Tapley et al. (2019) focus on utilizing GRACE satellite data to understand and predict the impacts of global climate change on water resources, published in Nature Climate Change and Nature, respectively, underscoring GRACE’s critical role in global environmental monitoring. Lastly, the article by Scanlon et al. (2016) in Water Resources Research evaluates the performance of GRACE mascon products in hydrological applications globally, confirming their effectiveness in enhancing the accuracy of hydrological monitoring. Collectively, these studies demonstrate the diverse applications of GRACE satellites in environmental science, from fundamental hydrological monitoring to complex climate model analyses, proving their unique and substantial contributions.
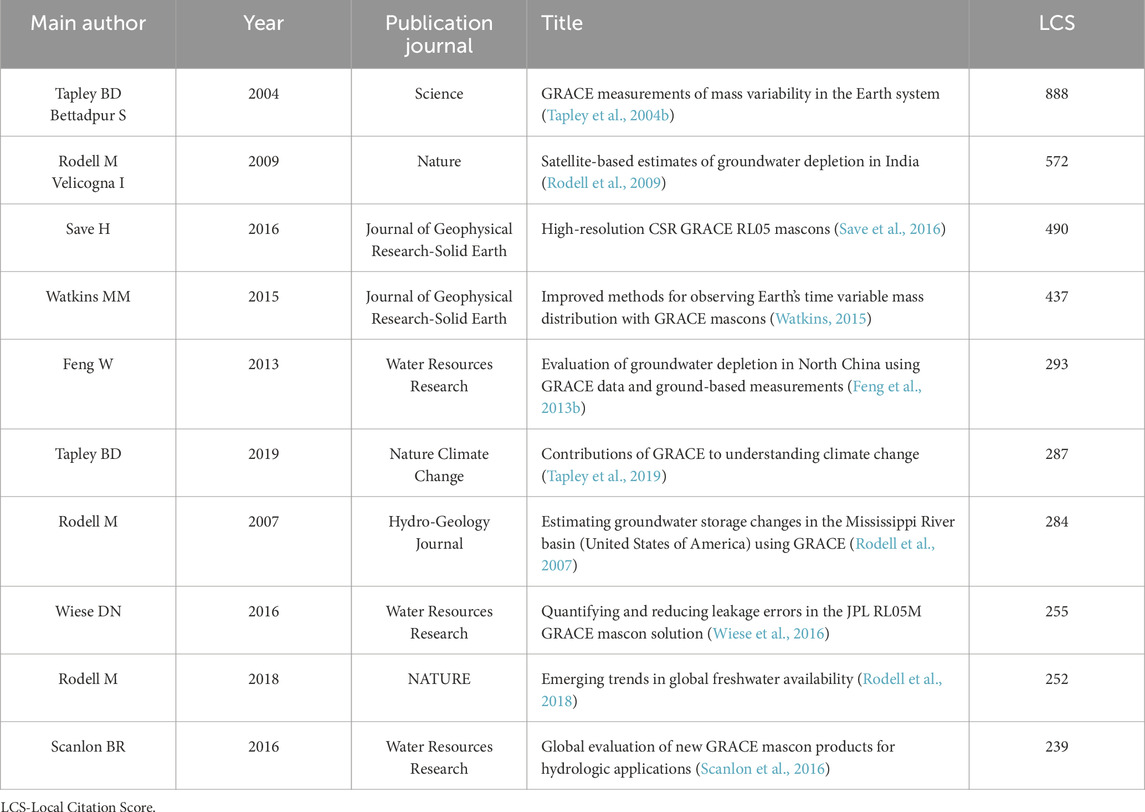
Table 2. Top 10 most influential articles in GRACE satellite applications research in 2002–2022.
4 Research hotspots and topic evolution analysis
Author keywords are typical expressions of the themes of scientific literature. By extracting, cleaning, and analyzing the author keywords (DE field) in literature records, we can understand the themes and development trends of GRACE satellite research.
4.1 Statistical analysis of research hotspots
Following the refinement of author keywords, synonymous terms were consolidated and non-substantive terms were omitted. Consequently, the top 100 author keywords, each with a frequency exceeding 13 occurrences, were identified. Figure 3 presents a word cloud visualization that illustrates the distribution of these keywords based on their frequency, providing a clear depiction of the predominant themes in GRACE relevant studies during 2002–2022. Figure 4 is the radar graph of the top 15 most popular author keywords.
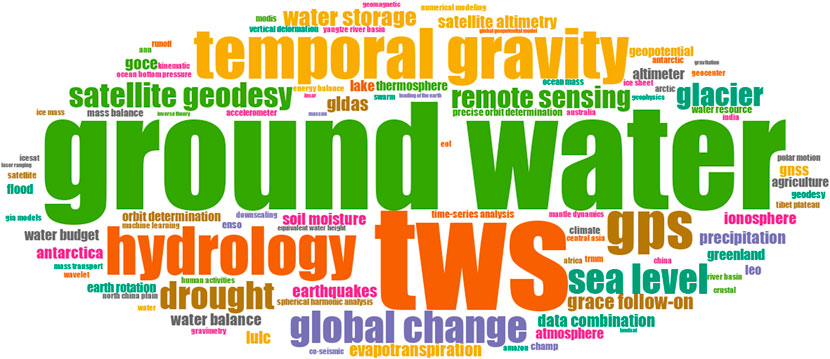
Figure 3. Word cloud of the top 100 keywords after pre-processing.
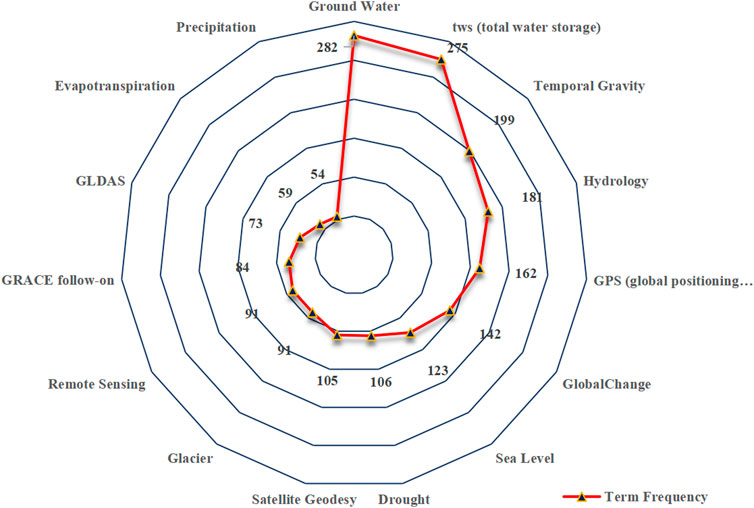
Figure 4. Top 15 most frequently occurring author keywords in GRACE application scientific literature.
The word cloud and radar chart, alongside corresponding data, effectively visualize the prominence of specific keywords in GRACE satellite research, revealing a strong focus on “Ground Water” and “TWS ”(Total Water Storage). These keywords indicate significant research interest in groundwater and water storage capabilities, essential for understanding global water dynamics. Additionally, terms such as “Hydrology”, “Sea Level”, “Drought”, “Evapotranspiration” and “Precipitation” highlight the prioritization of studies on hydrological cycles, water availability, and the impacts of climate variability on water resources. The emphasis on technological and methodological aspects is captured by keywords like “Temporal Gravity”, “GPS” (global positioning system) and “Satellite Geodesy” which reflect the complex technical requirements of measuring and analyzing Earth’s gravitational changes. Keywords such as “Global Change”, “Glacier” and “Sea Level” underscore the research interest in global environmental changes, particularly those affecting natural systems like melting glaciers and rising sea levels. The inclusion of “Remote Sensing” points to the use of advanced technologies for monitoring Earth’s surface and atmosphere, enhancing data collection’s accuracy and scope. Furthermore, “GRACE Follow-On” and “GLDAS”(Global Land Data Assimilation System) signify ongoing advancements in satellite missions and land data assimilation systems, crucial for extending the capabilities and applications of initial GRACE findings.
The visualization efficiently captures the scope and focus areas of the current research landscape surrounding the GRACE missions. The frequency of keywords in GRACE satellite literature reveals the central role of GRACE data in monitoring changes in Earth’s gravity field, hydrology, remote sensing, and terrestrial water storage research, particularly in climate change and drought monitoring. These keywords highlight the importance of spatial measurement technologies and the key applications of data assimilation and satellite altimetry in data processing. They also reflect the widespread application of GRACE data in multiple geoscience fields such as ice cap monitoring, sea level change research, demonstrating its significant value in understanding and addressing geophysical processes.
4.2 Keyword co-occurrence cluster
The author keywords that appear more than 10 times were clustered, and thematic analysis was conducted for each cluster. There are 139 author keywords that appear more than 10 times. After excluding the search term “GRACE ”, clustering is performed on 138 words. The thematic keyword clustering map is shown in Figure 5.
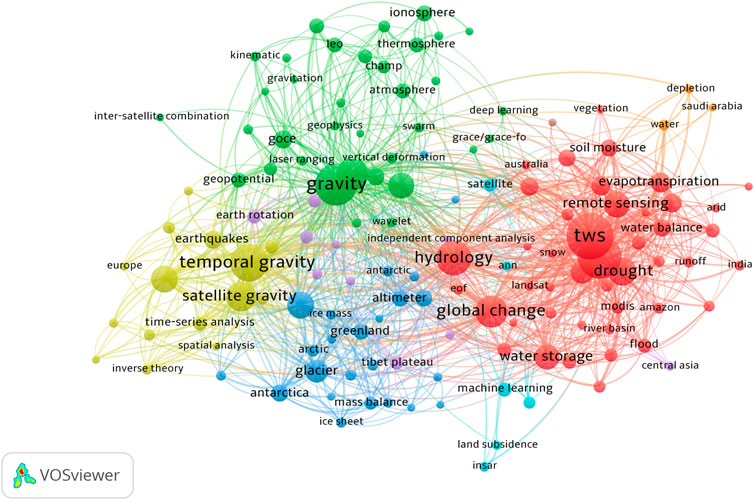
Figure 5. Clustering of author keywords with term occurrences exceeding 10 times.
The keyword clustering analysis of GRACE literature, as illustrated in Figure 5, reveals the application and research focuses on four distinct clusters. The Red Cluster (Hydrology and Water Resources) predominantly includes keywords related to terrestrial water, such as “TWS”, “hydrology”, “groundwater”, “soil moisture”, “evapotranspiration”, “water balance”, “runoff” and “flood”. The strong presence of these terms indicates that the red cluster focuses on applications of GRACE in monitoring and analyzing changes in Earth’s water systems. This is crucial for managing water resources, understanding hydrological cycles, and addressing issues like drought and groundwater depletion. The Green Cluster (Atmospheric and Environmental Science) includes keywords such as “atmosphere”, “ionosphere”, “thermosphere”, “vegetation”, “sustainability” and “climate”. This cluster likely represents research connecting GRACE satellite data with atmospheric conditions and environmental changes. The inclusion of “vegetation” and “sustainability” suggests a focus on how water availability impacts ecological systems and sustainability practices, possibly linking to climate action efforts. The Yellow Cluster (Geophysical and Temporal Analysis) includes terms like “temporal gravity”, “satellite gravity”, “earth rotation”, “geopotential”, “co-seismic”, “transient deformation” and “kinematic”. This cluster emphasizes the technical and methodological aspects of measuring and analyzing the gravity data provided by GRACE for geological and seismic applications. Lastly, the Blue Cluster (Polar and Glaciological Studies) is oriented towards polar and glaciological research, with keywords such as “glacier”, “ice sheet”, “Antarctica”, “Greenland” and “Arctic”. GRACE’s sensitivity to mass changes makes it an invaluable tool for tracking ice mass balance and understanding the contributions of polar ice melt to global sea level rise.
The co-occurrence graph reveals the central role of GRACE data in monitoring Earth’s gravity field changes, hydrology, environment, and terrestrial water storage research, particularly in climate change and drought monitoring. It highlights the importance of spatial measurement technologies and the key applications of data assimilation and satellite altimetry in data processing. It also reflects the widespread application of GRACE data in multiple geoscience fields such as ice cap monitoring and sea level change research, demonstrating its significant value in understanding and addressing geophysical processes.
4.3 Thematic evolution analysis
When evaluating different segmentation strategies, it was determined that overly broad divisions, such as segmenting into three expansive stages, do not effectively capture the nuances of thematic evolution and changes within the collaborative network. On the other hand, annual segmentation creates too many time slices, thereby complicating the summarization of evolutionary trends. Consequently, a 3-year period was identified as the most appropriate for segmentation, leading to the division of the years 2002–2022 into seven distinct stages. The analysis of thematic evolution and the development of the collaborative network is conducted within these 3-year segments.
In order to pre-process the author keywords, a table of synonyms and thematic terms as well as a table for filtering out generalization terms for GRACE satellite literature keywords were constructed. Then, synonyms were merged and generalization terms for the keywords were filter out at each stage. Subsequently, a statistical analysis of the thematic keywords for each stage is conducted. The top 10 thematic keywords and their statistical information for each stage are presented in Table 3.
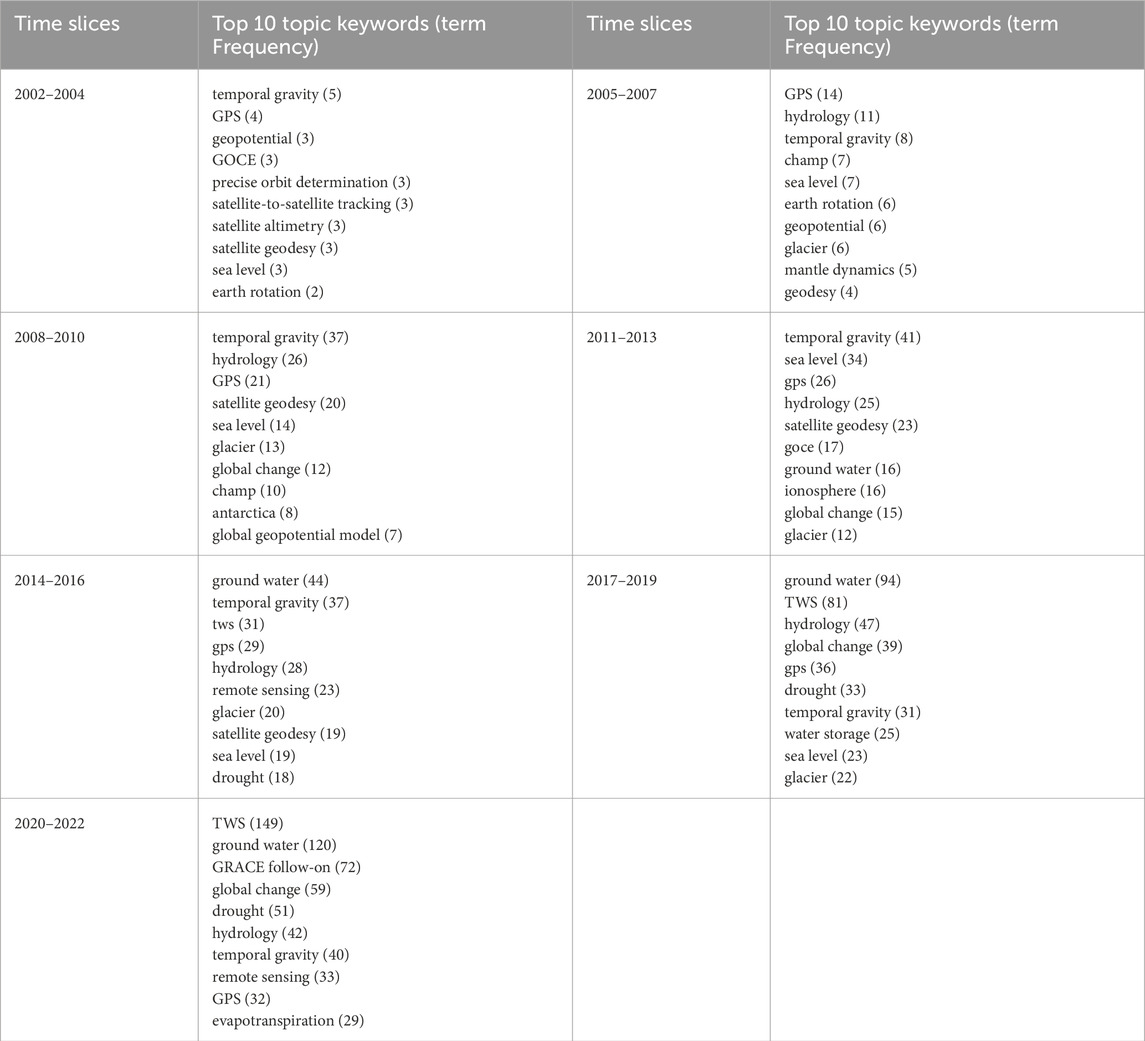
Table 3. Top 10 thematic keywords in the seven stages of GRACE literature.
The data in Table 3 reveals several key insights into the evolution of thematic keywords over the seven stages of GRACE literature from 2002 to 2022. The term “temporal gravity” has shown a consistent rise in frequency, starting with five mentions in 2002–2004, peaking at 41 in 2011–2013, and maintaining high relevance with 40 mentions in 2020–2022. This trend indicates an ongoing and growing interest in understanding temporal variations in Earth’s gravity field. GPS has remained a consistently high-frequency keyword across all time slices, demonstrating its fundamental role in satellite geodesy and earth observation. There is also a notable increase in the frequency of terms related to hydrology and groundwater. Starting from 11 mentions in 2005–2007, hydrology reached 42 mentions in 2020–2022, and groundwater, almost absent in the early stages, surged to 120 mentions in 2020–2022. This reflects a growing focus on water resources and their response to climatic changes. Additionally, TWS (Total Water Storage) emerged as a significant keyword in the 2014–2016 period with 31 mentions and saw a dramatic increase to 149 mentions in 2020–2022. This underscores the increasing importance of monitoring total water storage to understand hydrological processes and water resource management. Keywords such as “global change,” “drought,” and “sea level” have gained prominence over time, highlighting a growing concern over climate change impacts and the need for monitoring these effects through satellite data. The appearance and rise of terms like “GRACE Follow-On” in 2020–2022, with 72 occurrences, indicate the significance of technological advancements and the continued evolution of satellite missions to enhance earth observation capabilities. “Satellite geodesy” and “remote sensing” have remained important throughout the years, reflecting their critical roles in observing and understanding Earth’s physical processes.
In summary, the thematic evolution in GRACE literature underscores a shift towards more detailed and specific studies related to water resources, climate change, and technological advancements in satellite geodesy. The increasing frequency of certain keywords reveals emerging research trends and growing areas of interest within the scientific community.
Figure 6 displays the thematic evolution of GRACE satellite application research literature across these seven stages, illustrated using a sankey diagram. The sankey diagram depicting the seven-stage topic evolution in GRACE publications from 2002 to 2022 provides several insightful observations about research trends and thematic shifts over time.
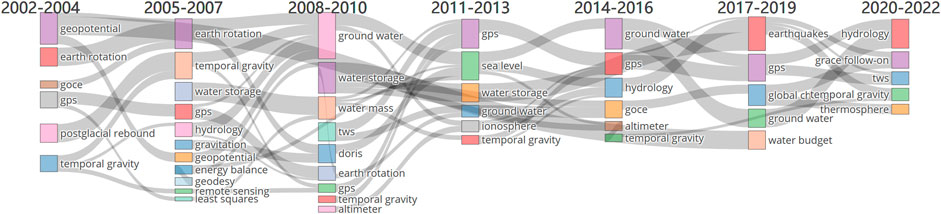
Figure 6. Sankey diagram of seven-stage topic evolution in GRACE publications.
The diagram in Figure 6 clearly illustrates the evolution and persistence of various research themes across different time periods. “Temporal gravity” consistently appears from 2002–2004 onwards, growing in prominence and demonstrating its sustained importance in GRACE satellite research. “GPS” maintains a strong presence throughout all periods, underscoring its foundational role in satellite geodesy and Earth observation. Emerging topics such as “groundwater”, “TWS” and “hydrology” gain significant traction from 2014 onwards, reflecting a growing interest in hydrological studies and water resource management in response to climate change. Earlier themes, such as “postglacial rebound” and “geopotential” are more prominent in the initial stages but become less dominant or evolve into related topics as research focuses changed. The appearance of “GRACE Follow-On” during the 2020–2022 period indicates the incorporation of new technologies and missions building upon the original GRACE mission, showcasing advancements in satellite observation capabilities. The emergence of terms like “water budget” and “thermosphere” in recent years suggests expanding research into more specific and complex areas of Earth system science.
The diagram highlights the interconnected nature of various research themes. For instance, “temporal gravity” is linked with multiple topics across different periods, indicating its central role in various research aspects. “Hydrology” and “groundwater” are closely related and often appear together, signifying their interrelated significance in studying Earth’s water resources. There is a noticeable shift from traditional geophysical topics in the early stages, such as “geopotential” and “Earth rotation” to contemporary concerns like “climate change impacts”, “groundwater” and “water storage” in the later stages. This shift underscores the dynamic nature of GRACE research, adapting to emerging scientific challenges and societal needs.
In summary, the sankey diagram visually represents the evolving research priorities in GRACE publications, highlighting the sustained importance of certain themes, the emergence of new topics, and the interconnected nature of research in satellite geodesy and Earth system science. The thematic evolution of GRACE satellite technology papers reflects the field’s adaptation to technological advancements and the scientific community’s maturing role in global environmental monitoring. This progression demonstrates how researchers integrate various scientific tools and methods to enhance the understanding of Earth’s dynamics, providing valuable insights for global climate change and water resource management.
4.4 Keyword co-occurrence evolution analysis
After preprocessing the thematic keywords, a co-word network was constructed based on the co-occurrence matrix of thematic keywords across the seven stages. Figure 7 represented the co-occurrence networks of keywords of GRACE literature across different time periods. These networks illustrate the evolving research themes and their interconnections over time.

Figure 7. Keywords cooccurence network of GRACE publications in the seven stages. (A) 2002–2004, (B) 2005–2007, (C) 2008–2010, (D) 2011–2013, (E) 2014–2016, (F) 2017–2019, (G) 2020–2022.
During 2002 and 2004, research centered on fundamental topics such as “satellite altimetry”, “GPS”, and “sea level”. Strong connections between satellite altimetry, sea level, and precise orbit determination during this period indicate a focus on the technical aspects of satellite measurements and their applications in sea level monitoring. Between 2005 and 2007, significant topics included “hydrology”, “temporal gravity” and “GPS”. During this stage, temporal gravity was linked with various earth science applications like hydrology, earthquakes, and mantle dynamics, suggesting an expansion in the use of GRACE data for studying Earth’s dynamic processes. From 2008 to 2010, “temporal gravity”, “hydrology” and “glacier” emerged as prominent themes. The increased emphasis on temporal gravity and its applications in understanding glacial dynamics and global change reflects growing interest in climate change studies and their impact on glaciers and water resources.
In summary, over the years, the research focus has evolved from technical aspects of satellite measurements to a broader application in earth sciences, particularly in hydrology, sea level rise and climate change studies. The increasing complexity of the networks reflects the growing integration of GRACE data into diverse research areas, highlighting its importance in understanding and addressing global environmental challenges.
Network structure indices of the co-occurrence network of the most prevalent keywords in GRACE satellite research during the seven-stage were calculated and shown in Table 4.
Over the years, the co-occurrence network of GRACE satellite research keywords has become more interconnected, denser, and efficient as shown in Table 4. The average degree and weighted degree have significantly increased, indicating a higher number of connections and stronger associations among keywords. The network diameter and average path length have decreased, suggesting a more compact and efficient network structure. These changes reflect a growing complexity in the research themes and an expansion in the use of GRACE data across various scientific domains.
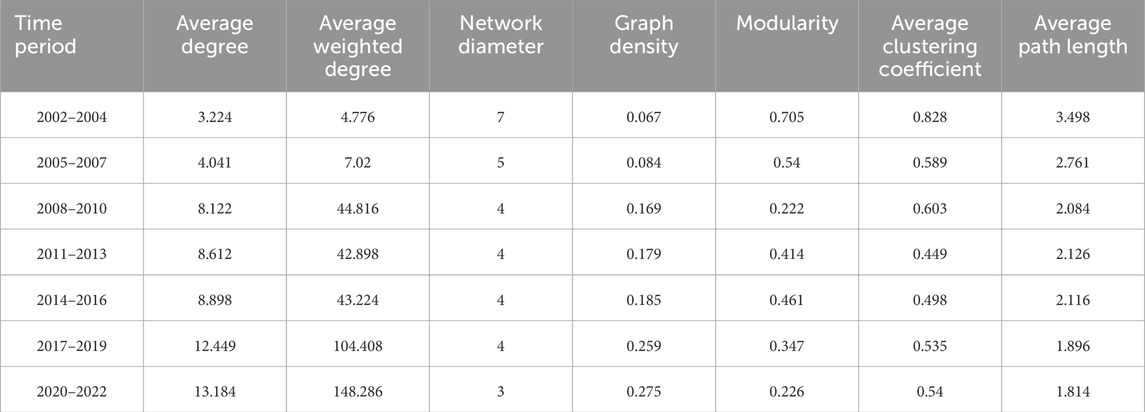
Table 4. Evolution of network structure indices of the Co-occurrence network of the most prevalent keywords in GRACE satellite research from 2002 to 2022.
The decrease in modularity suggests a shift towards a more integrated research approach, with less distinct clustering of topics. This indicates a move away from isolated research communities towards a more cohesive field of study. Additionally, the variation in the average clustering coefficient, which has balanced out over time, reflects changes in the tightness of node clustering. Overall, these trends highlight the evolving nature of GRACE satellite research, emphasizing its increasing importance and application in understanding and addressing complex global environmental challenges.
5 Spatial differentiation and collaborative evolution analysis
5.1 Hotspot region analysis
The field of publication countries were extracted from the literature dataset, and a summary statistic was conducted, Table 5 shows the publication volume and citation frequency statistics for the top ten countries in GRACE satellite research.
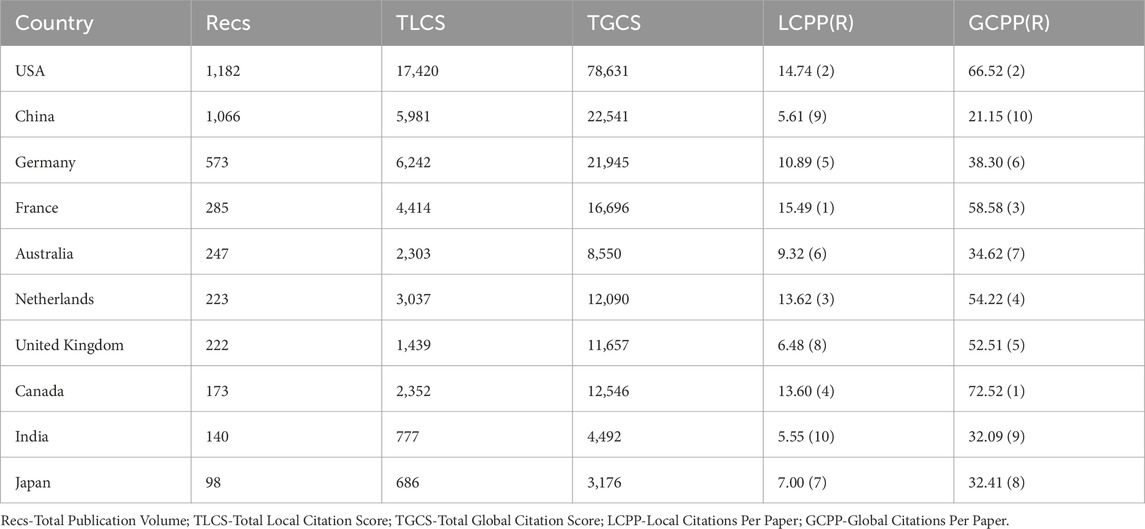
Table 5. Publication volume and citation frequency statistics of the top ten most productive countries in GRACE satellite research.
This table summarizes the contribution and impact of the top 10 countries in the field, illustrating both local and global citation metrics to evaluate the reach and influence of their GRACE satellite research. Based on the data from Table 5, it can be deduced that the United States holds an academic leadership position in the field of GRACE satellite applications, with China showing a rapid increase in publication volume in this field. European countries (Germany, France, the Netherlands, Italy, etc.) have a stable output and high influence in GRACE satellite research. Canadian scholars, although not producing a large volume in the field of GRACE satellite applications, have a high international impact.
The United States (USA), with a publication volume of 1,182 papers and the highest total global citation score (TGCS) of 78,631, demonstrates its significant academic leadership in this research field. Additionally, the United States ranks second in global citations per paper (GCPP) at 66.52 and also second in local citations per paper (LCPP) at 14.74, further highlighting the widespread influence and high quality of its papers. China with 1,066 publications, is ranked second, indicating its rapid rise in the field. However, China’s global citations per paper (21.15) and local citations per paper (5.61) are relatively low, ranking 10th and nineth respectively, which may reflect that its academic influence still has room for improvement. European countries like Germany, France, the Netherlands, and Italy show a balanced performance in publication volume and citation frequency, indicating stable contributions and good performance in this research area. France, in particular, ranks first in local citations per paper(15.41), indicating high domestic recognition of its research. Canada, though lower in publication volume (173 papers), excels in global citations per paper (72.52) and local citations per paper (13.60), particularly ranking first in global citations per paper, suggesting that Canadian papers are of very high quality and have extensive international influence.
To calculate the kernel density of publications on the GRACE satellite theme, author affiliation data was extracted from the metadata fields of the relevant literature. The publication volumes by different institutions were tallied, and geocoding methods were applied to obtain the geographical coordinates of these institutions. These coordinates were then used to create vector points, which were visualized using ArcGIS software. Based on the publication volumes of different institutions, the kernel density estimation method was employed within the GIS software to produce a kernel density map. The kernel density analysis map shown in Figure 8 reveals three areas with high publication density: the central United States, Germany, France, and the United Kingdom in Europe, and the eastern region of China. The data in the map exhibits distinct spatial differentiation in GRACE satellite research within the global academic community, with scientific activities particularly prominent in specific regions. The United States and China stand out as exceptional publishing countries in GRACE satellite research, as indicated by the intense color saturation on the map. Concurrently, European countries such as Germany, France, the United Kingdom, and Australia also show a high volume of publications, although they do not surpass the leading countries mentioned earlier, but still contribute significantly to GRACE research. The kernel density map clarifies the relative intensity and clustering of publication volumes, revealing North America, Europe, East Asia, and Australia as hubs of academic output. This spatial analysis not only highlights regions with high research productivity but also suggests the existence of a complex network of international collaboration. The gradient of colors and the associated numerical indicators on the legend emphasize the uneven distribution of research activities, with certain nodes serving as key centers for GRACE satellite research. These may therefore guide the strategic direction and thematic focus of the global scientific community’s future scholarly efforts.
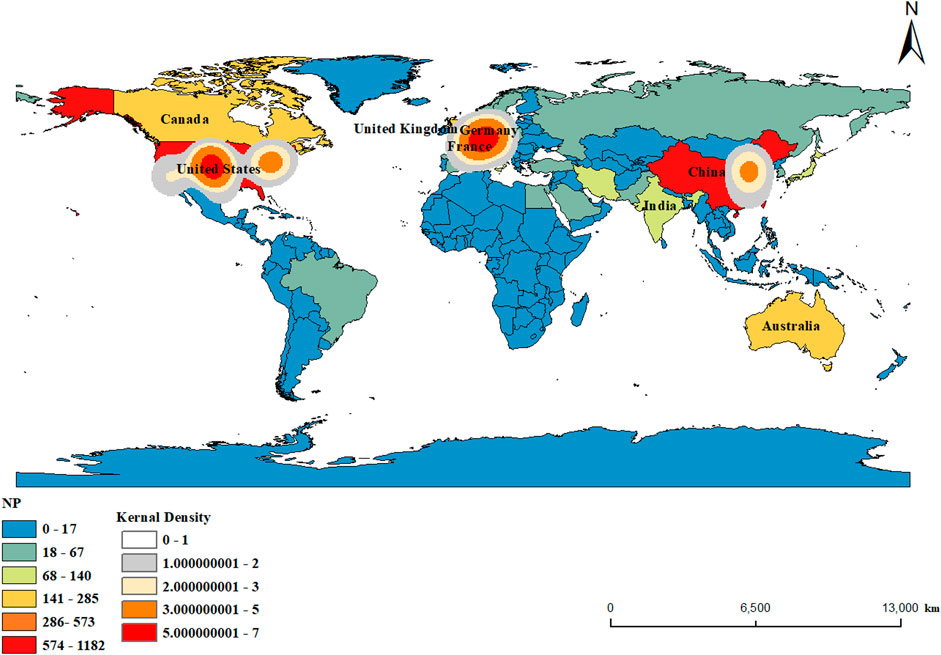
Figure 8. Global publication density map of GRACE satellite scientific literature.
Next, we will delve into an analysis of the collaboration network and evolutionary characteristics of the publishing countries.
5.2 National collaboration network analysis
There are 16 countries within the collaboration network of major publication nations in GRACE satellite research that have a node degree ranging from 20 to 48. The collaboration network and network density map for these countries are shown in Figure 9.
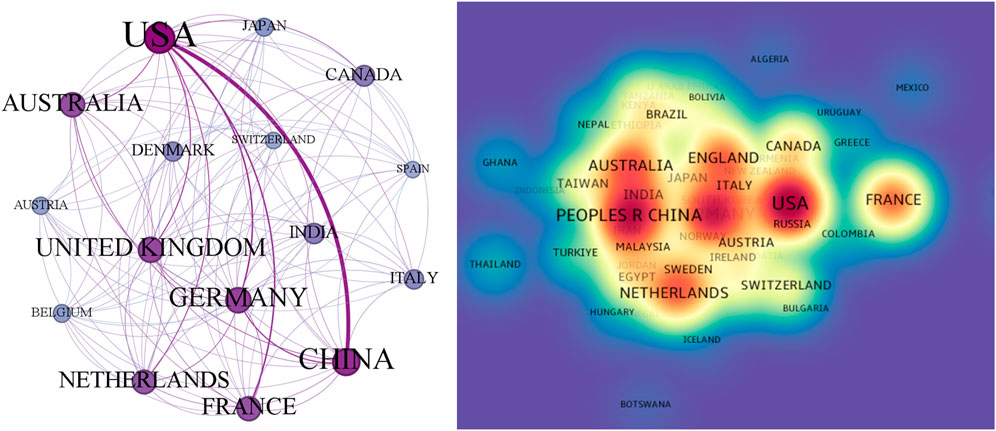
Figure 9. Collaboration network graph and network density map of major publication countries in GRACE satellite research.
The density map reveals that the main countries involved in GRACE satellite research. The United States leads in almost all indicators, demonstrating its centrality and bridging role in the global scientific research cooperation network. China holds a significant position in the cooperation network, with direct collaborative relationships with many countries, and its centrality and bridging role in the global network are second only to the United States. The United Kingdom, France, Australia and the Netherlands are also important nodes in the cooperation network, with high betweenness centrality and closeness centrality, indicating their high accessibility and bridging roles within the network. All these countries exhibit high clustering coefficients and a high number of triangles, suggesting that they often collaborate with other highly interconnected groups of countries.
5.3 Cooperation network evolution analysis
To illustrate the evolution of international collaborations in GRACE satellite research from 2002 to 2022, we constructed national collaboration networks for seven distinct periods and calculated the network structural indices. For the first three periods (2002–2004, 2005–2007, and 2008–2010), we selected countries with a node degree greater than or equal to five for inclusion in the networks. For the subsequent periods (2011–2013, 2014–2016, 2017–2019, and 2020–2022), we included countries with a node degree greater than or equal to 10. Figures a, b, c, d, e, f, and g in Figure 10 respectively depict the evolutionary characteristics of the national collaboration networks across these seven periods.
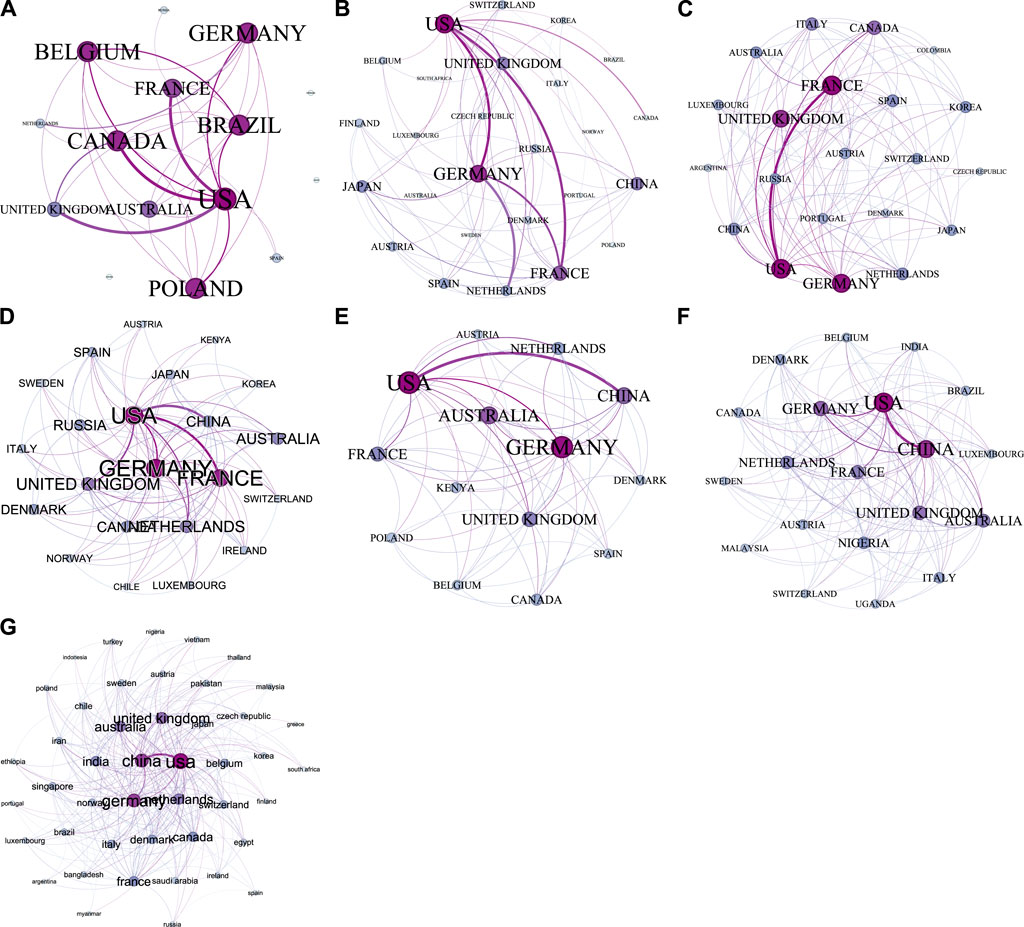
Figure 10. Evolutionary map of the collaboration network among major publication countries in GRACE satellite research from 2002 to 2022. (A) 2002–2004, (B) 2005–2007, (C) 2008–2010, (D) 2011–2013, (E) 2014–2016, (F) 2017–2019, (G) 2020–2022.
The network structural indices for the national collaboration networks across the seven stages are presented in Table 6. The changes in these indices reflect the evolutionary characteristics of the network structure, including network growth, increased interactions between nodes, and changes in the community structure.
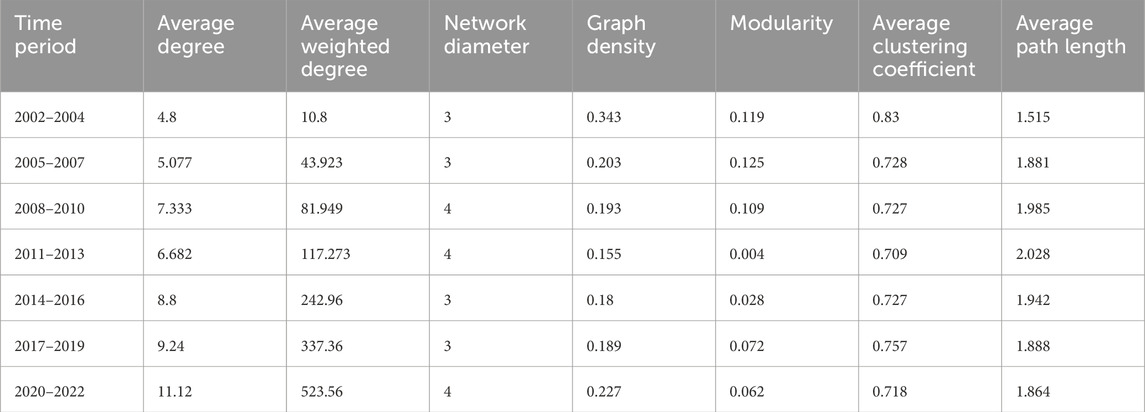
Table 6. Evolution of network structure indices in the collaboration network of major publication countries in GRACE satellite research from 2002 to 2022.
Table 6 illustrates the evolution of network structure indices for the national collaboration networks in GRACE satellite research from 2002 to 2022. The Average Degree measures the average number of connections each country has in the network. As shown in the table, the average degree increased from 4.8 in 2002–2004 to 11.12 in 2020–2022, indicating that countries are forming more collaborations over time. The Average Weighted Degree reflects both the number of collaborations and their significance or intensity. It rose dramatically from 10.8 to 523.56, suggesting that not only are there more collaborations, but these collaborations have become stronger and more impactful. The Network Diameter represents the longest shortest path between any two countries in the network. It fluctuated between three and four over the years, showing some variation but overall stability in the network’s maximum span. Graph Density indicates the proportion of possible connections that are actual connections in the network. Graph density decreased from 0.343 to 0.18 in 2014–2016, then increased to 0.227 in 2020–2022, reflecting periods of sparser and denser connections among countries. The Average Clustering Coefficient, while remaining high, decreased slightly from 0.83 to 0.718, indicating that countries still tend to form clusters, though this tendency has slightly diminished over time. This suggests that while countries frequently collaborate in small groups, this pattern has been relatively consistent.
The table reveals a clear trend of increased international collaboration in GRACE satellite research from 2002 to 2022. There is notable growth in both the number and intensity of collaborations, as evidenced by the rising average degree and average weighted degree. Despite this growth, the network remains relatively compact, as indicated by the stable network diameter and average path length. Graph density has increased in recent years, reflecting a denser network with more connections among countries. While modularity fluctuates, it generally suggests a move towards a more integrated network with fewer distinct communities. The average clustering coefficient, though slightly decreasing, indicates that countries still tend to form clusters, albeit less tightly than before. Overall, these indices highlight the evolution towards a more connected and globally integrated research network in GRACE satellite research.
These observations help us understand the activity and trends of different countries in the collaboration network of GRACE satellite application scientific literature. For example, the rapid growth of the USA and China may indicate that their collaborative activities in this field have become more frequent and intense. The decrease in collaboration activities of Canada and Japan in the most recent period could suggest a shift in their research focus or funding in this field. Further insights can be gleaned by measuring the centrality indices of major publishing countries in the collaboration network. The following graph in Figure 11 displays the Weighted Degree Index and Harmonic Closeness Centrality for the top 10 countries.
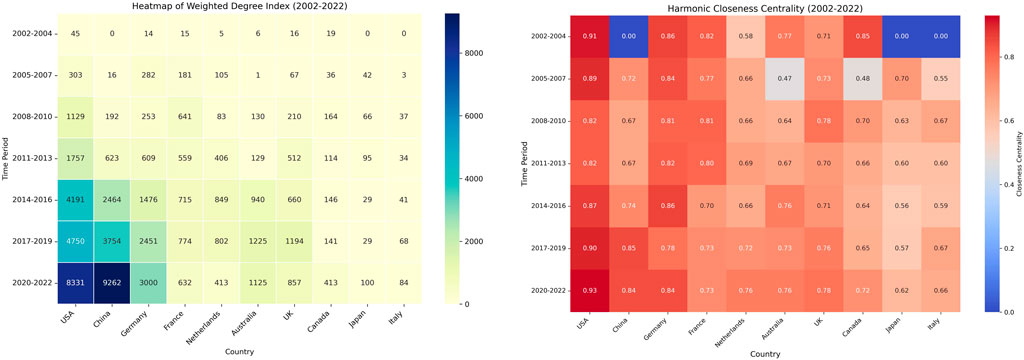
Figure 11. Heatmap of weigted degree index and harmonic closeness centrality of top 10 countries during 2002–2022 in collaboration network of GRACE research.
The heatmap of the Weighted Degree Index (2002–2022) reveals significant trends in international collaboration within the GRACE research community. Notably, the USA and China demonstrate a marked increase in collaboration over time, peaking between 2020 and 2022 with weighted degree indices of 8,331 and 9,262, respectively. Consistent contributors such as Germany and France exhibit moderate but steady growth in their collaborative efforts. Emerging players like Australia, the United Kingdom, and Canada show substantial increases in recent years, indicating their growing involvement in GRACE research. The peak periods of 2014–2016 and 2017–2019 highlight a significant uptick in collaborations across most countries, underscoring an overall trend of increased global engagement in this scientific domain.
The heatmap of Harmonic Closeness Centrality (2002–2022) further elucidates the network dynamics within the GRACE research collaborations. The USA consistently maintains high centrality scores, reflecting its pivotal role in the network. China’s centrality rises significantly from 2014 onwards, indicating its growing influence. Germany, France, and the Netherlands maintain strong and stable positions within the network, demonstrating their sustained contributions. Conversely, countries like Italy and Japan exhibit lower centrality in the early periods but show improvement over time. The increasing centrality scores of Australia and Canada in later years suggest enhanced integration into the research network. Overall, these findings highlight the evolving nature of international collaborations in GRACE research, characterized by increasing connectivity and more integrated global participation.
6 Conclusion
This article analyzes the research progress in GRACE satellite studies from 2002 to 2022 using bibliometric methods, focusing on research hotspots and the evolution of themes. The findings reveal a continuous increase in publications within this field, with primary research themes including Hydrology and Water Resources, Atmospheric and Environmental Science, Geophysical and Temporal Analysis, and Polar and Glaciological Studies. A seven-stage analysis on a 3-year scale indicates that the application of GRACE satellites has evolved from initial gravitational field solutions and theoretical research to more detailed studies on water resources, climate change, and technological advancements in satellite geodesy.
Geographically, the core regions for GRACE satellite application publications are the central United States, Germany, France, and the United Kingdom in Europe, and the eastern region of China. The United States leads in publication volume, impact, and international cooperation, with China ranking second in publication volume and network centrality index but requiring improvement in impact. European countries demonstrate high influence and centrality in the cooperation network, holding significant positions in global research. The evolution index of the international cooperation network shows a significant increase in connectivity from 2002 to 2022, with closer cooperation between countries. There is notable growth in both the number and intensity of collaborations, as evidenced by the rising average degree and average weighted degree. Despite this growth, the network remains relatively compact, indicated by the stable network diameter and average path length. Graph density has increased in recent years, reflecting a denser network with more connections among countries. With the launch of GRACE Follow-On, GRACE satellite applications are expected to develop in new directions, potentially achieving breakthroughs in global water storage changes, sea-level rise, and gravitational field inversion.
The bibliometric analysis of GRACE satellite research from 2002 to 2022 highlights significant growth and thematic evolution in the field. While the study provides valuable insights into research trends and international collaborations, it also acknowledges limitations in the temporal division of topics and collaboration dynamics. Looking ahead, technological advancements, enhanced international collaboration, and integration with other data sources will drive future research, with important implications for addressing global environmental and climate challenges.
Data availability statement
The original contributions presented in the study are included in the article/Supplementary Material, further inquiries can be directed to the corresponding author.
Author contributions
HZ: Conceptualization, Data curation, Formal Analysis, Methodology, Writing–original draft, Writing–review and editing.
Funding
The author(s) declare that financial support was received for the research, authorship, and/or publication of this article. This work was supported by “National Natural Science Foundation of China” (No: 42171426 and No: 41801393), “Fujian Natural Science Foundation Project” (2021J011022), “Minjiang University Talent Introduction Project” (JAT190600) and “Key Laboratory Open Fund of the Ministry of Education” (2022LSDMIS06), I would like to acknowledge the financial support.
Conflict of interest
The author declares that the research was conducted in the absence of any commercial or financial relationships that could be construed as a potential conflict of interest.
Publisher’s note
All claims expressed in this article are solely those of the authors and do not necessarily represent those of their affiliated organizations, or those of the publisher, the editors and the reviewers. Any product that may be evaluated in this article, or claim that may be made by its manufacturer, is not guaranteed or endorsed by the publisher.
References
Batagelj, V., and Mrvar, A. (1998). Pajek - program for large network analysis. Connections 21 (2), 47–57.
Chen, C., and Song, M. (2019). Visualizing A field of research: a methodology of systematic scientometric reviews. PLOS ONE 14 (10), e0223994. doi:10.1371/journal.pone.0223994
Chen, J., Wilson, C. R., Blankenship, D. D., and Tapley, B. D. (2009). Accelerated antarctic ice loss from satellite gravity measurements. Nat. Geosci. 2, 859–862. doi:10.1038/ngeo694
Chen, J. L., Wilson, C. R., and Tapley, B. D. (2006). Satellite gravity measurements confirm accelerated melting of Greenland ice sheet. Science 313 (5795), 1958–1960. doi:10.1126/science.1129007
Feng, W., Zhong, M., Lemoine, J., Biancale, R., Hsu, H., and Xia, J. (2013a). Evaluation of groundwater depletion in North China using the gravity Recovery and climate experiment (GRACE) data and ground-based measurements. Water Resour. Res. 49 (4), 2110–2118. doi:10.1002/wrcr.20192
Feng, W., Zhong, M., Lemoine, J., Biancale, R., Hsu, H., and Xia, J. (2013b). Evaluation of groundwater depletion in North China using the Gravity Recovery and Climate Experiment (GRACE) data and ground-based measurements. Water Resour. Res. 49 (4), 2110–2118. doi:10.1002/wrcr.20192
Garfield, E. (2009). HistCite: a software tool for informetric analysis of citation linkage. Inf. Process. Manag. 45 (1), 130–144.
Ke, L., Lu, C., Shen, R., Lu, T., Ma, B., and Hua, Y. (2020). Knowledge mapping of drug-induced liver injury: a scientometric investigation (2010-2019). Front. Pharmacol. 11, 842. doi:10.3389/fphar.2020.00842
Kodonas, K., Fardi, A., Gogos, C., and Economides, N. (2020). Scientometric analysis of vital pulp therapy studies. Int. Endod. J. 53 (3), 220–230. doi:10.1111/iej.13422
Konur, O. (2020). 100 citation classics in the algal science, technology, and medicine: a scientometric analysis. J. Appl. Phycol. 32, 1016–1027. doi:10.1016/B978-0-12-818305-2.00002-4
Kvas, A., Brockmann, J., Krauss, S., Schubert, T., Gruber, T., Meyer, U., et al. (2020). GOCO06s – a satellite-only global gravity field model. Earth Syst. Sci. Data 12, 1099–1118. doi:10.5194/essd-13-99-2021
Landerer, F. W., Flechtner, F., Save, H., Webb, F., Bandikova, T., Bertiger, W., et al. (2020). Extending the global mass change data record: GRACE follow-on instrument and science data performance. Geophys. Res. Lett. 47 (7), e2020GL088306. doi:10.1029/2020gl088306
Li, J., Goerlandt, F., and Reniers, G. (2021). An overview of scientometric mapping for the safety science community: methods, tools, and framework. Saf. Sci. 134, 105093. doi:10.1016/j.ssci.2020.105093
Mohamed, A., Alarifi, S. S., and Mohammed, M. A. A. (2024). Geophysical monitoring of the groundwater resources in the Southern Arabian Peninsula using satellite gravity data. Alexandria Eng. J. 86, 311–326. doi:10.1016/j.aej.2023.11.060
Niu, G. Y., Yang, Z. L., Dickinson, R. E., Gulden, L. E., and Su, H. (2007). Development of a simple groundwater model for use in climate models and evaluation with gravity Recovery and climate experiment data. J. Geophys. Res. Atmos. 112 (D7), D07103. doi:10.1029/2006jd007522
Othman, A., Abdelrady, A., and Mohamed, A. (2022). Monitoring mass variations in Iraq using time-variable gravity data. Remote Sens. 14 (14), 3346. doi:10.3390/rs14143346
Peltier, W. R. (2004). Global glacial isostasy and the surface of the ice-age earth: the ice-5G(VM2) model and grace. Annu. Rev. Earth Planet. Sci. 32, 111–149. doi:10.1146/annurev.earth.32.082503.144359
Persson, O. (2009). Bibexcel: a tool for bibliometric analysis. Electron. J. Inf. Syst. Eval. 12 (1), 39–46.
Rodell, M., Chen, J., Kato, H., Famiglietti, J. S., Nigro, J., and Wilson, C. R. (2007). Estimating groundwater storage changes in the Mississippi River basin (USA) using GRACE. Hydro-Geology J. 15 (1), 159–166. doi:10.1007/s10040-006-0103-7
Rodell, M., Famiglietti, J. S., Wiese, D. N., Reager, J. T., Beaudoing, H. K., Landerer, F. W., et al. (2018). Emerging trends in global freshwater availability. Nature 557 (7707), 651–659. doi:10.1038/s41586-018-0123-1
Rodell, M., Velicogna, I., and Famiglietti, J. S. (2009). Satellite-based estimates of groundwater depletion in India. Nature 460 (7258), 999–1002. doi:10.1038/nature08238
Save, H., Bettadpur, S., and Tapley, B. D. (2016). High-resolution CSR GRACE RL05 mascons. J. Geophys. Res. Solid Earth 121 (10), 7547–7569. doi:10.1002/2016jb013007
Scanlon, B. R., Zhang, Z., Save, H., Wiese, D. N., Landerer, F. W., Long, D., et al. (2016). Global evaluation of new GRACE mascon products for hydrologic applications. Water Resour. Res. 52 (9), 9412–9429. doi:10.1002/2016wr019494
Swenson, S., and Wahr, J. (2002). Methods for inferring regional surface-mass anomalies from gravity Recovery and climate experiment (GRACE) measurements of time-variable gravity. J. Geophys. Res. Solid Earth 107 (B9), 2193. doi:10.1029/2001jb000576
Swenson, S., and Wahr, J. (2006). Post-processing removal of correlated errors in GRACE data. Geophys. Res. Lett. 33 (8), L08402. doi:10.1029/2005gl025285
Swenson, S., Wahr, J., and Milly, P. C. D. (2003). Estimated accuracies of regional water storage variations inferred from the Gravity Recovery and Climate Experiment (GRACE). Geophys. Res. Lett. 30 (12), 1690. doi:10.1029/2002wr001808
Tapley, B. D., Bettadpur, S., Ries, J. C., Thompson, P. F., and Watkins, M. M. (2004b). GRACE measurements of mass variability in the Earth system. Science 305 (5683), 503–505. doi:10.1126/science.1099192
Tapley, B. D., Bettadpur, S., Watkins, M., and Reigber, C. (2004a). The gravity Recovery and climate experiment: mission overview and early results. Geophys. Res. Lett. 31 (9), L09607. doi:10.1029/2004gl019920
Tapley, B. D., Watkins, M. M., Flechtner, F., Reigber, C., Bettadpur, S., Rodell, M., et al. (2019). Contributions of GRACE to understanding climate change. Nat. Clim. Change 9 (5), 358–369. doi:10.1038/s41558-019-0456-2
Van Eck, N. J., and Waltman, L. (2010). Software survey: VOSviewer, a computer program for bibliometric mapping. Scientometrics 84 (2), 523–538. doi:10.1007/s11192-009-0146-3
Velicogna, I., and Wahr, J. (2006). Measurements of time-variable gravity show mass loss in Antarctica. Science 311 (5768), 1754–1756. doi:10.1126/science.1123785
Watkins, M. M. (2015). Improved methods for observing Earth's time variable mass distribution with GRACE mascons. J. Geophys. Res. Solid Earth 120 (4), 3068–3084. doi:10.1002/2014JB011547
Wiese, D. N., Landerer, F. W., and Watkins, M. M. (2016). Quantifying and reducing leakage errors in the JPL RL05M GRACE mascon solution. Water Resour. Res. 52 (9), 7490–7502. doi:10.1002/2016wr019344
Keywords: GRACE satellite, co-occurrence network, thematic evolution, complex network analysis, kernel density
Citation: Zhang H (2024) Tracking the spatial patterns and thematic dynamics of GRACE satellite application over the last 20 years (2002–2022). Front. Earth Sci. 12:1392359. doi: 10.3389/feart.2024.1392359
Received: 27 February 2024; Accepted: 30 May 2024;
Published: 04 July 2024.
Edited by:
Marcelo Cohen, Federal University of Pará, BrazilReviewed by:
Huiran Gao, National Institute of Natural Hazards, Ministry of Emergency Management, ChinaAhmed Mohamed, Assiut University, Egypt
Copyright © 2024 Zhang. This is an open-access article distributed under the terms of the Creative Commons Attribution License (CC BY). The use, distribution or reproduction in other forums is permitted, provided the original author(s) and the copyright owner(s) are credited and that the original publication in this journal is cited, in accordance with accepted academic practice. No use, distribution or reproduction is permitted which does not comply with these terms.
*Correspondence: Hongyue Zhang, emhhbmdoeUBtanUuZWR1LmNu