 Jian Zhao
 Dan Huang1*
 Fei Wang
 Yuxiang Pan
- 1Institute of Mining Engineering, BGRIMM Technology Group, Beijing, China
- 2China First Highway Engineering Co., Ltd., China Communications Construction Group Co., Ltd., Beijing, China
- 3Key Laboratory of Ministry of Education on Safe Mining of Deep Metal Mines, Northeastern University, Shenyang, China
- 4Geotechnical Institute, TU Bergakademie Freiberg, Freiberg, Germany
A newly developed microseismic (MS) monitoring system was employed in the Tianshan-Shengli tunnel to detect MS activities and then predict and provide early warning of rockburst disasters. The system not only has the advantages of accuracy of artificial analysis but also real-time analysis and warnings. The positioning accuracy for MS events is approximately 5–10 m. A new sensor installation scheme was proposed to achieve fast sensor installation and recovery, taking advantage of semicircular steel tubes and hose clamps. In addition, the rockburst risk level prediction criteria adopted multiple evaluation indexes such as MS event energy and moment magnitude and number, and it revealed that the evolution of maximum energy has a good positive correlation with that of maximum moment magnitude through analyzing the monitored MS events. It also showed that the rockburst generally occurred 2 days after the rock mass was exposed by the tunnel boring machine (TBM) tail shield and belonged to the delayed rockburst category, according to the field statistical results. The preliminary application cases indicated that the rockburst prediction and early warning based on MS monitoring agree with the site survey results. Therefore, the new MS monitoring system is a reliable tool for predicting and providing early warnings of rockburst disasters.
1 Introduction
More and more infrastructure facilities, such as expressways, railways, and pumped storage power stations, have been built in recent years. When excavating a parallel pilot expressway or railway tunnel in a mountainous area (Zhu et al., 2019; Xie et al., 2022; Lu et al., 2023) or a water conveyance tunnel for a power station (Feng G. L. et al., 2022), a tunnel boring machine (TBM) excavation is usually a good option, because of its high excavation speed, safety, automation level, and lower disturbance to surrounding rock (Arshad and Abdullah, 2016). Like a tunnel excavated using the drilling and blasting method, a TBM excavation also faces numerous safety risks, including water inrush, support failure, collapse, and rockburst. Rockburst disasters have appeared in many geotechnical and mining engineering situations (Dou et al., 2014; Mazaira and Konicek, 2015; Feng et al., 2017), causing serious casualties and great economic losses. Compared with the drilling and blasting method, less rock damage is caused by a TBM excavation on account of the reduced disturbance to surrounding rock. However, in the process of stress redistribution after TBM excavation, the magnitude of microseismic (MS) events is larger than that of the drilling and blasting method. The rupture size of the microfracture source is larger, and more energy is released as the rock mass breaks, which causes a higher risk of rockburst. Moreover, a TBM tunnel is generally extremely long and deeply buried with complex geological conditions. Hence, disaster monitoring and early-warning systems are indispensable in the construction process (Deng, 2018).
Because rockburst is a very complex rock dynamics problem, there is no consensus on its definition at present. Its typical characteristic is the sudden and violent breaking of the surrounding rock mass, which produces a violent shock wave and quickly releases a huge amount of energy (Liu et al., 2022). As a special form of rock mass failure, the evolution and occurrence of rockburst are affected by many factors, such as geostress, geological structures, excavation methods, and so on. Rockbursts can be classified into strain rockburst and fracture rockburst, in general, according to the rockburst mechanism (Wu et al., 2022), or instant rockburst and delayed rockburst based on the time from unloading to rockburst (He et al., 2012). However, the classification of rockburst has not yet formed a unified standard. Due to the complex occurrence mechanism and huge hazard, the prediction and early warning of rockburst is difficult and significant work.
Empirical criteria and in situ monitoring methods are two widely used rockburst prediction methods. The former is often applied in the design phase of the tunnel construction and relies on some rock stress and strength indexes to determine support schemes (Barton et al., 1974; Farhadian, 2021). In the construction phase, the in situ monitoring method is widely accepted as an effective tool for detecting the rock mass dynamic fracture process and forecasting the rockburst risk level. Both acoustic emission (AE) and MS monitoring are mature technologies for the detection of the temporal-spatial evolution of microfractures within rock mass (Wang, 2014; Liu J.po et al., 2020; Feng et al., 2023). Their difference is that the seismic motion frequencies of AE signals (50–5,000 kHz) are higher than that of MS signals (0.1–50 kHz) (Cai et al., 2007; Cheon et al., 2008; Goodfellow and Young, 2014), resulting in the AE signal attenuating very fast. Therefore, AE monitoring is suitable for a small volume of rock in laboratory experiments, while MS monitoring is more suitable for rockburst MS event monitoring in rock engineering projects (Wu et al., 2022). An MS monitoring system is a form of stationary installation in underground mines (Cai et al., 2018) and hydraulic power station chambers (Zhao et al., 2018). The MS monitoring and early-warning area during these engineering constructions is also a fixed range. However, the MS monitoring range must always change with the rapid excavation of a TBM tunnel. Due to the different geological conditions, detector type, MS system performance, rockburst risk level prediction criteria, etc., in TBM tunnel projects, rockburst prediction and early warning in a tunnel with a TBM excavation still face many unique challenges.
Many case studies about rockburst prediction and early warning in TBM tunnels have been published in recent years. Xue et al. (2020) introduced the application of MS monitoring in the access tunnel construction of a hydropower station, using six uniaxial accelerometers in three cross sections, which were cemented inside boreholes at a 2 m depth at the sidewalls. They selected two parameters as the evaluation indexes of rockburst risk level, that is, the number of daily MS events and the b-value of the MS events, where the b-value is the proportional relationship between the number of large magnitude events and the number of small magnitude events (Liang et al., 2020a). Furthermore, a downward shift phenomenon of frequency band energy distribution (Liang et al., 2020b), apparent stress, apparent volume, and main frequency (Xue et al., 2021) were also considered as early-warning indicators of rockburst. The MS monitoring system based on accelerometers was likewise applied in other water headrace tunnels (Xu et al., 2016; Liu Q. S. et al., 2020; Yang et al., 2023) and railway tunnels (Voza et al., 2023).
To predict rockburst of TBM excavation during the Duoxiongla highway tunnel construction (Tang et al., 2018), nine geophones, divided into three cross sections, were installed in the concrete segment region, including the left and right sides at a depth of 1 m, and the top installed outside the hole. The b-value, number of MS events, and magnitude were employed to assess the overall stability of the tunnel. Li et al. (2023) used geophones in three cross sections, containing two triaxial sensors and six uniaxial sensors, and arranged eight speed-type sensors in the TBM tunnel of a hydropower plant in Pakistan to predict rockburst on the basis of the number and energies of the MS events. The geophysical seismometers are all installed inside the top holes to ensure the quality of monitoring data, and the first-row sensors were positioned 10–30 m from the tunnel face, with a spacing of 40 m between adjacent rows (Li et al., 2019). Ma et al. (2018) compared the prediction results obtained by MS monitoring and landsonar positioning, respectively, when excavating the headrace tunnel of a hydropower station using a hard-rock TBM, and the adopted evaluation indexes are peak energy of MS events, magnitude, and amount. In addition, they also mentioned that their wave detector was coupled to the rock face by butter.
Recent studies make it clear that there is no uniform standard for sensor type selection, sensor installation form, and rockburst risk level prediction criteria in a TBM excavated tunnel, and it is difficult to guarantee the prediction and early-warning quality of rockburst. However, as more and more deep- and ultradeep-buried tunnels and mines are constructed, the requirements for the overall accuracy of rockburst prediction and early warning will become higher. This paper focuses on rockburst prediction for the parallel pilot tunnel with a TBM excavation in the Tianshan-Shengli tunnel and provides a useful case study and discussion about our self-developed MS monitoring technology. We aim to set up a reasonable MS monitoring system layout scheme and to summarize suitable rockburst risk level prediction criteria in the specific tunnel project. The preliminary application results confirm the feasibility and reliability of our system.
2 Engineering background
2.1 Project overview
The Tianshan-Shengli tunnel is an ultra-long highway tunnel with a length of 22 km. It is a key control project of the G0711 expressway connecting Urumqi to Yuli Country, crossing the Tianshan Mountains region in Xinjiang, China. The direction of the tunnel axis is 233°–210°. The tunnel is divided into two construction sections of approximately 11 km each. The maximum buried depth is approximately 1150 m, and the average altitude is approximately 3,000 km. The tunnel construction is planned from 2019 to 2025, with a period of 6 years. The Tianshan-Shengli tunnel consists of three tunnels: two main tunnels and a middle parallel pilot tunnel (see Figure 1), and the distance between adjacent tunnels is approximately 30 m. The main tunnels are excavated by the drilling and blasting method at a highly mechanized level, and the middle tunnel is excavated by TBM method. As planned, it will take 38 months (3.17 years) to complete the middle tunnel excavation. Under normal conditions, the average daily TBM excavation footage is approximately 10 m.
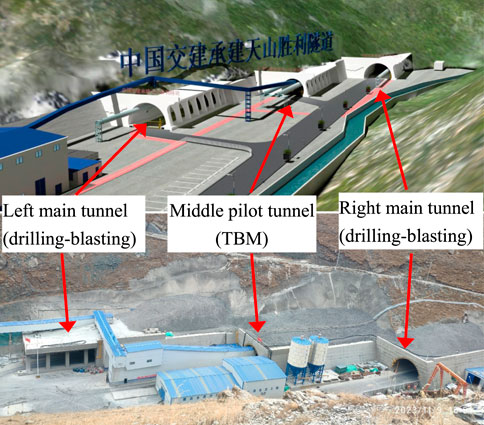
Figure 1. Photograph of the Tianshan-Shengli tunnel entrance.
Two open TBMs are employed in the entrance and exit sections of the middle pilot tunnel. The tunnel section diameter is 8.4 m. The tunnel support is designed with a double-layer lining structure, with anchor bolts, steel arches, and shotcrete as the first lining and cast-in-place reinforced concrete as the secondary lining. In particular, limited by the TBM function design, the first 80 m behind the tunnel face is a non-shotcrete area reinforced with only anchor bolt and steel arch support, which is a high incidence of rockburst. Four measures are required to handle the rockburst risk during TBM excavation: reinforced support, stress release, surrounding rock improvement, and MS monitoring.
2.2 Geological conditions
The Tianshan-Shengli tunnel is located in the Tianshan Mountains region southwest of Urumqi, Xinjiang. The straight-line distance from the tunnel entrance to Urumqi is approximately 92 km. According to the geology survey report provided by China Communications Construction Group Co., Ltd., which is implementing the tunnel project, the tunnel strata are mainly composed of siltstone, granodiorite, granite, marble, granite porphyry, and so on, as shown in Figure 2. There are about 14 main faults in the tunnel excavation area, and the horizontal width varies from 20 m to 140 m. Rock mechanics experiments indicate that the saturated unconfined compressive strength (UCS) of granodiorite and granite is approximately 71–120 MPa, while it is 41–92 MPa for marble and 43–58 MPa for granite porphyry. The groundwater in the tunnel area consists of three types: loose rock pore water, bedrock fissure water, and karst water, which is mainly supplemented by atmospheric precipitation.
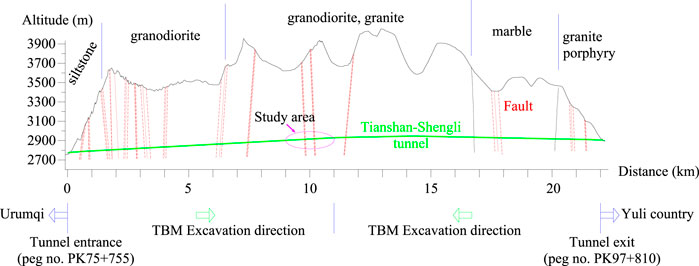
Figure 2. Geological profile of the Tianshan-Shengli tunnel along the middle pilot tunnel (provided by China Communications Construction Group Co., Ltd.).
The hydraulic fracturing technique and numerical simulation are employed to measure geostress, and Figure 3 presents the geostress distribution along the middle pilot tunnel. It shows that the maximum horizontal stress in the tunnel area is generally greater than the vertical stress. In detail, when the buried depth is deeper than 100 m, the maximum horizontal stress (σH) is approximately 7.3–32.4 MPa, while the minimum horizontal stress (σh) is 3.1–23.9 MPa and the vertical stress (σZ) is 2.6–30.7 MPa. In accordance with the ratio between maximum shear stress along the tunnel section and the UCS of surrounding rock, most of the tunnel region has a higher rockburst risk level when the buried depth is more than 600 m.
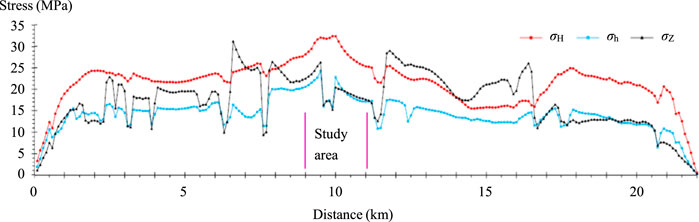
Figure 3. Geostress inversion results along the tunnel.
In this study, the MS monitoring region is approximately 2 km long, approximately 9–11 km from the tunnel entrance, corresponding to peg no. PK84+632 ∼ PK86+782 in the study area shown in Figure 2, and the depth is approximately 700–1,000 m. Furthermore, two faults located in the middle of the monitoring region, Fw-11 and Fw-12, may induce a serious fracture rockburst. A strain rockburst is possible in other parts of the monitoring region with granodiorite and granite strata.
3 TBM excavation MS monitoring system
3.1 MS monitoring principle
Microfracture generation and energy release always occur before a rockburst, and MS sensors can capture MS signals released from rock mass fracture effectively. Under the static-dynamic loading and the original flaws, the microfracture will penetrate the preexisting flaws to generate macroscopic fragmentation, followed by tensile and shear failure with energy dissipation (Feng et al., 2021; Feng et al., 2022 P.), which radiates outward in the form of MS waves. Hence, MS monitoring technology is a mature measure to forecast the source location of rockburst by analyzing the temporal and spatial evolution characteristics of MS events (Jiang et al., 2020). However, it is still difficult to accurately predict the time of a rockburst occurrence. The MS monitoring principle is introduced in Figure 4.
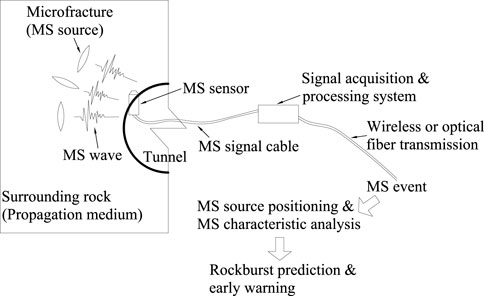
Figure 4. MS monitoring principle.
It can be seen from Figure 4 that a rockburst will generate MS signals induced by the microfractures of surrounding rock or the slip of fault during the stress redistribution. Meanwhile, the MS signals radiate outward in the form of MS waves along the propagation medium (that is, surrounding rock). In order to capture these original MS waves in real time and analyze MS signal features, a set of sensors is used to monitor the vibration waves in rock mass in real time. The sensors are placed inside the surrounding rock in boreholes or tightly coupled to the surrounding rock surface. When the vibration wave amplitude captured by the sensors increases significantly, it is regarded as an MS triggering, but the increase may be caused by an MS event or by rock drilling, TBM rock cutting, blasting, and so on. At the same time, the vibration signals are converted to analog electrical signals by sensors and then sent to the signal acquisition and processing instrument through the signal cable. To filter out the vibration wave of non-MS events, preliminary signal processing is completed by the signal acquisition and processing instrument, and then the effective MS event features are transmitted to the data storage server located in the data analysis center through wireless or fiber optic networks.
Based on these effective MS event signals, the location, moment magnitude, signal strength, and energy of the fracture source are determined by further processing and analysis. Then, the rockburst risk information can be evaluated by analyzing a series of recorded MS event waveform characteristics, including the potential rockburst location and risk level.
3.2 BGRIMM Seismic Network (BSN) system characteristic
At present, there are many mature MS monitoring systems in the world: ESG Solutions in Canada, SOS and ARAMIS/MS in Poland, as well as ISS in South Africa (Cao et al., 2009; Chen et al., 2020) and IMS in Australia (Goldswain, 2020). As the demand for rockburst prediction and early warning increases in the mine, tunnel, and hydropower projects in China, more and more Chinese research groups have started to develop MS monitoring systems independently in the past decades. For instance, a new, high-precision, intelligent MS monitoring system jointly developed by the Institute of Rock and Soil Mechanics, Chinese Academy of Sciences, and Wuhan Seaquake Technology Co. Ltd. has been widely used in multiple mine, tunnel, and hydropower projects (Yuan-hui et al., 2018).
Since 2014, the Beijing General Research Institute of Mining and Metallurgy (BGRIMM) has also been developing the BSN (BGRIMM Seismic Network) monitoring system. The system architecture is shown in Figure 5. It has the functions of signal acquisition, multi-channel time synchronization, denoising, automatic onset time picking, and source location. Unlike other systems, the BSN system has a cloud service to integrate data collection, transmission, automatic analysis, and real-time warning. In detail, based on in situ monitoring and cloud service platform analysis, it first establishes template libraries, such as data reports, analysis reports, and early-warning information, and then, by the real-time synchronization of in-site data and the foreground application development of the cloud platform, the whole process of MS monitoring publishes to the cloud platform, including data synchronization, MS event analysis, statistics, statements, and early-warning reports. It is convenient for users to obtain the parameters of the MS event and its position information on time. In addition, it also supports the real-time push of early-warning information to users when large-energy MS events occur.
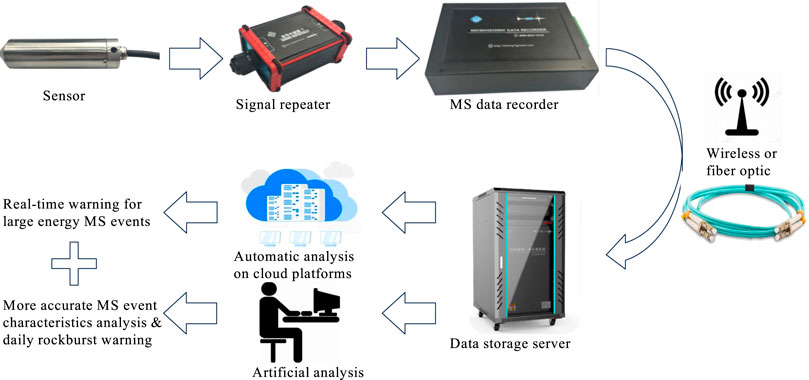
Figure 5. BSN system architecture.
The main BSN system parameters are listed in Table 1. The accelerometer has a wider monitoring frequency domain and a higher sensitivity than a geophone. The measurement distance of the accelerometer is smaller, and the accelerometer may cause peak clipping of MS waves in near-field monitoring because the amplitude of large-energy MS events may be beyond the measuring range of the accelerometer (Hu et al., 2020). In addition, the BSN system supports the self-diagnosis of sensor malfunction and self-identification of sensor serial numbers. The data acquisition and recorder instrument uses 100–240 V AC as the power supply and quickly switches to an uninterruptible power supply (UPS) battery in the event of external power failure. The data acquisition process is as follows: 1) the sensor captures the MS signal and converts it into an analog signal, 2) the electrical signal is transmitted to the data conversion device through the signal cable, and the data conversion device converts the electrical signal into a data signal, 3) the data signal is transmitted to the data acquisition device through the network cable for collection and storage.
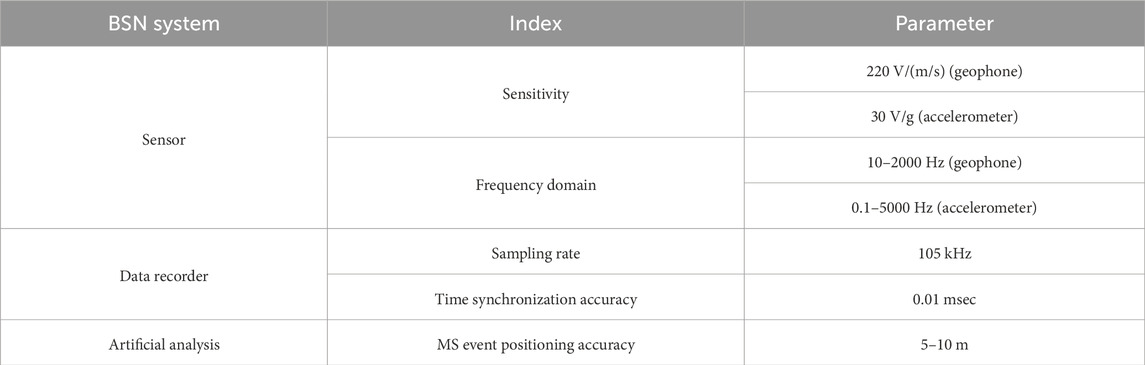
Table 1. Main parameters of the BSN system.
For data processing, a wavelet threshold denoising algorithm based on synchronous extrusion wavelet transform (Daubechies et al., 2011) is implemented in the BSN system. The system filtering consists of multiple filters based on band-pass, notch, high-pass, and low-pass filtering methods, and the frequency domain characteristics of tunnel background noise waves are collected and analyzed first to reduce the impact of tunnel background noise. It adopts the synchronous extrusion wavelet analysis method to identify the MS event efficiently. On the one hand, the one-dimensional time-domain signal is transformed to the two-dimensional time-frequency domain in the continuous wavelet transform, and the energy is compressed at the same time to avoid energy leakage. The time and frequency range of the MS signal can be clearly distinguished for effective detection and extraction via the time-frequency spectrum.
3.3 In situ sensor array
There have been many rockburst accidents in the Tianshan-Shengli tunnel since construction started. To avoid heavy rockburst accidents in the final stage of construction, the BSN system was adopted in August 2023 to monitor the MS activities in the middle tunnel excavated by TBM and predict and provide early warning of rockbursts. In this case study, the BSN system adopts the geophone, as mentioned in Table 1, which supports eight uniaxial geophones. It is first assembled and debugged outside the tunnel, as shown in Figure 6. The data acquisition and processing box has the advantages of complete functions, compact structure, and easy to carry. The data exchange between the data acquisition and storage instruments is completed through a 4G wireless network to avoid the interruption of long-distance optical fiber transmission data affected by construction.
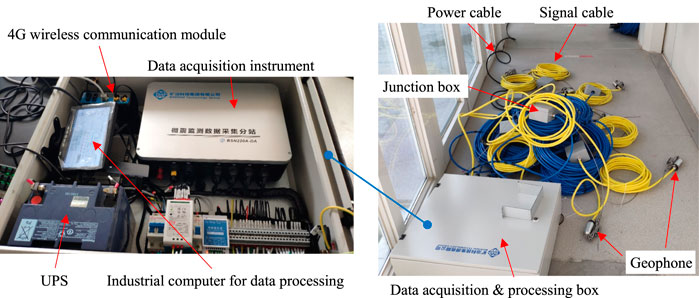
Figure 6. BSN system assembly and debugging.
In the initial installation state, four front-row geophones were placed at approximately 20 m behind the tunnel face, and four rear-row geophones were placed roughly 45 m from the tunnel face. That is, there was a distance of 25 m between the two rows of sensors (Figure 7). The system is composed of four geophones for each sensor cross section, and it is limited by the borehole drilling capacity of the TBM, the installation method selected to install the sensors on the rock surface. In terms of specific operation, 1) it selects four bolt tails as the installation points of sensors at the sensor cross section. The four bolts cannot be in the same axial direction and should be distributed on the left, middle left, middle right, and right side of the cross section. At the same time, the two adjacent installation points should be staggered by 1–2 m as far as possible. Attention should be paid to conducting a test on whether the anchoring between the bolt and surrounding rock is effective, and the bolt tail of a loose bolt cannot be selected as the installation location. Then, 2) semicircular steel tubes are welded at the selected bolt tails. The axial direction of the steel tube should be parallel to the axial direction of the tunnel. For each sensor installation point, the geophone is fastened in the inner diameter of the semicircular steel tube by using two hose clamps. After the installation of the sensor, the spatial position coordinate value of the sensor should be measured with the assistance of the construction crew. Finally, 3) for each sensor cross section, four signal cables are combined into one cable, and cable ties or hooks are used to arrange, bind, and fix the cable to the roof bolt mesh along the tunnel roof. The cable is extended to the data acquisition and processing box, which is initially fixed in a position 10 m behind the rear-row sensors.
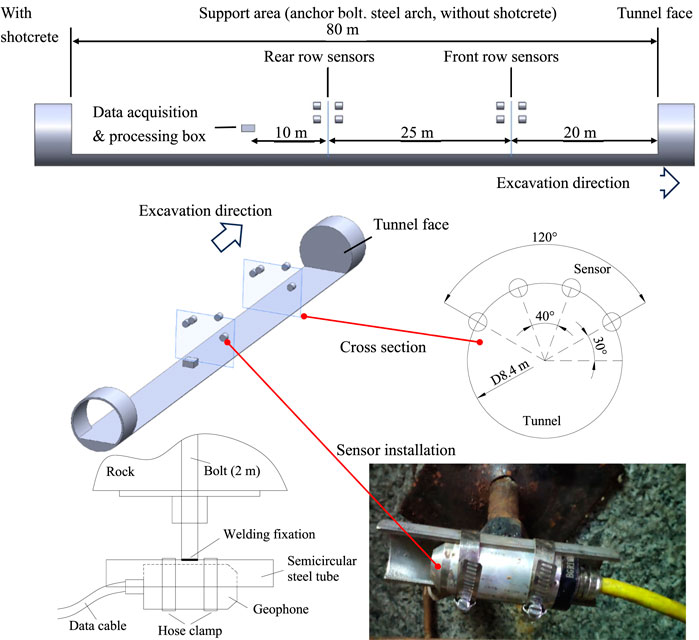
Figure 7. Initial sensor array and the installation scheme of the BSN system.
The migration installation state involves sensor recovery and reinstallation. To guarantee the monitoring quality and to avoid burying the rear row sensors in the shotcrete, each time the TBM advances approximately 25 m, the rear row sensors must be moved forward to keep the sensors close to the tunnel face. It is easy to recycle the rear row sensors after removing the hose clamp. Reinstallation is similar to the initial installation: 1) selecting installation positions in the new cross section of the front row sensors, 2) welding semicircular steel tubes, fastening geophones, and measuring their coordinate value, and 3) arranging the signal cables.
The microseismic source location accuracy is affected by many factors, including sensor array distribution, wave velocity model, first arrival time picking, and so on (Cheng et al., 2018). For the sensor array of the microseismic monitoring network, the key monitoring area and the feasibility of sensor installation should be taken into full consideration. In a TBM tunnel excavation, the higher rockburst risk area is approximately 100 m behind the tunnel face, which does not have shotcrete support, especially in the roof area approximately 50 m behind the tunnel face. Locating a microseismic event requires at least four sensors that detect microseismic signals. Therefore, each sensor section of the microseismic monitoring network consists of four sensors. Meanwhile, to avoid the microseismic source solution equation not converging or finding no solution, the sensor spacing in the sensor section should increase appropriately.
4 Preliminary application of rockburst prediction and early warning
For engineering reasons, the TBM is down most of the time during the MS monitoring period. Although the BSN system remains operational during the TBM downtime, the MS activities in the support area without shotcrete are weak, and the corresponding rockburst risk is extremely low. Therefore, this study mainly introduces several case studies for rockburst prediction and early warning during the normal TBM excavation period.
4.1 MS monitoring program
MS waves are not physically different from seismic waves, and they can be understood as seismic waves with lower energy. With respect to MS event waveform recognition and denoising, the TBM working environment is complex, resulting in the MS monitoring with several complex noise seismic signals, where typical noises include TBM rock breaking signals, rock drilling signals of the bolt rig, blasting signals, etc. One of the most obvious features of the MS event waveform is its short duration, generally only a few tenths of a second or so. The characteristic of small amplitude is also an important criterion for distinguishing effective MS signals (Chen et al., 2018). The phase features of MS events include arrival time, waveform, amplitude, period, etc., while the data extracted from MS events mainly include the arrival time and phase features of the MS P- and S-waves. The P-wave is picked up according to the difference in statistical properties of waveform data before and after the arrival of the MS signal, and the Akaike information criterion (AIC) method is used to pick up the P-arrival time in the selected time window. The difference between P- and S-wave MS signals can be analyzed using the Hilbert–Huang transform method. The instantaneous frequency component of the signal can be obtained to obtain the first arrival time of the S-wave. After determining the initial arrival time of the P- and S-waves, the phase, amplitude, period, and other parameters can be extracted by time-domain analysis of the MS waveform, which provides effective parameters for MS source positioning, MS source parameter calculation, and post-microseismic analysis.
Figure 8 presents a typical MS signal waveform of the BSN system monitored in the Tianshan-Shengli tunnel. A rock drilling signal has a long duration with multiple intermittent wave crests. The signal induced by blasting excavation is also sustained for a long time with numerous continuous wave crests, and its wave attenuation is far slower than MS signals. In a word, these noise signals have obvious characteristics compared with the MS signals generated by the surrounding rock fracture.
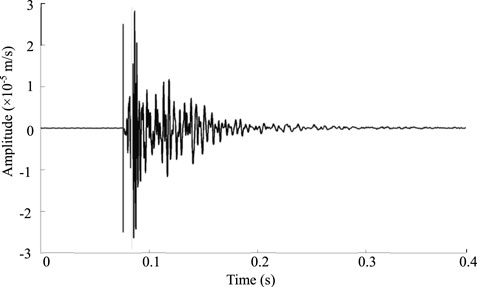
Figure 8. MS signal waveform of the BSN system in the Tianshan-Shengli tunnel.
The MS signals are essentially elastic waves propagating within the rock mass, with a wave speed on the order of kilometers per second. The accurate wave speed is a crucial parameter for MS data acquisition and processing to ensure the accuracy of MS source positioning. Before MS monitoring, granite samples were taken from the tunnel face, and then acoustic wave speed experiments were completed at Xinjiang University. Table 2 gives the test results, while there is a certain error for positioning if using the experimental value because of the complexity of the surrounding rock composition. A wave speed correction must be carried out after rock mass property changes. The correction is based on the inversion technique of the wave speed field of the active source signal. The wave speed and the system positioning are calibrated by manually knocking the surrounding rock within the tunnel and then calculating the location of the knocking point using the BSN system. In addition to the knock test, when the TBM cuts and breaks rock mass, the source parameters and the spatial relationship between the source and sensors are known, so the rock mass wave speed can also be corrected by the rock-breaking signal.

Table 2. Wave speed experiments of granite.
Apart from the wave speed, determining the spatial location of the MS source is a challenging task. In 1912, Geiger (1912) proposed a method based on the ideal earth in the time domain, and its principle is to linearize the nonlinear problem and give the least square solution. Because the positioning equation is a nonlinear equation, the Geiger method makes it easier for the inversion to fall into the local minimum, and then the accuracy of inversion positioning is reduced. In contrast, the nonlinear positioning method can avoid the solution falling into the local minimum point because it does not require the calculation of partial derivatives and has a weak dependence on the initial position, but it is of low efficiency and requires much calculation. A double-difference earthquake location algorithm was developed by Waldhauser and Ellsworth to reduce the effect of rock mass structure on wave speed and positioning accuracy (Waldhauser and Ellsworth, 2000). The double-difference algorithm minimizes positioning errors due to unmodeled velocity structure without the use of station corrections. Therefore, the positioning algorithm of the BSN system combines the Geiger method and the double-difference algorithm.
4.2 Rockburst prediction program
Quantitative analysis of the MS data against reasonable rockburst prediction criteria to produce an early warning is an important procedure. However, the occurrence of MS events usually has certain random characteristics due to the complexity of the geological environment. Hence, statistical theory is usually used to analyze MS events in a certain time and space. So far, a variety of parameters have been selected as MS event statistical parameters and rockburst risk assessment indicators (Ma et al., 2015; Mendecki, 2023), including 1) MS event numbers, such as MS event distribution density and frequency concentration ratio, 2) MS event energy, such as energy density, energy index, energy ratio, total amount of energy, moment magnitude, apparent stress, apparent volume, 3) MS event number and energy composite index, called the b-value. In this study, the BSN system employs three parameters as evaluation indexes: the number of MS events, moment magnitude, and energy. Among them, MS energy is defined as the energy radiated from the MS source, which is the occurrence position of the microfracture in the rock mass. The radiated seismic energy (EP,S) can be calculated by Eq. 1 (Liu J. P. et al., 2020), and it is the most important and widely used rockburst warning parameter. In general, the radiated seismic energy (EP) of the P-wave is much smaller than that (ES) of the S-wave (Boatwright and Fletcher, 1984).
where ρ is the rock density, vP,S is the velocity of P- or S-wave, R is the propagation distance of MS wave, μcorr is the velocity pulse in the radiation pattern, and ts is the MS event duration.
Moment magnitude, MW, is another important parameter in MS monitoring, calculated by Eq. 3, and it mainly describes the mechanical strength of a seismic event. The moment magnitude of an MS event is determined by the following equations (Stork et al., 2014). M0 must be estimated, and, therefore, MW is calculated. In addition to Eq. 2, M0 can be estimated based on the MS waveform in the time domain or the frequency domain.
where M0 is the seismic moment, u is the shear modulus, D is the average slip distance of microfracture, and S is the area of the microfracture surface.
According to existing research experience, the energy of MS events varies from 0 to thousands or tens of thousands, but the indicator range of the moment magnitude may only be from −3 to 3 for a microseismic event. To better classify the rockburst risk level, the MS event energy was considered as the primary evaluation index on account of its large indicator range, and the other two parameters, moment magnitude and number of MS events, were regarded as the auxiliary evaluation indexes. The rockburst risk level prediction criteria were first established based on previous project experience and then modified to form reasonable prediction criteria according to the in situ microseismic activity and rockburst situation of the specific project. It follows that it is almost impossible to summarize one uniform criterion for the rockburst prediction, especially for different monitoring projects. Table 3 exhibits the prediction criteria suitable for the Tianshan-Shengli tunnel. It should be noted that only the index range of the slight rockburst is verified in the Tianshan-Shengli tunnel, while the index ranges of other rockburst risk levels are based on previous project experience. The criteria values need to be corrected and verified if they will be used as a reference for other projects.
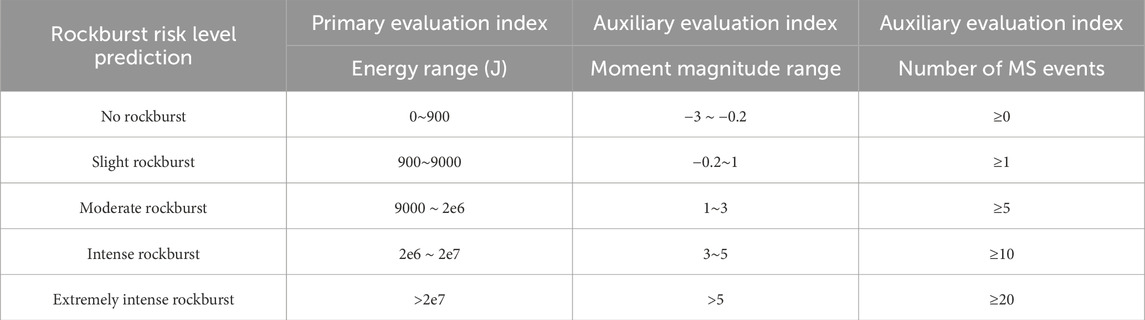
Table 3. Rockburst risk level prediction criteria.
In Table 3, the rockburst risk level is determined mainly on the basis of the maximum daily MS event energy monitored. The event energy is highly positively correlated with the moment magnitude, and the latter can be used as an auxiliary index. The number of daily MS events is generally not used as an evaluation index, but the daily evolution of the number of events helps to determine the rockburst risk level and can be used as an auxiliary index. The threshold values documented in Table 3 are the most significant and key parameters to assess the rockburst risk level in a specific MS monitoring situation. These values are determined after field verification and correction, in combination with our previous practical experience in other projects. The listed threshold values are validated via field application comparison; that is, the actual rockburst situation is compared with the rockburst level predicted according to the monitoring data and prediction criteria.
4.3 Application case of rockburst early warning
The BSN system operates continuously for 24 h every day, except during sensor migration. In the process of carrying out MS monitoring and rockburst prediction, the working outputs are presented in the form of daily monitoring and early-warning reports. Every day, technicians need to visit and check the rock mass situations near the tunnel face during TBM maintenance to verify the accuracy of the previous day’s warning results. During the checking, the location of the rockburst should be photographed, recorded, and marked with spray paint to facilitate future comparison and research. For the Tianshan-Shengli tunnel, the TBM maintenance time is from 8 a.m. to 12 a.m. In the meantime, other technicians extract the previous day’s MS event monitoring data from the data storage server and then write the daily report to predict and early warn about the current rockburst risk level, combining with MS data, surrounding rock properties, and prediction criteria.
The following is an application example case from 11 August 2023. The daily report documented eight MS events in the warning area from 09:00 on 10 August 2023 to 09:00 on 11 August 2023, with energies ranging from 0.12 J to 7645 J and moment magnitudes ranging from −1.56 to 0.51. Of these, one MS event had a large energy and moment magnitude. The MS events were mainly concentrated on the left and top of the tunnel, as shown in Figure 9. In the warning area of the tunnel, the main surrounding rock is granodiorite, which has a breezed, blocky structure with slightly developed joints and cracks. The rock mass is relatively complete with a fissured blocky structure, and uniaxial compressive strength Rc = 71–120 MPa. The surrounding rock classification is grade III, with average self-stability. Hence, it is inferred that the rock mass fracture is more likely to occur near peg no. PK84+627∼PK84+646, and there is a slight rockburst risk. The measure recommended in the daily report to handle rockburst risk is to strengthen the surrounding rock inspection and personnel protection near the risk area. The in situ actual rockburst that occurred on 11 August 2023 confirmed the report results (see Figure 9). The rockburst occurred in the roof area at a location (peg no. PK84+633) close to the warning area. Potential rockbursts generally occur within 1–2 days after the rockburst risk early warning in the daily report, and the lead time in this application case was approximately 10 h.
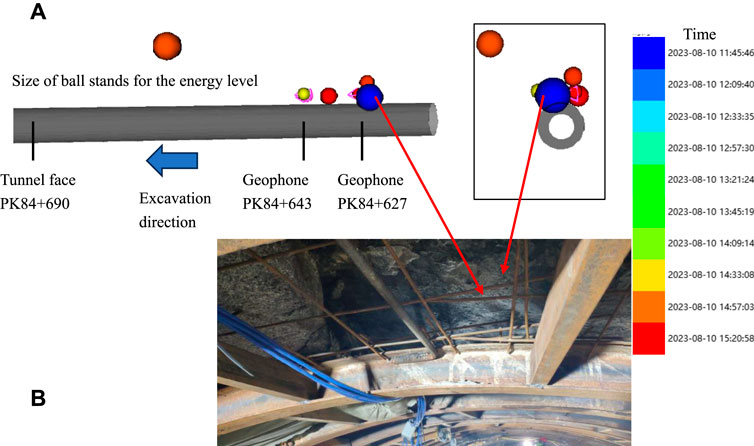
Figure 9. Case 1: Spatial and temporal distribution characteristics of MS events and the actual occurrence of rockburst. (A) Spatial and temporal distribution characteristics of MS events on 2023.08.10; (B) Slight rockburst in the roof on 2023.08.11.
In another application case on 16 August 2023, the daily report mentioned that eight MS events were detected from 09:00 on 15 August 2023 to 09:00 on 16 August 2023 in the warning area. The energies of MS events ranged from 4.5 J to 1030 J with moment magnitudes of −1.06 to −0.19. Seven of the MS events had large energies and moment magnitudes. The monitored MS events were mainly concentrated in peg no. range of PK84+682 ∼ PK84+692, as illustrated in Figure 10. Furthermore, in combination with the rock mass properties and the surrounding rock classification similar to Case 1, the daily report on 16 August inferred that the rock mass fracture was more likely to occur in the roof near peg no. PK84+682 ∼ PK84+692, which was the location of the monitored MS events with large energies, and there was a slight rockburst risk. Recommended measures to handle rockburst risk included strengthening the surrounding rock inspection in the existing rockburst area, cleaning loose stone in a timely manner, covering and filling the rockburst area, and strengthening support to avoid continued rock caving. After the daily report, rockbursts occurred at multiple warning locations, including peg nos. PK84+677 and PK84+687 (see Figure 10). The second case also reveals a good agreement between the rockburst prediction and early-warning achievements and site survey results.
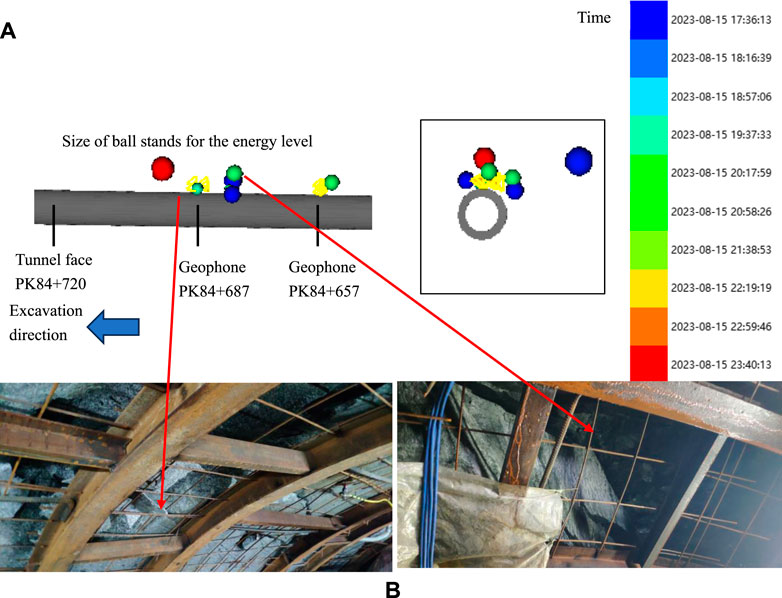
Figure 10. Case 2: Spatial and temporal distribution characteristics of MS events and the actual occurrence of rockburst. (A) Spatial and temporal distribution characteristics of MS events on 2023.08.15; (B) Slight rockburst at the peg nos. PK84+687 and PK84+677 on 2023.08.16.
Accurate rockburst prediction and early-warning results can help the tunnel TBM construction crew to take measures in advance to deal with the rockburst risk. Based on the two application cases, most of the rockburst in the Tianshan-Shengli tunnel is delayed rockburst. Combined with previous rockburst records, the rockburst generally occurs at least 2 days or more after the rock mass is exposed from the TBM tail shield, and the rockburst mainly occurs at the tunnel vault and spandrel and then at the sidewall. In this application case, the rockburst occurred approximately 24 h after the early-warning report.
The comprehensive prediction accuracy of the BSN system is more than 90%, including positive and negative predictions. The accuracy of positive rockburst prediction is about 85%. To minimize false early warnings, it is necessary to continuously correct and improve the prediction criteria. Moreover, the positioning algorithm and the influence of sensor arrays and parameters need further study.
The characteristic evolution of the monitored MS events from 10 to 16 August is summarized in Figure 11. It can be seen that the change of maximum energy has a good positive correlation with that of maximum moment magnitude, so it is reasonable to select one parameter as the primary evaluation index of the rockburst risk level and another as the auxiliary index, as mentioned in Table 3. Based on statistical analysis of a large amount of monitoring data, their logarithmic values are linearly correlated. In addition, there is not a clear correlation between the number of MS events and maximum energy or moment magnitude. Hence, it is infeasible to predict rockburst effectively only by the number of MS events.
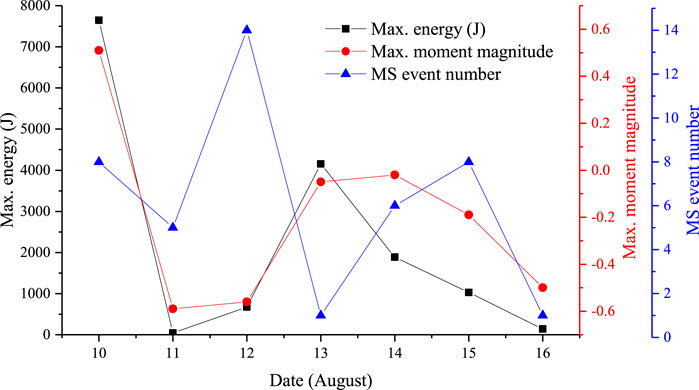
Figure 11. MS event characteristic evolution from 10 August 10 to 16 August.
Because of the artificial analysis and prediction workflow, the prediction period is delayed by 1 day and is not ideal for providing timely warning about large-energy or large-magnitude MS events to the TBM construction operations. The BSN cloud service platform can make up for this deficiency. The MS data can be automatically transmitted from the data storage server to the cloud platform in real time after the MS data are sent from the data acquisition box to the data storage center. At the same time, the automatic analysis of MS data is also completed in the cloud platform in real time, including the analysis results of MS event position, energy, moment magnitude, and so on. The automatic analysis process is the same as the artificial analysis; that is, the MS event identification is based on a waveform, and then event characteristic calculations include energy and moment magnitude. When the energy or moment magnitude of an event exceeds a set threshold, the cloud platform will send a warning of a large-energy MS event to users through the cloud platform’s interactive interface, messages, and emails. The threshold adopts the value of a slight rockburst risk level mentioned in Table 3, and the warning time of a large-energy MS event is a few seconds after an event that exceeds the threshold. Because the analysis is affected by the complex signal environment in the tunnel and the low accuracy of MS signal waveform recognition, the warning messages from the BSN cloud service platform should be handled first by the MS monitoring group. That group will further identify the effectiveness of the detected MS event and then decide whether to alert to a rockburst risk for the tunnel construction team. The BSN cloud service platform provides a real-time warning for large-energy events that is more timely than a daily artificial analysis rockburst report. Furthermore, the BSN cloud service platform also has functions such as a system failure alarm and MS activity statistics, as shown in Figure 12.
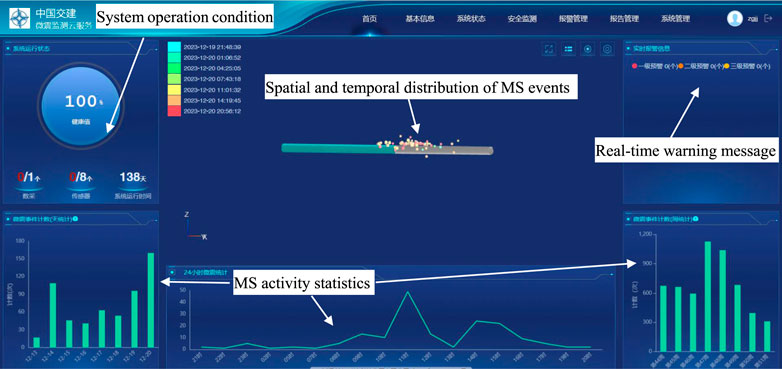
Figure 12. Interactive interface of the BSN cloud service platform.
The BSN monitoring system has good reliability based on its preliminary application in the Tianshan-Shengli tunnel. The MS monitoring can effectively predict and warn of rockburst disasters for the tunnel excavated by TBM by using the artificial analysis of daily reports and automatic analysis of the cloud service platform. A large number of MS events clustered near the sensors is a common phenomenon for the BSN system. As the distance from the sensor array increases, the system sensitivity decreases, and more work needs to be done to improve the ability of the BSN system to detect MS events far from the sensors.
Compared with the existing methods used for rockburst prediction and early warning in tunnel excavation projects, the proposed approach based on the BSN system is simple to install and offers high timeliness and automation. The obvious limitations include shorter monitoring distances and fewer application cases.
5 Conclusion
This article presents a valuable application case of rockburst prediction and early warning in a tunnel excavated by TBM using a new MS monitoring system, the BSN system, including the monitoring principle, system characteristics, and sensor array. The following conclusions can be drawn.
(1) The potential rockburst risk level of the Tianshan-Shengli tunnel is analyzed first by its geological characteristics and rock mechanical properties. Within the 2 km monitoring area, most areas are at risk of strain rockburst due to higher geostress and rock strength. When the tunnel face is close to a geological fault, the probability of a severe fracture rockburst is higher because more energy is stored in the large-scale geologic structure.
(2) The BSN monitoring system developed by BGRIMM has hardware advantages, and the BSN system combines the Geiger method and the double-difference algorithm as the positioning algorithm. Its comprehensive positioning error is 5–10 m. It is an outstanding highlight for the BSN system that combines artificial analysis and cloud platform automatic analysis. The former provides more accurate daily rockburst prediction and early warning, while the latter offers real-time early warning for large-energy or large-magnitude MS events. As for the sensor installation, a new layout scheme is proposed for the Tianshan-Shengli tunnel. The geophone is fixed on the tail of a 2 m bolt with the help of a semicircular steel tube and hose clamp, thus reducing the amount of drilling work and improving the convenience of installation and recycling.
(3) According to the preliminary application of the BSN system in the Tianshan-Shengli tunnel, rockbursts in the middle pilot tunnel excavated by TBM are mainly delayed rockbursts that occur approximately 2 days after the rock mass is exposed from the TBM tail shield. The occurrence position of a rockburst can be predicted, and the rockburst mainly occurs at the tunnel vault and spandrel and then at the sidewall. However, it is difficult to forecast the occurrence time of a rockburst, even though the generation time of MS events can be determined. In terms of MS activity and rockburst risk level prediction, the BSN system selects the MS event energy as the primary evaluation index of the rockburst risk level and the number of MS events and moment magnitude as the auxiliary index. The evolution of maximum energy over time is highly positively correlated with that of maximum moment magnitude. For the two application cases mentioned in this article, the rockburst prediction and early-warning achievements have good agreement with the site survey results. Therefore, the BSN monitoring system is a reliable tool to predict and provide early warning of rockburst disasters.
Data availability statement
The original contributions presented in the study are included in the article/supplementary material; further inquiries can be directed to the corresponding author.
Author contributions
JZ: formal analysis, investigation, and writing–original draft. DaH: conceptualization, funding acquisition, methodology, and writing–original draft. YC: formal analysis, investigation, and writing–original draft. DeH: data curation, investigation, and writing–original draft. XZ: data curation, investigation, and writing–original draft. FW: writing–review and editing. YP: writing–review and editing.
Funding
The author(s) declare that financial support was received for the research, authorship, and/or publication of this article. The authors acknowledge the financial support provided by the National Key Research and Development Program of China (No. 2021YFC2902102).
Conflict of interest
Authors JZ, DH, and YC were employed by BGRIMM Technology Group.
Authors DeH and XZ were employed by China First Highway Engineering Co., Ltd., China Communications Construction Group Co., Ltd.
The remaining authors declare that the research was conducted in the absence of any commercial or financial relationships that could be construed as a potential conflict of interest.
Publisher’s note
All claims expressed in this article are solely those of the authors and do not necessarily represent those of their affiliated organizations, or those of the publisher, the editors, and the reviewers. Any product that may be evaluated in this article, or claim that may be made by its manufacturer, is not guaranteed or endorsed by the publisher.
References
Arshad, K., and Abdullah, R. A. (2016). A review on selection of tunneling method and parameters effecting ground settlements. Electron. J. Geotech. Eng.
Barton, N., Lien, R., and Lunde, J. (1974). Engineering classification of rock masses for the design of tunnel support. Rock Mech. Felsmech. Mécanique Des. Roches 6, 189–236. doi:10.1007/BF01239496
Boatwright, J., and Fletcher, J. B. (1984). The partition of radiated energy between P and S waves. Bull. Seismol. Soc. Am. 74, 361–376. doi:10.1785/bssa0740020361
Cai, M., Kaiser, P. K., Morioka, H., Minami, M., Maejima, T., Tasaka, Y., et al. (2007). FLAC/PFC coupled numerical simulation of AE in large-scale underground excavations. Int. J. Rock Mech. Min. Sci. 44, 550–564. doi:10.1016/j.ijrmms.2006.09.013
Cai, W., Dou, L., Zhang, M., Cao, W., Shi, J. Q., and Feng, L. (2018). A fuzzy comprehensive evaluation methodology for rock burst forecasting using microseismic monitoring. Tunn. Undergr. Sp. Technol. 80, 232–245. doi:10.1016/j.tust.2018.06.029
Cao, A., ye, DOUL.ming, Yan, R. ling, Jiang, H., Lu, C., ping, D. U., et al. (2009). Classification of microseismic events in high stress zone. Min. Sci. Technol. 19, 718–723. doi:10.1016/S1674-5264(09)60131-9
Chen, B. R., Feng, X. T., Fu, Q. Q., Wang, B., Zhu, X. H., Li, T., et al. (2020). Integration and high precision intelligence microseismic monitoring technology and its application in deep rock engineering. Yantu Lixue/Rock Soil Mech. doi:10.16285/j.rsm.2019.1062
Chen, F., Ma, T., Tang, C., Du, Y., Li, Z., and Liu, F. (2018). Research on the law of large-scale deformation and failure of soft rock based on microseismic monitoring. Adv. Civ. Eng. 2018, 1–8. doi:10.1155/2018/9286758
Cheng, J., Song, G., Sun, X., Wen, L., and Li, F. (2018). Research developments and prospects on microseismic source location in mines. Engineering 4, 653–660. doi:10.1016/j.eng.2018.08.004
Cheon, D.-S., Park, E.-S., Jung, Y.-B., Park, C., and Synn, J.-H. (2008). Monitoring technique using acoustic emission and microseismic event. Tunn. Undergr. Sp.
Daubechies, I., Lu, J., and Wu, H. T. (2011). Synchrosqueezed wavelet transforms: an empirical mode decomposition-like tool. Appl. Comput. Harmon. Anal. 30, 243–261. doi:10.1016/j.acha.2010.08.002
Deng, M. (2018). Challenges and thoughts on risk management and control for the group construction of a super-long tunnel by TBM. Engineering 4, 112–122. doi:10.1016/j.eng.2017.07.001
Dou, L. ming, Mu, Z. long, Lilei, Z. C., ye, A., and Gong, S. yuan (2014). Research progress of monitoring, forecasting, and prevention of rockburst in underground coal mining in China. Int. J. Coal Sci. Technol. 1, 278–288. doi:10.1007/s40789-014-0044-z
Farhadian, H. (2021). A new empirical chart for rockburst analysis in tunnelling: tunnel rockburst classification (TRC). Int. J. Min. Sci. Technol. 31, 603–610. doi:10.1016/j.ijmst.2021.03.010
Feng, G. L., Chen, B. R., Xiao, Y. X., Jiang, Q., Li, P. X., Zheng, H., et al. (2022a). Microseismic characteristics of rockburst development in deep TBM tunnels with alternating soft–hard strata and application to rockburst warning: a case study of the Neelum–Jhelum hydropower project. Tunn. Undergr. Sp. Technol. 122, 104398. doi:10.1016/j.tust.2022.104398
Feng, G. L., Yoshida, S., and Lacidogna, G. (2023). Special issue on new advances in acoustic emission and microseismic monitoring technologies in civil engineering. Appl. Sci. 13, 969. doi:10.3390/app13020969
Feng, P., Xu, Y., and Dai, F. (2021). Effects of dynamic strain rate on the energy dissipation and fragment characteristics of cross-fissured rocks. Int. J. Rock Mech. Min. Sci. 138, 104600. doi:10.1016/j.ijrmms.2020.104600
Feng, P., Zhao, J., Dai, F., Wei, M., and Liu, B. (2022b). Mechanical behaviors of conjugate-flawed rocks subjected to coupled static–dynamic compression. Acta Geotech. 17, 1765–1784. doi:10.1007/s11440-021-01322-6
Feng, X. T., Liu, J., Chen, B., Xiao, Y., Feng, G., and Zhang, F. (2017). Monitoring, warning, and control of rockburst in deep metal mines. Engineering 3, 538–545. doi:10.1016/J.ENG.2017.04.013
Geiger, L. (1912). Probability method for the determination of earthquake epicenters from the arrival time only. Bull. St. Louis Univ.
Goodfellow, S. D., and Young, R. P. (2014). A laboratory acoustic emission experiment under in situ conditions. Geophys. Res. Lett. 41, 3422–3430. doi:10.1002/2014GL059965
He, M., Xia, H., Jia, X., Gong, W., Zhao, F., and Liang, K. (2012). Studies on classification, criteria and control of rockbursts. J. Rock Mech. Geotech. Eng. 4, 97–114. doi:10.3724/sp.j.1235.2012.00097
Hu, L., Feng, X. T., Xiao, Y. X., Wang, R., Feng, G. L., Yao, Z. B., et al. (2020). Effects of structural planes on rockburst position with respect to tunnel cross-sections: a case study involving a railway tunnel in China. Bull. Eng. Geol. Environ. 79, 1061–1081. doi:10.1007/s10064-019-01593-0
Jiang, R., Dai, F., Liu, Y., and Wei, M. (2020). An automatic classification method for microseismic events and blasts during rock excavation of underground caverns. Tunn. Undergr. Sp. Technol. 101, 103425. doi:10.1016/j.tust.2020.103425
Li, P. X., Chen, B. R., Xiao, Y. X., Feng, G. L., Zhou, Y. Y., and Zhao, J. S. (2023). Rockburst and microseismic activity in a lagging tunnel as the spacing between twin TBM excavated tunnels changes: a case from the Neelum-Jhelum hydropower project. Tunn. Undergr. Sp. Technol. 132, 104884. doi:10.1016/j.tust.2022.104884
Li, P. X., Feng, X. T., Feng, G. L., Xiao, Y. X., and Chen, B. R. (2019). Rockburst and microseismic characteristics around lithological interfaces under different excavation directions in deep tunnels. Eng. Geol. 260, 105209. doi:10.1016/j.enggeo.2019.105209
Liang, Z., Xue, R., Xu, N., Dong, L., and Zhang, Y. (2020a). Analysis on microseismic characteristics and stability of the access tunnel in the main powerhouse, Shuangjiangkou hydropower station, under high in situ stress. Bull. Eng. Geol. Environ. 79, 3231–3244. doi:10.1007/s10064-020-01738-6
Liang, Z., Xue, R., Xu, N., and Li, W. (2020b). Characterizing rockbursts and analysis on frequency-spectrum evolutionary law of rockburst precursor based on microseismic monitoring. Tunn. Undergr. Sp. Technol. 105, 103564. doi:10.1016/j.tust.2020.103564
Liu, D., Ling, K., Guo, C., He, P., He, M., Sun, J., et al. (2022). Experimental simulation study of rockburst characteristics of Sichuan–Tibet granite: a case study of the Zheduoshan tunnel. Eng. Geol. 305, 106701. doi:10.1016/j.enggeo.2022.106701
Liu, J. P., Si, Y. T., Zhang, C. Y., and Wang, R. (2020a). Estimation of fracturing mechanisms by the ratio of radiated energy between S and P waves of microseismic events during mining in metal mines. Appl. Geophys. 17, 465–474. doi:10.1007/s11770-020-0856-0
Liu, J. po, Wang, R., Lei, G., Sitao, Y.Xu, da, S., and Li, Y. hui (2020b). Studies of stress and displacement distribution and the evolution law during rock failure process based on acoustic emission and microseismic monitoring. Int. J. Rock Mech. Min. Sci. 132, 104384. doi:10.1016/j.ijrmms.2020.104384
Liu, Q. S., Wu, J., Zhang, X. P., Tang, L. X., Bi, C., Li, W. W., et al. (2020c). Microseismic monitoring to characterize structure-type rockbursts: a case study of a TBM-excavated tunnel. Rock Mech. Rock Eng. 53, 2995–3013. doi:10.1007/s00603-020-02111-5
Lu, F., Li, L., Chen, Z., Liu, M., Li, P., Gao, X., et al. (2023). Risk analysis and countermeasures of TBM tunnelling over the operational tunnel. Front. Earth Sci. 11. doi:10.3389/feart.2023.1103405
Ma, T. H., Tang, C. A., Tang, L. X., Zhang, W. D., and Wang, L. (2015). Rockburst characteristics and microseismic monitoring of deep-buried tunnels for Jinping II Hydropower Station. Tunn. Undergr. Sp. Technol. 49, 345–368. doi:10.1016/j.tust.2015.04.016
Ma, T. H., Tang, C. A., Tang, S. B., Kuang, L., Yu, Q., Kong, D. Q., et al. (2018). Rockburst mechanism and prediction based on microseismic monitoring. Int. J. Rock Mech. Min. Sci. 110, 177–188. doi:10.1016/j.ijrmms.2018.07.016
Mazaira, A., and Konicek, P. (2015). Intense rockburst impacts in deep underground construction and their prevention. Can. Geotech. J. 52, 1426–1439. doi:10.1139/cgj-2014-0359
Mendecki, A. J. (2023). Seismic ground motion alerts for mines. J. Seismol. 27, 599–608. doi:10.1007/s10950-023-10147-7
Stork, A. L., Verdon, J. P., and Kendall, J. M. (2014). The robustness of seismic moment and magnitudes estimated using spectral analysis. Geophys. Prospect. 62, 862–878. doi:10.1111/1365-2478.12134
Tang, Z., Liu, X., Xu, Q., Li, C., and Qin, P. (2018). Stability evaluation of deep-buried TBM construction tunnel based on microseismic monitoring technology. Tunn. Undergr. Sp. Technol. 81, 512–524. doi:10.1016/j.tust.2018.08.028
Voza, A., Valguarnera, L., Marrazzo, R., Ascari, G., and Boldini, D. (2023). A new in situ test for the assessment of the rock-burst alarm threshold during tunnelling. Rock Mech. Rock Eng. 56, 1645–1661. doi:10.1007/s00603-022-03152-8
Waldhauser, F., and Ellsworth, W. L. (2000). A double-difference earthquake location algorithm: method and application to the northern hayward fault, California. Bull. Seismol. Soc. Am. 90, 1353–1368. doi:10.1785/0120000006
Wang, C. lai (2014). Identification of early-warning key point for rockmass instability using acoustic emission/microseismic activity monitoring. Int. J. Rock Mech. Min. Sci. 71, 171–175. doi:10.1016/j.ijrmms.2014.06.009
Wu, M., Ye, Y., Wang, Q., and Hu, N. (2022). Development of rockburst research: a comprehensive review. Appl. Sci. 12, 974. doi:10.3390/app12030974
Xie, W. Q., Li, W. W., Liu, X. L., and Tang, S. H. (2022). In-situ methods for the TBM dismantling in a long-distance and deep-buried tunnel: case study of Xinjiang water conveyance tunnel. Tunn. Undergr. Sp. Technol. 129, 104683. doi:10.1016/j.tust.2022.104683
Xu, N. W., Li, T. B., Dai, F., Zhang, R., Tang, C. A., and Tang, L. X. (2016). Microseismic monitoring of strainburst activities in deep tunnels at the jinping II hydropower station, China. Rock Mech. Rock Eng. 49, 981–1000. doi:10.1007/s00603-015-0784-0
Xue, R., Liang, Z., and Xu, N. (2021). Rockburst prediction and analysis of activity characteristics within surrounding rock based on microseismic monitoring and numerical simulation. Int. J. Rock Mech. Min. Sci. 142, 104750. doi:10.1016/j.ijrmms.2021.104750
Xue, R., Liang, Z., Xu, N., and Dong, L. (2020). Rockburst prediction and stability analysis of the access tunnel in the main powerhouse of a hydropower station based on microseismic monitoring. Int. J. Rock Mech. Min. Sci. 126, 104174. doi:10.1016/j.ijrmms.2019.104174
Yang, Y., Du, L., Li, Q., Zhao, X., Zhang, W., and Liu, Z. (2023). Predicting the accuracy and applicability of micro-seismic monitoring of rock burst in TBM tunneling using the data from two case studies in China. Sustain 15, 4232. doi:10.3390/su15054232
Yuan-hui, L., Gang, L., Shi-da, X., and Da-wei, W. (2018). The spatial-temporal evolution law of microseismic activities in the failure process of deep rock masses. J. Appl. Geophys. 154, 1–10. doi:10.1016/j.jappgeo.2018.04.024
Zhao, J. S., Feng, X. T., Jiang, Q., and Zhou, Y. Y. (2018). Microseismicity monitoring and failure mechanism analysis of rock masses with weak interlayer zone in underground intersecting chambers: a case study from the Baihetan Hydropower Station, China. Eng. Geol. 245, 44–60. doi:10.1016/j.enggeo.2018.08.006
Keywords: rockburst prediction, microseismic monitoring, cloud service platform, rockburst risk level, prediction criteria
Citation: Zhao J, Huang D, Cai Y, Huang D, Zhou X, Wang F and Pan Y (2024) Rockburst prediction and early warning for a highway tunnel excavated by TBM based on microseismic monitoring. Front. Earth Sci. 12:1391509. doi: 10.3389/feart.2024.1391509
Received: 26 February 2024; Accepted: 29 April 2024;
Published: 30 May 2024.
Edited by:
Bin Gong, Brunel University London, United KingdomReviewed by:
Huajin Li, Chengdu University, ChinaZhanbo Cheng, Nanyang Technological University, Singapore
Copyright © 2024 Zhao, Huang, Cai, Huang, Zhou, Wang and Pan. This is an open-access article distributed under the terms of the Creative Commons Attribution License (CC BY). The use, distribution or reproduction in other forums is permitted, provided the original author(s) and the copyright owner(s) are credited and that the original publication in this journal is cited, in accordance with accepted academic practice. No use, distribution or reproduction is permitted which does not comply with these terms.
*Correspondence: Dan Huang, aHVhbmdkYW5AYmdyaW1tLmNvbQ==