 Alexander S. Kshetrimayum1
 Pradeep K. Goswami
 Chung-Pai Chang
 Lalit Mohan Joshi
- 1Department of Earth Sciences, National Central University, Taoyuan, Taiwan
- 2Centre of Advanced Study, Department of Geology, Kumaun University, Nainital, India
- 3Center for Space and Remote Sensing Research, National Central University, Taoyuan, Taiwan
- 4GPS Science and Application Research Center, National Central University, Taoyuan City, Taiwan
The active tectonic aspects of the Indo-Myanmar Range (IMR) have not yet been studied in detail in spite of the fact that it’s seismically active. In the present study qualitative and quantitative geomorphic analyses have been carried out to understand the active tectonic evolution of Nungba, and Barak-Makru thrust sheets (NBTS and BMTS) in the central part of IMR. The focus of the study is on understanding the active spatial growth pattern of adjacent thrust sheets in an evolving mountain range and providing baseline data for further detailed seismotectonic and seismic hazard vulnerability analyses. Drainage characteristics, disposition of landforms and statistical analyses of Normalized Steepness Index (ksn), Hypsometric Integral (HI) and Transverse Topography Symmetry Factor (T), computed for a total of 164 4th-order drainage basins, reveal that both of these adjoining thrust sheets are actively uplifting. Higher values of ksn (mode = 111) and HI (mode = 0.46) in NBTS suggest its faster uplift than the BMTS, which has comparatively lower values of ksn (mode = 56) and HI (mode = 0.43). Moreover, the northern parts of the both the thrust sheets are uplifting faster than their southern parts due to along-strike variations in the movement on their basal thrusts, as a result of which the NBTS has been south-southeastwardly down-tilting and the BMTS is south-southwestwardly down-tilting. The study reveals that both the adjacently lying NBTS and BMTS have almost the same spatial growth patterns that are mainly controlled by the movements on their basal thrusts.
1 Introduction
The Earth’s crust is a dynamic and ever-evolving entity, profoundly shaped by tectonic forces. One of the most remarkable expressions of these forces is formation of fold-thrust belts, which are regions undergoing significant deformation due to compressional stresses (Chapple, 1978; Chapman and DeCelles, 2015). The Indo-Myanmar Range (IMR) is an illustrative example of actively growing fold-thrust belts. It is a westward convex, arcuate, and overall NE–SW trending easternmost segment of the Himalayan orogen, which formed by the collision of Indian and Asian plates around 55–50 Ma (Najman et al., 2017; Bhattacharya et al.,2021). The continuously growing IMR originated around 50 Ma to the south of eastern Himalayan syntaxis due to the Indian Plate’s oblique subduction beneath the Myanmar microplate (Mitchell, 1993; Hall, 1997; Soibam, 2006; Maurin and Rangin, 2009; Soibam et al., 2015; Saikia et al., 2019) (Figure 1A). Ongoing tectonic processes have developed a series of distinct paraautochthonous fold-thrust belts within the IMR that are demarked by westward-younging and easterly dipping thrusts; these thrusts are named from east to west as Tengnoupal thrust (TT), Thoubal-Chandel thrust (TCT), Churachandpur-Mao thrust (CMT), Nungba thrust (NBT), Barak-Makru thrust (BMT), and Disang thrust (DT) (Soibam, 2006) (Figures 1B,C).
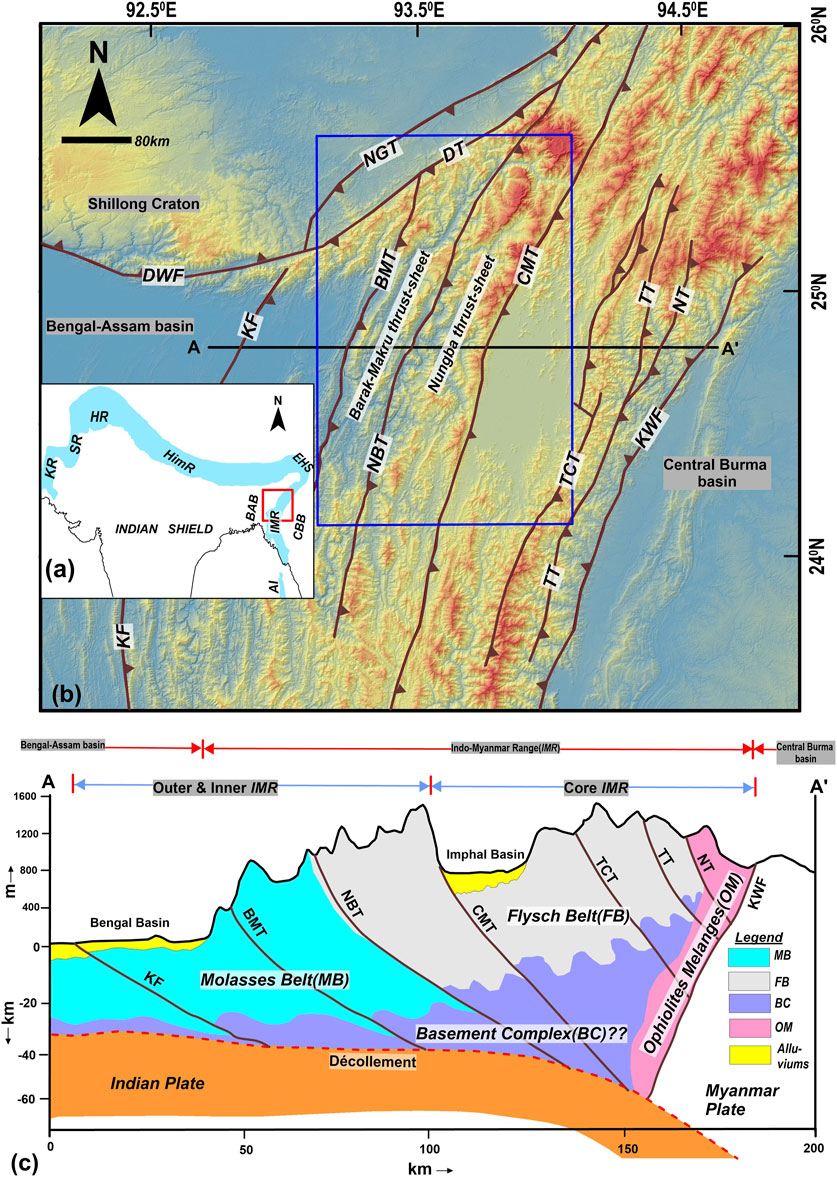
Figure 1. (A) Extent of the Himalayan orogen. HR = Hazara Range, HimR = Himalayan Ranges, KR = Kirthar Range, SR = Sulaiman Range, Eastern Himalayan Syntaxis (EHS), Indo-Myanmar Range (IMR), Central Burma Basin (CBB), Bengal-Assam Basin (BAB), AI = Andaman Island. (B) Diagram showing major thrusts/faults of the IMR (modified after Soibam, 2006; Acharyya, 2010). AA’ is line along which the profile in (C) is drawn. The Profile is compiled from Soibam, et al. (2015) and Rakshit, et al. (2018). BMT=Barak-Makru thrust, CMT=Churachandpur-Mao thrust, DT=Disang thrust; DWF=Dawki fault, KF=Kaladan fault, KWF=Kabaw fault, NT=Narum thrust, NBT=Nungba thrust; NGT=Naga thrust, TCT=Thoubal-Chandel thrust, TT=Tengnoupal thrust. Blue coloured rectangle marks location of the study area.
Recent seismotectonic investigations in the IMR suggest that a major proportion of the Indo-Myanmar plate convergence is accommodated/partitioned by these thrusts, mainly the CMT (Rao and Kalpna, 2005; Angelier and Baruah, 2009; Kundu and Gahalaut, 2012; Gahalaut et al., 2013; Steckler et al., 2016; Betka et al., 2018; Mallick et al., 2019; Mon et al., 2020; Panda et al., 2020; Earnest et al., 2021; Lindsey et al., 2023; Oryan et al., 2023), and the remnant slip component is compensated through varying aseismic creep at plate interface or plate interface locking (Kumar et al., 2011; Gahalaut et al., 2013; Steckler et al., 2016; Mallick et al., 2019; Panda et al., 2020; Oryan et al., 2023). These studies highlighted the variability of slip-motion and stress release mechanisms on these features, which have been the primary controls on growth patterns of the fold-thrust belts of IMR (cf. Soibam et al., 2015). These seismotectonic investigations, however, bring out only present day scenario of tectonic activities and thus the overall growth patterns of the individual fold-thrust belts of IMR through Quaternary times remains enigmatic and calls for geomorphic investigations to comprehend it (Cf. Wang et al., 2014; Maneerat and Bürgmann, 2022). For example, seismotectonic investigations reveal right-lateral, stike-slip movement on the CMT/fault but geomorphic investigations unequivocally suggest oblique-slip movement, with pronounced dip-slip component, on it through the Quaternary times (Gahalaut et al., 2013; Wang et al., 2014; Goswami and Kshetrimayum, 2020). Nonetheless, there are only a few geomorphic studies constraining the active tectonics and attendant deformation patterns across and along these thrusts and growth dynamics of the overriding thrust sheets (e.g., Wang et al., 2014; Goswami and Kshetrimayum, 2020; Luirei et al., 2021; Kshetrimayum and Goswami, 2023). An understanding of the complexities of tectonic aspects of and crustal deformation caused by these features could unveil critical information about spatio-temporal growth patterns and ongoing orogenic dynamics of the IMR in particular and fold-thrust belts of the world in general (cf. Elliott, 1976; Brock and Engelder, 1977; De Bremaecker, 1987; Shaw et al., 1999; Wobus et al., 2003; Pearson and DeCelles, 2005; Aydin et al., 2010; McQuarrie and Ehlers, 2017; Stockmeyer et al., 2017; Wu and Hu, 2019; Ito and Moore, 2021; Jolivet et al., 2022; Maneerat et al., 2022). It may also be pointed out that, as of now the active tectonic aspects of the seismically active IMR (particularly its western part in NE India) have been little studied in comparison to other active orogenic belts, e.g., the western Himalaya, Rockies, or Alps, and a dearth of information on these aspects makes difficult the geodesy-based tectonic block modelling of the region (Cf. Lindsey et al., 2023). Understandably, elaborate information on active tectonic aspects of the IMR need to be compiled for comprehending its orogenic dynamics, seismotectonics and seismic hazard vulnerability.
With this in mind, we investigated two hitherto unstudied, adjoining thrust sheets, namely, the Nungba thrust sheet (NBTS) and the Barak-Makru thrust sheet (BMTS) in the western part of the central IMR (Figure 1B). Main objectives of the investigations are to examine: 1) the rate and pattern of deformation of these thrust sheets; 2) whether these adjacent thrust sheets in the IMR are growing similarly or differently under the uniform stress regime of the region; and, 3) as to how these thrust sheets are evolving in response to the ongoing tectonic activities of the fold-thrust belt and surface processes. The study will provide insights into the tectonic intricacies and active crustal deformations, shedding light on the growth dynamics and deformation patterns across these thrust sheets. It will enhance our understanding of the complexities of active tectonics controlling the developmental patterns of these two adjoining thrust sheets and the active tectonic processes shaping this part of the IMR. The research issues being addressed to here emerge out of the facts that, 1) no detailed information on the active tectonic aspects of these thrust-sheets is available so far, 2) our previous study revealed varying deformation patterns for the other two adjacent thrust-sheets to the east of NBTS (Kshetrimayum and Goswami, 2023) and that interested us to examine if it’s also the case for all the thrust-sheets of the IMR, and 3) the results of present study in association with the aforementioned previous study would bring out a clearer picture of the pattern of active thrust-sheet growth in this part of the IMR, which could be used to better understand similarities/dissimilarities in evolutionary patterns and processes of active orogens across the world. Additionally, the study will underscore the significance of integrating laboratory- and field-based investigations in comprehending the growth and deformation pattern of the thrust sheets in actively growing orogens. We anticipate that our approach will be applicable to other active fold-thrust belts around the world.
2 Regional tectonic setting of Indo-Myanmar fold-thrust belt
Extending southwards from the Eastern Himalayan Syntaxis (EHS) in the north and join the Andaman-Sumatra arc in the south, the Indo-Myanmar fold-thrust belt lies between the Central Burma Basin (CBB) to the east and Bengal-Assam Basin (BAB) to the west (Figure 1A). Bounded by the Naga thrust (NGT) and Kaladan fault (KF) to the west, and Kabaw fault (KWT) to the east, the belt features thick sequences of Cenozoic Flysch and Molasses sediments, with some patches of ophiolitic mélange in the eastern part (Soibam et al., 2015). Divided into outer, inner, and core sections by three major faults/thrusts (KF, CMT, and KWF) (Maurin and Rangin, 2009; Mallick et al., 2019) (Figure 1C), the belt has evolved as an arcuate accretionary prism due to oblique underthrusting of the Indian plate beneath the Myanmar microplate, where the subducting slab (Indian plate) is deformed by combination of along the arc compression and across the arc extension as a result of brittle faulting, slab full forces and buckling at depth (Kumar et al., 2015); this process has been believed to contribute to its continuous growth since the Oligocene time (Mitchell, 1993; Maurin and Rangin, 2009), but with change in rate and angle of subduction since the early Miocene (Gordon et al., 1998; Maurin and Rangin, 2009).
The ongoing orogenic processes have led to the development of a stack of imbricate thrusts/faults within the IMR that register east-west shortening and north-south strike-slip movement (Steckler et al., 2016); these westerly younging thrusts/faults are easterly dipping (Kundu and Gahalaut, 2012; Gahalaut et al., 2013; Soibam et al., 2015). As also with other parts of the IMR, the NBTS and BMTS in the study area are made up of alternating sandstone-siltstone-shale units, and folded into antiforms and synforms and traversed by a number of faults that trend parallel/sub-parallel or transverse to the CMT, NBT, and BMT (Figure 2). In the west the BMTS is thrust over the Kaladan thrust sheet along the BMT and in the east the Churachandpur-Mao thrust sheet rests over the NBTS along the CMT. However, spatial growth patterns of the associated thrust sheets since Quaternary times are not yet known.
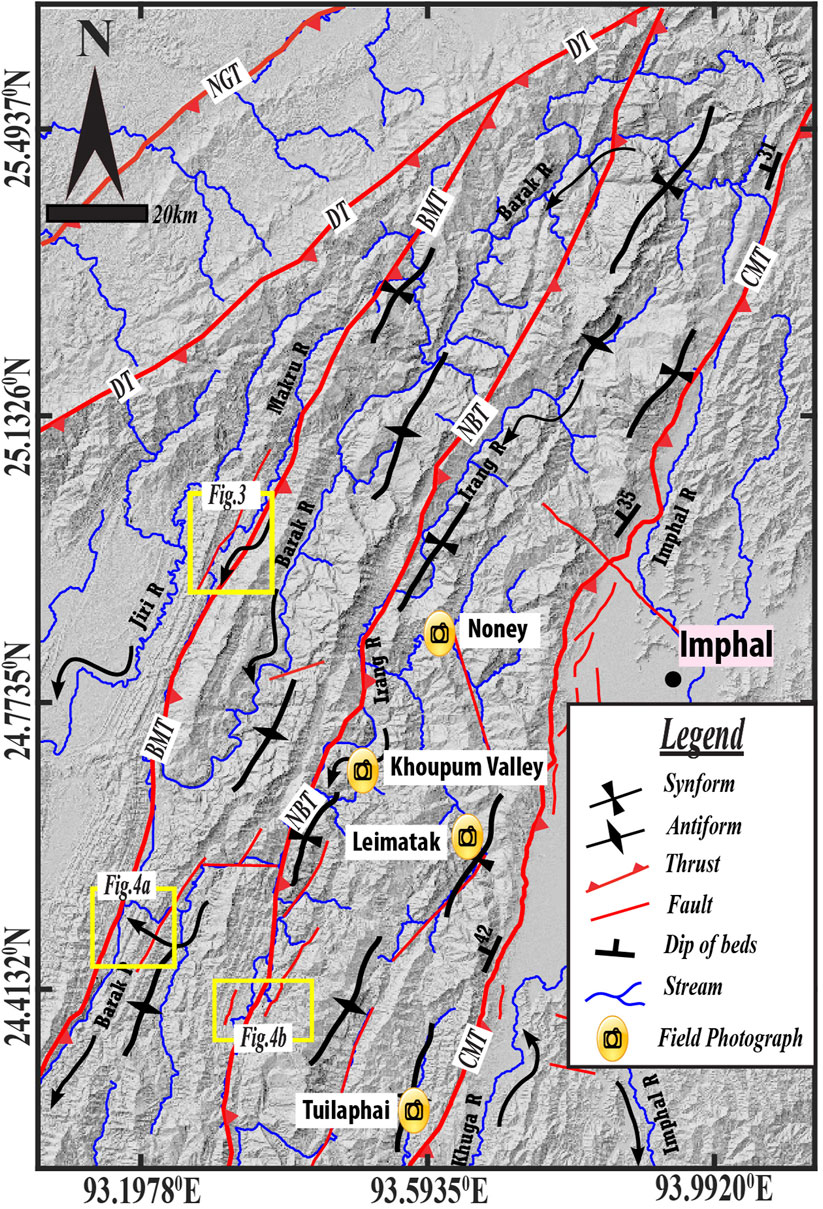
Figure 2. Major structures of the study area are based on the present investigation and Soibam (2006). BMT=Barak-Makru thrust, CMT=Churachandpur-Mao thrust, DT=Disang thrust; NBT=Nungba thrust; NGT=Naga thrust. Blue coloured rectangle marks location of the study area. Yellow-colored rectangles indicate the locations of the corresponding figures.
3 Methodology
The present study is based on qualitative and quantitative geomorphic investigations. The analyses include identification and mapping of active tectonic features based on their geomorphic expressions on remote sensing data, Digital Terrain Models (DTMs) and in field, and computation of geomorphic indices in a Geographical Information System (GIS) to assess the severity/magnitude of tectonic activities and attendant crustal deformation. However, fieldwork is possible only in certain parts of the study area due to limited road network and dense forest cover. The basic data were generated from Survey of India toposheets on 1:50,000 scale, 30 m resolution SRTM Digital Elevation Models (DEMs), and satellite images using ArcGIS and MatLab (through TopoToolbox (https://github.com/wschwanghart/topotoolbox) (Schwanghart and Scherler, 2014)) software.
The geomorphic indices computed in the study include Normalized Steepness Index (ksn), Hypsometric Integral (HI) and Transverse Topography Symmetry Factor (T). Following Goswami and Kshetrimayum (2020) and Kshetrimayum and Goswami (2023), a total of 164 4th order drainage basins developed across the thrust sheets were selected for computing the geomorphic indices. The selected drainage basins essentially have dentritic to sub-dentritic drainage pattern with their trunk stream flowing parallel/sub-parallel to the stratal dips in the area.
The Steepness Index (ks) quantifies the relationship between channel gradient and drainage area, describing how quickly the stream gradient decreases with respect to drainage area. This relationship is represented as power-law function between channel slope (S) and drainage area (A) by the equation: S = ksA-ϴwhere ks in the channel steepness index, and ϴ is concavity Index (Hack, 1973; Flint, 1974). Under uniform lithology and climatic conditions, the steepness indices of multiple streams in a region are used to infer relative variations in tectonic uplift of the terrane (Kirby and Whipple, 2001; Kirby and Whipple, 2012).
The Normalized Steepness Index (ksn) follows the same slope-area relationship but is calculated with fixed reference concavity index (ϴref) (Tucker and Whipple, 2002; Wobus et al., 2006). In this study, we adapted ϴ = 0.45 as fixed reference concavity index to normalise the steepness index, considering 0.45 as the regional mean of concavity values (Nennewitz et al., 2018; Gailleton et al., 2021). Consequently, we calculated the index using the equation: S = ksnA-0.45, and the outcome values have been grouped into specific modal classes to represent and assess spatial variability in the degree of tectonic uplift across the thrust-sheets. In case of tectonic forcing, the higher values of ksn are associated with areas of faster tectonic uplift (Kirby and Whipple, 2001; Kirby and Whipple, 2012; Wobus et al., 2006).
The Hypsometric Integral (HI) measures the proportion of low and high areas within a drainage basin that quantifies the relative distribution of elevation in a specific area of that drainage basin (Strahler, 1952; Keller and Pinter, 2002). The HI can be calculated by the equation:
The Transverse Topography Symmetry Factor (T) defines the topological relationships between the trunk stream and drainage divide, providing information about magnitude and direction of lateral migration of the trunk stream of a drainage basin. It is a vector quantity measuring magnitude and direction of lateral shifting of a drainage basin’s trunk stream from its centreline (Cox, 1994). It is mathematically expressed as:
Computation of geomorphic indices for the drainage basins of same developmental stage (4th-order drainage basins in the present study) makes collation and spatial analyses of the data more tenable (Goswami and Kshetrimayum, 2020; Kshetrimayum and Goswami, 2023). Nevertheless, we performed bivariate regression analyses between the computed geomorphic indices and drainage basin areas to see if latter have any influence on the former (cf. Goswami and Kshetrimayum, 2020; Kshetrimayum and Goswami, 2023; Tiwari et al., 2021).
4 Results
4.1 Geomorphic signatures
Major active structures of the outlined area as delineated on the basis of their geomorphic signatures and previously published studies are shown in Figure 2.
4.1.1 Drainage characteristics
The outlined area has ridge-and-valley topography, with ridges having an overall linear orientation and most of their slope-facets being planar in morphology. The higher-order streams like Jiri, Makru, Barak and Irang rivers flow nearly parallel to each other as well as to the trends of major thrusts, like BMT, NBT, CMT, and folds, showing a general structural control on their courses (Figure 2). These rivers at several places exhibit such features as incised meanders, sharp deflections, remarkably straight course, warped course, and defeated streams, attesting to the controls of regional structures. To describe a few, drainage and contour maps of the area reveal that the Duinamkham Nala (stream), Duiphai Thok stream and an unnamed stream to the southwest of Duiphai Thok stream constituting tributaries of the Makru River in the western part of the study area show gridiron drainage pattern with their tributary stream deflected along the BMT (Figure 3); there are numerous wind gaps developed on a shutter ridge to opposite side of the tributaries of the Duinamkham Nala, which joins the parallel flowing Makru River in the west through a water gap (Figure 3). Further downstream, the streams that are draining a ridge to the west of Makru River are also deflected to varying distances before joining the Makru River, which flows through other faults that most likely are footwall splays of the BMT (Figure 3). Similarly, the Irang River flows towards SSW largely along the NBT to the downstream of Nungba but takes knee-bend turns to the southwest of Khoupum valley along a couple of faults and then joins the Barak River in the south-western part of the study area (Figure 2). The area adjoining the confluence of Irang and Barak rivers exhibits trellis type drainage pattern with all the first and second order streams having remarkably straight courses that suggest profound structural control and nascent stage of the hill-slopes (Figure 4A). Moreover, notable drainage anomalies such as entrenched meanders and stream deflections are observed in the south-central part of the study area (Figure 4B). In this area, entrenched meanders have developed along the Tuipi Lui and Songtal Lui streams, and the former shows knee-bend deflection from west-northwesterly flow direction to north-northeasterly flow direction and avoids its confluence with the latter due to control of a fault in the hanging wall of the NBT (Figure 4B). Furthermore, the tributaries of Milong Lui stream in the footwall of NBT either show marked deflection or gridiron drainage pattern due to the control of a fault (Figure 4B).
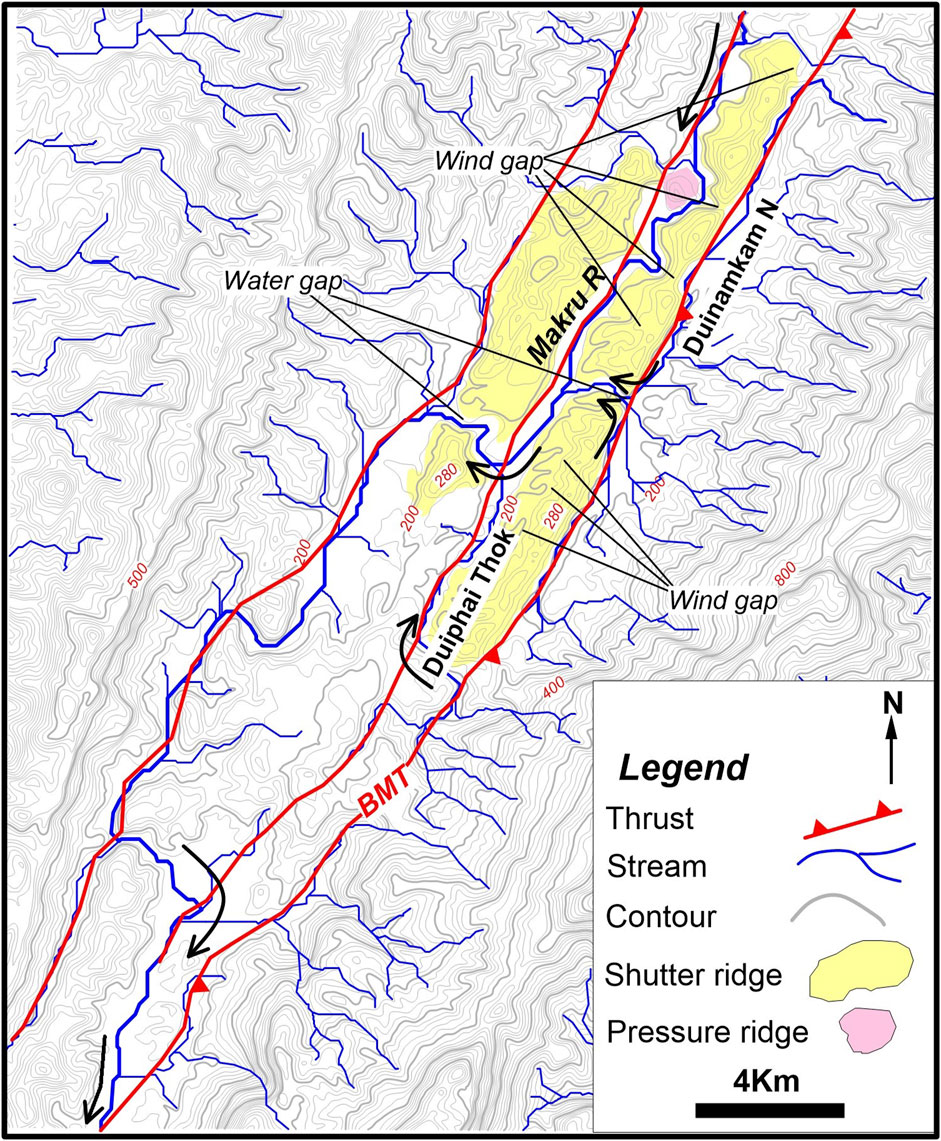
Figure 3. Map depicting active structural controls of Barak-Makru thrust (BMT) zone on Makru River and its tributaries. Note the stream deflections, and development of gridiron drainage pattern and wind-gaps on the shutter ridge. Note that contour interval is 20 m.
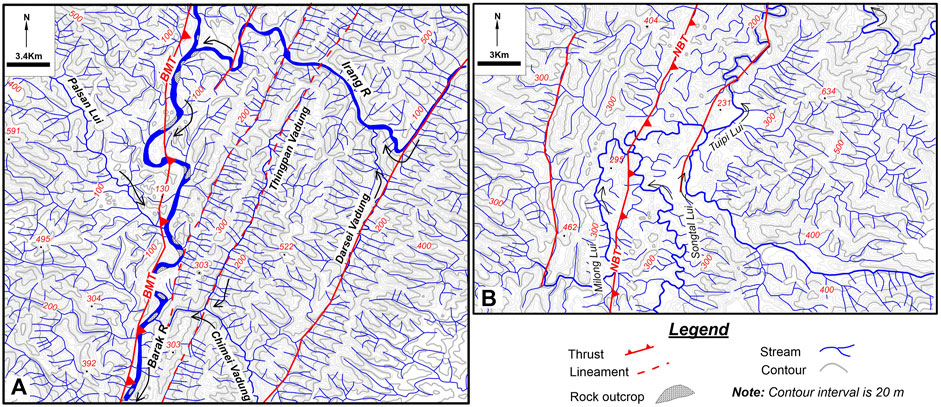
Figure 4. (A) Map showing entrenched meandering of Barak River, knee-bend deflection of Irang River, remarkable straight courses of tributary stream and development of trellis pattern in the Barak-Makru thrust (BMT) zone. (B) Map showing entrench meanders of Songtal Lui and Miong Lui streams and sharp deflections along stream courses in the Nungba thrust (NBT) zone.
4.1.2 River terraces
Apart from the drainage anomalies, paired and unpaired terraces have developed along many river valleys and gravels uplifted far above the present river channel. However, the elevations of terraces from the present day river bed are not consistent throughout any given valley. For instance, near Noney town in the central part of the study area, different levels of both paired and unpaired depositional river terraces have developed along various segments of the Ijai River (Figures 5A–C). In the upstream of Ijai River near Noney, one level of wide paired river terraces has developed at an elevation of approximately 3 m from the river bed (Figure 5A), but a few kilometers downstream, nearer to Noney town, two levels of terraces have developed along the river’s right bank and one level of terrace has developed along its left bank. The elevation differences between the river bed (T0) and first level terrace (T1), and T1 and second level terrace (T2) along the right bank are approximately 3 and 2.5 m, respectively (Figure 5B). On the left bank, however, the elevation difference between T0 and T1 is around 3 m.
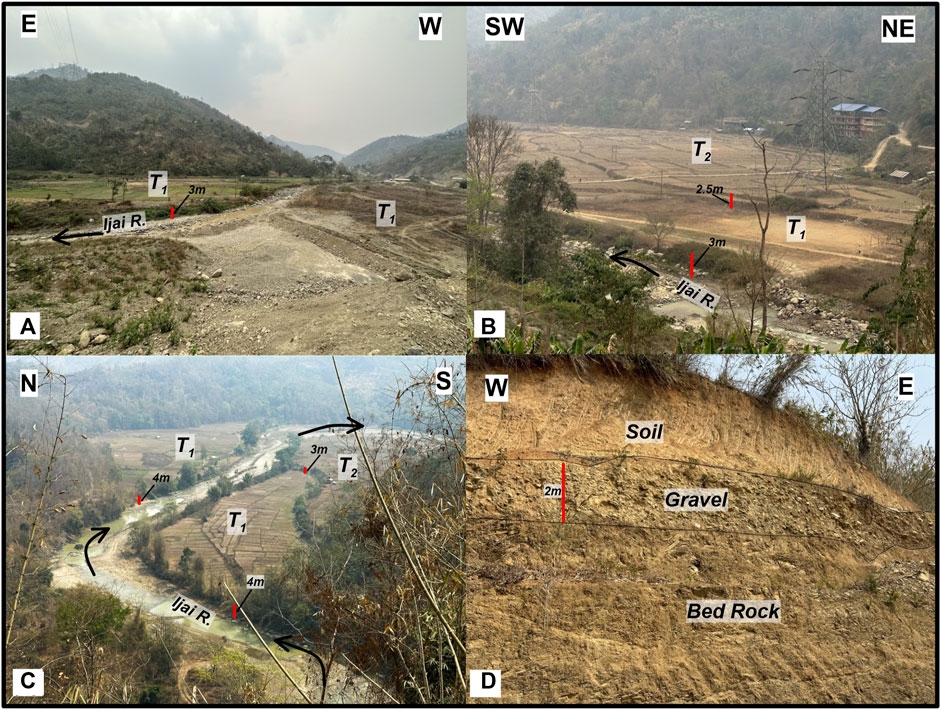
Figure 5. Photographs showing geomorphic evidences of active tectonic in and around Noney town. (A) one level of paired terraces of Ijai River, (B) two levels terraces developed along the right bank of Ijai River, (C) two levels of terraces developed along right bank and one level of terraces along the left bank of Ijai River and sharp deflection of Ijai River channel (D) about 2 m thick fluvial gravel unit resting on deformed siltstone-shale alternations exposed ∼100 m above the Ijai River bed along the Imphal-Jhiribam road.
Downstream past Noney, the elevation differences between the Ijai River’s terraces increase significantly; along the right bank, the elevation differences between T0-T1 along both the banks are about 4 m, and elevation difference between T1-T2 along the right bank is 3 m (Figure 5C). In this section, the river displays pronounced deflections in its channel (Figure 5C). Little downstream of this location, approximately 2 m thick fluvial gravel unit resting on intensely deformed siltstone-shale alteration is exposed along the Imphal-Jiribam road at an elevation of ∼100 m from the Ijai river bed (Figure 5D).
To the farther south of Noney about 5 km long and 4 km wide Khoupum valley is developed, which is drained by two streams, each approximately 10 m wide, which have incised into the valley fill to depths of about 3 m (Figures 6A,B). Farther southeast of Khoupum valley, at Leimatak, one level of terrace has developed along the right bank and two levels of terraces have developed along the left of Leimatak River (Figures 7A,B); the elevation difference between T0 and T1 along both the banks is ∼1.5 m, and T1 and T2 along the left bank is ∼2 m.
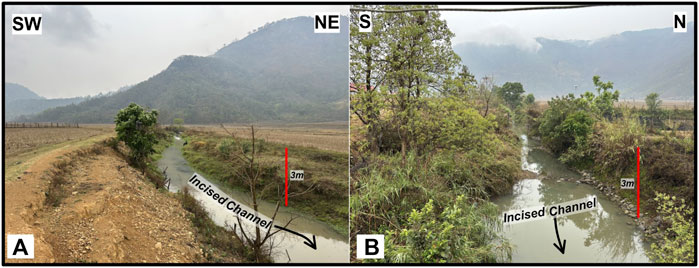
Figure 6. (A, B) photographs showing two different incised streams in Khoupum valley.
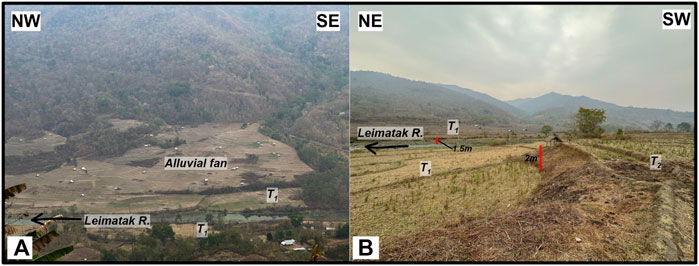
Figure 7. (A) Photograph showing fluvial terraces along both the banks Leimatak River; an alluvial fan is resting on the right bank terrace. (B) Two levels of terrace along the left bank and one level of terraces along the right bank of Leimatak River.
Similarly, near Tuilaphai bridge in the southern part of the study area one level of paired terraces has developed along the Tuila River valley having ∼2 m elevation differences between T0-T1, with the left bank terrace being wider than the right bank terrace (Figure 8A). But, a few hundred meters downstream, two levels of terraces have developed along the left bank and one level of terrace has developed along the right bank of the river; the elevation differences between T0-T1 along both the banks are ∼2 m, and the elevation difference between T1and T2 along the left bank is 2 m. However, the left bank terraces are wider than the right bank terrace (Figure 8B).
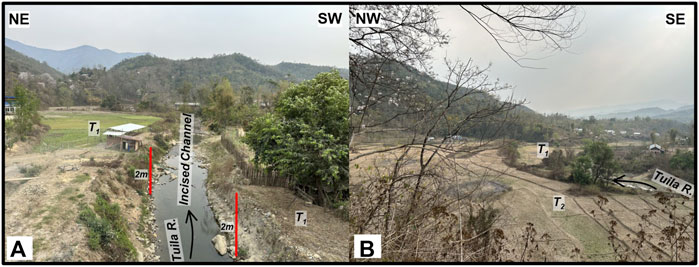
Figure 8. Photographs (A, B) showing development of different levels of terraces along the Tuilaphai River at different river segments.
4.2 Geomorphic indices
As already mentioned Normalized Steepness Index (ksn), Hypsometric Integral (HI) and Transverse Topography Symmetry Index (T) have been computed for a total of 164 4th order drainage basins of the area that essentially have dentritic to sub-dentritic drainage pattern. Out of 164 drainage basins, 77 are developed in the NBTS and 87 are developed in BMTS, respectively (Figures 9–11, and Tables 1, 2).
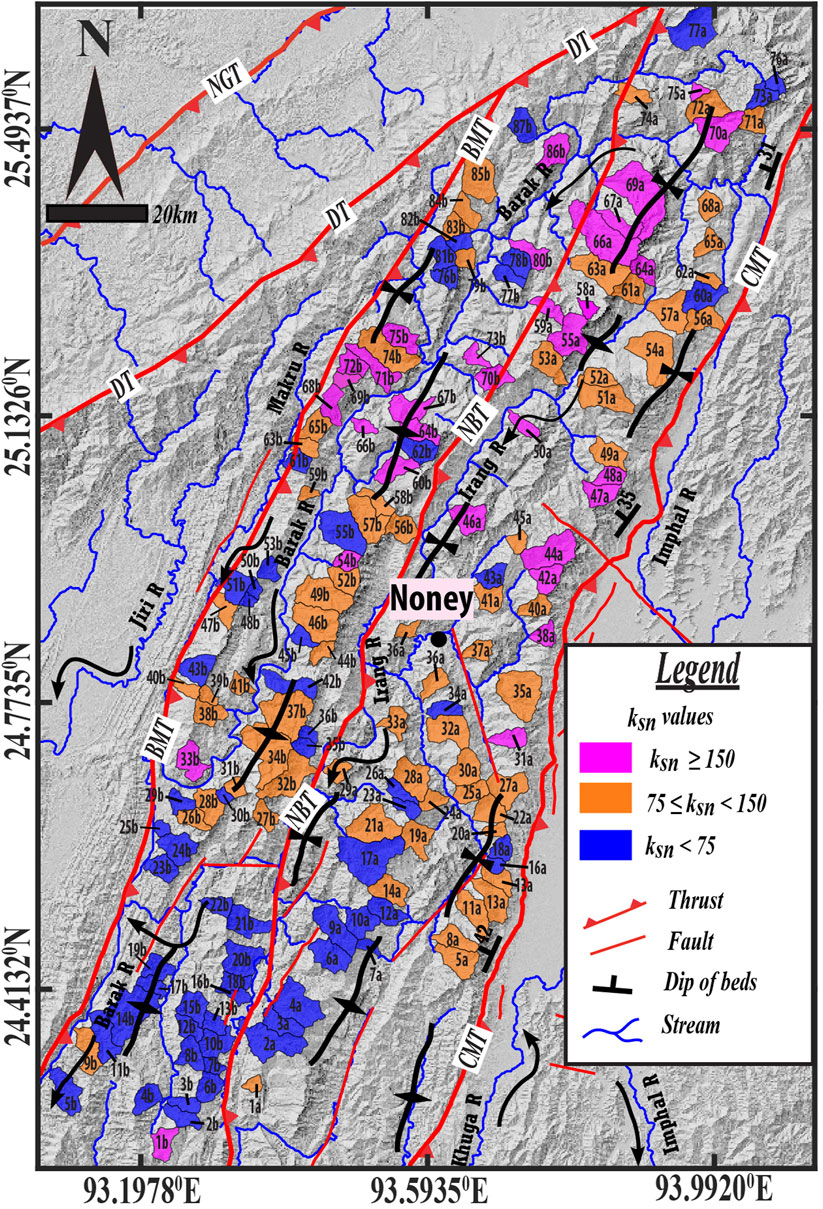
Figure 9. Map showing the spatial distribution of Normalise Steepness Index (ksn) values for the selected 4th-order drainage basins of the study area.
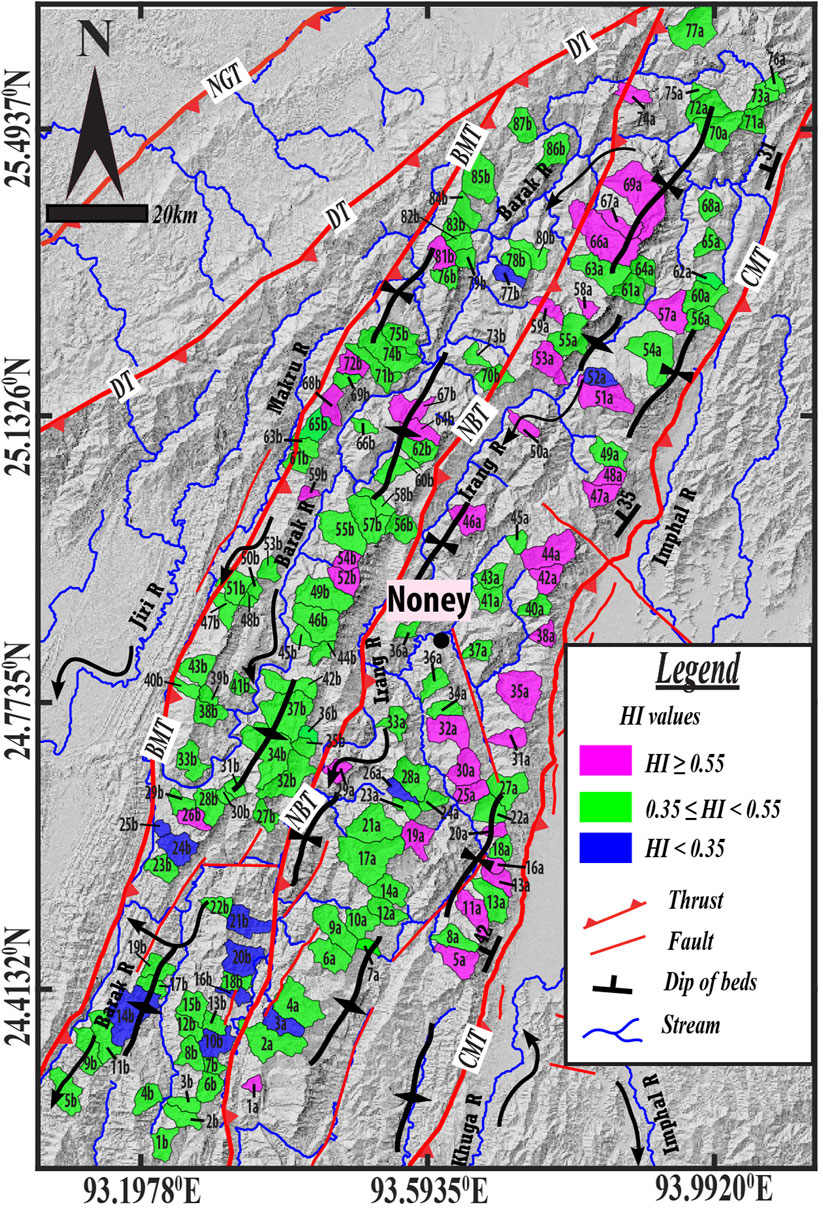
Figure 10. Map displaying the spatial distribution of Hypsometric Integral (HI) values for the selected 4th-order drainage basins of the study area.
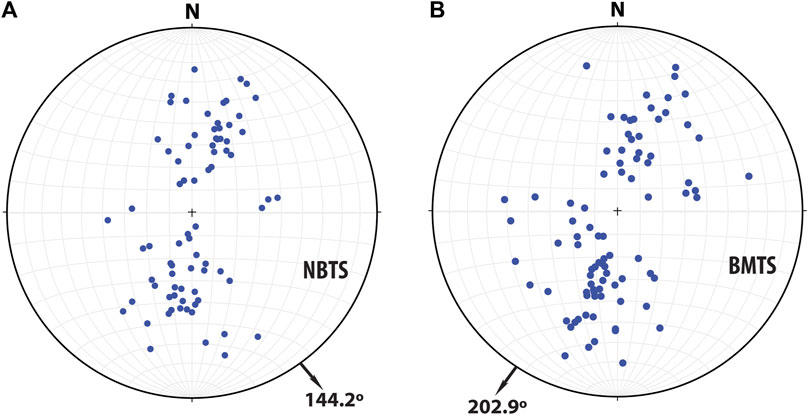
Figure 11. Stereonet plots display the magnitudes and azimuths of Transverse Topography Symmetry Factor (T) of selected 4th-order drainage basins of the study area: (A) for the Nungba thrust sheet (NBTS), and (B) for the Barak-Makru thrust sheet (BMTS). Arrows indicate the vector mean azimuths of T.
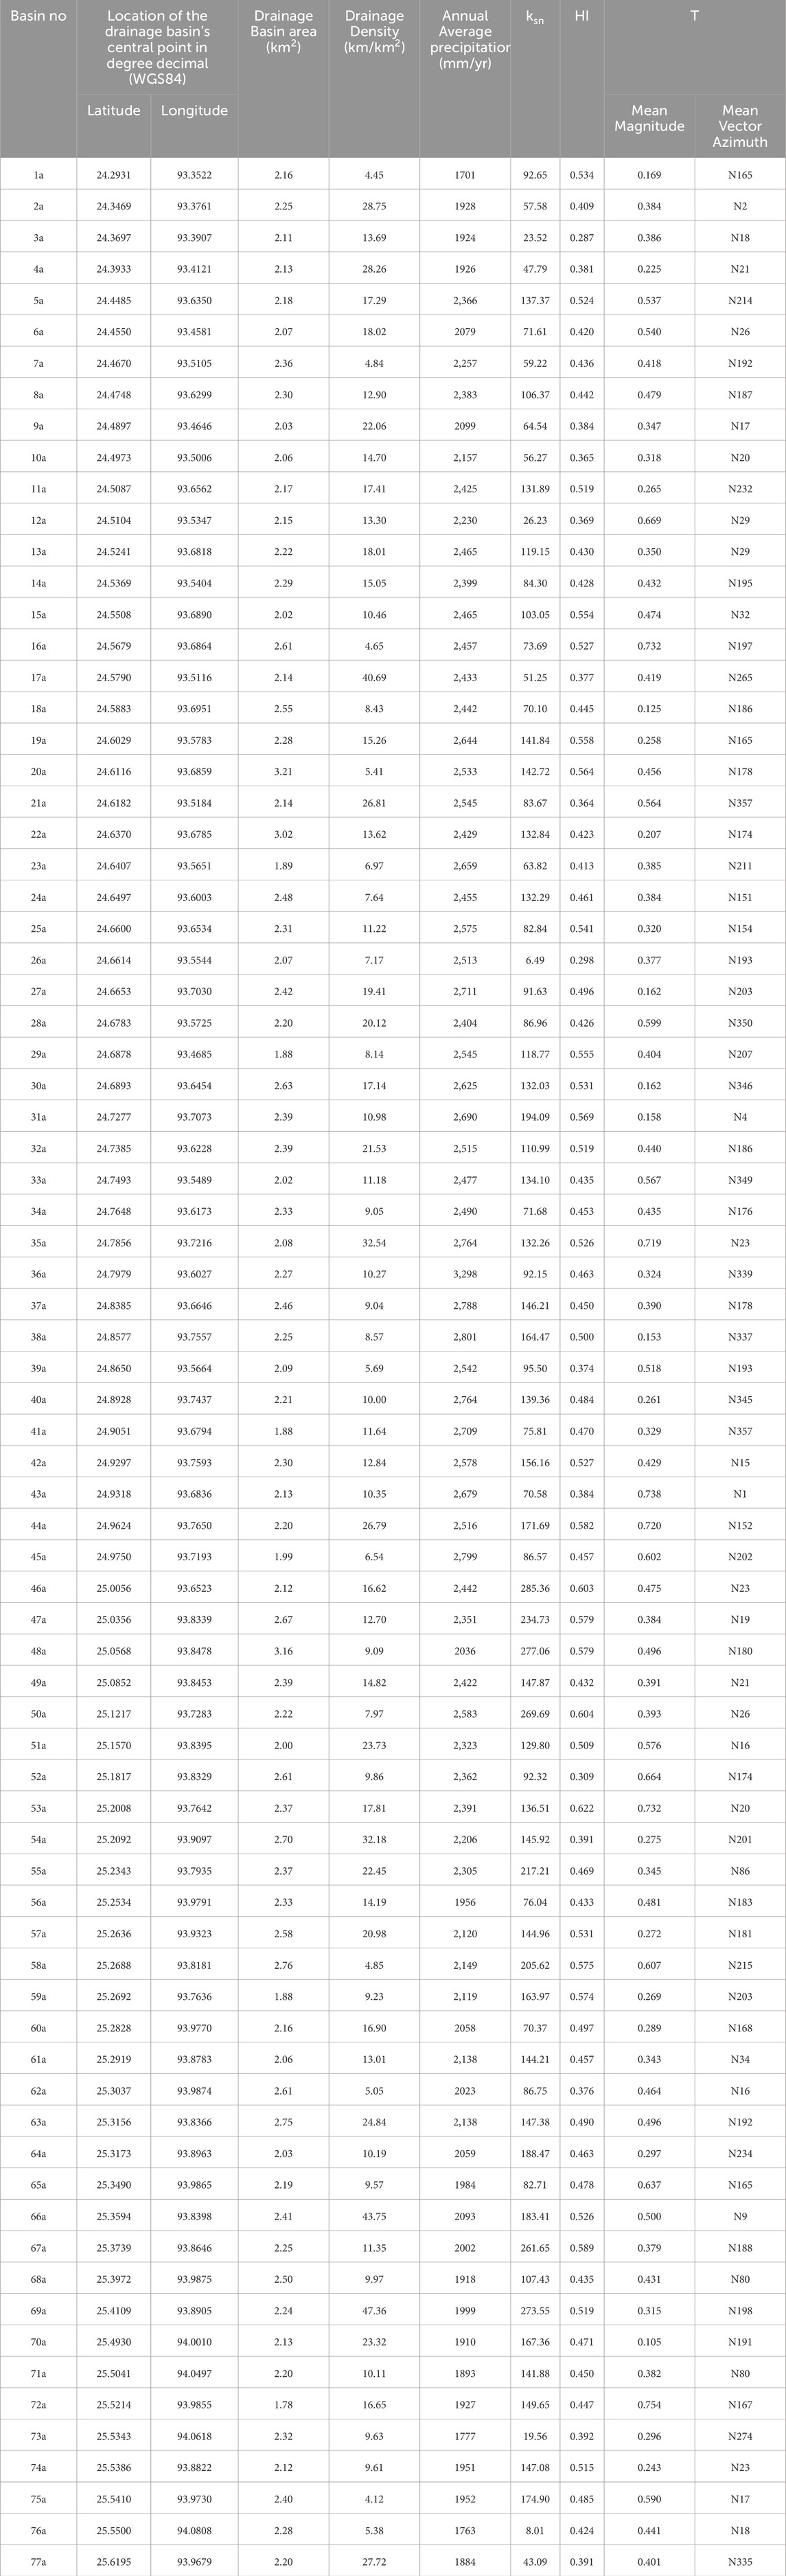
Table 1. Location of the drainage basin’s central point in degree decimal, Drainage Basin Area, Drainage Density, Annual Average Precipitation (Source: https://worldclim.org), Normalized Steepness Index (ksn), Hypsometric Integral (HI), and Transverse Topography Symmetry Index (T) of 4th -order drainage basins of the NBTS.
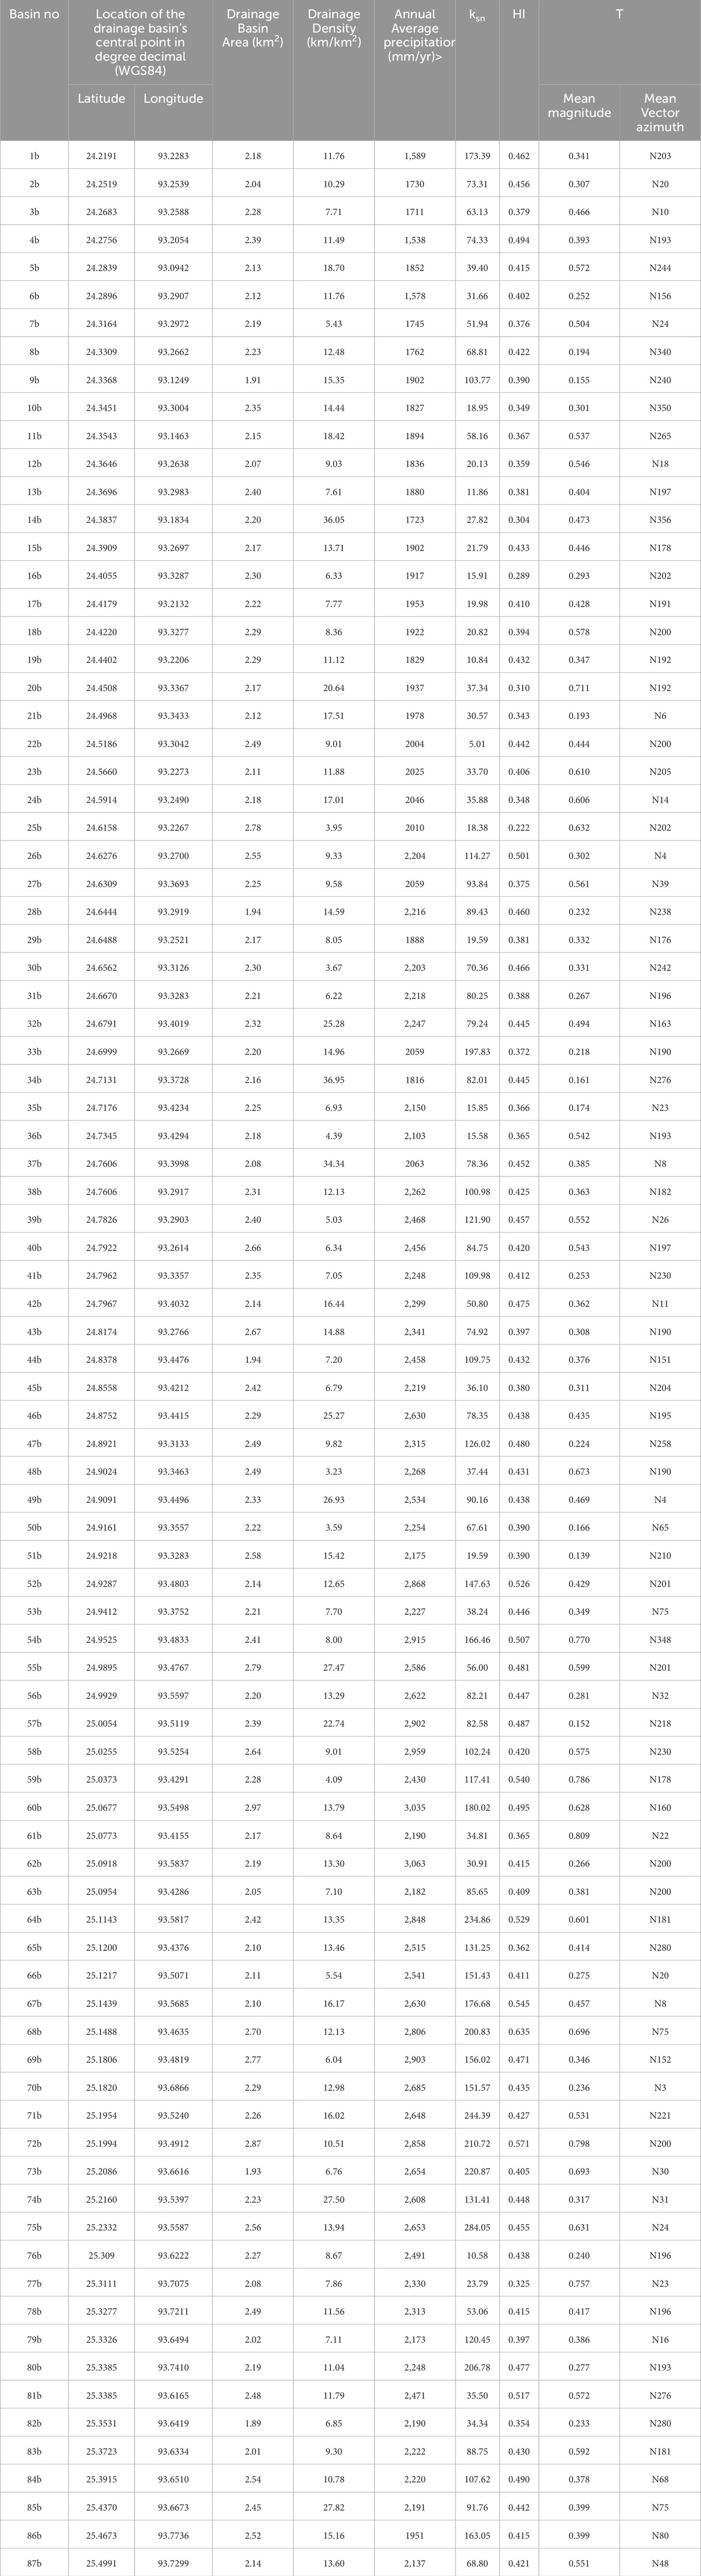
Table 2. Location of the drainage basin’s central point in degree decimal, Drainage Basin Area, Drainage Density, Annual Average Precipitation (Source: https://worldclim.org), Normalized Steepness Index (ksn), Hypsometric Integral (HI), and Transverse Topography Symmetry Index (T) of 4th -order drainage basins of the BMTS.
The ksn values of drainage basins across all the thrust sheets vary from 5.01 to 285.365, which are categorized into three distinct modal classes: ksn < 75, 75≤ ksn <150, and ksn ≥150, respectively; wider class width of ksn ≥150 is chosen because only 5% of the basins have ksn values >225. The spatial distribution of these ksn modal classes exhibits significant variance across the thrust sheets, with the highest ksn values predominantly occurring in the northern and central parts of the study area (Figure 9). Interestingly, the spatial distribution of ksn values across the thrust sheets shows that higher values are primarily found in the NBTS, where 53% of the total drainage basins have ksn values in the modal class 75≤ ksn <150, with a mode of 111. Conversely, 50% of the total basins in the BMTS have ksn values in the modal class ksn < 75, with a mode of 56. Furthermore, ksn values across the individual thrust sheet also show marked variations from north to south. In the northern part of the study area, to the north of Noney, 48% of the basins of NBTS have values in the modal class 75 ≤ ksn <150, with a mode of 114, whereas 60% of the basins in the southern part of this thrust sheet, to the south of Noney, have values in the modal class 75≤ ksn <150, with a mode of 96. Similarly, 37% of the drainage basins of BMTS in the northern part of the study area, to the north of Noney, have values in the modal class 75≤ ksn <150, with a mode of 113, whereas 67% of the basins in the southern part of this thrust sheet, to the south of Noney, have values in the modal class ksn <75, with a mode of 47.
The HI values exhibit spatial distribution pattern akin to ksn, with the northern part of the study area displaying higher HI values. Ranging from 0.222 to 0.635, the HI values are also grouped into three modal classes: HI <0.35, 0.35 ≤HI <0.50, and HI ≥0.50, respectively (Figure 10). The spatial distribution of these HI reveals that more than 58% of the total basins of NBTS have HI values in the class 0.35≤ HI <0.50, with a mode of 0.46%, and 81% of the drainage basins of BMTS have values in the class 0.35≤ HI <0.50, with a mode of 0.43. Like ksn values, the HI values across the individual thrust sheet also show variations from north to south, with slightly higher values occurring in their northern parts. In the northern part of the study area, to the north of Noney, 58% of the basins of NBTS have values in the class 0.35≤ HI <0.50, with a mode 0.47, whereas 60% of the basins in the southern part of this thrust sheet, to the south of Noney, have values in the class 0.35≤ HI <0.50, with a mode 0.44. Similarly, 80% of the drainage basins of BMTS in the northern part of the study area, to the north of Noney, have values in the class 0.35≤ HI <0.50, with a mode 0.43, whereas 81% of the basins in the southern part of this thrust sheet, to the south of Noney, have values in the class 0.35≤ HI <0.50, with a mode 0.41.
The Ts of the basins indicate that the trunk stream in each of the selected drainage basins has laterally shifted with respect to the basin’s centerline; magnitudes of T range from a minimum of 0.07 to a maximum of 0.808. Moreover, the Ts of the drainage basins of NBTS have an average magnitude of 0.42 and vector mean azimuth of N144.2°, with a vector magnitude (r value) of 0.149 and a p-value of 0.181, whereas the Ts of the drainage basins of BMTS have an average magnitude of 0.43 and, the vector mean azimuth is N202.9°, with an r value of 0.16 and a p-value of 0.075 (Figure 11). The data suggest south-southeastward and south-southwestward preferential lateral shifting of drainage basins’ trunk streams in NBTS and BMTS, respectively. As already mentioned above, all these streams are essentially flowing parallel/sub-parallel to the stratal dip in the region and thus any possible control of stratal dip on preferential lateral stream migration is ruled out.
As mentioned earlier, bivariate regression analyses have been performed between the computed geomorphic indices (i.e., ksn, HI, T) and drainage basin areas to examine if the latter have any influence on the values of former. These analyses yield low values of correlation coefficients (r) and coefficients of determination (R2), being r = 0.115 and R2= 0.0132 for ksn, r = 0.003 and R2= 0.0033 for HI, and r = −0.049 and R2 = 0.0025 for T magnitude (Figure 12). These values suggest that the values of computed geomorphic indices have not been influenced by the drainage basins’ sizes.
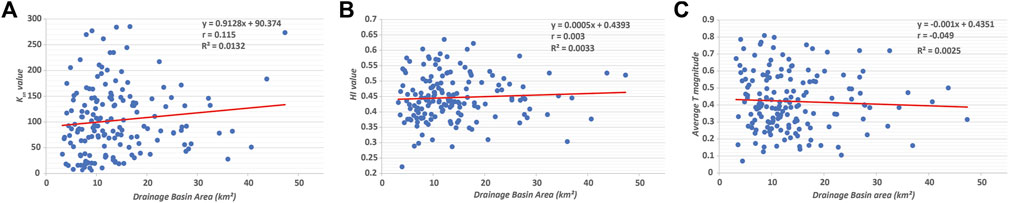
Figure 12. Regression analyses graphs between (A) drainage basins’ areas and ksn values, (B) drainage basins’ areas and HIs, and (C) drainage basins’ areas and mean T magnitudes.
Since erodibilities of rocks is an important control on the development of drainages and thus drainage basins in any area, the strengths of rocks to erosion must be duly considered while deciphering the active tectonic influence on crustal deformation or landscape evolution by using the proxies of geomorphic indices (Topal, 2019). The hills of both the NBTS and BMTS are composed of clastic sedimentary rocks comprising light grey to brownish grey sandstone units alternating with similar colored or dark grey to black, laminated shales and siltstones. Given that the entire mountainous part of the study area is only composed of shale, siltstone and sandstone alternations, it has uniform, moderate strength to erosion (Selby, 1980; Topal, 2019). Admittedly, any control of rock erodibilities on variations in values of computed geomorphic indices can be ruled out (cf. Topal, 2019). Nevertheless, regression analyses have been performed between the computed geomorphic indices and drainage densities to reaffirm that the values of geomorphic indices have not been influenced by the erodibilities of the channels substrates (Goswami and Pant, 2019; Goswami and Kshetrimayum, 2020; Tiwari et al., 2021; Kshetrimayum and Goswami, 2023); drainage densities are taken as the indicators of their erodibilities for the reason that all the basins have developed under the same geological, land cover, and climatic conditions (Horton, 1945; Goswami, 2018). The regression analyses yield low values of correlation coefficients (r) and coefficients of determination (R2), being r = 0.2 and R2= 0.0433 for ksn, r = 0.216 and R2= 0.0467 for HI, and r = 0.083 and R2 = 0.007 for T magnitude (Figure 13). These values suggest that the variations in the values of computed geomorphic indices of the drainage basins have not been affected by channel substrate’s erodibilities therein.
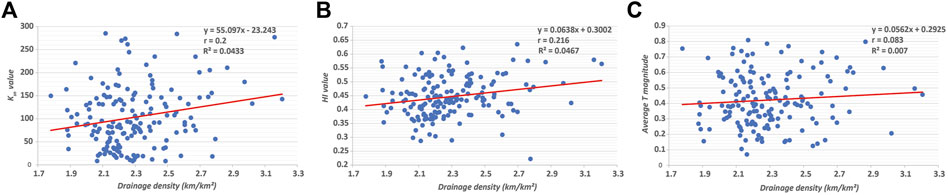
Figure 13. Graphs of regression analyses between (A) drainage densities of drainage basins and ksn values, (B) drainage densities of drainage basins and HI, and (C) drainage densities of drainage basins and mean T magnitude.
Climatic variabilities in terms of variations in the precipitation may also influence the landscape development and thus cause variations in its morphometric parameters (e.g., Kirby and Whipple, 2012; Maneerat and Bürgmann, 2022). The entire study area experiences exactly the same sub-tropical, humid monsoon climate (Mehrotra et al., 2014). Published data reveals that the climatic conditions of the entire study area have remained nearly the same for the past 1,650 years but with lesser humid conditions since past 600 years (Nautiyal and Chauhan, 2009). Therefore, the possibility of spatial climatic variability on landscape development and thus spatial distribution of geomorphic indices in the outlined area can be ruled out. Nevertheless, following Maneerat and Bürgmann (2022) we performed regression analyses between average annual precipitation and computed geomorphic indices using data from WorldClim bio-climatic database (https://worldclim.org) created by Fick and Hijmans (2017). The precipitation map shows that the higher precipitation in the study area is restricted to upper reaches of the ridges developed between latitudes 24.50ºN and 25.20ºN (Figure 14A). The regression analyses yield low values of correlation coefficients (r) and coefficients of determination (R2) between the annual precipitation and computed geomorphic indices, being r = 0.127 and R2= 0.0275 for ksn, r = 0.132 and R2= 0.0226 for HI, and r = 0.104 and R2 = 0.0197 for T magnitude (Figures 14B–D). These values suggest that the variations in the values of computed geomorphic indices have not been influenced by the spatial variations in the precipitation.
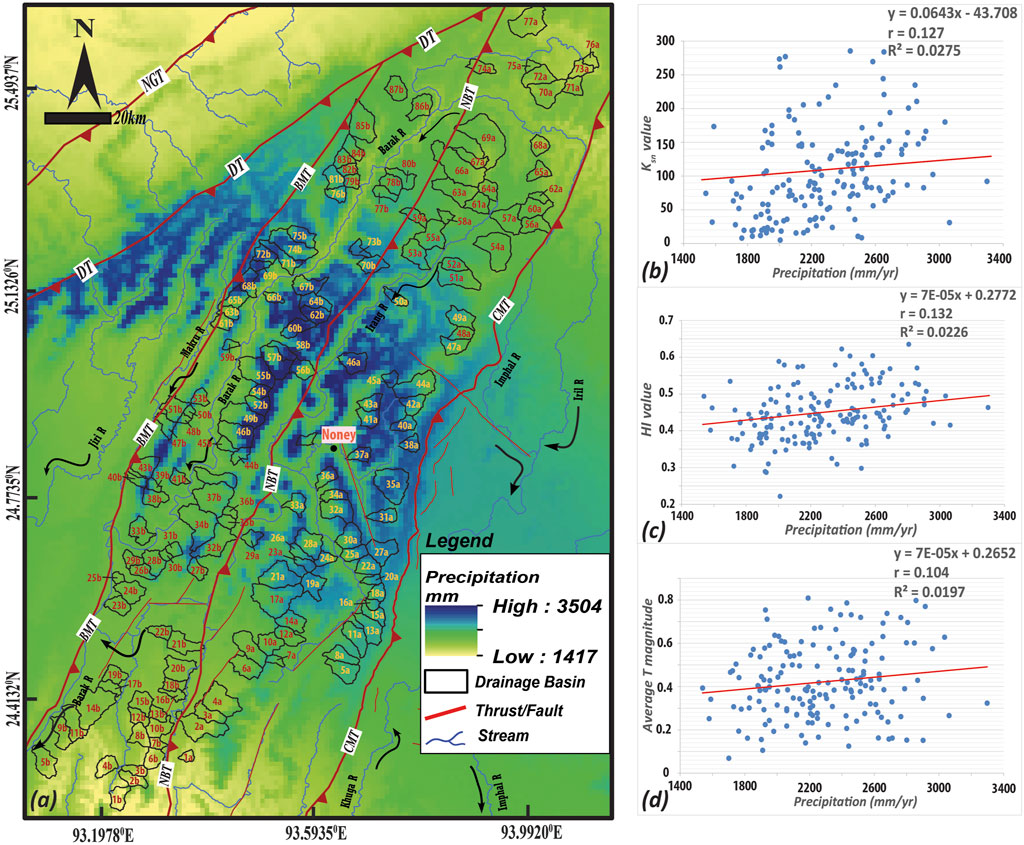
Figure 14. (A) Drainage basins and regional thrusts overlaid on map showing spatial distribution of annual precipitation in the study area. Precipitation map is from https://worldclim.org and thrusts are from Soibam (2006) and Acharyya (2010). BMT=Barak-Makru thrust, CMT=Churachandpur-Mao thrust, DT=Disang thrust; NBT=Nungba thrust; NGT=Naga thrust. Graphs of regression analyses between average annual precipitation and (B) ksn values, (C) HI, and (D) mean T magnitude of the drainage basins. Precipitation data is from https://worldclim.org.
5 Discussion
The collision and convergence between the Indian and Myanmar plates, characterized by its oblique nature, has given rise to the imbricate fold-thrust structural architecture of the Indo-Myanmar Range (IMR) (Hall, 1997; Soibam et al., 2015). This monumental tectonic event laid down the framework for a series complex processes including subduction, transformation, and accretionary wedging that have been instrumental in shaping various thrust sheets of the region, thereby unveiling the ongoing orogenic dynamics and active growth patterns of its fold-thrust belts (Soibam et al., 2015).
Occurrence and disposition of such geomorphic features as straight stream courses, gridiron drainage pattern, drainage deflections, shutter ridges with series of wind-gaps, and fluvial terraces collectively suggest active tectonic growth of the BMTS and NBTS through uplift and/or lateral movement on the associated faults (Figures 2–8). The spatial distribution patterns of geomorphic indices, however, reveal that the pattern and extent of uplift across both the thrust sheets varies considerably; spatial variability in computed geomorphic indices could be due to variable climate and varying erodibilities of the stream beds, but these possibilities are ruled out here for the reasons already discussed above. The higher ksn and HI values in NBTS (having Mode ksn = 111 and Mode HI = 0.46) as compared to BMTS (having Mode ksn = 56 and Mode HI = 0.43) suggest faster uplift of the former than the latter (Figures 9, 10). Moreover, the ksn and HI within the individual thrust sheets also show a decrease from north to south (Figures 9, 10). Modes of ksn in the northern and southern parts of the NBTS are 114 and 96, respectively, and those of the northern and southern parts of the BMTS are 113 and 47, respectively. Similarly, modes of HI in the northern and southern parts of the NBTS are 0.47 and 0.44, respectively, and those of the northern and southern parts of the BMTS are 0.43 and 0.41, respectively. These data suggest that northern parts of both thrust sheets have been uplifting faster than their southern parts.
Occurrence of a fluvial gravel unit at ∼100 m above the current Tupui River bed near Noney, presence of upper level river terrace at ∼7 m above the same river bed in Noney river valley, limited stream entrenchment to only ∼3 m farther south of Noney in Khoupum valley, and presence of upper level river terraces at ∼3.5 and 4 m above the present river beds farther south of Khoupum valley at Leimatak and Tuilaphai reaffirm the ksn and HI-based deduction of north to south decrease in uplift of the NBTS. These deductions are in agreement with what Wang et al. (2014), and Goswami and Kshetrimayum (2020) observed for the trailing edge of the NBTS.
Furthermore, the spatial analyses of T suggest that the trunk streams of the examined drainage basins of both the thrust sheets have preferentially shifted southward from the basin centerline (precisely, south-southeastward in NBTS and south-southwestward in BMTS) (Figure 11). As discussed above, these preferential stream migrations are neither controlled by stratal dips nor the variations in stream beds’ erodibilities. Admittedly, the preferential lateral migrations of drainage basins’ trunk streams in the thrust sheets are attributed to active southward down-tilting of the thrust sheets in response to faster uplift of their northern parts as compared to the southern parts.
It is clear from the foregoing discussion that both the BMTS and NBTS in the outlined area have been actively uplifting at varying rates; the uplift of the NBTS has been faster than the BMTS. Moreover, the rate of uplift within both the sheets also varies from north to south; being faster in the northern parts than the southern parts. These patterns of differential uplifts of the thrust sheets are a result of the along-strike variation in the uplift along the basal thrusts of the thrust sheets, i.e., BMT and NBT (Figure 15). Furthermore, geomorphic features such as stream offsets/deflections, shutter ridges, etc. reveal that different parts of the differentially uplifting BMTS and NBTS have also been laterally displaced due to lateral slip on the faults developed within the thrust sheets, Interestingly, similar geomorphic investigations reveal that the Churachandpur-Mao thrust sheet (CMTS) and Thoubal-Chandel thrust sheet (TCTS) developed to the east of NBTS also experience spatially differential uplift and attendant tilting due to along-strike variations in the uplift along their basal thrusts, i.e., CMT and TCT, respectively (see Figures 1B,C for reference) (Goswami and Kshetrimayum, 2020; Kshetrimayum and Goswami, 2023). However, while the uplift pattern of TCTS is similar to that of BMTS and NBTS, being faster in its northern part than the southern part, the uplift pattern of CMTS is at stark variance, being faster in its southern part than the northern part (Kshetrimayum and Goswami, 2023).
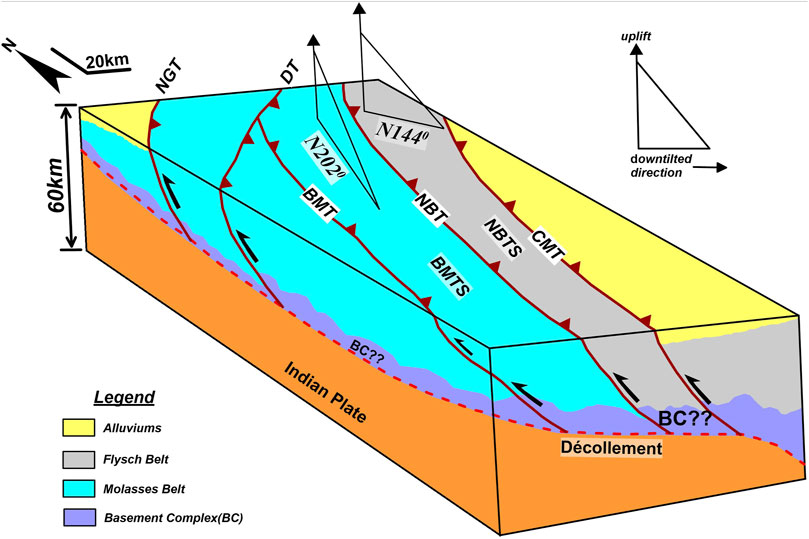
Figure 15. Schematic diagram illustrating the active tectonic evolution of Nungba thrust sheet (NBTS) and Barak-Makru thrust sheet (BMTS). Vertical motion components in this diagram are relative only. Overall depth of the décollement is generalized on the basis of Rakshit et al. (2018). Abbreviations used are same as used in Figure 1 (or elsewhere in text).
As already pointed out, recent seismotectonic investigations suggest that a major portion of the Indo-Myanmar plate convergence is being accommodated within the IMR (e.g., Gahalaut et al., 2013; Steckler et al., 2016; Lindsey et al., 2023). However, the GPS measurements reveal high variability in velocity vectors at different sites within the individual thrust sheets of the IMR, suggesting present day variability in slip motions along major faults of it (cf. Kumar et al., 2011; Gahalaut et al., 2013; Steckler et al., 2016; Mallick et al., 2019; Panda et al., 2020; Oryan et al., 2023). Present investigations suggest such variability in movements on major faults of the study area, such as BMT and NBT, has been throughout the Quaternary period, as a result of which the overriding BMTS and NBTS, respectively, have been differentially uplifting and down-tilting southward.
6 Conclusion
The present study lends insight into active tectonic evolution of the terranes in a hitherto unstudied, largely inaccessible part of the IMR. The specific conclusions drawn are:
I. The NBTS and BMTS are actively uplifting, which is relatively faster for the former.
II. Faster vertical movements in the northern parts, as compared to southern parts, of the basal thrusts have caused southward down-tilting of both the thrust sheets.
III. The growth pattern of the adjacently lying NBTS and BMTS is similar, which is in contrast to differing growth patterns of two other adjacently lying thrust sheets in the farther eastern part of the IMR (cf. Kshetrimayum and Goswami, 2023).
The present study demonstrates that the spatial growth patterns of two adjacently lying thrust sheets (NBTS and BMTS) in a part of the actively growing IMR are almost the same and controlled by the movements on their basal thrusts. But nevertheless, it cannot be generalized that all the stacking thrust sheets within a growing orogens spatially evolve in the same manner, for the reason that a previous study (Kshetrimayum and Goswami, 2023) demonstrates that the two other adjacently lying thrust sheets (CMTS and TCTS) to the immediate east of NBTS of the IMR have different spatial growth patterns. To sum up, different tectonic terranes of the IMR demarked by regional thrusts have been variably growing since Quaternary period, but more studies are required to comprehend along- and across-strike complexities in active growth of all such terranes.
Data availability statement
The original contributions presented in the study are included in the article/Supplementary Material, further inquiries can be directed to the corresponding author.
Author contributions
AK: Conceptualization, Data curation, Investigation, Methodology, Writing–original draft, Writing–review and editing. PG: Conceptualization, Formal Analysis, Investigation, Writing–original draft, Writing–review and editing. C-PC: Funding acquisition, Project administration, Resources, Writing–review and editing. W-LC: Resources, Supervision, Writing–review and editing. LJ: Software, Writing–review and editing.
Funding
The author(s) declare that financial support was received for the research, authorship, and/or publication of this article. The research was supported by the National Science and Technology Council Grant No. 113-2114-M-008-001 and UGC (CAS) for funding the fieldwork.
Acknowledgments
We would like to express our sincere gratitude to the Center for Space and Remote Sensing Research (CSRSR) and the Department of Earth Sciences at National Central University (NCU), Taiwan, and the Department of Geology at Kumaun University (KU), India, for providing the necessary resources and support during the course of this research. We thank the National Science and Technology Council, Taiwan, for their financial support to ASK in his post-doctoral program under grant number NSTC 111-2116-M-008-004-MY3 for which PG, C-PC, W-LC were the join mentors. We also extend our thanks to the University Grants Commission (UGC) and the Department of Science and Technology (DST), New Delhi, for funding PG for the fieldwork under the SAP (CAS) and FIST programs. Finally, we are grateful to the reviewers for their constructive comments and suggestions, which helped to improve the quality of this manuscript.
Conflict of interest
The authors declare that the research was conducted in the absence of any commercial or financial relationships that could be construed as a potential conflict of interest.
Publisher’s note
All claims expressed in this article are solely those of the authors and do not necessarily represent those of their affiliated organizations, or those of the publisher, the editors and the reviewers. Any product that may be evaluated in this article, or claim that may be made by its manufacturer, is not guaranteed or endorsed by the publisher.
References
Acharyya, S. K. (2010). Tectonic evolution of Indo-Burma range with special reference to Naga-Manipur hills. Meim. Geol. Soc. India. 75, 25–43.
Angelier, J., and Baruah, S. (2009). Seismotectonics in Northeast India: a stress analysis of focal mechanism solutions of earthquakes and its kinematic implications. Geophy. J. Int. 178 (1), 303–326. doi:10.1111/j.1365-246x.2009.04107.x
Aydin, A., Antonellini, M., Tondi, E., and Agosta, F. (2010). Deformation along the leading edge of the Maiella thrust sheet in central Italy. J. Struct. Geol. 32 (9), 1291–1304. doi:10.1016/j.jsg.2008.10.005
Betka, P. M., Seeber, L., Thomson, S. N., Steckler, M. S., Sincavage, R., and Zoramthara, C. (2018). Slip-partitioning above a shallow, weak décollement beneath the Indo-Burman accretionary prism. Earth Planet. Sci. Lett. 503, 17–28. doi:10.1016/j.epsl.2018.09.003
Bhattacharya, G., Robinson, D. M., and Wielicki, M. M. (2021). Detrital zircon provenance of the Indus Group, Ladakh, NW India: implications for the timing of the India-Asia collision and other syn-orogenic processes. Geol. Soc. Am. Bull. 133, 1007–1020. doi:10.1130/B35624.1
Brock, W. G., and Engelder, T. (1977). Deformation associated with the movement of the Muddy Mountain overthrust in the Buffington window, southeastern Nevada. Geol. Soc. Am. Bull. 88 (11), 1667–1677. doi:10.1130/0016-7606(1977)88<1667:dawtmo>2.0.co;2
Burbank, D. W., and Anderson, R. S. (2012). Tectonic geomorphology. 2nd ed. Hoboken, NJ: Wiley-Backwell, 460.
Chapman, J. B., and DeCelles, P. G. (2015). Foreland basin stratigraphic control on thrust belt evolution. Geology 43, 579–582. doi:10.1130/g36597.1
Chapple, W. M. (1978). Mechanics of thin-skinned fold-and-thrust belts. Geol. Soc. Am. Bull. 89, 1189–1198. doi:10.1130/0016-7606(1978)89<1189:motfb>2.0.co;2
Cheng, K. Y., Hung, J. H., Chang, H. C., Tsai, H., and Sung, Q. C. (2012). Scale independence of basin hypsometry and steady state topography. Geomorphology 171, 1–11. doi:10.1016/j.geomorph.2012.04.022
Cox, R. T. (1994). Analysis of drainage-basin symmetry as a rapid technique to identify areas of possible Quaternary tilt-block tectonics: an example from the Mississippi Embayment. Geol. Soc. Am. Bull. 106 (5), 571–581. doi:10.1130/0016-7606(1994)106<0571:aodbsa>2.3.co;2
Cox, R. T., Van Arsdale, R. B., and Harris, J. B. (2001). Identification of possible Quaternary deformation in the northeastern Mississippi Embayment using quantitative geomorphic analysis of drainage-basin asymmetry. Geol. Soc. Am. Bull. 113, 615–624. doi:10.1130/0016-7606(2001)113<0615:iopqdi>2.0.co;2
Curray, J. R. (1956). The analysis of two-dimensional orientation data. J. Geol. 64 (2), 117–131. doi:10.1086/626329
De Bremaecker, J. (1987). Thrust sheet motion and earthquake mechanisms. Earth Planet. Sci. Lett. 83 (1-4), 159–166. doi:10.1016/0012-821X(87)90059-8
Earnest, A., Sunilkumar, T. C., and Silpa, K. (2021). Sinking slab stress and seismo-tectonics of the Indo-Burmese arc: a reappraisal. Tectonics 40 (8), e2021TC006827. doi:10.1029/2021TC006827
Elliott, D. (1976). A discussion on natural strain and geological structure-The energy balance and deformation mechanisms of thrust sheets. Philosophical Trans. R. Soc. Lond. Ser. A, Math. Phys. Sci. 283 (1312), 289–312. doi:10.1098/rsta.1976.0086
Fick, S. E., and Hijmans, R. J. (2017). WorldClim 2: new 1km spatial resolution climate surfaces for global land areas. Int. J. Climatol. 37 (12), 4302–4315. doi:10.1002/joc.5086
Flint, J. J. (1974). Stream gradient as a function of order, magnitude, and discharge. Water Resour. Res. 10 (5), 969–973. doi:10.1029/wr010i005p00969
Gahalaut, V. K., Kundu, B., Laishram, S. S., Catherine, J., Kumar, A., Singh, M. D., et al. (2013). Aseismic plate boundary in the Indo-Burmese wedge, northwest Sunda Arc. Geology 41 (2), 235–238. doi:10.1130/g33771.1
Gailleton, B., Mudd, S. M., Clubb, F. J., Grieve, S. W., and Hurst, M. D. (2021). Impact of changing concavity indices on channel steepness and divide migration metrics. J. Geophy. Res. Earth Surf. 126 (10), e2020JF006060. doi:10.1029/2020jf006060
Gordon, R. G., DeMets, C., and Royer, J. Y. (1998). Evidence for long-term diffuse deformation of the lithosphere of the equatorial Indian Ocean. Nature 395 (6700), 370–374. doi:10.1038/26463
Goswami, P. K. (2018). Controls of basin margin tectonics on the morphology of alluvial fans in the western Ganga foreland basin's piedmont zone, India. Geol. J. 53 (5), 1840–1853. doi:10.1002/gj.3010
Goswami, P. K., and Kshetrimayum, A. S. (2020). Pattern of active tectonic deformation across the Churachandpur-Mao thrust zone of Manipur Hills, Indo-Myanmar range, NE India: inferences from geomorphic features and indices. Quat. Int. 553, 144–158. doi:10.1016/j.quaint.2020.06.047
Goswami, P. K., and Pant, S. (2019). Active bidirectional tectonic-tilting in a part of the Almora Klippe, Kumaun Lesser Himalaya, India: insights from statistical analyses of geomorphic indices. Quat. Int. 523, 46–53. doi:10.1016/j.quaint.2019.06.016
Hack, J. T. (1973). Stream-profile analysis and stream-gradient index. J. Res. U. S. Geol. Surv. 1 (4), 421–429.
Hall, R. (1997). Cenozoic plate tectonic reconstructions of SE Asia. Geol. Soc. Lond. Sp. Pub. 126 (1), 11–23. doi:10.1144/GSL.SP.1997.126.01.03
Horton, R. E. (1945). Erosional development of streams and their drainage basins; hydrophysical approach to quantitative morphology. Geol. Soc. Am. Bull. 56 (3), 275–370. doi:10.1130/0016-7606(1945)56[275:edosat]2.0.co;2
Ito, G., and Moore, G. F. (2021). Widths of imbricate thrust blocks and the strength of the front of accretionary wedges and fold-and-thrust belts. Tectonophysics 799, 228704. doi:10.1016/j.tecto.2020.228704
Jolivet, M., Cheng, F., Zuza, A. V., Guo, Z., and Dauteuil, O. (2022). Large-scale topography of the north Tibetan ranges as a proxy for contrasted crustal-scale deformation modes. J. Geol. Soc. 179 (4). doi:10.1144/jgs2021-085
Keller, E. A., and Pinter, N. (2002). Active tectonics: earthquake, uplift and landscape. 2nd ed. Upper Saddle River, NJ, United States: Prentice Hall, 362.
Kirby, E., and Whipple, K. (2001). Quantifying differential rock-uplift rates via stream profile analysis. Geology 29 (5), 415–418. doi:10.1130/0091-7613(2001)029<0415:qdrurv>2.0.co;2
Kirby, E., and Whipple, K. X. (2012). Expression of active tectonics in erosional landscapes. J. Struct. Geol. 44, 54–75. doi:10.1016/j.jsg.2012.07.009
Kshetrimayum, A. S., and Goswami, P. K. (2023). Active tectonics of the Thoubal-Chandel thrust, Manipur Hills, Indo-Myanmar range, northeast India: insights into deformation pattern of adjacent thrust sheets in a growing orogen. Geol. J. 58 (2), 662–682. doi:10.1002/gj.4617
Kumar, A., Mitra, S., and Suresh, G. (2015). Seismotectonics of the eastern Himalayan and Indo-Burman plate boundary systems. Tectonics 34 (11), 2279–2295. doi:10.1002/2015tc003979
Kumar, A., Sanoujam, M., Sunil, L., and Dolendro, T. (2011). Active deformations at the Churachandpur mao fault (CMF) in Indo Burma ranges: multidisciplinary evidences. Int. J. Geosci. 2 (04), 597–609. doi:10.4236/ijg.2011.24062
Kundu, B., and Gahalaut, V. K. (2012). Earthquake occurrence processes in the Indo-Burmese wedge and Sagaing fault region. Tectonophysics 524, 135–146. doi:10.1016/j.tecto.2011.12.031
Lindsey, E. O., Wang, Y., Aung, L. T., Chong, J. H., Qiu, Q., Mallick, R., et al. (2023). Active subduction and strain partitioning in western Myanmar revealed by a dense survey GNSS network. Earth Planet. Sci. Lett. 622, 118384. doi:10.1016/j.epsl.2023.118384
Luirei, K., Lokho, K., Longkumer, L., Ch. Kothyari, G., Rai, R., Rawat, I. S., et al. (2021). Morphotectonic evolution of the quaternary landforms in the Yangui river basin in the Indo-Myanmar range. J. Asian Earth Sci. 218, 104877. doi:10.1016/j.jseaes.2021.104877
Mallick, R., Lindsey, E. O., Feng, L., Hubbard, J., Banerjee, P., and Hill, E. M. (2019). Active convergence of the India-Burma-Sunda plates revealed by a new continuous GPS network. J. Geophy. Res. Sol. Earth. 124 (3), 3155–3171. doi:10.1029/2018JB016480
Maneerat, P., and Bürgmann, R. (2022). Geomorphic expressions of active tectonics across the Indo-Burma Range. J. Asian Earth Sci. 223, 105008. doi:10.1016/j.jseaes.2021.105008
Maneerat, P., Bürgmann, R., and Betka, P. M. (2022). Thrust sequence in the western fold-and-thrust belt of the Indo-Burma range determined from fluvial profile analysis and dynamic landform modeling. Tectonophysics 845, 229638. doi:10.1016/j.tecto.2022.229638
Maurin, T., and Rangin, C. (2009). Structure and kinematics of the Indo-Burmese Wedge: recent and fast growth of the outer wedge. Tectonics 28 (2). doi:10.1029/2008tc002276
McQuarrie, N., and Ehlers, T. A. (2017). “Techniques for understanding fold-and-thrust belt kinematics and thermal evolution,” in Linkages and feedbacks in orogenic systems. Geol. Soc. America. Editors R. D. Law, J. R. Thigpen, A. J. Merschat, and H. H. Stowell Boulder, CO, United States, 25–54.
Mehrotra, N., Shah, S. K., and Bhattacharya, A. (2014). Review of palaeoclimate records from Northeast India based on pollen proxy data of Late Pleistocene–Holocene. Quat. Int. 325, 41–54. doi:10.1016/j.quaint.2013.10.061
Mitchell, A. H. G. (1993). Cretaceous–Cenozoic tectonic events in the western Myanmar (Burma)–Assam region. J. Geol. Soc. 150 (6), 1089–1102. doi:10.1144/gsjgs.150.6.1089
Mon, C. T., Gong, X., Wen, Y., Jiang, M., Chen, F., Zhang, M., et al. (2020). Insight into major active faults in Central Myanmar and the related geodynamic sources. Geophy. Res. Lett. 47 (8), e2019GL086236. doi:10.1029/2019GL086236
Najman, Y., Jenks, D., Godin, L., Boudagher-Fadel, M., Millar, I., Garzanti, E., et al. (2017). The Tethyan Himalayan detrital record shows that India–Asia terminal collision occurred by 54 Ma in the Western Himalaya. Earth Planet. Sci. Lett. 459, 301–310. doi:10.1016/j.epsl.2016.11.036
Nautiyal, C. M., and Chauhan, M. S. (2009). Late Holocene vegetation and climate change in Loktak Lake region, Manipur, based on pollen and chemical evidence. Palaeobotanist 58, 21–28. doi:10.54991/jop.2009.78
Nennewitz, M., Thiede, R. C., and Bookhagen, B. (2018). Fault activity, tectonic segmentation, and deformation pattern of the western Himalaya on Ma timescales inferred from landscape morphology. Lithosphere 10 (5), 632–640. doi:10.1130/l681.1
Oryan, B., Betka, P. M., Steckler, M. S., Nooner, S. L., Lindsey, E. O., Mondal, D., et al. (2023). New GNSS and geological data from the Indo-Burman subduction zone indicate active convergence on both a locked megathrust and the Kabaw fault. J. Geophy. Res Sol. Earth. 128 (4), e2022JB025550. doi:10.1029/2022JB025550
Panda, D., Kundu, B., Gahalaut, V. K., and Rangin, C. (2020). India-sunda plate motion, crustal deformation, and seismic hazard in the Indo-Burmese arc. Tectonics 39 (8), e2019TC006034. doi:10.1029/2019TC006034
Pearson, O. N., and DeCelles, P. G. (2005). Structural geology and regional tectonic significance of the Ramgarh thrust, Himalayan fold-thrust belt of Nepal. Tectonics 24 (4). doi:10.1029/2003TC001617
Pérez-Peña, J. V., Azañón, J. M., Booth-Rea, G., Azor, A., and Delgado, J. (2009). Differentiating geology and tectonics using a spatial autocorrelation technique for the hypsometric integral. J. Geophy. Res. Earth Surf. 114 (F2). doi:10.1029/2008jf001092
Pike, R. J., and Wilson, S. E. (1971). Elevation-relief ratio, hypsometric integral, and geomorphic area-altitude analysis. Geol. Soc. Am. Bull. 82 (4), 1079–1084. doi:10.1130/0016-7606(1971)82[1079:erhiag]2.0.co;2
Rakshit, R., Bezbaruah, D., and Bharali, B. (2018). Oblique slip faulting associated with evolving central Indo-Burmese region from Early Pleistocene deformational sequences. Sol. Earth Sci. 3, 67–80. doi:10.1016/j.sesci.2018.04.002
Rao, N. P., and Kalpna, (2005). Deformation of the subducted Indian lithospheric slab in the Burmese arc. Geophy. Res. Lett. 32 (5). doi:10.1029/2004gl022034
Saikia, S., Baruah, S., Chopra, S., Gogoi, B., Singh, U. K., and Bharali, B. (2019). An appraisal of crustal structure of the Indo-Burmese subduction region. J. Geody. 127, 16–30. doi:10.1016/j.jog.2019.05.002
Schwanghart, W., and Scherler, D. (2014). Short Communication: TopoToolbox 2 – MATLAB-based software for topographic analysis and modeling in Earth surface sciences. Earth Surf. Dy. 2 (1), 1–7. doi:10.5194/esurf-2-1-2014
Selby, M. J. (1980). A rock mass strength classification for geomorphic purposes: with tests from Antarctica and New Zealand. Z. für Geomorphol. 24, 31–51. doi:10.1127/zfg/24/1984/31
Shaw, J. H., Bilotti, F., and Brennan, P. A. (1999). Patterns of imbricate thrusting. Geol. Soc. Am. Bull. 111 (8), 1140–1154. doi:10.1130/0016-7606(1999)111<1140:poit>2.3.co;2
Soibam, I. (2006). Relative plate motions in and around Manipur and its implications on the tectonics of the Indo-Myanmar ranges. Himal. Geol. 27, 111–122.
Soibam, I., Khuman, M. C., and Subhamenon, S. S. (2015). Ophiolitic rocks of the Indo-Myanmar ranges, NE India: relicts of an inverted and tectonically imbricated hyper-extended continental margin basin? Geol. Soc. Lond. Sp. Pub. 413 (1), 301–331. doi:10.1144/SP413.12
Steckler, M. S., Mondal, D. R., Akhter, S. H., Seeber, L., Feng, L., Gale, J., et al. (2016). Locked and loading megathrust linked to active subduction beneath the Indo-Burman Ranges. Nat. Geosci. 9 (8), 615–618. doi:10.1038/ngeo2760
Stockmeyer, J. M., Shaw, J. H., Brown, N. D., Rhodes, E. J., Richardson, P. W., Wang, M., et al. (2017). Active thrust sheet deformation over multiple rupture cycles: a quantitative basis for relating terrace folds to fault slip rates. Geol. Soc. Am. Bull. 129 (9-10), 1337–1356. doi:10.1130/B31590.1
Strahler, A. N. (1952). Hypsometric (area-altitude) analysis of erosional topography. Geol. Soc. Am. Bull. 63 (11), 1117–1142. doi:10.1130/0016-7606(1952)63[1117:haaoet]2.0.co;2
Tiwari, J., Goswami, P. K., and Bhakuni, S. S. (2021). Pattern of active crustal deformation in a part of a Lesser Himalayan tectonic window, Himachal Pradesh, India. Quat. Int. 592, 111–120. doi:10.1016/j.quaint.2021.03.043
Topal, S. (2019). Evaluation of relative tectonic activity along the Priene-Sazlı Fault (Söke Basin, southwest Anatolia): insights from geomorphic indices and drainage analysis. J. Mount.Sci. 16 (4), 909–923. doi:10.1007/s11629-018-5274-x
Tucker, G. E., and Whipple, K. X. (2002). Topographic outcomes predicted by stream erosion models: sensitivity analysis and intermodel comparison. J. Geophy. Res. Sol. Earth. 107 (B9), ETG–1. doi:10.1029/2001jb000162
Wang, Y., Sieh, K., Tun, S. T., Lai, Y., and Myint, T. (2014). Active tectonics and earthquake potential of the Myanmar region. J. Geophy. Res. Sol. Earth. 119 (4), 3767–3822. doi:10.1002/2013JB010762
Wobus, C., Whipple, K. X., Kirby, E., Snyder, N., Johnson, J., Spyropolou, K., et al. (2006). “Tectonics from topography: procedures, promise, and pitfalls,” in Special paper 398: tectonics, climate, and landscaape evolution (Boulder, CO, United States: Geological Society of America), 55–74. doi:10.1130/2006.2398(04
Wobus, C. W., Hodges, K. V., and Whipple, K. X. (2003). Has focused denudation sustained active thrusting at the Himalayan topographic front? Geology 31, 861–864. doi:10.1130/G19730.1
Keywords: active tectonics, geomorphic indices, geomorphic expression, thrust sheets, Indo-Myanmar range
Citation: Kshetrimayum AS, Goswami PK, Chang C-P, Chang W-L and Joshi LM (2024) Active tectonic evolution of two adjoining thrust sheets in the Indo-Myanmar fold-thrust belt, Northeast India. Front. Earth Sci. 12:1389308. doi: 10.3389/feart.2024.1389308
Received: 21 February 2024; Accepted: 05 June 2024;
Published: 01 July 2024.
Edited by:
Ziyadin Cakir, Istanbul Technical University, TürkiyeReviewed by:
Zhongtai He, China Earthquake Administration, ChinaChandreyee Goswami, Institute of Rock Structure and Mechanics (ASCR), Czechia
Copyright © 2024 Kshetrimayum, Goswami, Chang, Chang and Joshi. This is an open-access article distributed under the terms of the Creative Commons Attribution License (CC BY). The use, distribution or reproduction in other forums is permitted, provided the original author(s) and the copyright owner(s) are credited and that the original publication in this journal is cited, in accordance with accepted academic practice. No use, distribution or reproduction is permitted which does not comply with these terms.
*Correspondence: Chung-Pai Chang, Y3BjaGFuZ0Bjc3Jzci5uY3UuZWR1LnR3