 Deyu Yin
- Faculty of Architecture and Civil Engineering, Huaiyin Institute of Technology, Huaian, China
The seismic attenuation relationship between ground motion parameters (such as peak acceleration and response spectra value) and seismic parameters (such as magnitude and epicentral distance) is an important foundation for seismic hazard analysis and the core of determining seismic input parameters for seismic resistance engineering. The acceleration envelope parameters, which describe the relationship between ground motion intensity and time variation, are primarily used for artificially synthesizing seismic motion. At present, little research has been performed on the attenuation relationship of acceleration envelope parameters in the Longmenshan fault zone on the eastern side of the Tibetan Plateau in China. Therefore, this study selected the Mw4-6 aftershock records of the 2008 Wenchuan earthquake that occurred on the Longmenshan fault zone and established a commonly used three segment envelope model parameter attenuation relationship. We classified aftershock records based on their source mechanisms and obtained attenuation relationship models for thrust slip aftershocks, thrust and strike slip aftershocks, and strike slip aftershocks. The results are as follows: (1) The thrust slip aftershock records had the longest rising stage which is the time difference from the arrival of P-waves to the beginning of the stable sustained stage of seismic motion. Thrust and strike slip aftershocks records had the longest stable sustained stage period and the slowest attenuation at the tail of the record. (2) The attenuation relationship of the acceleration envelope parameters commonly used in Chinese engineering for artificially synthesizing seismic motion is based on the strong earthquake records in the western United States. But, compared to the attenuation characteristics of the acceleration envelope function in the western United States, the Mw4-6 earthquake records on the Longmenshan fault zone had a slower attenuation rate at the tail of the record. So, accurately artificially synthesizing seismic motion through envelope parameter attenuation model requires the use of attenuation model established by earthquake records in this region.
Introduction
The seismic motion, y(t),is a random process consisting of three stages: a rising stage from weak-to-strong, a relatively stable sustained stage in the middle, and finally, a decaying stage from strong-to-weak.Based on this feature, researchers have synthesized the seismic motion time history by multiplying the stationary stochastic process, x(t), with the envelope function,f(t) (Equation 1) (Huo et al., 1991). Among them, envelope functionf(t) reflects the non-stationary characteristics of seismic motion.
To calculate f(t), researchers have established different types of envelope function models, and the parameters in the models are the envelope parameters (as shown in Equation 2; Figure 4A). (Housner and Jennings, 1964; Goto et al., 1966; Shinozuka and Sato, 1967; Ohsaki et al., 1980; Huo et al., 1991). The envelope parameters describe the characteristics of the three stages of seismic motion, controlling the time from weak-to-strong, the duration of the relatively stable stage, and the degree of attenuation from strong-to-weak.The envelope of seismic motion is an important parameter for synthesizing seismic motion and a crucial part of the assessment of the seismic hazard.
Among these models, the three segment envelope function attenuation model has been used for the seismic design of nuclear power plants in Japan and the United States, as well as for the synthetic earthquake time history in China (Huo et al., 1991). However, research on the attenuation relationship of the acceleration envelope parameters considers different types of seismic records as a whole, ignoring the differences in earthquake source mechanisms (Huo et al., 1991; Xiao, 2011).
The correlation between seismic source mechanism and motion parameters is a concern for researchers (Campbell, 1981; Mcgarr, 1984; Spudich et al., 1999; Chen and Galasso, 2019; Wang et al., 2023). The Next-Generation Attenuation Relationships for Western US (NGA-West2) established by the Pacific Earthquake Engineering Research Center is the most advanced earthquake motion prediction models in the world (Boore et al., 2014). The NGA-West2 considers more comprehensive factors that affect seismic motion, such as source mechanism and the directionality of the rupture. The differences in seismic source mechanisms result in different radiation patterns for the seismic phases, which in turn affect seismic motion parameters. Campbell (1981) studied the correlation between peak acceleration and earthquake focal mechanism. Spudich et al. (1999) found that normal-fault horizontal ground motions are not significantly different from strike-slip ground motions. When Wang et al. (2023) studied theoretical intensity map of the 2022 Menyuan Mw6.6 earthquake in China, they found that the seismic attenuation model obtained using similar fault type seismic records can better simulate earthquake intensity. Therefore, selecting the statistical model obtained from the same type of earthquake records in the region can more accurately describe the characteristics of future seismic motions.
In recent years, several destructive earthquakes have occurred on the Longmenshan fault zone located on the edge of the Sichuan Basin in China (Figure 1). A large number of records have also been obtained in the near field area, particularly for the Wenchuan earthquake, greatly enriching the database of the region (Chen et al., 2011; Li et al., 2010; Li et al., 2018; Yang et al., 2021). Chen and Galasso (2019) used the 2008 Mw7.9 Wenchuan earthquake, 2013 Mw6.6 Lushan earthquake, and 2017 Mw6.5 Jiuzhaigou earthquake that occurred along the Longmenshan fault zone to obtain ground motion parameters. The results showed that the Chinese data are characterized by slower attenuation with respect to the Next-Generation Attenuation Relationships for Western US ground-motion models. This reflects the regional differences in seismic parameters and also indicates that the seismic characteristics of the Longmenshan fault zone are unique.
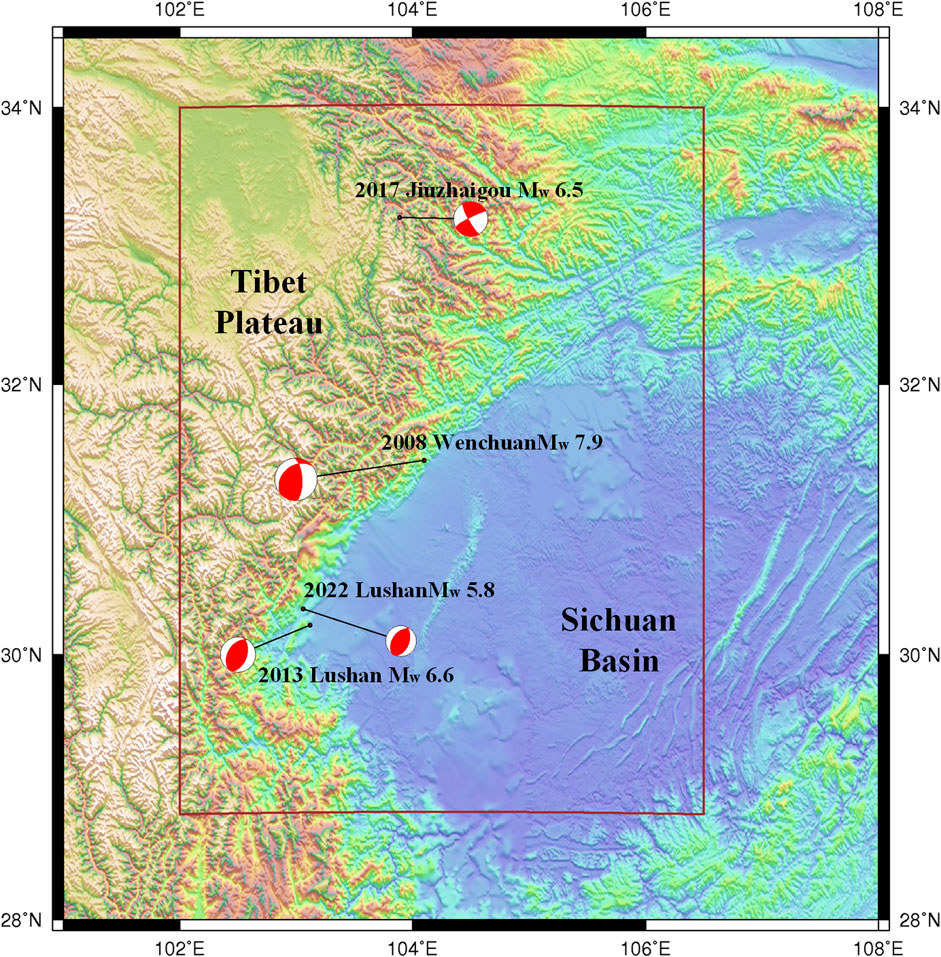
Figure 1. The location of the four earthquakes that have occurred in the Longmenshan Fault Zone in recent years. The focal mechanism solutions are from the Global Centroid Moment Tensor (Global CMT). The rectangular box represents the research area of this article.
In this study, we researched the characteristics of attenuation relationship of envelope parameters for the Wenchuan earthquake aftershocks. The biggest difference between this study on the attenuation relationship of envelope parameters and existing research is that it considers the differences in the source mechanisms. Huo et al. (1991) and Xiao (2011) obtained the envelope function, but ignored the differences in source mechanisms. Based on the characteristics of the aftershock mechanism of the Wenchuan earthquake and the slip characteristics on its fault plane (e.g., Cui et al., 2011; Fielding et al., 2013; Hartzell et al., 2013; Yin, 2017), thrust-slip (TF), thrust- and strike-slip (TS), and strike-slip (SS) aftershocks were selected. Based on the method of Zoback (1992), the focal mechanisms were classified using the dip angles of the P-axis, B-axis, and T-axis. This method is based on the vibration direction of the first arrival wave in different regions of the reference sphere of the seismic source. For example, TF aftershocks have P ≤ 35° and T ≥ 52°. After identifying the P-wave arrival time and removing the noise, the envelope model was obtained through fitting. Through statistical analysis of strong earthquake records, the variation relationship of acceleration envelope function with respect to earthquake magnitude and distance was obtained.
Data
The 12 May 2008 Mw7.9 Wenchuan earthquake caused a large number of casualties and very serious engineering damage. In the process of propagation from the epicentre to the northeast, the rupture passed through several stages, with a fault rupture length of approximately 300 km (Fielding et al., 2013; Hartzell et al., 2013). When the earthquake ruptured from the southwest to the northeast, there was a significant change in the slip type. The southern segment of the fault was dominated by thrust. In the northern section, the slip type changed from thrust and strike slip to strike-slip (Shen et al., 2009; Hartzell et al., 2013). Based on the slip characteristics of the fault plane, the records of TF, TS, and SS aftershocks were selected. The focal mechanism of the aftershocks was classified based on the results of Yang et al. (2021) (Figure 2; Supplementary Appendix Table S1).
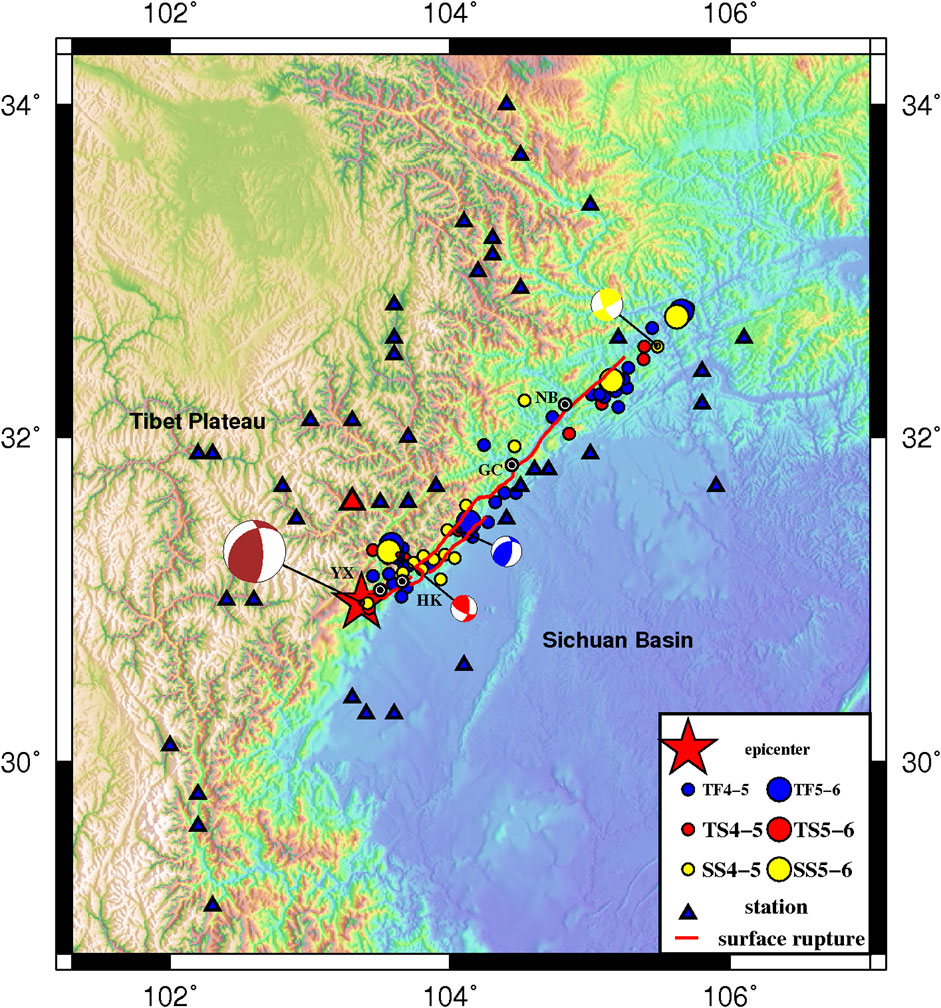
Figure 2. The epicentre of the Wenchuan earthquake, the selected aftershock epicentre, the surface rupture and the location of the stations. The aftershock focal mechanism solutions are from Yang et al. (2021). The blue circle indicates the TF aftershock. The red circle indicates TS aftershocks. The yellow circle indicates SS aftershocks.
For the selected earthquake, there must be two or more available station records. There are 35 TF, 13 T, and 25 SS aftershocks (Figure 3). The instrument used to record signals is an accelerometer, which obtains acceleration records. From 489 sets of three component acceleration records with complete records and clear P-wave initial motion information, a total of 1,467 records were selected. The numbers of the three types of aftershock records were 681, 504, and 282. The aftershock moment magnitude range is Mw4.0–6.0, and the epicenter distance is within 250 km. According to the site conditions provided by the Earthquake Damage Prevention Department of China Earthquake, Administration (2008) and the drilling information provided by Yu (2012), most of the stations selected in this article are soil sites belonging to class II in the code for seismic design of buildings (National standard of the people’s republic of china, 2010). For example, the equivalent shear wave velocity and thickness of soil layer for station 51JYC are 466 m/s and larger than 5 m, respectively. The site is class II (Table 1).
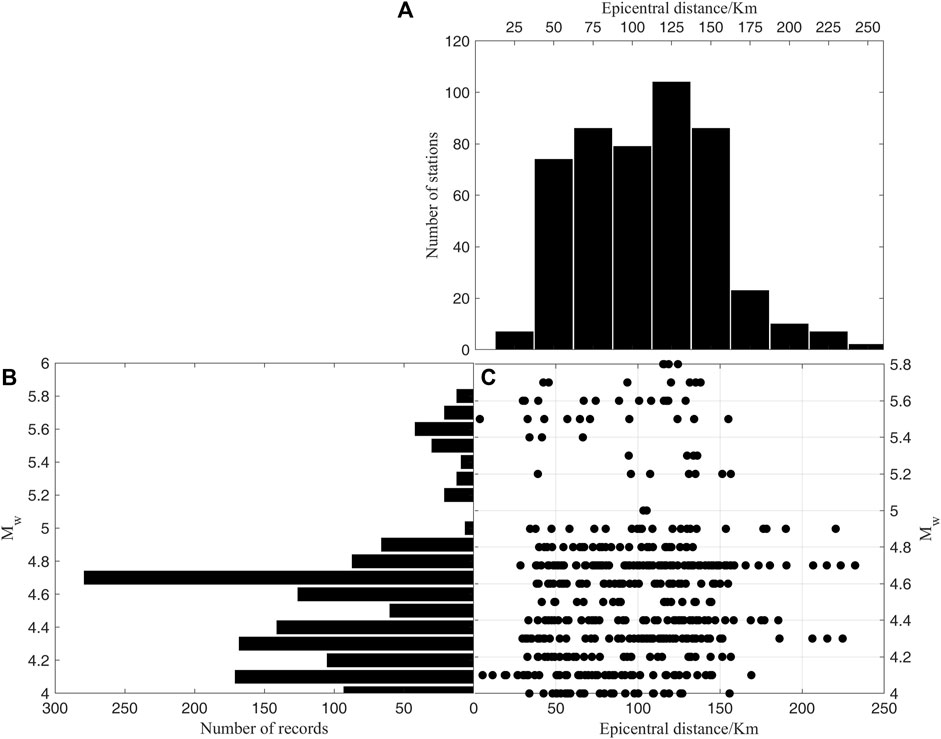
Figure 3. Information of aftershock records. (A) Distribution of acceleration number at different epicentral distances, (B) Number distribution of accelerations of different magnitudes, (C) Epicentral distance distribution of accelerations with different magnitudes.
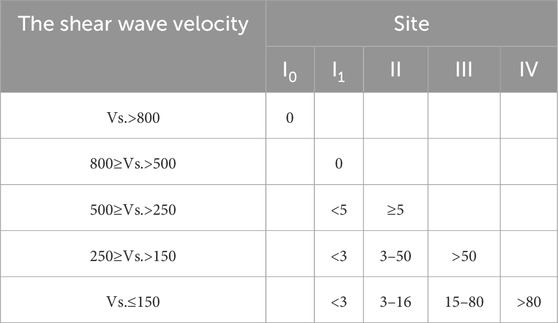
Table 1. The division method of the site of the stations.
Acceleration envelope model and model parameters
Earthquake acceleration records often exhibit this characteristic where the time history of ground motion shows a non-stationary feature, roughly composed of three segments: the rising, stable, and falling stages (Huo et al., 1991). The acceleration envelope model can be divided into two types: the unimodal (Goto et al., 1966) and three-segment envelope models (Amin and Ang, 1968). The unimodal model cannot reflect the characteristics of long duration for the far field of large earthquakes. This model can intuitively reflect the characteristics of changes in seismic record and has been widely applied in engineering. At present, artificially synthesized seismic motions represent this non-stationary feature through envelope functions. The envelope function of seismic motion is studied based on the characteristics of seismic records in the three stages (Amin and Ang, 1968; Huo et al., 1991; Xiao, 2011; Yin et al., 2020; 2021).
The three-segment envelope model function is shown in Equation 2.
where T1, T2, A, and C are model parameters; and T1 is the boundary point between the rising stage and the stable stage. T2 is the boundary point between the stable stage and the falling stage. A represents the amplitude of the stable stage. C controls the decay speed of the falling stage. The duration of stable stage Ts is T2-T1. Here, the envelope parameters are T1, Ts, and C (Figure 4A).
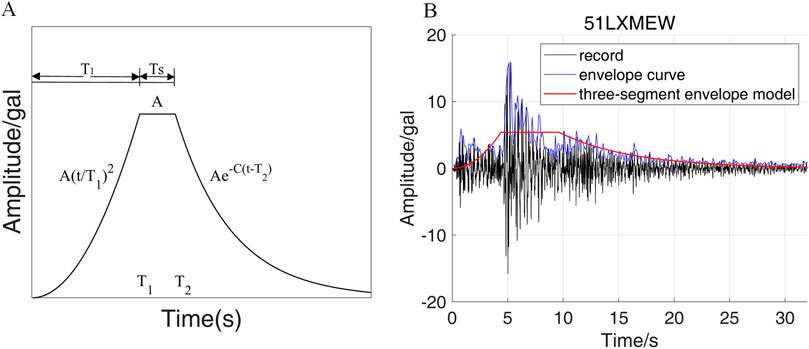
Figure 4. (A)Three-segment envelope model. The model consists of a rising stage, stable stage, and falling stage. (B) East-west acceleration record, envelope, and fitting results of the three envelope modelfor the Mw5.4 earthquake at station 51LXM.
T1 represents the duration of the rising phase. Ts represents the duration of the stationary period. C describes the speed of descent of record in rear segment. Figure 4B is the EW acceleration record, envelope, and fitting results of three envelope models for the Mw 5.4 earthquake at station 51LXM.
Waveform attenuation is strongly related to frequency. The scattering effect of high-frequency seismic waves with shorter wavelengths is more significant and attenuates faster. Low-frequency seismic waves with long wavelengths have a lower degree of attenuation (Huo, 1989). To test the effect of different filtering frequency bands on envelope parameters, we selected several records for. Figure 5 shows the east-west records and envelope curves of station 51LXM for the Mw5.4 earthquake (in Figure 2 with red triangle), as well as the three segment envelope models obtained from different filtering frequency bands. Tables 2, 3 list the information for the Mw5.4 earthquake and fit coefficient, respectively. A differential evolution algorithm is utilized to obtain the coefficient (the detailed content is listed in the ground motion model for the envelope parameter).
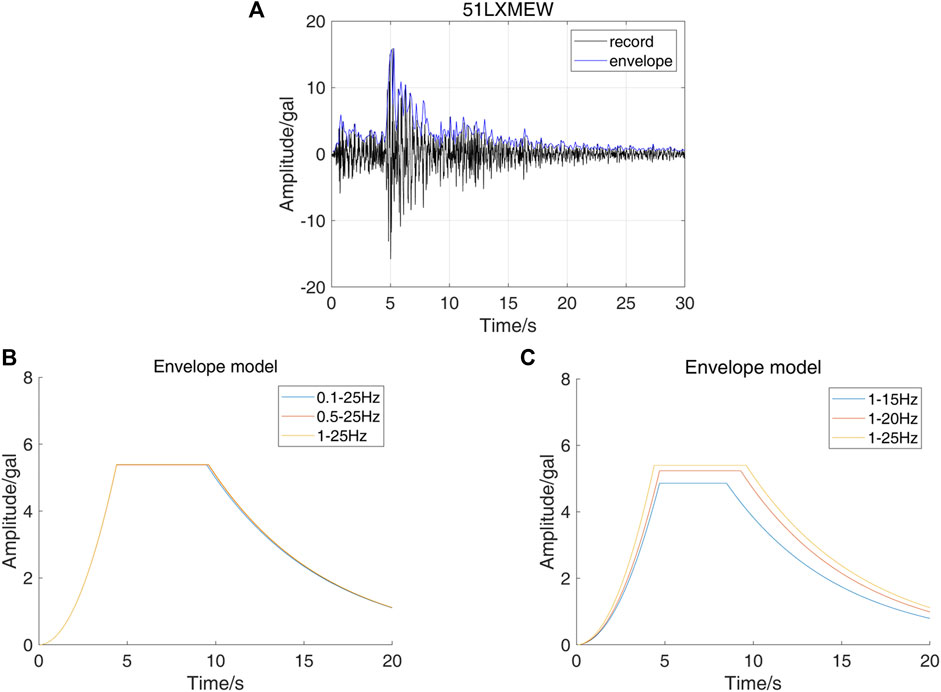
Figure 5. (A) East-west record and envelope curve. (B) Envelope model curves obtained from different minimum frequencies. (C) Envelope model curves obtained using different maximum frequencies.
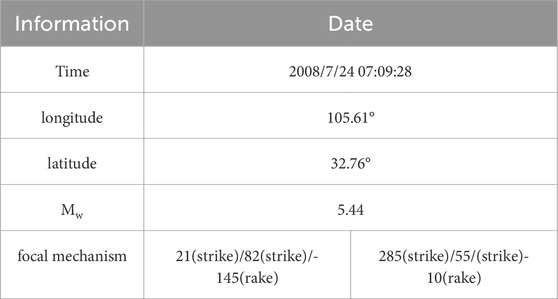
Table 2. Information of the Mw5.4 earthquake.
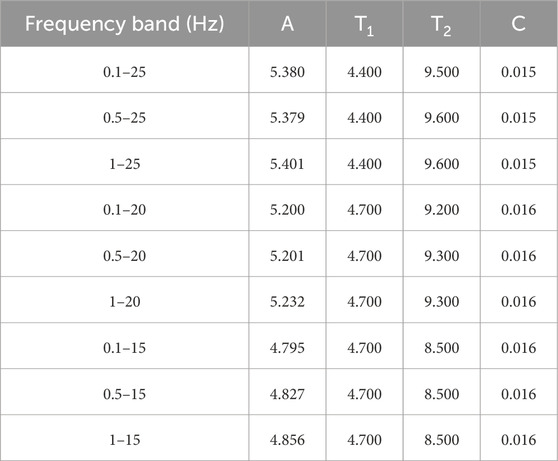
Table 3. Parameters of different frequency bands.
The minimum limit of the frequency band has little effect on the envelope parameters, and the obtained envelope parameter values are similar. The maximum frequency has a significant impact on the results. The smaller the maximum frequency is, the smaller the amplitude parameter obtained. Considering that the main frequency range of earthquake acceleration records is within 25 Hz, the frequency range that has a significant impact on the structure is usually less than 25 Hz; therefore, we have chosen the 1–25 Hz frequency band. A second-order Butterworth filter is applied to the records to obtain the filtered data.
P-wave arrival time
The commonly used methods for picking P-wave arrival times include energy analysis (e.g., long and short time average, STA/LTA) (Allen, 1978; 1982; Ma, 2008; Yin et al., 2023), autoregressive analysis (e.g., akaike information criterion, AIC) (Sleeman and Eck, 1999), wavelet transform (e.g., wavelet transform akaike information criterion, W-AIC) (Chakraborty and Okaya, 1995), and combination methods (e.g., STA/LTA+AIC) (Ma, 2008). At present, machine learning-based techniques have largely been used in recent years. These methods mainly utilize multiple characteristic parameters to comprehensively determine the arrival time of earthquake phases (Zhu et al., 2022; Palo et al., 2024).
The STA/LTA+AIC method was chosen in this study. This method highlights the main characteristics of seismic phases through appropriate feature functions. The first step uses the moment when the ratio of the average value of the characteristic function of the short time window and the average value of the characteristic function of the long time window reaches the threshold value as the arrival time of the P-wave. This arrival time often lags behind the real situation (Ma, 2008). The STA/LTA feature function amplifies the arrival time features, and the arrival time features are smoother.
In the second step, a certain record length is taken before and after the STA/LTA point, and the minimum value of the AIC function is obtained as the final P-wave arrival time. The calculation of the AIC value is shown in Equation 3.
The characteristic function CFp of record x(i) is shown in Equation 4 (Gao et al., 2008).
The STA/LTA value of the characteristic function is shown in Equation 5 (Ma, 2008).
i, k1, and k2 represent the recording time point, and k2 < k1 < i. By trial and error, the lengths of the short and long time windows are 0.1 and 2 s, respectively. The threshold is 4. Then, 1 s forwards and 0.3 s backwards at the STA/LTA pick time are selected to determine the AIC value within this time window. The time corresponding to the minimum value of the AIC function is the arrival time of the P-wave (Sleeman and Eck, 1999).
T1 is the time of the P-wave arrival. Thus, the P-wave arrival time mainly affects T1 for the three-segment envelope model. If the picking time is ahead, T1 is larger. The arrival time error obtained by this method is within 1 s (Yin et al., 2023). To ensure the accuracy of the picking results, records were checked one by one, and the records of P-wave initial loss were eliminated. Figure 6 shows the arrival times of the P-wave at station 51HSL during the Mw 4.4 aftershock. The arrival time of the P-wave found by the STA/LTA method is 10.98 s. The P-wave arrival time found by the AIC method is 10.89 s.
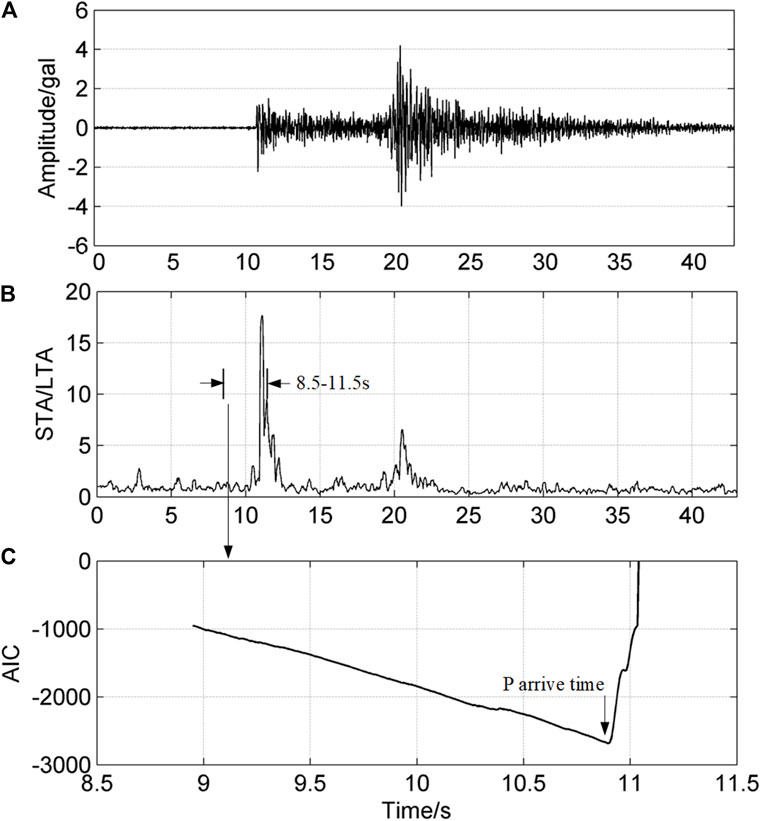
Figure 6. The arrival times of the P wave at Station 51HSL during an Mw 4.4 aftershock. (A) The vertical record. (B) The STA/LTA value. (C) The AIC function.
Ground motion model and coefficients for attenuation relationship
Utilizing the differential evolution algorithm (DE), parameters of the envelope models can be obtained (Storn and Price, 1997). The DE method obtains the optimal solution through three steps:
Mutation, crossover, and selection. Mutation generates a new parameter vector by adding the weighted difference vector between two individuals in the population to a third individual. Crossing is the process of mixing the parameters of the mutation vector with those of the target vector using certain rules to generate sub individuals. Newly generated individuals are applied when they are better than the target individuals in the population. First, the range of parameter values of T1, Ts, and C is set. Several parameter values are randomly selected within the range of values, and the three-segment envelope model are calculated. Then, the set of parameters that best fit the envelope curve is retained and utilized to determine the next-generation parameters of T1, Ts, and C by mutation and crossover. Next, the next-generation parameters of T1, Ts, and C are used to obtain the three-segment envelope model. If the envelope model and observed envelope curve meet the requirements, the calculation stops. Otherwise, the calculation is repeated until the requirements are met.
Here, we only selected records in the horizontal direction. For each record, we manually checked whether the obtained envelope model curve was reasonable, eliminating records with poor fitting effects and ensuring the envelope model curve fit the rising, stable, and falling stages.
The distribution of envelope parameters in the magnitude-distance plane is not random, but there is a strong correlation between magnitude and distance. The correlation is manifested by the distance of large earthquake records being at farther distances, whereas small earthquake records are concentrated in the near-field region. Therefore, during regression fitting, it is necessary to decouple the magnitude and distance (Xiao, 2011).
The traditional regression method performs a single regression of all data, which can easily lead to uncertainty owing to the correlation between distance and magnitude parameters, resulting in poor stability of the regression parameters. In response to this problem, researchers proposed the use of a distributed regression method to decouple the distance and magnitude terms (Joyner and Boore, 1981). This method introduces dummy variables. The first step is to regress the distance attenuation term, and the second step is to regress the magnitude term. Based on the characteristics of the records used, the distribution regression method can obtain relatively stable regression results. The envelope parameter attenuation relationship is shown in Equation 6 (Huo et al., 1991).
where Y represents the envelope parameter, M represents the magnitude, taking the moment magnitude, and R represents the epicentral distance. ε is the deviation. When the epicentral distance is within a certain range, the amplitude of seismic motion varies less with the increase of magnitude. This phenomenon is represented by distance parameter R0. Here, R0 is taken as 10 km (Huo, 1989), and the regression coefficients are C1, C2, and C3. Referring to Xiao (2011), a two-step regression method was adopted. The first step of the regression method is to perform statistical analysis on the records of each earthquake magnitude. Here, the data with greater than ±2 standard deviation were excluded. Then, parameter C3 is calculated. The average of all C values with different magnitude is the final fitting parameter. The second step is to perform statistical regression on all records to obtain parameters C1 and C2.
Scaling relationship of envelope parameter attenuation
The attenuation results of the three-segment envelope model of horizontal records obtained using the distribution regression method are shown in Tables 4–6 and Figure 7. Tables 4–6 show the fit parameters of TF, TS, and SS aftershocks, respectively. The values obtained from different types of aftershock data are similar. However, for each type of aftershock data, parameters T1 and Ts have a high dispersion, whereas the distribution of parameter C is more concentrated. In fact, the standard deviation is lowest for parameter C. Owing to the lack of data with epicentral distances less than 10 km, the results cannot reflect the characteristics of near-field envelope parameters.
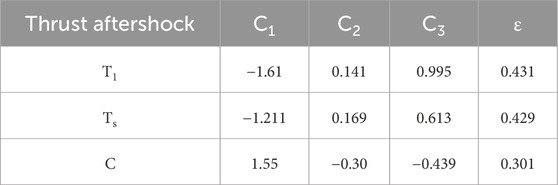
Table 4. Fit parameters of TF aftershocks.
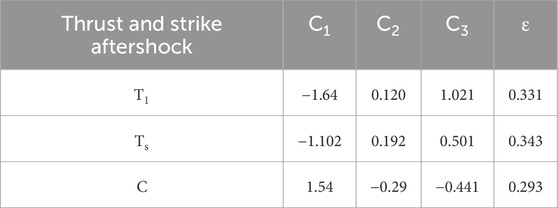
Table 5. Fit parameters of TS aftershocks.
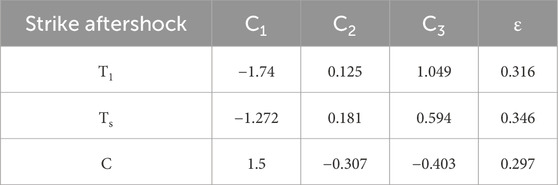
Table 6. Fit parameters of SS aftershocks.
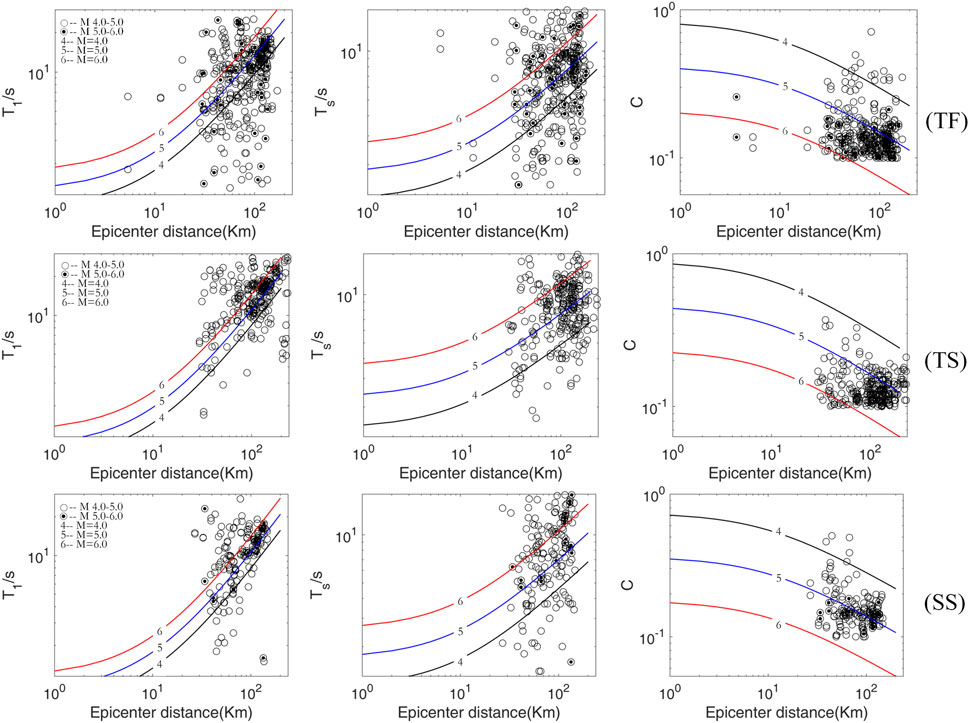
Figure 7. Envelope attenuation relationships of the three types of aftershocks. The top row is TF aftershocks. The middle row is TS aftershocks. The bottom row is SS aftershocks. The circle indicates the events with magnitudes of 4–5. The circle with black dot is the magnitude of 5–6. The black, blue and red lines are obtained by Equation 5 with magnitudes of 4, 5, and 6.
Figure 7 shows the comparison between the fitted curve and observed data. From the results, the attenuation characteristics of the parameters of the three types of aftershocks are found to be similar. However, there are differences in the discreteness of these parameters. The envelope parameters of the seismic records used in this article have considerable discreteness. Overall, the obtained attenuation relationship can reflect the changing characteristics of the data.
Result analysis
Figure 8 is the comparison of three types of aftershock envelope attenuation relationships. In general, the seismic motion caused by thrust faults is greater than that of strike-slip and normal faults (Mcgarr, 1984). In particular, when the magnitude is greater than 6.5, this phenomenon of amplification is extremely evident (Wang, 2022). By comparing the aftershock parameters of different faulting mechanisms, the characteristics of the three parameters are shown to be irregular. The values of three segment envelope parameters for TS aftershocks and SS aftershocks are similar, whereas the values of TF aftershocks are the highest for T1. For parameter Ts, when the epicentral distance is the same, the aftershock values of Ts for SS and TF aftershocks are similar, whereas those for TS aftershocks are the highest. For parameter C, the values are similar for TF and SS aftershocks, whereas the values of TS aftershocks are the smallest. This article utilized limited records and obtained the general characteristics of envelope parameter attenuation on the Longmenshan fault zone. With the accumulation of observed record in this area, more records must be selected for statistical analysis to obtain more accurate attenuation models.
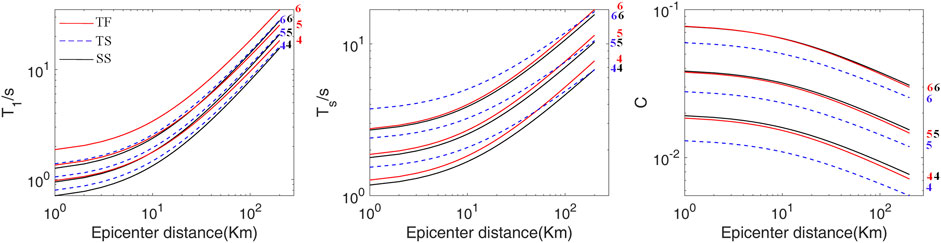
Figure 8. Comparison of the three types of aftershock envelope attenuation relationships obtained by Equation 5. The red, blue (dashed line) and black lines are TF, TS, and SS aftershocks, respectively. The number represents the magnitude.
From the comparison of the above results, for the three types of aftershock records with the same epicentral distance, the TF aftershock envelope curve is found to have a larger rise time, whereas the SS aftershock has a larger platform duration and slower attenuation at the tail of the record.
We also compared the differences between our results and those of existing studies. Figure 9 shows the three types of aftershock envelope attenuation relationships compared with the results of Huo et al. (1991) and Xiao (2011). Huo et al. (1991) obtained the rock and soil site attenuation relationships for records in the United States. The results of the soil site were selected for comparison and are similar to the station conditions selected in this study. Xiao (2011) determined the attenuation relationships for horizontal ground motion parameters of rock sites in the western America.
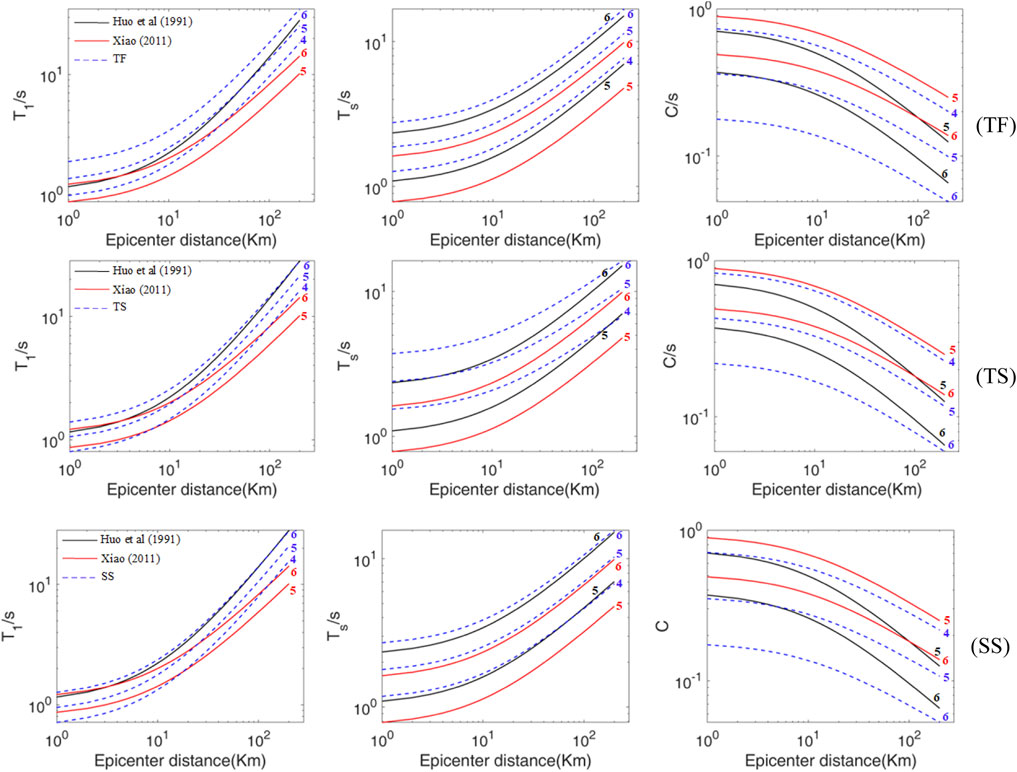
Figure 9. Results of the three types of aftershock envelope attenuation relationship compared with those of Huo et al. (1991) and Xiao (2011). The numbers show the magnitude.
From the results of T1 and Ts, our envelope parameters are found to be larger than those obtained by Huo et al. (1991) and Xiao (2011). The reason may be that Xiao (2011) utilized rock stations, whereas the station sites in this study are found in soil layers. When seismic waves pass through the soil layer, energy attenuation slows, adding reflection and scattering effects, prolonging the residence time of seismic waves in the soil layer, and increasing the duration of seismic waves (Huo et al., 1991). Furthermore, the magnitude used in this study is the moment magnitude, whereas Huo et al. (1991) and Xiao (2011) used surface wave magnitude (Ms). In general, the value of moment magnitude for the same earthquake should be smaller (Xu and Zhang, 2023). Therefore, the attenuation relationship represented by the moment magnitude corresponds to a larger wave magnitude.
For parameter T1, the results of Huo et al. (1991) are between the five to six magnitudes of our results. Huo et al. (1991) believed that the duration of the rising stage is only related to the difference of arrival times between P- and S-waves, but not to the magnitude. From the data fitting relationship, it can be seen that the larger the magnitude, the longer rise time T1. Owing to the long rupture time of the fault caused by the larger earthquake, more energy is released. For parameter Ts, our results are greater than those obtained by Huo et al. (1991). The results of Huo et al. (1991) using M six are similar to our results for TF and SS aftershocks. The results using M five are equivalent to the result of this research with M 4. The minimum magnitude of the data utilized by Huo et al. (1991) is 5.6; therefore, the results cannot reflect the characteristics of the envelope parameters with magnitudes less than 5.6. For parameter C, our results are smaller than Huo et al. (1991) and Xiao (2011). This indicates that the amplitude attenuation rate of the descending segment recorded in the Longmenshan fault zone area is relatively slow. From the results, there are differences in the attenuation of seismic ground motion parameters in different regions. Huo et al. (1991) and Xiao (2011) utilized records from the United States. Therefore, the aftershock envelope parameters of Wenchuan earthquake have a slower attenuation rate.
Attenuation is also strongly controlled by the underground structure, either the source side crustal velocity structure or the receiver side. This study primarily analyzed the envelope parameters of the aftershocks of the Wenchuan earthquake, and the selected records contain crustal structural information in this area, particularly the arrival time of the seismic phase.
According to the results of Huo (1989), the site conditions have an impact on the shape of the envelope function. The stable duration of the same magnitude and epicentral distance to the soil site station is larger than that of the rock site station, and the attenuation in the falling stage is also slower. Seismic waves generate secondary surface waves in soil layers, which superimpose effects such as reflection and scattering, resulting in an increase in the stable duration and a decrease in attenuation (Huo, 1989). The stations selected in this study were soil sites belonging to class II. It is not easy to extract the amplification effect of soil layers from records. If there is a certain number of bedrock station records, the attenuation characteristics are more reasonable. This is also the shortcoming of the attenuation relationship we obtained.
Owing to the research targeting data from different regions, differences in velocity construction also have a significant impact on the results. Therefore, the attenuation relationships obtained from different studies represent the results of this region. However, to a certain extent, it reflects the characteristics of strong motion records of M four to six in the Longmenshan fault zone.
Conclusion
This study examined the attenuation characteristics of aftershock envelope parameters for the Wenchuan earthquake. Considering the slip characteristics of the Wenchuan earthquake and sufficient aftershock records, thrust slip aftershocks, thrust and strike slip aftershocks and strike slip aftershocks with Mw4.0–6.0 were selected. The following conclusions are made.
1. The three types of aftershock records have the same attenuation characteristics. The thrust aftershock record has larger T1 values. The thrust and strike aftershock record has larger parameters of Ts and slower attenuation at the tail of the record. Thus, the differences in source mechanisms have a significant impact on seismic parameters. The analysis of seismic hazard in this region must consider the differences in source mechanisms.
2. Compared to the envelope attenuation relationship in the United States, the envelope parameters of aftershock records from this study exhibit slower attenuation characteristics. Our results provide an understanding of the attenuation characteristics of envelope parameters of small earthquake records in the Longmenshan fault Zone.
The attenuation relationship of the acceleration envelope parameters obtained in this study is applicable to magnitude Mw4–6, with an epicentral distance of less than 250 km. Establishing a more refined envelope parameter attenuation model in this area requires the use of more seismic records.
Data availability statement
The original contributions presented in the study are included in the article/Supplementary Material, further inquiries can be directed to the corresponding author.
Author contributions
DY: Conceptualization, Data curation, Formal Analysis, Funding acquisition, Investigation, Methodology, Project administration, Resources, Software, Supervision, Validation, Visualization, Writing–original draft, Writing–review and editing.
Funding
The author(s) declare that financial support was received for the research, authorship, and/or publication of this article. This research is supported by the Natural Science Foundation of Jiangsu Province (G rants No BK20210950), Huaian Natural Science Research Plan (HAB202365), Basic Research (Natural Science) Research Projects in Higher Education Institutions in Jiangsu Province (23KJB560003).
Conflict of interest
The authors declare that the research was conducted in the absence of any commercial or financial relationships that could be construed as a potential conflict of interest.
Publisher’s note
All claims expressed in this article are solely those of the authors and do not necessarily represent those of their affiliated organizations, or those of the publisher, the editors and the reviewers. Any product that may be evaluated in this article, or claim that may be made by its manufacturer, is not guaranteed or endorsed by the publisher.
Supplementary material
The Supplementary Material for this article can be found online at: https://www.frontiersin.org/articles/10.3389/feart.2024.1388674/full#supplementary-material
SUPPLEMENTARY TABLE S1 | The aftershocks information of the Wenchuan earthquake used in this article (Yang et al., 2021).
References
Allen, R. E. (1978). Automatic earthquake recognition and timing from single traces. Bull. Seismol. Soc. Am. 68 (5), 1521–1532. doi:10.1785/bssa0680051521
Allen, R. E. (1982). Automatic phase pickers: their present use and future prospects. Bull. Seismol. Soc. Am. 72 (6), 225–242. doi:10.1785/bssa07206b0225
Amin, M., and Ang, A. H. S. (1968). Nonstationary stochastic models of earthquake motions. J. Eng. Mech. Div. 94 (2), 559–584. doi:10.1061/jmcea3.0000969
Boore, D. M., Stewart, J. P., Seyhan, E., and Atkinson, G. M. (2014). NGA-West2 equations for predicting PGA, PGV, and 5% damped PSA for shallow crustal earthquakes. Earthq. Spectra 30 (3), 1057–1085. doi:10.1193/070113eqs184m
Campbell, K. W. (1981). Near-source attenuation of peak horizontal acceleration. Bull. Seismol. Soc. Am. 71 (6), 2039–2070. doi:10.1785/BSSA0710062039
Chakraborty, A., and Okaya, D. (1995). Frequency-time decomposition of seismic data using wavelet-based methods. Geophysics 60 (6), 1906–1916. doi:10.1190/1.1443922
Chen, H., and Galasso, C. (2019). A comparison of NGA-West2 ground-motion models to recent Chinese data. Soil Dyn. Earthq. Eng. 125, 105677. doi:10.1016/j.soildyn.2019.05.016
Chen, J. H., Liu, Q. Y., Li, S. C., Guo, B., Li, Y., Wang, J., et al. (2011). Seismotectonic study by relocation of the Wenchuan Ms8.0 earthquake sequence, Chin. J. Geophys. 52 (2), 390–397.
Cui, X. F., Hu, X. P., Yu, C. Q., Tao, K., Wang, Y. H., and Ning, J. Y. (2011). Research on focal mechanism solutions of wenchuan earthquake sequence. Acta Sci. Nat. Univ. Pekin. 47 (6), 1063–1072. doi:10.13209/j.0479-8023.2011.148
Earthquake Damage Prevention Department of China Earthquake Administration (2008). Uncorrected acceleration records for the 2008 Wenchuan 8.0 earthquake. Beijing: Seismological Press.
Fielding, E. J., Sladen Z H, A., Li, J. P., Avouac, J. P., Bürgmann, R., and Ryder, I. (2013). Kinematic fault slip evolution source models of the 2008 M7.9 Wenchuan earthquake in China from SAR interferometry, GPS and teleseismic analysis and implications for Longmen Shan tectonics. Geophys. J. Int. 194, 1138–1166. doi:10.1093/gji/ggt155
Gao, S. F., Li, S. Y., Wu, D. P., and Ma, Q. (2008). An automatic identification method of seismic phase based on modified STA/LTA algorithm. World Earthq. Eng. 24 (6), 37–41.
Goto, H., Toki, K., and Aiyoshi, T. (1966). Generation of artificial earthquakes on digital computer for aseismic design of structures. Proc. Jpn. Earthq. Eng. Symposium, 25–30.
Hartzell, S., Mendoza, C., Ramirez-guzman, L., Zeng, Y., and Mooney, W. (2013). Rupture History of the 2008 Mw7.9 Wenchuan, China, earthquake: evaluation of separate and joint inversions of geodetic, teleseismic, and strong-motion data. Bull. Seismol. Soc. Am. 103 (1), 353–370. doi:10.1785/0120120108
Housner, G. W., and Jennings, P. C. (1964). Generation of artificial earthquakes. J. Eng. Mech. Div. 90 (1), 113–150. doi:10.1061/jmcea3.0000448
Huo, J. R. (1989). Study on the attenuation laws of strong earthquake ground motion near the source (Dissertation). Harbin: Institute of engineering mechanics, China earthquake administration.
Huo, J. R., Hu, Y. X., and Feng, Q. M. (1991). Study on envelope function of acceleration time history. Earthq. Eng. Eng. Vib. 11 (1), 1–12.
Joyner, W. B., and Boore, D. M. (1981). Peak horizontal acceleration and velocity from strong-motion records including records from the 1979 Imperial Valley, California, earthquake. Bull. Seismol. Soc. Am. 71 (6), 2011–2038. doi:10.1785/bssa0710062011
Li, L., Lok, B. A., Li, G., and Gao, F. W. (2018). Characteristics of temporal-spatial distribution of the aftershocks of the 2008 Ms8.0 Wenchuan earthquake. Chin. J. Geophys. 61 (5), 1797–1805. doi:10.6038/cjg2018M0129
Li, X. J., Liu, L., Wang, Y. S., and Yu, T. (2010). Analysis of horizontal strong-motion attenuation in the great 2008 Wenchuan earthquake. Bull. Seismol. Soc. Am. 100 (5B), 2440–2449. doi:10.1785/0120090245
Ma, Q. (2008). Study and application on earthquake early warning, harbin, institute of engineering mechanics. Harbin: China Earthquake Administration.
McGarr, A. (1984). Scaling of ground motion parameters, state of stress, and focal depth. J. Geophys. Res. Solid earth 89 (B8), 6969–6979. doi:10.1029/jb089ib08p06969
National standard of the people’s republic of china (2010). Code for seismic design of buildings, GB50011-2010
Ohsaki, Y., Watabe, M., and Tohdo, M. (1980). Analyses on seismic ground motion parameters including vertical components. Proc. Seventh World Conf. Earthq. Eng. 2, 97–104.
Palo, M., Scotto, U. F., Picozzi, M., and Festa, G. (2024). An enhanced catalog of repeating earthquakes on the 1980 irpinia fault system, southern Italy. Geosciences 14 (8). doi:10.3390/geosciences14010008
Shen, Z. K., Sun, J. B., Zhang, P. Z., Wan, Y., Wang, M., Bürgmann, R., et al. (2009). Slip maxima at fault junctions and rupturing of barriers during the 2008 Wenchuan earthquake. Nat. Geosci. 2 (10), 718–724. doi:10.1038/ngeo636
Shinozuka, M., and Sato, Y. (1967). Simulation of nonstationary random process. J. Eng. Mech. Div. 93 (1), 11–40. doi:10.1061/jmcea3.0000822
Sleeman, R., and Eck, T. V. (1999). Robust automatic P-phase picking: an on-line implementation in the analysis of broadband seismogram recordings. Phys. Earth Planet. Inter. 113, 65–275. doi:10.1016/S0031-9201(99)00007-2
Spudich, P., Joyner, W. B., Lindh, A. G., Boore, D. M., Margaris, B. M., and Fletcher, J. B. (1999). SEA99: a revised ground motion prediction relation for use in extensional tectonic regimes. Bull. Seismol. Soc. Am. 89 (5), 1156–1170. doi:10.1785/bssa0890051156
Storn, R., and Price, K. (1997). Differential evolution-a simple and efficient heuristic for global optimization over continuous spaces. J. Glob. Optim. 11 (4), 341–359. doi:10.1023/a:1008202821328
Wang, S. P. (2022). Study on ground motion attenuation relationship for the northeastern margin of qinghai-tibet plateau based on NGA model. Lanzhou: Master’s Degree of Lanzhou Institute of Seismology. Thesis for.
Wang, S. P., Lu, Y. X., Shi, Y. C., Tian, X. F., He, H. L., Liu, B., et al. (2023). Ground motion attenuation model in the northeast margin of Qinghai-Tiber Plateau region and its application in the evaluation of seismic impact field. J. Xian Univ. Arch. and. Tech.Natural Sci. Ed. 55 (2), 301–309. doi:10.15986/j.1006-7930.2023.02.020
Xiao, L. Y. (2011). Study on the attenuation relationships of horizontal ground motion parameters near the sourse of rock site. Beijing: Institute of Geophysics of China Earthquake Administration.
Xu, Y. Y., and Zhang, Y. (2023). Analysis of the reasons why surface wave magnitude is higher than moment magnitude in the mainland of China from the perspective of source rupture parameters. Acta Sci. Nat. Univ. Pekin. 59 (3), 407–414. doi:10.13209/j.0479-8023.2023.020
Yang, Y. H., Zhang, X. M., Hua, X., Su, L. N., Feng, C. J., Qiu, Y. R., et al. (2021). Segmentation characteristics of the Longmenshan fault-Constrained from dense focal mechanism data. Chin. J. Geophys 64 (4), 1181–1205. doi:10.6038/cjg2021O0286
Yin, D., Chen, Y., Yang, Y., Cheng, Y., and Zhang, C. (2023). Research on interference signal recognition in P wave pickup and magnitude estimation. Geotechnical Geol. Eng. 42, 1835–1848. doi:10.1007/s10706-023-02648-6
Yin, D. Y. (2017). “Research on the wenchuan earthquake rupture process of joint inversion and high-frequency radiation,” in Institute of engineering mechanics, China earthquake administration. Harbin.
Yin, D. Y., Dong, Y., Liu, Q. F., Chen, Y., and She, Y. (2020). Estimation of high-frequency seismic wave radiation on fault plane of 2008 Wenchuan earthquake based on improved empirical Green’s function. Nat. Hazards 104 (1), 397–412. doi:10.1007/s11069-020-04174-7
Yin, D. Y., Dong, Y., Liu, Q. F., Wu, J., Sun, H., Cheng, Y., et al. (2021). Estimating the areas of high-frequency wave radiation on the fault plane of the 2008 Mw7.9 wenchuan, China, earthquake by envelope inversion. Bull. Seismol. Soc. Am. 111 (5B), 975–988. doi:10.1785/0120200186
Yu, T. (2012). Empirical estimate model for ground motion of Wenchuan earthquake zone, Harbin. Harbin: Institute of Engineering Mechanics, China Earthquake Administration.
Zhu, J., Li, S., Ma, Q., He, B., and Song, J. (2022). Support vector machine-based rapid magnitude estimation using transfer learning for the sichuan-yunnan region, China. Bull. Seismol. Soc. Am. 112 (2), 894–904. doi:10.1785/0120210232
Keywords: Wenchuan earthquake, aftershocks, acceleration envelope, attenuation relationship, focal mechanism
Citation: Yin D (2024) Study on the attenuation relationship of the acceleration envelope parameters for the Wenchuan earthquake aftershocks. Front. Earth Sci. 12:1388674. doi: 10.3389/feart.2024.1388674
Received: 20 February 2024; Accepted: 18 September 2024;
Published: 02 October 2024.
Edited by:
Paolo Capuano, University of Salerno, ItalyReviewed by:
Mauro Palo, University of Naples Federico II, ItalyYong Zheng, China University of Geosciences Wuhan, China
Copyright © 2024 Yin. This is an open-access article distributed under the terms of the Creative Commons Attribution License (CC BY). The use, distribution or reproduction in other forums is permitted, provided the original author(s) and the copyright owner(s) are credited and that the original publication in this journal is cited, in accordance with accepted academic practice. No use, distribution or reproduction is permitted which does not comply with these terms.
*Correspondence: Deyu Yin, eWluZGV5dWllbUAxNjMuY29t