 Dongdong Pang
 Xiaoyi Chen
 Mengliang Gao
 Chenxi Miao
 Wei Zhang
- 1College of Civil Engineering, Taiyuan University of Technology, Taiyuan, China
- 2Shangqiu Institute of Technology, Shangqiu, China
- 3Shanxi Transportation Technology Research and Development Co., Ltd., Taiyuan, China
- 4Shanxi Key Laboratory of Civil Engineering Disaster Prevention and Control, Taiyuan, China
- 5Beijing Urban Construction Design and Development Group Co., Ltd., Beijing, China
Shored mechanically stabilized earth (SMSE) walls have been increasingly applied in the projects of widening existing roads or new construction of roads on slopes because of their good carbon emission reduction and mechanical performance. In this paper, a scaled-down model test of SMSE wall with shoring wall batter of 1H:2V was conducted to study the load-bearing behavior of SMSE wall under this terrain condition, and the results including wall deformations, earth pressures, reinforcement strains, and potential failure surface were analyzed. The results show that although the backfill near the shoring wall was not directly compressed by the load, it still slipped along the backfill-shoring wall interface. The loading created a tensile pressure zone in the upper part of the backfill-shoring wall interface, which may lead to tensile cracking. The uppermost layer of geogrid was more prone to sliding, while the tensile deformation was smaller, and its strain value was overall smaller than the strain value of the geogrid below it. As the load increases, the potential failure surface changed from a Rankine failure surface to a bilinear potential failure surface. The potential failure surface did not pass through the heel of the SMSE wall under large loads.
1 Introduction
With the development of the economy, the engineering control requirements for transportation infrastructure continue to increase (Lianpeng et al., 2021; Anvar, 2023; Boyang et al., 2023; Jia et al., 2024; Lu et al., 2024). As a flexible support structure with excellent force and deformation properties, low carbon emissions, simple construction and superior seismic performance, reinforced earth retaining wall have been extensively adopted in road embankment support (Miao et al., 2014; Yang et al., 2014; Costa et al., 2016; Fei ZHANG et al., 2021; Ren et al., 2022a; Chengzhi et al., 2023; Saalim and Samsunnahar, 2023). However, in the project of widening existing roads or new construction of roads on slopes in mountainous areas, due to space constraints, it is difficult for traditional reinforced soil retaining walls to meet the requirements of reinforcement length stipulated by the relevant specifications (0.7H, where H is the height of the wall) (Berg et al., 2009; BSI. BS 8006-1:, 2010, 2010). Therefore, shored mechanically stabilized earth (SMSE) walls have been developed for use in such projects (Lee et al., 2010; Yang et al., 2011; Xu et al., 2016a; Ren et al., 2022b). More information on the construction of SMES walls can be found in the design guidelines of the Federal Highway Administration (FHWA) (Morrison et al., 2006).
Due to the existence of existing slopes/structures (hereafter referred to as shoring wall) and a smaller width-to-height ratio (the ratio of the length of reinforcement to the height of the wall) than that of a conventional reinforced earth retaining wall, the SMES wall exhibits different mechanical behaviors. Lawson and Yee (2005) concluded from theoretical analysis that due to the limited space in the backfill zone, the horizontal earth pressure coefficient in the backfill zone is larger than that of a conventional horizontal earth pressure coefficient. And he found that the failure surface of SMSE walls were the “single-line” type, but the failure surface inclination was greater than that of the Rankine failure surface. Woodruff (2003); Lee et al. (2010) observed through centrifuge model tests that the failure surfaces of the SMSE walls were the “double-line” type. However, Yang et al. (2011) found that the failure surface of the SMSE walls are related to the width-to-height ratio. With the increase of the width-to-height ratio, the failure surface of the SMSE walls were transformed from “double-line” type to the “single-line” type. And at low width-to-height ratios, the failure surface formed partially through the reinforced soil and partially along the interface between the reinforced soil and the shoring wall. In addition, Yang et al. (2008) used the finite element program Plaxis to simulate the centrifuge test of the SMSE wall, and found that there was a zero pressure zone at the upper part of the interface between the backfill zone and the shoring wall, and that with the narrowing of the backfill zone, the zero pressure zone was extended to the lower part of the retaining wall. Xu et al. (2016b) found through centrifugal model tests of SMSE wall that there was only contact stress between reinforced soil and shoring wall. As the wall height or top load increased, the SMSE wall deformed significantly and was prone to collapse.
To enhance the stability of SMSE walls, it is common to connect the reinforcement to the shoring walls or to extend the length of the upper reinforcement of the retaining walls. Xu et al. (2016c) concluded that connecting the reinforcement to the shoring walls can compensate for the lack of reinforcement length, reduce the deformation, and improve the overall stability. Ren et al. (2022b) investigated the load-bearing response of SMSE walls with different types of connections and relative densities of fillers, and demonstrated that increasing the relative density and adopting sandwich-type reinforcement arrangement can reduce the deformation of the retaining walls. However, Morrison et al. (2006) concluded that the benefits of connecting the reinforcement to the shoring walls are minimal and have little effect on retaining wall deformation and stability. And he suggested extending the two layers of geogrids at the top of the SMSE wall to 0.6H to enhance the stability of the SMSE wall.
In the current studies of SMSE walls, the shoring walls are often vertical or minimally sloped, so the reinforcement length of the SMSE wall bottom and top is basically the same, both of which are relatively shorter. However, in actual projects, a large number of shoring walls are gently sloping, and the length of the two layers of reinforcement at the top of the SMSE walls constructed in this terrain is longer than 0.6 H. The stability and mechanical behavior of the SMSE walls in this terrain condition (The slope of the shoring wall is relatively gentle) are still not clear. Therefore, in this paper, a scaled-down model test of SMSE wall with shoring wall batter of 1H:2V (horizontal: vertical) was performed to investigate the load bearing behaviors of the SMSE wall under this terrain condition. At this batter (1H:2V), the length of the two layers of reinforcement at the top of the SMSE wall is greater than 0.6 H even though the base width of the SMSE wall reinforcement section is 0.3 H (the minimum base width value recommended by the code) (Morrison et al., 2006). The test results including the wall deformation, soil pressure, reinforcement strain, and potential fracture surfaces are analyzed. The results of this study can provide insights into the application of SMSE walls in this terrain condition and the need for re-strengthening.
2 Experimental program
2.1 Model configuration
The SMSE wall model has a height of H = 1.4 m and are designed for 1/5-scale (scaling factor λ = 5) model. The SMSE wall height corresponds to a height of 7 m for the prototype structure, which is a typical height for field SMSE wall (Morrison et al., 2006; Ren et al., 2022b). Based on the identified length scaling factor λ=5 and the similarity theory (Yuan, 1998), the similarity relationships for other physical quantities are derived as shown in Table 1, which has been adopted in many previous 1-g reduced-scale model tests of reinforced earth structure (Xiao et al., 2016; Yoo et al., 2022; Deng et al., 2023).
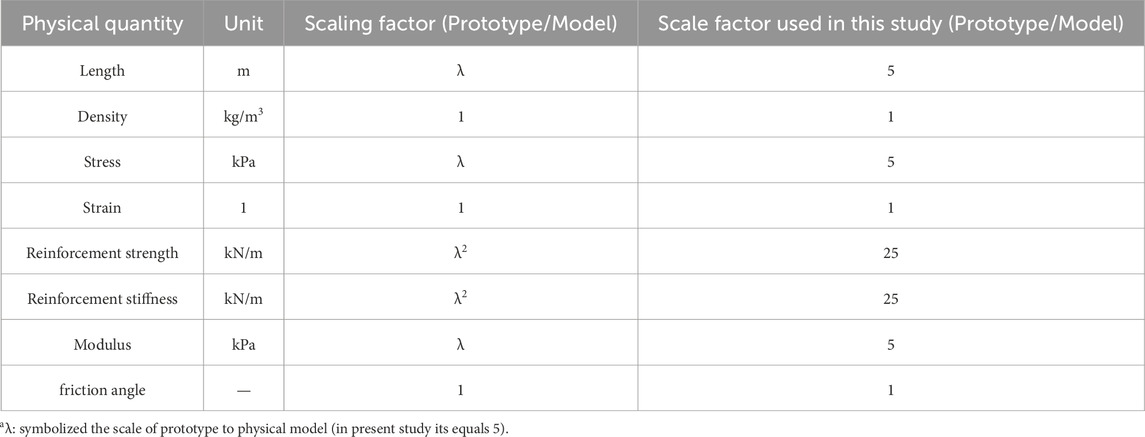
Table 1. Similitude relationships for 1-g reduced-scale model test.
The SMSE wall model structure and dimensions is shown in Figure 1. The panel was placed above the concrete footing at an angle of 4° to the plumb plane, which is within the typical range of field SMSE wall panel inclination (Morrison et al., 2006; Lee et al., 2010; Ren et al., 2022b). The vertical spacing of the reinforcements is 0.1 m, which corresponds to a typical vertical spacing of 0.5 m for the prototype SMSE wall. This vertical spacing (0.5 m) complies with the maximum recommended vertical reinforcements spacing of 0.6 m for SMSE walls (Morrison et al., 2006). And their length is determined by the distance between the panel and the shoring wall at a given level. A base width of 0.4 m for the reinforced section is selected, which is closed to the minimum required reinforcement length of 0.3 H (Morrison et al., 2006). The shoring wall is constructed at a batter of 1H:2V (horizontal: vertical) behind the reinforced section. The reinforcement is not connected to the shoring wall.
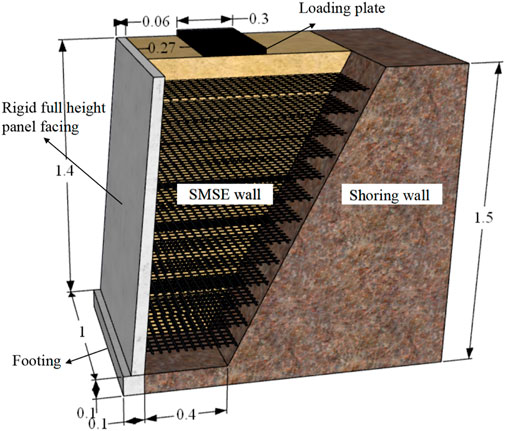
Figure 1. SMSE wall model and dimensions (unit: m).
The SMSE wall model is constructed in a steel model box with inner dimensions of 1.6 m × 1.0 m × 1.6 m (length × width × height). Loading of the model is accomplished by a loading system that precisely controls the magnitude of the applied load. During the test, the load is transferred to the SMSE wall through a loading plate, which is made of 10 mm thick steel plate welded together. The model box and loading system are shown in Figure 2. Tempered glass was assembled on one side of the model box to dynamically monitor the deformation and damage behavior of the model. The sidewalls of the model box and the outside of the bottom plate were set with channel steel skeleton, and no significant deformation of the model box was observed in the range of loading amplitude in this test. To reduce the friction between the sidewalls of the model box and the filling material and to fulfill the requirement of plane strain, the internal sidewalls of the model box were coated with PTFE film.

Figure 2. Model box and loading system.
2.2 Model materials
2.2.1 Shoring wall
In this test, the shoring wall is primarily a topographical construct and there is no requirement for its material to be similar to that of the prototype structure. The shoring wall model in this test was made of river sand, gypsum powder, and water mixed uniformly by the mass ratio of 8.5:1.5:1.3, and the density of the mixed material is 2.06 g/cm³. The gypsum retarder of 6‰ mass of water was incorporated into the mixture, which ensured that the mixture would not undergo incipient coagulation during the shoring wall shaping process. The measured uniaxial compressive strength of the mixture after hardening is 919.8 kPa.
2.2.2 Backfill material
In this test, river sand with water content of 0.3% was used as backfill soil. The maximum particle size of sandy soil in this experiment is 5 mm, and the grain size distribution of river sand is shown in Figure 3. Its uniformity coefficient (Cu) and coefficient of curvature (Cc) are 4.78 and 0.80, respectively. The maximum and minimum dry densities of sandy soil are 1.96 g/cm³ and 1.44 g/cm³, respectively. And the dry density was controlled at 1.764 g/cm³ (70% relative density) during filling, which has been widely used in current reinforced soil structure model tests (Jun et al., 2022; Deng et al., 2023). Based on the triaxial consolidated drained shear test and interpretation of the linear Mohr-Coulomb failure envelope, the internal friction angle of the sandy soil at this density is 45.3° assuming zero cohesion (Figure 4).
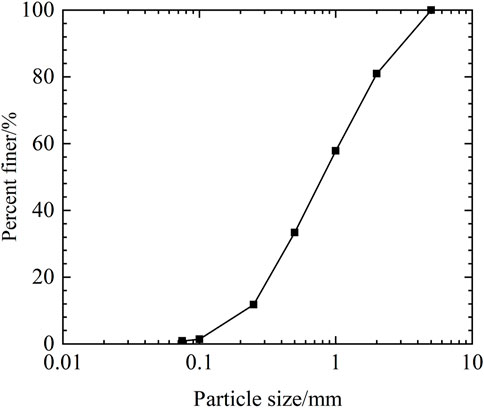
Figure 3. Grain size distribution of the backfill soil.
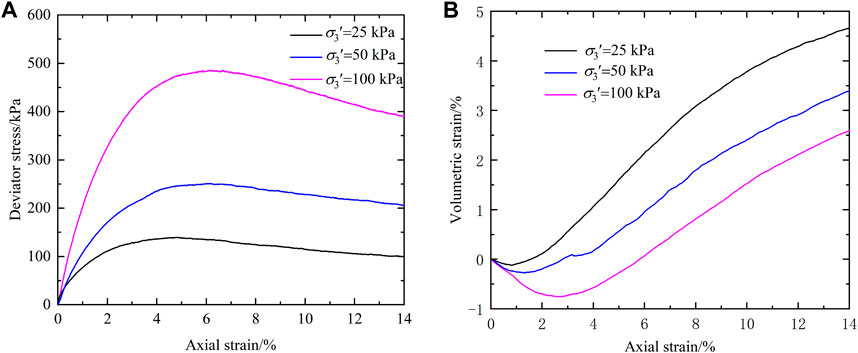
Figure 4. Triaxial compression test results: (A) deviator stress versus axial strain; (B) volumetric strain versus axial strain.
2.2.3 Reinforcement
Reinforcement adopted glass fiber bi-directional geogrid with thickness of 0.9 mm and mesh size of 40 mm×40 mm. The ultimate tensile strength is 6 kN/m and the ultimate tensile strain is 9.5% as measured by the single-rib tensile test (Figure 5). The tensile stiffness corresponding to 2% and 5% elongations of the geogrids are 100 kN/m and 79.4 kN/m, respectively, which correspond to 2,500 kN/m and 1985 kN/m for the prototype geogrids according to the scaling factor in this study (see Table 1), which are in the typical range of geogrid used for MSE walls in the field (Liu et al., 2017; Xu et al., 2021).
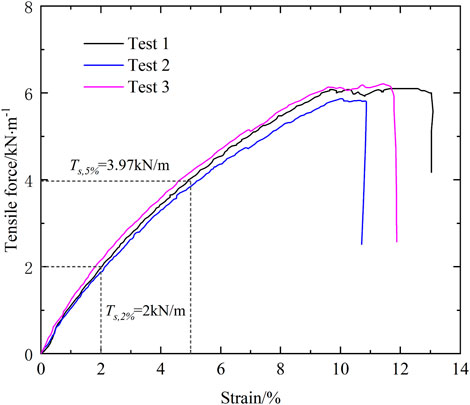
Figure 5. Single rib tensile tests for geogrid.
2.2.4 Footing and panel
The footing and panel both were cast from C30 concrete. The footing is a solid strip rectangle with dimensions of 100 mm × 100 mm × 1,000 mm.
The dimensions of the panel and the finished model are presented in Figure 6. The interior of the panels was equipped with a reinforcing mesh made of 8 mm diameter steel bars. A row of L-shaped hooks for the mechanical connection of the panels to the geogrid was arranged at intervals of 100 mm in the height direction. There are five hooks in each row, with a lateral distance of 200 mm, and the distance of the hooks on both the left and right sides from the edge of the corresponding side panel is 90 mm.
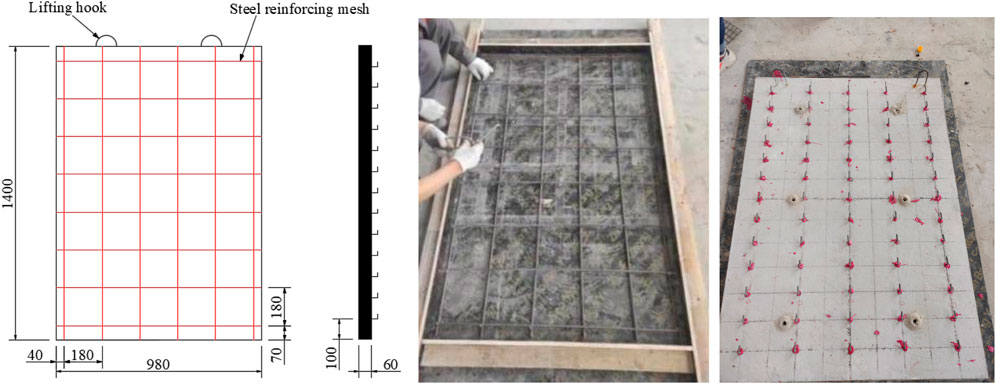
Figure 6. Panel size and panel actual picture (unit: mm).
2.3 Test instrumentation
In this test, linear variable differential transformers (LVDT), pressure cells, and strain gauges were adopted to monitor the wall top settlement, the facing displacement, the earth pressure, and the tensile strain of the geogrid, respectively. The data monitored by each component was collected via the XL2101GE40 static data collector. Figure 7 shows the actual picture of each monitoring component and the data collector. Figure 7A shows the LVDT with a measuring range of −50 mm–50 mm and a test accuracy of 0.01 mm; Figure 7B shows the pressure cells with a diameter of 16 mm, a measuring range of 0 kPa–1,000 kPa, and an accuracy of 0.5% FS; Figure 7C shows the strain gauges patch with a sensitivity coefficient of 2.22% ± 1% and a resistance value of 120.1 ± 0.1Ω; Figure 7D shows the XL2101GE40 static data collector, which has a total of 40 channels and can simultaneously collect multiple types of data such as earth pressure, strain, displacement, etc. In this experiment, two identical data collector of this type were used.
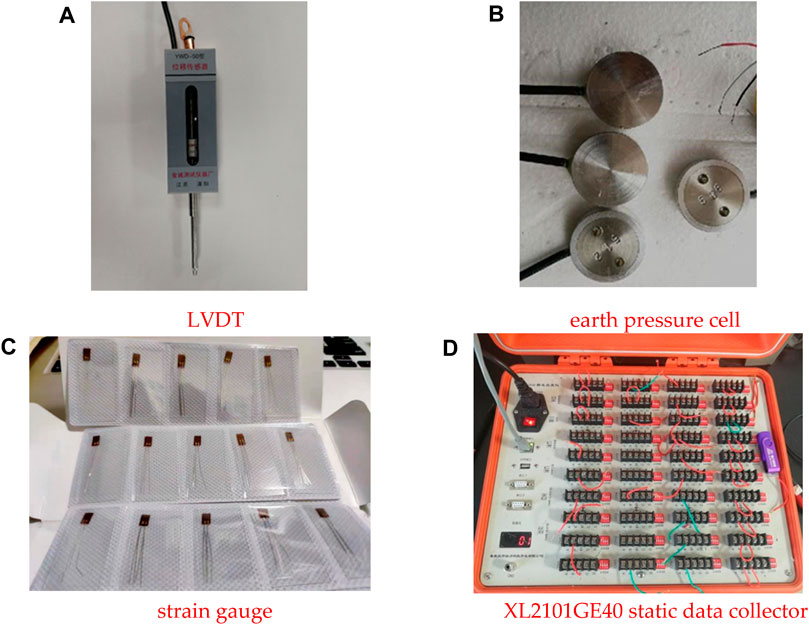
Figure 7. Physical pictures of LTVD, earth pressure cell, strain gauge and XL2101GE40 static data collector.
The layout of instrumentation of the model are shown in Figure 8. All sensors were installed on the centerline section in the out-of-plane direction of the model. The earth pressure cell P1 is 20 mm away from the panel, and the lateral spacing of P1-P4 is 130 mm. The earth pressure cells (P5-P9) at the backfill-shoring wall interface were placed close to the shoring wall, with the same inclination as the shoring wall. Thel earth pressure cells (P10-P14) behind the panels are 20 mm away from the panels. Thel earth pressure cells (P15-P18) underneath the loading plate are 420 mm away from the panel. Strain gauges were attached to the 1st, 4th, 7th, 10th and 13th layers of geogrids (Geogrid layers are numbered from bottom to top). The spacing between the first strain gauge and the panel in each layer of the geogrid is 60 mm, and the horizontal spacing of each strain gauge is 120 mm.
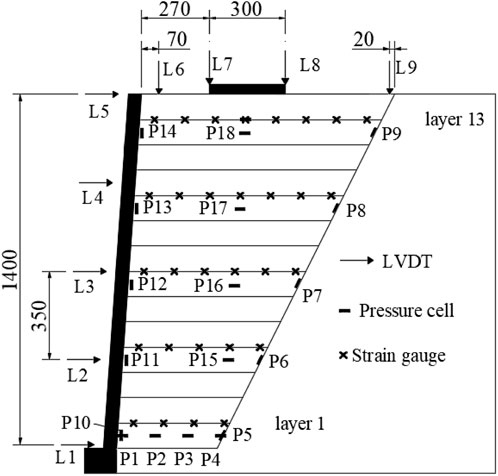
Figure 8. Instrumentation layout (unit: mm).
2.4 Model preparation
The main procedures for model preparation are as follows.
(1) Placement of footing and panel, the footing was fixed by wooden cubes, and the outer side of the panel was limited by wires and wooden cubes.
(2) Fill the shoring wall in layers, the thickness of each layer is 50 mm. And the slope of the shoring wall was precisely controlled by the method of overfilling first and then cutting the slope.
(3) Fill the sandy soil of backfill area in layers according to the determined density, and the thickness of each layer is 50 mm. Geogrids and panel were mechanically connected: The cross ribs of the mesh at the end of the geogrids were linked to the steel bars through ties, and the steel bars were placed on the panel hooks, which can ensure the reliability of the mechanical connection and at the same time make the tension of the reinforcement being transferred uniformly to the wall, as shown in Figure 9.
(4) Remove the wire and wooden cubes holding the panel. The finished test model is presented in Figure 10.
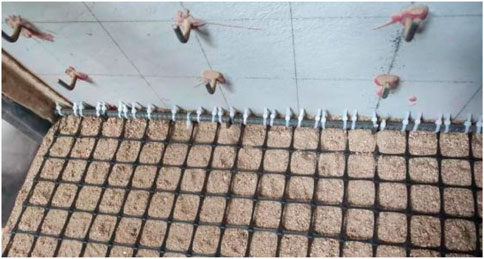
Figure 9. Mechanical connection between geogrids and panel.
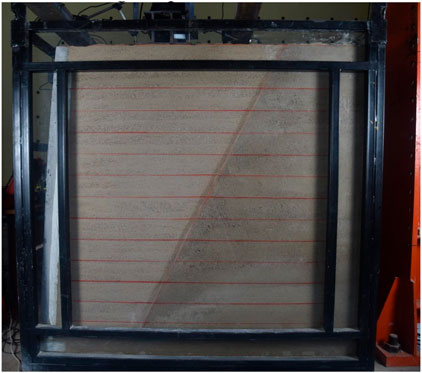
Figure 10. SMSE wall model.
2.5 Loading scheme
In this test, a hydraulic servo actuator was used to apply a graded loading to the top bar loading plate of the wall. the load increment ∆p is 20 kPa for each level from 0 to 200 kPa, and ∆p is 50 kPa for each level after 200 kPa. The time interval between each level of loading during the test is 30 min to ensure the model to reach the static equilibrium state. When there is a sudden increase in the displacement of the SMSE wall panel or the wall top settlement under a certain level of loading, it is considered that the SMSE walls reach the load-bearing limit and the loading is stopped.
3 Results and discussion
Experimental results including the wall top settlement, facing displacements, vertical and lateral earth pressures, and reinforcement tensile strains for the SMSE wall under different applied vertical stresses are discussed and analyzed. Test results are incremental values with respect to the values after construction.
3.1 Facing displacements
The distribution of horizontal displacements of the facing along the wall height under various levels of loading is illustrated in Figure 11. The horizontal displacement of the facing is linearly distributed along the wall height. The facing displacement is dominated by the rotation around the heel of the wall accompanied by a smaller translational movement. Therefore, the horizontal displacement at the top of the panel is the largest under all levels of loading. Specifically, the top displacement under a 400 kPa load reaches 30.7 mm (2.19% of the wall height), of which the translational displacement is 3.5 mm. Figure 12 shows the curve of horizontal displacement of the top of the facing with load. It can be seen that when the load is less than 350 kPa, the rate of increase of horizontal displacement at the top of the facing with increasing load remains constant, and the rate of increase of displacement increases significantly when the load is in 350–400 kPa.
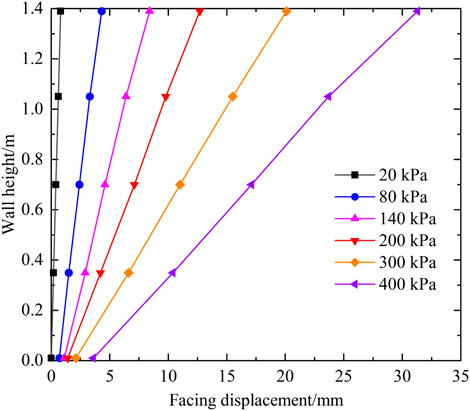
Figure 11. Distribution curve of panel displacement along wall height.
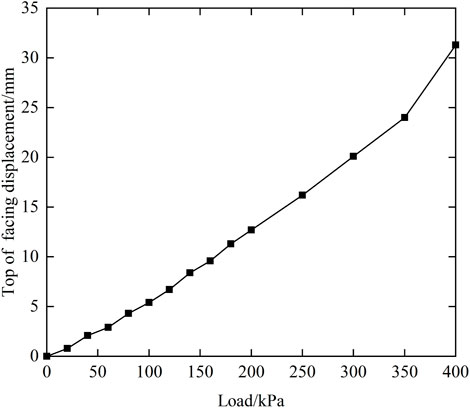
Figure 12. Variation curve of horizontal displacement with loading at the top of the facing.
3.2 Settlement at the top of the SMSE wall
Figure 13 presents the settlement distribution of the top of the wall under various levels of loading. It can be seen that the top of the wall under the load produces different degrees of settlement at various locations, which increases with the increase of the additional load. Among them, the settlement below the loading plate is larger, and the settlement on both sides of the loading plate is not uniform. The settlement difference increases with increasing load. The backfill near the panel and the shoring wall is not directly extruded by the load, so the settlement is small compared with that under the loading plate. At the end of the test, the backfill near the panel produces a localized collapse with a width of about 60 mm, as indicated in Figure 14A. From the relationship between localized collapse and the position of L6, it can be seen that L6 can not fully reflect the settlement at that location. Compared with the data measured by L6 (settlement value of 3.6 mm under 400 kPa load), the backfill soil settlement value at this location is larger. The settlement at this location is due to the large horizontal displacement of the panel. The indentations caused by settlement of backfill soil can be observed near the support wall, as shown in Figure 14B. L9 has effectively monitored the settlement value of the backfill soil at this location. Under a load of 400 kPa, the settlement value at this location is 4.9 mm, indicating a slight sliding of backfill soil l along the backfill soil support wall interface.
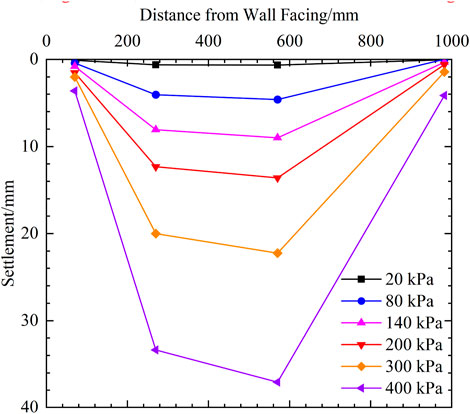
Figure 13. Top settlement distribution of the SMSE wall.
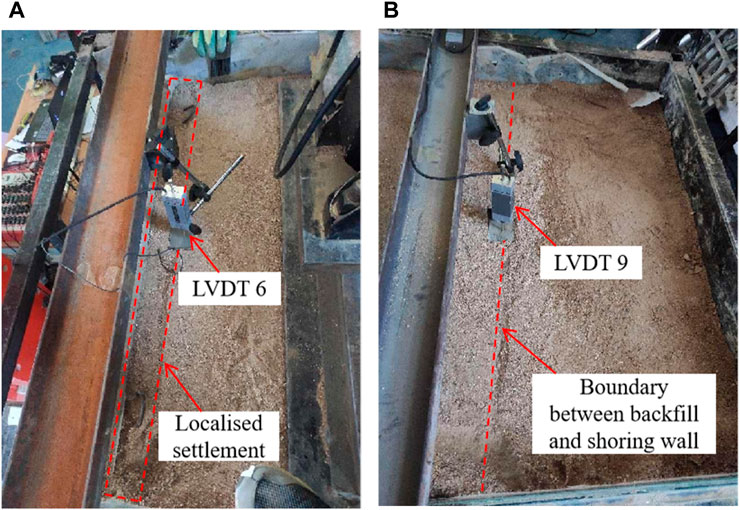
Figure 14. Localized settlement at the top of the wall. (A) Settlement near panel (B) Settlement near shoring wall.
Figure 15 presents the load-settlement curves of the loaded plate, where the settlement is calculated as the mean value of the displacements (L7 and L8) measured at the two edges of the loaded plate. When the load is less than 350 kPa, the settlement increases linearly with the increase of load. However, the settlement increases sharply when the load is increased to 400 kPa, at which time the settlement value is 35 mm, and the corresponding vertical strains are 2.5% for the 1.4 m-high retaining wall. It can be seen from the displacement curve of the facing (Figure 12) and the settlement curve of the top of the wall (Figure 15) that the model reaches its bearing limit when 400 kPa load is applied.
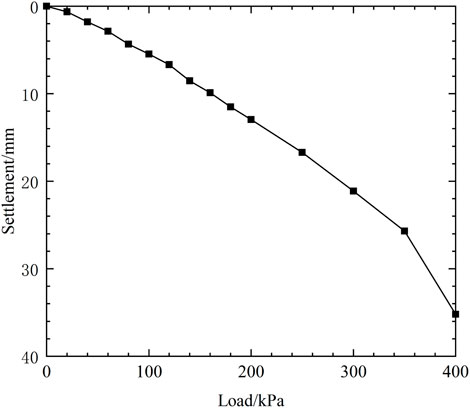
Figure 15. Load-settlement curves for loaded plate.
3.3 Earth pressure
3.3.1 Earth pressure at backfill-shoring wall interface
Figure 16 shows the distribution curve of earth pressure along the wall height at the backfill-shoring wall interface under additional load. It can be seen that the earth pressure generated by the additional load at the interface is prominent at P8 (location see Figure 8), and the earth pressures in the rest locations are relatively small. The earth pressure at P8 is as high as 110 kPa under the load of 400 kPa, which may result in the extruded damage of the shoring wall. The earth pressure at P7 increases dramatically after applying a 400 kPa load, which is due to the large deformation of the SMSE wall and the redistribution of earth pressure within the backfill.
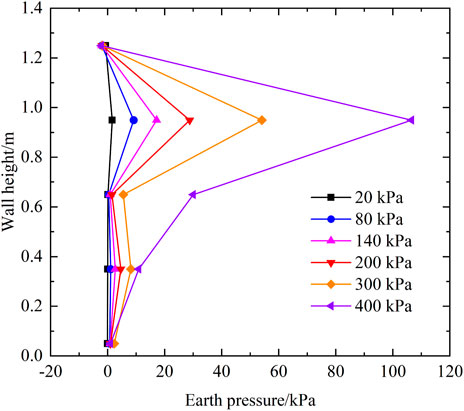
Figure 16. Distribution curve of earth pressure along the wall height at the backfill-shoring wall interface.
Overall, the earth pressure at this interface tends to increase with the increase of additional loads for both condition sets. However, it is worth noting that an anomaly in the earth pressure occurs at P9. After the load was applied, the earth pressure at this point continues to decrease, with a negative value,i.e., the earth pressure there under surcharge load is less than the soil pressure generated by the soil’s self-weight there. A similar phenomenon was also observed in the numerical simulation of the SMSE wall by Yang et al. (Yang et al., 2008). The results demonstrate that there is a tensile pressure zone at the upper part of the backfill-shoring wall interface, which may produce tensile cracks. On the one hand, the tensile pressure zone is generated because the geogrid at this location produce a large pullout displacements under the additional load, and the backfill soil on both sides of the geogrid moves toward the panel under friction. On the other hand, since the lateral displacement of the upper part of the panel is large, the backfill soil of the upper layer slides along the direction of the panel. The test indicates that even if the slope of the shoring wall is small enough to make the upper reinforcement of SMSE wall larger than 0.6 H, it is still difficult to avoid the generation of tensile pressure zone. Therefore, it is still necessary to connect the geogrid with the support cantilever or extend the length of the reinforcement further.
3.3.2 Vertical earth pressure under loading plate
The distribution curve of vertical earth pressure along the depth below the loading plate under additional load is shown in Figure 17. The earth pressure at the depth of 1.35 m presented in the figure is the measured value at P3. It is observed that the earth pressure decreases with the increase of depth, and the earth pressure decreases faster in a certain depth range in the upper part of the retaining wall, and decreases less in the middle and lower parts. In the process of load application, the distribution pattern of earth pressure along the depth of the retaining wall generally remains unchanged.
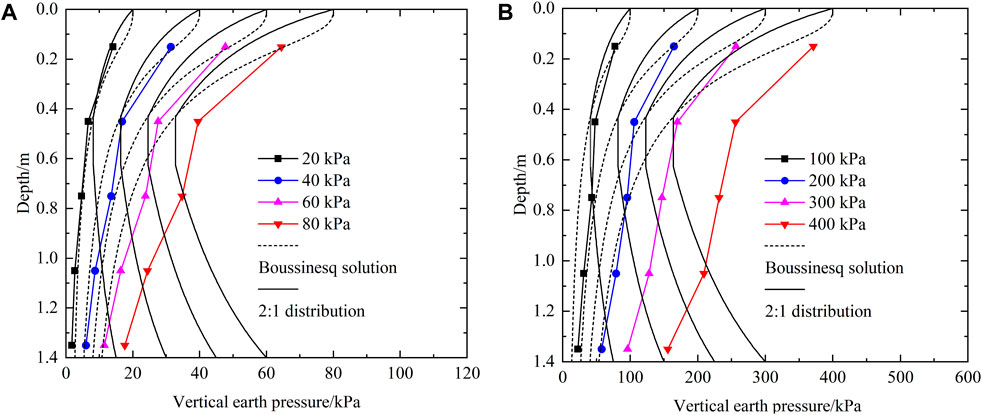
Figure 17. Vertical earth pressure distribution curve along the depth under loading plate. (A) Applied vertical stresses ranging from 20 kPa to 80 kPa; (B) Applied vertical stresses ranging from 100 kPa to 400 kPa.
Figure 17 also shows the calculated incremental vertical earth pressure using both the 2:1 distribution recommended by the FHWA for SMSE wall (Morrison et al., 2006) and the Boussinesq solution recommended by the FHWA for the GRS-IBS (Page, 2018). Comparison of the theoretical calculated and measured earth pressures indicates that the Boussinesq solution is able to accurately predict the earth pressures over the entire depth range for loads no more than 40 kPa. As the load increases, the Boussinesq solution is small compared to the test values except for the uppermost part. This is because the effect of shoring wall on the transfer of vertical earth pressure increases with the increase of load, while the Boussinesq solution does not take into account the effect of shoring wall on earth pressure transfer. The Boussinesq solution correctly predicts the value of additional earth pressure in the upper part of the SMSE wall for the full range of loads. This is because the upper part of the retaining wall is wider and the effect of the shoring wall is smaller. The 2:1 distribution takes into account the effect of the shoring wall on the spread of earth pressure, so it is more accurate in the upper and middle parts of the retaining wall. However, the reduction of the width of the reinforced area in the lower part of the retaining wall fails to increase the measured earth pressure as the theoretically calculated value. Comparison of the measured earth pressures with the Boussinesq solution and the 2:1 distribution shows that the diffusion of additional earth pressures in the deeper part of the retaining wall increases to some extent due to the effect of the shoring wall, but the current 2:1 distribution for the SMSE wall clearly overestimates this effect.
3.3.3 Vertical earth pressure at the bottom of the wall
The variation curve of vertical earth pressure at the bottom of SMSE wall with additional load is illustrated in Figure 18. It is observed that the vertical earth pressure at the bottom of the wall all increases with the increase of additional load. The vertical earth pressures at the bottom of the wall are all nonlinearly distributed along the length of the geogrid, with larger values in the center and decreasing toward the panel and shoring wall. The small value of earth pressure at P4 suggests that an arch may exist near the shoring wall at the bottom of the wall.
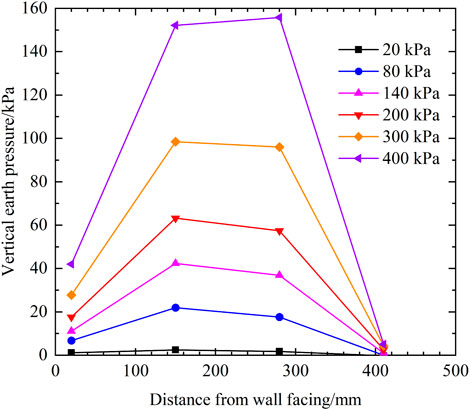
Figure 18. Earth pressure distribution curve at the bottom of the SMSE wall.
In examining the foundation load-bearing capacity of the SMSE wall, the FHWA design guidelines (Morrison et al., 2006) assumes that the additional earth pressures generated by the load are uniformly distributed at the bottom of the wall, and that the uniformly distributed additional earth pressures are calculated using a 2:1 distribution. Figure 19 illustrates the comparison between the tested and theoretical values of earth pressure in the middle of the wall bottom. Comparison of the theoretically calculated values with the measured values reveals that the use of 2:1 distribution calculated values is too conservative in examining the load-bearing capacity of the foundation.
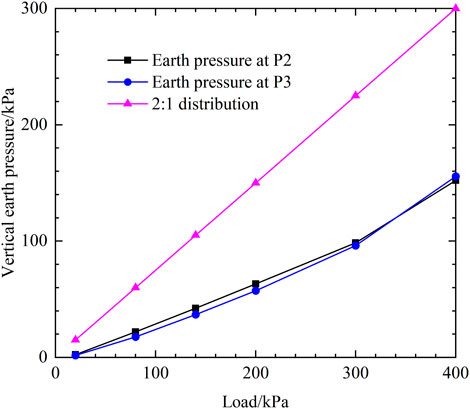
Figure 19. Comparison between the tested and theoretical values of vertical earth pressure.
3.3.4 Horizontal earth pressure behind the panel
Figure 20 presents the distribution curve of horizontal earth pressure along the depth of the SMSE wall behind the panel wall. The horizontal earth pressure increases with the increase of load, and it increases first and then decreases along the depth of the SMSE wall. When the load of 400 kPa was applied, the peak point of horizontal earth pressure shifts downward, which may be related to the inclination of the loading plate. The pattern of horizontal earth pressure distribution wall is generally similar to that measured in Ahmadi’s (Ahmadi and Bezuijen, 2018) full-scall test of conventional rigid-faced reinforced earth retaining wall, but there is a difference at the toe of the wall. Ahmadi et al. measured an increasing trend of horizontal earth pressure at the toe of the wall compared to the upper part of the wall, whereas the present test continues to be smaller along the depth. This is due to the weak restraint at the bottom of the panel. The lateral displacement of the bottom of the panel under load released some of the earth pressure.
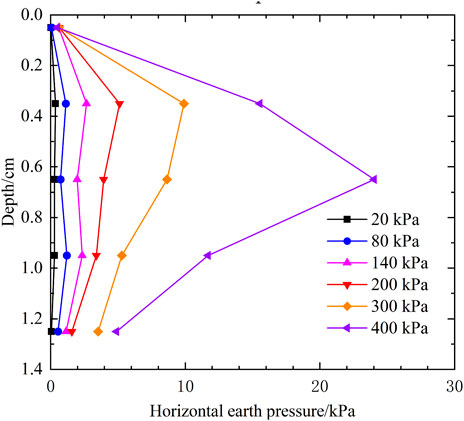
Figure 20. Horizontal earth pressure distribution curve behind the panel.
3.4 Geogrid strains and potential failure surface
Figure 21 illustrates the distribution of geogrid strains along the length of the geogrid. When 300 kPa load was applied, the strain gauges in the upper geogrid failed more, so Figure 21 only shows the strain distribution of geogrids below 300 kPa load. However, at the end of the test, no fracture was observed in all layers of geogrids. The geogrid strain increases with the increase of the additional load. Despite the fact that the displacement is greatest in the upper part of the panel and the additional stress decreases with depth, the maximum geogrid strain does not occur in the uppermost layer of geogrids. The strains in the 10th layer of geogrids under all levels of loading in this test are generally larger than those in the 13th layer. This may be due to the shallower overburden on the upper part of the retaining wall and the insufficient friction between the geogrids and the fill, which makes the geogrids more prone to sliding and less to tensile deformation.
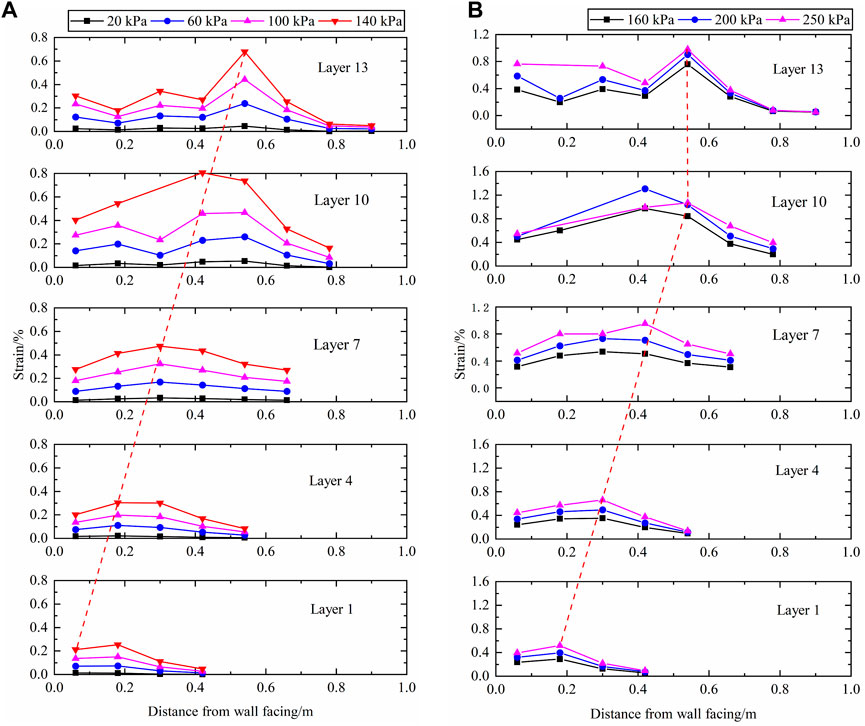
Figure 21. Geogrid strain distribution curve. (A) applied vertical stresses ranging from 20 kPa to 140 kPa; (B) applied vertical stresses ranging from 160 kPa to 250 kPa.
When the 160 kPa load was applied, the strain distribution pattern of geogrid changed: with the increase of load, the strain peak of geogrid became more obvious, and the peak shifted to the direction of in situ slope. A reasonable prediction of the potential failure surface of the retaining wall based on the peak geogrid strain is illustrated by the red connecting line in Figure 21. When the load does not exceed 140 kPa, the potential failure surface of the retaining wall is consistent with the shape of the Rankine failure surface, which coincides with the potential failure surface of the SMSE wall as recommended by the FHWA design guidelines (Morrison et al., 2006). When the load exceeds 140 kPa, the potential failure surface changes to a bilinear potential failure surface. And the potential failure surface is closer to the shoring wall, which means that the “Resistant Zone” decreases, and the grating resistance to pullout is weakened. In addition, from the peak strain of the lowermost layer of geogrids, it is determined that the potential failure surface does not pass through the heel of the wall under large loads.
3.5 Failure mechanism of the model
For SMSE wall with rigid full height panel facing, internal stability failure is mainly manifested by geogrid rupture or pullout (i.e., geogrid sliding in the backfill) (Morrison et al., 2006). At the end of the test (when the model reached its load-bearing limit), no rupture of the geogrid was observed in any of the layers, indicating that the sudden change in panel displacement was due to the insufficient pullout resistance provided by the geogrid. And the pullout resistance of the geogrid is provided by the friction between the geogrid and its surrounding soil beyond the failure surface of the model.
When the load is small (not more than 140 kPa in this test condition), the potential failure surface is consistent with the Rankine failure surface (Figure 21A), which indicates that potential shear failure occurring throughout the entire depth range. With the increase of the load, the failure mechanism is a combination of punching shear failure of the loading plate and internal shear failure of the lower soil body. Therefore, the potential failure surface is characterised by a vertical downward progression (punching shear failure), followed by a failure surface consistent with the Rankine failure surface, which develops downward from the location of the punching shear failure within the soil (Figure 21B). It should be noted that the potential failure surface of the model is closer to the shoring wall for large loads (>140 kPa) (Figure 21), which means that the geogrid beyond the failure surface that can provide pullout resistance becomes shorter. This indicates that as the additional load increases, not only does the tensile force of the panel on the geogrid increase, but the pullout resistance of the geogrid also deteriorates.
In addition, there is a risk that the model slides along the backfill-shoring wall interface. For the SMSE wall studied in this experiment (the slope of the shoring wall is relatively gentle), although the backfill slipped a little along the backfill-shoring wall interface, its sliding displacement is small, and the model dose not collapse before a sudden change in panel displacement. The failure of the model is mainly due to the pullout failure caused by the insufficient length of the geogrid. For the SMSE wall studied in this paper, the geogrid should be connected to the shoring wall to enhance the pullout resistance of the geogrid.
4 Conclusion
In this paper, a scaled-down model test of SMSE wall with shoring wall batter of 1H:2V is performed to study the load-bearing behavior of SMSE walls under this terrain condition, and the results including wall deformations, earth pressures, reinforcement strains, and potential failure surface are analyzed. The following conclusions are drawn:
(1) When the SMSE wall reached its load-bearing limit (400 kPa), the maximum horizontal displacement of the facing and the settlement of the top of the wall are 2.19% and 2.5% of the wall height, respectively. The backfill near the shoring wall, although not directly compressed by the load, also settled to some extent, which indicated that the backfill slip along the interface of the backfill - shoring wall.
(2) A tensile pressure zone exists at the upper part of the backfill-shoring wall interface under surcharge load, i.e., the earth pressure there under surcharge load is less than the earth pressure generated by the soil’s self-weight there, which may lead to tensile cracks.
(3) The vertical earth pressure generated by the additional load below it decays faster in the upper part of the SMSE wall and less in the middle and lower parts of it. The Boussinesq solution accurately predicts the vertical earth pressure generated by the additional load below it when the load is small, and as the load increases, the Boussinesq solution without considering the effect of the shoring wall on earth pressure transfer is small compared to the measured value. The 2:1 distribution considering the effect of shoring wall accurately predicted the vertical earth pressure generated by the additional load in the upper and middle parts of the SMSE wall, but overestimated this effect at the bottom of the retaining wall, and the theoretical value was much larger than the measured value.
(4) Vertical earth pressures at the bottom of the SMSE wall are all nonlinearly distributed along the length of the geogrid, with larger values in the middle part and decreasing toward the panel and the shoring wall. The earth pressure values at the bottom of the shoring wall are extremely low, which suggests that arching may be present at this location. The current 2:1 distribution adopted by FHWA to examine the load-bearing capacity of foundations is overly conservative.
(5) The maximum geogrid strain does not appear in the uppermost layer of the geogrid, which may be because the upper part of the retaining wall is covered with shallow soil, and the friction between the geogrid and the filling is insufficient, so the geogrids are more prone to sliding, and the tensile deformation is less. As the load increases, the potential failure surface changes from a Rankine failure surface to a bilinear potential failure surface. At the same time the potential rupture surface is close to the shoring wall, which implies a weakening of the geogrid’s resistance to pullout. The potential failure surface did not pass through the heel of the wall under large loads.
Data availability statement
The raw data supporting the conclusion of this article will be made available by the authors, without undue reservation.
Author contributions
DP: Project administration, Writing–original draft. XC: Validation, Writing–original draft. MG: Formal Analysis, Writing–original draft. CM: Funding acquisition, Writing–review and editing. WZ: Writing–review and editing.
Funding
The author(s) declare that financial support was received for the research, authorship, and/or publication of this article. This research was supported by the National Natural Science Foundation of China (Nos 52178341; 52278360; 51809191) and Shanxi Province Basic Research Program Project (202303021224001).
Acknowledgments
The authors are appreciative to the external reviewers for their insightful and constructive comments.
Conflict of interest
Authors MG and CM were employed by Shanxi Transportation Technology Research and Development Co., Ltd. Author WZ was employed by Beijing Urban Construction Design and Development Group Co., Ltd.
The remaining authors declare that the research was conducted in the absence of any commercial or financial relationships that could be construed as a potential conflict of interest.
Publisher’s note
All claims expressed in this article are solely those of the authors and do not necessarily represent those of their affiliated organizations, or those of the publisher, the editors and the reviewers. Any product that may be evaluated in this article, or claim that may be made by its manufacturer, is not guaranteed or endorsed by the publisher.
References
Ahmadi, H., and Bezuijen, A. (2018). Full-scale mechanically stabilized earth (MSE) walls under strip footing load. Geotext. Geomembranes 46, 297–311. doi:10.1016/j.geotexmem.2017.12.002
Anvar, C. (2023). A way to determine the positive direction of the shear force on the elemental area. Geohazard Mech. 1, 179–184. doi:10.1016/j.ghm.2023.04.004
Berg, R. R., Christopher, B. R., and Samtani, N. C. (2009). Design and construction of mechanically stabilized earth walls and reinforced soil slopes. Washington, DC, USA: Federal Highway Administration Publication US Department of Transportation.
Boyang, Z., Gang, L., Yingchun, L., and Zhibin, L. (2023). Experimental study on the seepage mutation of natural karst collapse pillar (KCP) fillings over mass outflow. Environ. Sci. Pollut. Res. 30, 110995–111007. doi:10.1007/s11356-023-30230-3
BSI. BS 8006-1: 2010 (2010). Code of practice for strengthened/reinforced soils and other fills. London, UK: British Standards Institution BSI.
Chengzhi, Q., Chunsheng, L. A. I. C., Xiaozhao, L., Xiaolei, Q., and Qu, X. (2023). Preliminary study on the determination of the Weibull modulus of strength distribution in quasi-brittle materials. Geohazard Mech. 1, 103–109. doi:10.1016/j.ghm.2023.05.002
Costa, C. M. L., Zornberg, J. G., de Souza Bueno, B., and Costa, Y. D. J. (2016). Centrifuge evaluation of the time-dependent behavior of geotextile-reinforced soil walls. Geotext. Geomembranes 44, 188–200. doi:10.1016/j.geotexmem.2015.09.001
Deng, J., Zhang, J., Qi, Z., Zheng, Y., and Zheng, J.-j. (2023). Experimental study on the load bearing behavior of geosynthetic reinforced soil bridge abutments on yielding foundation. Geotext. Geomembranes 51, 165–178. doi:10.1016/j.geotexmem.2023.06.003
Fei Zhang, Y.-m.Z., Yang, S.-chuan, and Wang, S.-mao (2021). Emission mitigation analysis of geosynthetic⁃reinforced walls. J. Jilin Univ. Technol. Ed. 51, 631–637. doi:10.13229/j.cnki.jdxbgxb20191141
Jia, Y., Zhang, J., Tong, L., Zheng, J.-J., and Zheng, Y. (2024). Human vulnerability assessment based on bullet motion and cavity expansion model with tissue identification. Geosynth. Int., 1–15. doi:10.1080/10255842.2023.2294263
Jun, Z., Yafei, J., Wenhao, G., Jianbin, Z., Jianming, L., and Yewei, Z. (2022). Experimental study on the load bearing behavior of geosynthetic reinforced soil bridge abutments with different facing conditions. Geotext. Geomembranes 50, 632–643. doi:10.1016/j.geotexmem.2022.03.004
Lawson, C., and Yee, T. (2005). “Reinforced soil retaining walls with constrained reinforced fill zones,” in Proceedings of the slopes and retaining structures under seismic and static conditions (China: Slopes and Retaining Structures Under Seismic and Static Conditions), 1–14.
Lee, Y.-B., Ko, H.-Y., and McCartney, J. (2010). Deformation response of shored MSE walls under surcharge loading in the centrifuge. Geosynth. Int. 17, 389–402. doi:10.1680/gein.2010.17.6.389
Lianpeng, D., Yishan, P., Zhonghua, L., Aiwen, W., Yonghui, X., Feiyu, L., et al. (2021). Quantitative mechanism of roadway rockbursts in deep extra-thick coal seams: theory and case histories. Tunn. Undergr. Space Technol. incorporating Trenchless Technol. Res. 111, 103861. doi:10.1016/j.tust.2021.103861
Liu, Z., Shi, K.-y., and Huang, T.-q. (2017). Field test of static and dynamic response of reinforced earth retaining wall under vehicle load. Hydrogeology Eng. Geol. 44, 91–97. (in chinese). doi:10.16030/j.cnki.issn.1000-3665.2017.04.14
Lu, B., Sheil, B. B., Zhao, W., Jia, P., Bai, Q., and Wang, W. (2024). Laboratory testing of settlement propagation induced by pipe-roof pre-support deformation in sandy soils. Tunn. Undergr. Space Technol. incorporating Trenchless Technol. Res. 146, 105645. doi:10.1016/j.tust.2024.105645
Miao, L., Wang, F., Han, J., and Lv, W. (2014). Benefits of geosynthetic reinforcement in widening of embankments subjected to foundation differential settlement. Geosynth. Int. 21, 321–332. doi:10.1680/gein.14.00019
Morrison, K. F., Harrison, F. E., Collin, J. G., Dodds, A. M., and Arndt, B. (2006). Shored mechanically stabilized earth (SMSE) wall systems design guidelines. Lakewood, CO, USA: US Department of Transportation, Federal Highway Administration. Publication No. FHWA-CFL/TD-06-001.
Page, T. R. D. (2018). Design and construction guidelines for geosynthetic reinforced soil abutments and integrated bridge systems.
Ren, F., Huang, Q., and Chen, J. (2022a). Centrifuge modeling of geosynthetic-reinforced soil retaining walls subjected to the combined effect of earthquakes and rainfall. Geotext. Geomembranes 50, 470–479. doi:10.1016/j.geotexmem.2022.01.005
Ren, F.-f., Xu, H., Ji, Y.-j., Huang, Q.-q., and Tian, X. (2022b). Experimental study on the mechanical behavior of shored mechanically stabilized earth walls for widening existing reinforced embankments. Geotext. Geomembranes 50, 737–750. doi:10.1016/j.geotexmem.2022.03.013
Saalim, S. M., and Samsunnahar, P. (2023). An assessment of earthquake vulnerability by multi-criteria decision-making method. Geohazard Mech. 1, 94–102. doi:10.1016/j.ghm.2022.11.002
Woodruff, R. (2003). Centrifuge modeling for MSE-shoring composite walls (Boulder, CO, USA: Univ. of Colorado). MS Thesis.
Xiao, C., Han, J., and Zhang, Z. (2016). Experimental study on performance of geosynthetic-reinforced soil model walls on rigid foundations subjected to static footing loading. Geotext. Geomembranes 44, 81–94. doi:10.1016/j.geotexmem.2015.06.001
Xu, C., Luo, Y.-s., Chen, H.-s., and Jia, B. (2016a). Effects of interface connections on narrowed mechanically stabilized earth walls. Environ. Earth. Sci. 75, 1411. doi:10.1007/s12665-016-6226-9
Xu, C., Luo, Y.-s., Chen, H.-s., and Jia, B. (2016c). Effects of interface connections on narrowed mechanically stabilized earth walls. Environ. Earth Sci. 75, 1411. doi:10.1007/s12665-016-6226-9
Xu, C., Luo, Y.-s., and Jia, B. (2016b). Effects of connection forms on shored mechanically stabilized earth walls by centrifugal model tests. Chin. J. Geotechnical Eng. 38, 180–186. doi:10.11779/CJGE201601020
Xu, H., Xia, L., and Ren, X. (2021). Experimental study on reinforced retaining wall with wrapped face on high embankmen. J. Highw. Transp. Res. Dev. 38, 70–77. (in chinese). doi:10.3969/j.issn.1002-0268.2021.06.010
Yang, G.-Q., Liu, H., Zhou, Y.-T., and Xiong, B.-L. (2014). Post-construction performance of a two-tiered geogrid reinforced soil wall backfilled with soil-rock mixture. Geotext. Geomembranes 42, 91–97. doi:10.1016/j.geotexmem.2014.01.007
Yang, K., Kniss, K., Zornberg, J., and Wright, S. (2008). “Finite element analyses for centrifuge modeling of narrow MSE walls,” in Proceedings of the Proceedings of First Pan American Geosynthetics Conference, GEOAMERICAS, USA, February 5-8, 2023 (IEEE).
Yang, K.-H., Zornberg, J. G., Hung, W.-Y., and Lawson, C. R. (2011). Location of failure plane and design considerations for narrow geosynthetic reinforced soil wall systems. J. Geoeng. 6, 27–40.
Yoo, C., Tabish, A., Yang, J., Abbas, Q., and Song, J. (2022). Effect of internal drainage on deformation behavior of GRS wall during rainfall. Geosynth. Int. 29, 137–150. doi:10.1680/jgein.21.00015
Keywords: shored mechanically stabilized earth wall, model test, load bearing behavior, potential failure surface, failure mechanism
Citation: Pang D, Chen X, Gao M, Miao C and Zhang W (2024) Experimental study on the load bearing behavior of shored mechanically stabilized earth wall. Front. Earth Sci. 12:1388311. doi: 10.3389/feart.2024.1388311
Received: 19 February 2024; Accepted: 09 April 2024;
Published: 17 May 2024.
Edited by:
Pengjiao Jia, Soochow University, ChinaReviewed by:
Cheng Lyu, Sichuan University, ChinaLei Shi, China University of Mining and Technology, Beijing, China
Shun Yi, Changjiang River Scientific Research Institute (CRSRI), China
Copyright © 2024 Pang, Chen, Gao, Miao and Zhang. This is an open-access article distributed under the terms of the Creative Commons Attribution License (CC BY). The use, distribution or reproduction in other forums is permitted, provided the original author(s) and the copyright owner(s) are credited and that the original publication in this journal is cited, in accordance with accepted academic practice. No use, distribution or reproduction is permitted which does not comply with these terms.
*Correspondence: Chenxi Miao, bWlhb2NoZW54aUB0eXV0LmVkdS5jbg==
†Present address: Wei Zhang, China Railway 15th Bureau Group Urban Construction Design and Research Institute, Wuhan, China