 René Reijer Wijngaard
 Hyoeun Oh
 Sonu Khanal
 Arim Yoon
 Willem Jan van de Berg2
 Soon-Il An
- 1Irreversible Climate Change Research Center, Yonsei University, Seoul, Republic of Korea
- 2Institute for Marine and Atmospheric Research Utrecht, Utrecht University, Utrecht, Netherlands
- 3Korea Institute of Ocean Science & Technology, Busan, Republic of Korea
- 4FutureWater, Wageningen, Netherlands
- 5Ecosystem-Atmosphere Process Laboratory, Department of Atmospheric Sciences, Yonsei University, Seoul, Republic of Korea
- 6Max Planck Institute for Meteorology, Hamburg, Germany
- 7Department of Atmospheric Sciences, Yonsei University, Seoul, Republic of Korea
In recent decades, the existence of a relationship between snow cover on the Tibetan Plateau (TP) and East Asian summer monsoon (EASM) rainfall has been emphasized. According to recently published studies this snow-monsoon relationship experienced a shift after 1990. Although the changing snow-monsoon relationship has been studied, the causes of the interdecadal changes remain unclear. This study assesses the associations of TP spring snow cover with EASM rainfall before and after 1990 and explores what possible mechanisms could be responsible for the interdecadal changes. Correlation and composite analyses were used to assess the strength of the relationship between TP spring snow cover and EASM rainfall and to analyze the atmospheric and land surface patterns associated with high snow cover. The outcomes suggest that the relationship between TP spring snow cover and EASM rainfall changes from partially negative to positive over all regions of the TP from 1968–1990 (P1) to 1991–2019 (P2), implying that more snow cover is associated with less (more) EASM rainfall during P1 (P2). In P1, years with high snow cover are associated with an anomalous cyclone southwest of the TP (positioned over Iran and Pakistan) in spring, which persists into the following summer, partly due to the underlying snow cover. The anomalous cyclone is accompanied by downstream anomalies over East Asia, which form a strong east-west oriented wave pattern and induce a northerly inflow of dry air over East Asia, reducing rainfall over the northern EASM domain. In P2, high snow cover years are associated with an anomalous cyclone over the western TP, which weakens and loses its significance in May-June and summer, partly due to a decline in snow forcing. Southeastward propagation of wave energy in May-June initiates the formation of an anomalous anticyclone over southeastern China and the western North Pacific. Concurrently, a meridional circulation develops over East Asia that enhances the southwesterly moisture inflow, resulting in increased EASM rainfall. The changing snow-monsoon relationship can be linked to different wave train patterns resulting from changes in the background zonal wind and meridional temperature gradients. This research contributes to a better understanding of the changing snow-monsoon relationship.
1 Introduction
The Tibetan Plateau (TP) is, with a mean altitude of over 4,000 m above sea level, the highest plateau that resides on Earth. This region is home for the largest reserves of snow and ice outside the Arctic and Antarctic regions and is therefore also mentioned as the Third Pole (Dyhrenfurth, 1955; Kang et al., 2010; Yao et al., 2012). The snow reserves at the TP play an important role in the regional water cycle. By maintaining the seasonal water availability, snow reserves form an important water supplier for the environment and livelihoods of millions of people in the mountains and surrounding lowlands (Immerzeel et al., 2020; Kraaijenbrink et al., 2021). Further, snow can exert a strong influence on the regional radiation and energy budgets via snow-albedo and snow-hydrological feedbacks. The snow-albedo feedback is usually strongest during winter and spring when snow covers a large area of the TP (Xu and Dirmeyer, 2011). The high surface albedo increases the reflective solar radiation and therefore affects the radiation budgets. Towards summer, the snow-hydrological effect becomes more dominant (Xu and Dirmeyer, 2011). As snow melts, a delayed hydrological impact on soil moisture is initiated, which increases latent heat release at the expense of sensible heat and eventually cools down the land surface and overlying atmosphere (Xu and Dirmeyer, 2011; Moon and Ha, 2019; You et al., 2020). For this reason, snow can affect atmospheric and land surface heating over the TP throughout spring and summer periods, which in turn affects the meridional thermal land-sea contrast and the large-scale atmospheric circulations that are important for the establishment and maintenance of the Asian summer monsoon (Zhao et al., 2007; Ding et al., 2009; Wu G. et al., 2012; Wu et al., 2012 Z.; 2016; Xiao and Duan, 2016; Li et al., 2018; Wang et al., 2018). The influence of TP snow cover on the Asian summer monsoon has already been suggested at the end of the 19th century when Blanford (1884) proposed the existence of a linkage between Himalayan snow cover and Indian summer monsoon rainfall. Since then, many studies have been conducted on the snow-monsoon relationship to understand the linkages between snow cover and the East Asian or South Asian summer monsoon systems (Hahn and Shukla, 1976; Zhang T. et al., 2019; You et al., 2020).
The East Asian summer monsoon (EASM) is one of the independent Asian summer monsoon systems, and is characterized by southwest-to-northeast oriented summer (from June to August) rain bands that stretch from China to the Korean Peninsula and Japan (Yihui and Chan, 2005; Li et al., 2020). Primarily, the EASM is associated with subtropical rain bands (i.e., the Meiyu-Baiu rain bands; Yihui and Chan, 2005) over Central China and Japan lasting from early-mid June to early-mid July, and mid-summer rain bands over northern China and the Korean Peninsula lasting from mid-June to early-mid August (Yihui and Chan, 2005; Oh and Ha, 2015; Chiang et al., 2017; 2020). Its interannual variability is influenced by several boundary conditions in remote regions, such as the El Niño-Southern Oscillation (ENSO) and the Indian Ocean Dipole (IOD) (Ding et al., 2009; Wu Z. et al., 2012; Oh and Ha, 2015; Zhang Y. et al., 2019; Kim et al., 2020), Arctic sea ice (He et al., 2018; Kim et al., 2020), soil moisture (Zhang and Zuo, 2011), and Eurasian snow cover (Yim et al., 2010; Kim et al., 2020; Shen et al., 2020; Xu et al., 2021). Previous research also found the influence of TP snow cover (TPSC) anomalies on EASM rainfall over Central China, Japan, and the Korean Peninsula, which is generally strongest over the western and southern domains of the TP due to the stronger snow persistence in these domains (Zhao et al., 2007; Ding et al., 2009; Wu Z. et al., 2012; Liu et al., 2014; Xiao and Duan, 2016; Wang et al., 2018; Wang et al., 2021 Z.; Zhang Y. et al., 2019; Zhang et al., 2021 C.; Zha and Wu, 2023). For the link between TPSC and EASM rainfall, several potential physical mechanisms have been suggested. For instance, Liu et al. (2014) and Wang et al. (2018) proposed that positive summer snow cover anomalies over the southern TP are associated with meridional overturning circulation changes between the TP and the northern Indian Ocean, and subsequent zonal overturning circulation changes over the tropics that eventually can modulate moisture transport and results in more precipitation over Central China and Japan. Several other studies suggest that positive anomalous spring or summer snow cover over the western and southern TP can be associated with a mid-latitude Rossby wave train that propagates synoptic disturbances from the TP into East Asia along the subtropical westerly jet stream (SWJ), which acts as a waveguide (e.g., Xiao and Duan, 2016; Wang et al., 2018).
The subtropical westerly jet stream (SWJ) plays an important role in the snow climatology of the TP and the interannual variability of the EASM. The TP is located between two maxima of the SWJ: the North Africa-Arabian jet stream (NAAJS) located upstream of the TP and the East Asian jet stream (EAJS) located downstream of the TP (Bao and You, 2019). The SWJ is usually strongest during winter when it is located along the southern TP and delivers significant amounts of snow to the western and partly southern domains of the TP during winter and spring periods (Schiemann et al., 2009; Bookhagen and Burbank, 2010; Lutz et al., 2019). Several studies have indicated that the position and strength of the SWJ are important for the intensity and amount of precipitation that falls over the TP (Schiemann et al., 2009; Filippi et al., 2014; Cannon et al., 2015; Bao and You, 2019; Ahmed et al., 2020). For instance, Schiemann et al. (2009) suggested that spring precipitation is higher (lower) to the north of the TP and lower (higher) over the TP when the SWJ has a northerly (southerly) position. Cannon et al. (2015) indicated that a stronger SWJ with a more northerly position during the late 1980s, 1990s, and early 2000s resulted in heavier precipitation over the western domains of the TP during the winter period, whereas precipitation weakened over the southern part of the TP. Bao and You (2019) indicated that an intense SWJ over the south of the TP, combined with weaker upper-level westerly winds north of the TP, results in more precipitation and deeper snow depths during late winter (February-April), particularly over the western and mid-eastern domains of the TP. Similar outcomes were found as well by Ahmed et al. (2020) with more precipitation in Pakistan (i.e., partly covering western TP) because of stronger jets. Moving towards summer, the SWJ gradually shifts northward to the region just north of the TP and weakens in intensity (Schiemann et al., 2009; Chiang et al., 2017). The northward migration of the SWJ can be linked to the abrupt northward jumps of the monsoonal rain band that characterize the transition between different EASM stages (i.e., Meiyu-Baiu and mid-summer; Chiang et al., 2017). The northward latitudinal migration of the SWJ away from the TP and the associated migration of the monsoonal rainband results in a degradation of the subtropical Meiyu-Baiu rainband and a transition in the rainfall climatology from nearly daily to more sporadic rainfall (Molnar et al., 2010).
Several studies have highlighted that atmospheric circulation patterns and teleconnections have changed after 1990 in association with climate regime shifts that occurred over the Northern Hemisphere around 1990. For instance, the SWJ has been found to have decreased in strength over East Asia since the mid-1990s, whereas the SWJ temporally intensified upstream of the TP (Kwon et al., 2007; Cannon et al., 2015). Further, relationships between EASM and ENSO and between the Indian summer monsoon and ENSO have weakened since 1990 (Kumar et al., 1999; Kwon et al., 2005). Weakening relationships have also been observed between Eurasian snow cover and the Indian summer monsoon (Zhang T. et al., 2019; Pandey et al., 2022). Recently published studies indicated that the relationship between TPSC and rainfall over East Asia has been changing as well after 1990 (Zhang C. et al., 2021; 2022; Wang Z. et al., 2021). For example, Zhang C. et al. (2021) found an increased impact of western TP spring snow cover on subtropical Meiyu rainfall over Central China after 1990. According to the authors, the spring snow cover anomalies after 1990 are associated with cold temperature anomalies and an anomalous upper-level cyclonic system that develops and extends eastwards into East Asia towards summer. The eastward-oriented wave patterns strengthen upper-level westerly winds over East Asia, lower-level convergence, and ascent motion over Central China, which enhances rainfall. Although the changes in the relationship between TPSC and summer rainfall over East Asia around 1990 have been explored (Zhang C. et al., 2021; Wang Z. et al., 2021), the causes of the interdecadal changes are rather unclear.
The main objective of this paper is to investigate the interdecadal changes in the relationship between spring snow cover over the TP and EASM rainfall and what potential physical mechanisms could explain these changes. Compared to previous works on the changing relationship between snow cover over the TP and EASM rainfall around 1990 (Zhang C. et al., 2021; Wang Z. et al., 2021), this study stands out by means of a few novelties. First, this study investigates the changing relationship between EASM rainfall and spring snow cover over five different domains of the Tibetan Plateau and the adjacent Iranian Plateau and surroundings. Second, the EASM rainfall domain in this study covers a larger domain than in previous works, by also considering rainfall over the Korean Peninsula and a large part of Japan. Third, we examine the relative effects of different sea surface temperature signals from the tropics on the snow-monsoon relationship over different seasons. Finally, this study investigates possible mechanisms that could explain the interdecadal changes in the relationship between spring snow cover over the TP and EASM rainfall.
This paper is organized as follows. Section 2 highlights the data and methods used in this study. Section 3 describes the changing relationship between snow cover over the TP and EASM rainfall and explores the potential mechanisms that could be responsible for the changing snow-monsoon relationship. Section 4 discusses the main outcomes of this paper. Finally, Section 5 gives a summary.
2 Data and methods
2.1 Data
Monthly mean snow cover extent data were derived from Northern Hemisphere weekly snow cover extent data that were obtained from the National Snow and Ice Data Center (NSIDC) (https://nsidc.org/data/NSIDC-0046/versions/4; last access: 9 February 2024) (Brodzik and Armstrong, 2013). The original weekly data are currently available from October 1966 till December 2022. For the present analysis, snow cover data for the period 1968–2019 were used. Snow cover data before 1968 were deemed as unreliable due to large deviations in the spring snow cover over the TP and were therefore not used. The weekly snow cover data have been converted and regridded to monthly mean on a 1° x 1° latitude-longitude grid.
Monthly land precipitation and monthly 2 m air temperature data were obtained from the Climatic Research Unit gridded Time Series (CRU TS) v4.04 that are available via the CRU of the University of East Anglia (Harris et al., 2020) (https://crudata.uea.ac.uk/cru/data/hrg/; last access: 9 February 2024). The CRU TS dataset includes observation-based variables on a 0.5° x 0.5° latitude-longitude grid that span 1901–2019. The precipitation sums and 2 m mean air temperature used for the present analysis span the period 1968–2019 and have been regridded to a 1° x 1° latitude-longitude grid.
Monthly reanalysis data were derived from the ERA5 and preliminary ERA5 back-extension (BE) reanalysis datasets that are provided by the Climate Data Store (CDS) of the European Centre for Medium-Range Weather Forecasts (ECMWF) (https://cds.climate.copernicus.eu/; last access: 9 February 2024). We used the preliminary ERA5 BE reanalysis since the final ERA5 reanalysis (released in 2023) was not available yet at the time of the data analysis. The ERA5 and ERA5 BE reanalysis datasets span 1979−present and 1950–1978, respectively, and are available on a 31 km grid and monthly intervals (Hersbach et al., 2020; Bell et al., 2021). For the present analysis, reanalysis data spanning 1968–2019 were used, including the following variables: geopotential height, zonal wind, meridional wind, vertical wind, air temperature, and specific humidity at 27 pressure levels from 1,000 hPa to 100 hPa, and snowfall, 2 m air temperature, and latent heat flux at single (surface) levels. In addition, the vertically integrated moisture divergence, and the vertical integrals of the northward and eastward water vapor fluxes (from the surface to the top of the atmosphere) are used. The monthly means obtained from the ERA5 reanalysis datasets have also been regridded to a 1° x 1° latitude-longitude grid. In addition, monthly sea surface temperature (SST) data on 2° x 2° grids were obtained from the Extended Reconstruction SSTs Version 5 (ERSSTv5) dataset of the US National Oceanic and Atmospheric Administration (Huang et al., 2017a; Huang et al., 2017b) (https://doi.org/10.7289/V5T72FNM). For the present analysis, SSTs spanning 1968–2019 were used to obtain the dominant Indian Ocean SST pattern.
Climate indices that represent remote atmospheric and oceanic modes, such as the Niño indices and the Dipole Mode Index (DMI) are retrieved from the NOAA Earth System Research Laboratories and Physical Sciences Laboratory (PSL) (https://psl.noaa.gov/data/climateindices/list/and https://psl.noaa.gov/gcos_wgsp/Timeseries/; last access: 9 February 2024).
2.2 Methodology
In the present study, the changing relationship between spring snow cover over the TP and EASM rainfall (EASMR) is investigated, where spring refers to March-April-May (MAM) and summer refers to June-July-August (JJA). The EASM domain covers the region between 27°N and 41°N and between 110°E and 140°E (Figure 1). Here, the longitudinal extent is derived from Chiang et al. (2020) and the latitudinal extent is derived from the spatial patterns of the leading empirical orthogonal function (EOF, not shown), which explains 36.2% of the rainfall variance. The derived latitudinal extent is in the range of latitudinal extents used in other studies focusing on EASM (rainfall) (Li et al., 2020; Park et al., 2020).
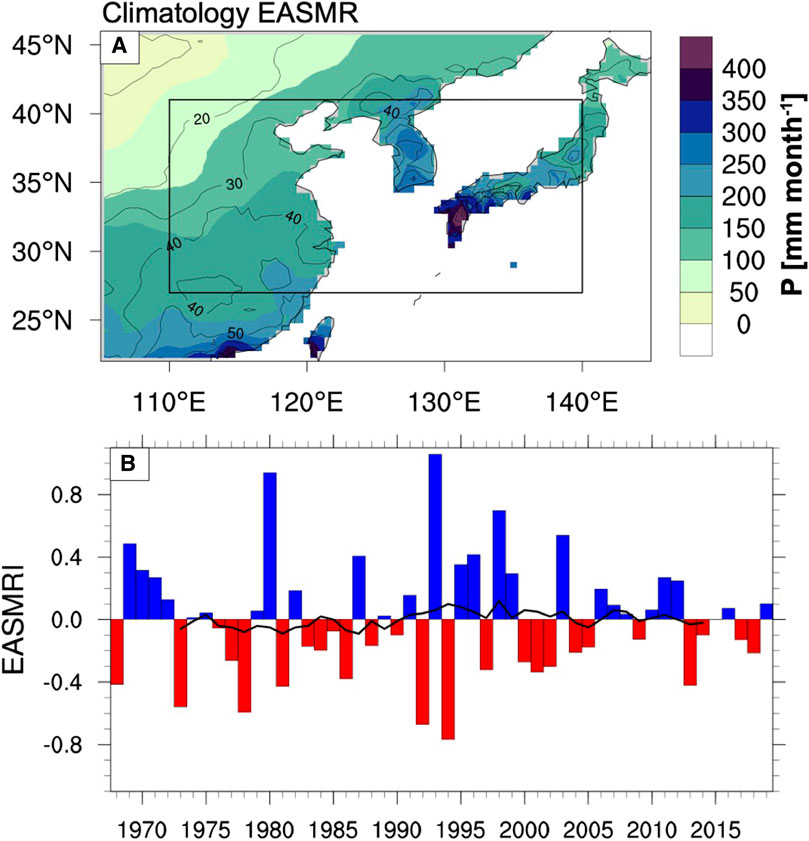
Figure 1. (A) The climatological mean (1968–2019) of EASM rainfall (EASMR) (shading, unit: mm month−1) and its standard deviation (contours, unit: mm month−1). The black box denotes the defined EASM domain. (B) The normalized detrended precipitation index (EASMRI) calculated over the black box area as shown in (A), and its 11-year moving average representing interdecadal variations (black line).
The strength of relations between two variables, such as between EASM rainfall and snow cover over (parts of) the TP, is derived by means of (partial) correlation analyses. Composite analyses are performed to analyze atmospheric and land surface patterns that are associated with high snow cover. To assess the statistical significance of the correlation and composite analyses a Student’s t-test is applied. (Cor)relations with a p-value equal or lower to 0.05 (i.e., at the 95% confidence level) are considered as statistically significant. Since the focus of this study is on the effects of interannual variations in snow cover on EASM rainfall, time series are linearly detrended before the implementation of correlation and composite analyses.
To understand the wave propagation dynamics in relation to snow cover anomalies, the phase-independent wave activity flux (WAF), defined for stationary Rossby waves on a zonally varying mean flow, is analyzed. To this end, the horizontal components of the WAF are calculated, which follow the definitions and equations of Takaya and Nakamura (2001).
2.3 Linear Baroclinic Model (LBM) experiment
Numerical modelling experiments conducted in this study are based on the Linear Baroclinic Model (LBM) (Watanabe and Kimoto, 2000), which is a simplified atmospheric model developed by the Center for Climate System Research (CCSR), University of Tokyo and the National Institute for Environmental Studies (NIES), Japan. LBM can be used to assess the linear response of atmospheric circulations to a prescribed forcing and has recently also been employed to investigate links between TP snow cover and East Asian rainfall (Zhang et al., 2022; Zha and Wu, 2023). In the present work, the linear atmospheric response to a prescribed forcing, i.e., a diabatic heating anomaly, is investigated by time-integration of the model. Time-integration can be applied with a ‘moist’ and ‘dry’ version of LBM. In this study, the ‘dry’ version of LBM is applied, which has commonly been used to assess the linear response to prescribed diabatic heating anomalies (e.g., Duan et al., 2020; Zhang et al., 2022; Zha and Wu, 2023; Zhang et al., 2023). The model has 20 vertical sigma levels, a horizontal T42 (2.81° x 2.81°) resolution, and is integrated over a total of 45 days with a prescribed forcing that persists throughout the model simulation. The model needs about 15 days to reach a steady state, which means the last 30 days of the model simulation can be used for further analysis.
3 Results
3.1 Relationship between TPSC and EASM rainfall
During the summer, most precipitation falls in the southern part of Japan, over the Korean Peninsula, and Central China with heavy monthly precipitation (up to about 400 mm month−1) (Figure 1A). The standard deviation associated with the climatological period (1968–2019) is the largest in the wettest regions with values up to about 100 mm month−1 over southern Japan. To represent the interannual variability in summer precipitation, which refers to wetness/dryness over the defined EASM region, a normalized detrended EASM rainfall index (EASMRI) has been calculated (Figure 1B). The index shows not only decadal variability but also large interannual variability, especially in the 1990s.
We investigated the 15-year moving correlation between EASMR and the detrended snow cover over different regions of the TP and a part of the neighboring Iranian Plateau to show their relationship (Figure 2A) and selected a target region for a more in-depth investigation on the changing snow-monsoon relationship. To this end, we specified five different regions: the eastern Tibetan Plateau (ETP), the western Tibetan Plateau (WTP), the entire TP (i.e., combined ETP and WTP), the Iranian Plateau and its surroundings (IPS), and the combined IPS and WTP regions (IPS-WTP) (see Figures 2B,C for the locations of the ETP, WTP, and IPS). The IPS-WTP region is based on the Iranian desert region as defined by Moon and Ha (2019). As Figure 2A shows, the snow-monsoon relationships are generally weak and insignificant during the 1970s and 1980s, except in the late 1970s when the relationship is significant over the TP and ETP. During the late 1980s, the relationship between EASMR and snow cover experienced a shift from negative to positive over all regions and became significant over the WTP, IPS, and IPS-WTP throughout the 1990s and early 2000s. Since the snow-monsoon relationship became pronounced after 1990, the period 1968–2019 is subdivided into two subperiods: 1968–1990 (P1) and 1991–2019 (P2) in this study. During P1, correlations between EASMR and snow cover are mostly negative and strongest but not significant over the ETP (R=−0.25; p=0.25, Table 1). As shown in Figure 2B the spatial correlation is generally negative over the TP and significant in some areas, particularly over the eastern domain of the TP. During P2, correlations are positive and strongest as well as significant over the IPS-WTP (R=0.48; p<0.01, Table 1). The spatial correlation is generally positive and mostly significant over the IPS and WTP domains (Figure 2C). Over the ETP, the snow-monsoon relationship is significant over a few smaller areas located in the northwestern and northeastern parts of the respective domain. Previous studies have already found similar interdecadal changes in the relationship between rainfall over (parts of) the EASM domain and spring/summer snow cover (Zhang C. et al., 2021; Wang Z. et al., 2021). However, the present study has specified the role of TP snow cover by also taking the role of snow cover over the IPS or combined IPS-WTP domain into consideration, which can help to understand the changing snow-monsoon relationship in more detail. Because of the changing snow-monsoon relationship and its strong significance in the IPS-WTP region after 1990, the focus will be on this region throughout the remainder of this paper.
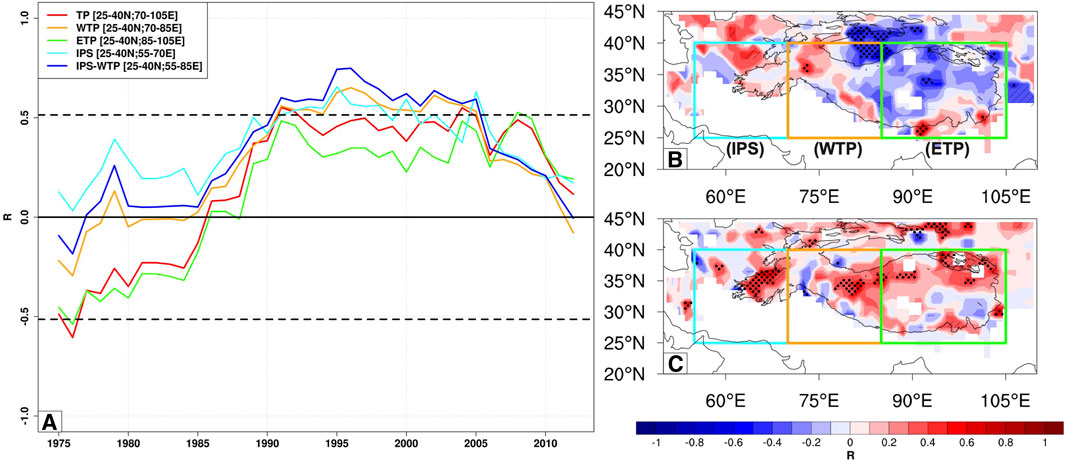
Figure 2. (A) The 15-year moving correlation (R) between EASMR and spring snow cover over the eastern Tibetan Plateau (ETP, 25°–40°N; 85°–105°E; green), the western Tibetan Plateau (WTP, 25°–40°N; 70°–85°E; orange), the entire Tibetan Plateau (TP (ETP + WTP); 25°–40°N, 70°–105°E; red), the Iranian Plateau and its surroundings (IPS, 25°–40°N; 55°–70°E; cyan), and the combined IPS and WTP regions (25°–40°N; 55°–85°E; blue). The black dashed lines represent the R value at p = 0.05. (B) and (C) Spatial distribution of correlation coefficients (R) of TP snow cover with EASMR over the period 1968–1990 (P1) (B) and 1991–2019 (P2) (C). The black outline represents the outlines of the TP and adjacent mountain ranges. The colored boxes denote the areal extents of the ETP (green), WTP (orange), and IPS (cyan). The black dots (dashed lines) represent the correlation coefficient at the 95% (90%) confidence level.
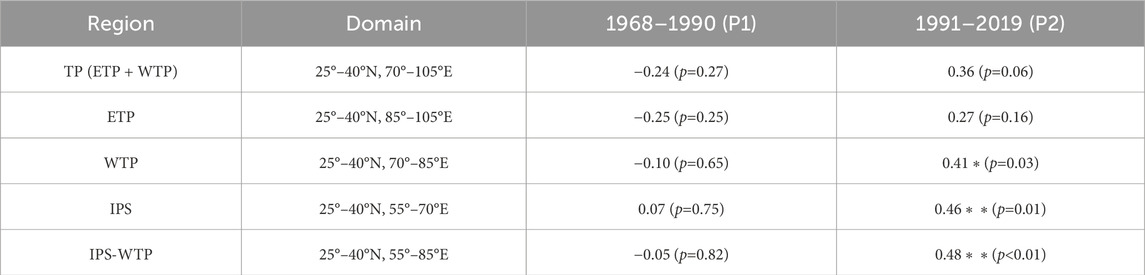
Table 1. Correlation coefficients between EASMR and the snow cover index over different regions of the TP (shown in Figure 2B) during 1968–1990 (P1) and 1991–2019 (P2). The value between the brackets denotes the statistical significance level (p). Values marked with * and ** are significant at the 95% and 99% confidence level, respectively.
The climatological mean snow cover over the IPS-WTP region as presented in Figure 3 shows in general the highest snow cover over the Karakoram Mountains (33°–38°N, 73°–80°E), followed by the western Himalayas (27°–36°N, 72°–85°E) and the Hindu Kush Mountains (31°–37°N, 61°–73°E). The standard deviation in the region is highest over the Hindu Kush, Himalayas, and over the western TP, east of the Karakoram, with values up to 0.4. Throughout the time, the normalized detrended snow cover index (SCI) shows an alternation of periods with more and less snow cover with periods of generally more snow cover in the early 1980s, 1990s, and 2010s, and periods of generally less snow cover in the early 1970s, late 1980s, and 2000s (Figure 3B).
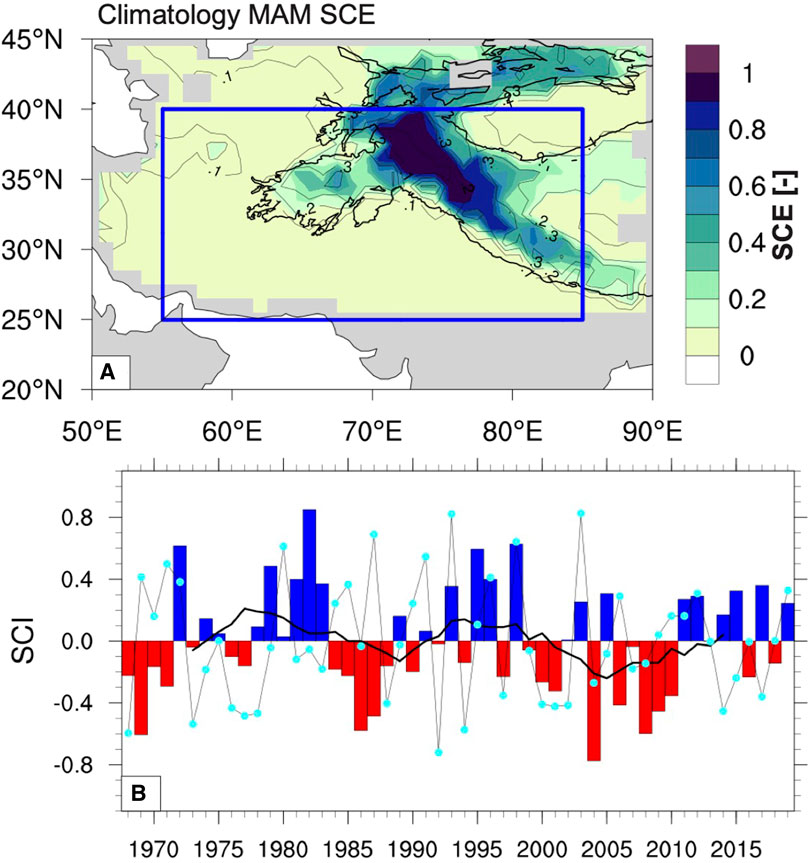
Figure 3. (A) The climatological spring mean snow cover extent (SCE) over the IPS-WTP domain (shading, unit: -) and its standard deviation (contours, unit: -). The black outline represents the outlines of the TP and adjacent mountains ranges. The blue box represents the IPS-WTP domain. (B) The normalized detrended snow cover index (SCI) calculated over the IPS-WTP domain (bars), its 11-year moving average representing interdecadal variations (black line), and the EASMRI (black line with cyan dots).
To further investigate the changing relation between EASMR and snow cover over the IPS-WTP region, composite analyses for the relevant driving atmospheric and land surface patterns are performed. To this end years with high and low snow cover are selected based on the SCI that is greater than or equal to ±0.4 standard deviation (Table 2). The reason for using this subjective threshold is to maintain at least 5 degrees of freedom in every HSC or LSC composite group throughout the composite analysis. The years of high and low snow cover (HSC and LSC, respectively) are subsequently distributed over two groups, representing P1 (1968–1990) and P2 (1991–2019). This results in 7 (11) HSC (LSC) years for P1 and 12 (10) HSC (LSC) years for P2. Associated with HSC, the precipitation anomalies over the EASM domain are negative over northeastern China, and positive over Central China and Japan during P1 (Figure 4A). During P2, the precipitation anomalies are mostly positive, and significant over Central China and Japan (Figure 4B). This implies that higher snow cover over the IPS-WTP can be associated with more rainfall over the EASM domain.
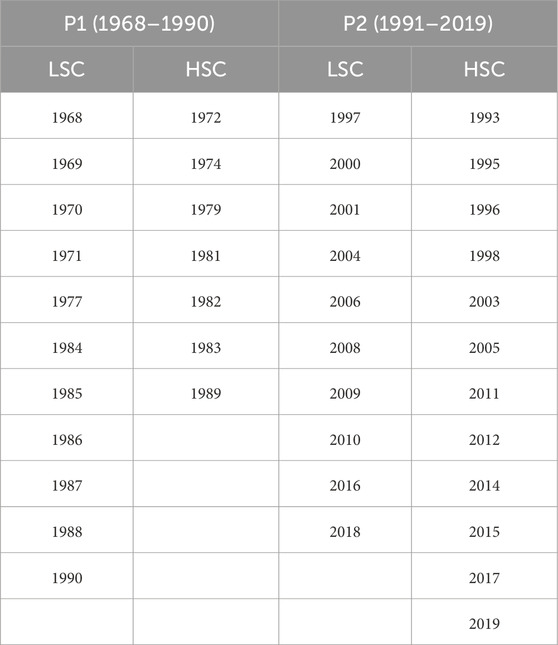
Table 2. High (HSC) and low (LSC) snow cover years for P1 (1968–1990) and P2 (1991–2019), selected based on ±0.4 standard deviation of the SCI.

Figure 4. Composite differences of precipitation (shading, unit: mm month−1) between HSC years and LSC years for P1 (1968–1990) (A) and P2 (1991–2019) (B). The black box denotes the defined EASM domain. The dots (dashed lines) represent the significance of anomalies at the 95% (90%) confidence level.
The EASM and the snow cover over the TP can both be modulated by remote forcing, such as sea surface temperature anomalies (SSTA) over the tropical Indo-Pacific Ocean (Xie et al., 2009; Yuan et al., 2009; Oh and Ha, 2015; Wang and Xu, 2018; Zhang Y. et al., 2019; Jiang et al., 2019; Duan et al., 2020; You et al., 2020). Therefore, the snow-monsoon relationship without remote forcing is examined to validate its strength. To this end, four indices representative for SSTA over the tropics are considered:
1) the Indian Ocean Basin Mode index (IOBMI) representing the first leading mode of SSTA over the Indian Ocean in the preceding spring (MAM) and concurrent summer (JJA) (i.e., the peak season of the IOBM). The IOBMI is defined as the first EOF mode of SSTA over the tropical Indian Ocean (20°S–20°N, 40°–110°E) (Yang et al., 2010).
2) the Dipole Mode Index (DMI) representing the second leading mode of SSTA over the Indian Ocean in the preceding autumn (September-November, SON, i.e., the peak-season of the IOD), winter (December-February, DJF), spring (MAM), and concurrent summer (JJA)
3) the Niño 1.2 index representing SSTA over the eastern equatorial Pacific in the preceding winter (DJF), spring (MAM), and concurrent summer (JJA).
4) the Niño 3.4 index representing SSTA over the central equatorial Pacific in the preceding winter (DJF), spring (MAM), and concurrent summer (JJA).
To examine the relative role of the above-mentioned remote factors, a partial correlation analysis is performed to remove the effects of these factors. The partial correlation analyses show that after removal of the preceding autumn-winter IOD and ENSO signals the snow-monsoon relationship remains significant during P2, although it experiences a slight weakening (Table 3). Also, after removal of the spring-summer ENSO, IOBM and IOD signals, the snow-monsoon relationship maintains its significance despite a slight weakening after removal of the IOBM summer signal. This implies that the snow-monsoon relationship can be considered as robust, but also that there is small modulation by preceding autumn-winter tropical Indo-Pacific SSTA and the concurrent summer Indian Ocean Basin Mode. These findings are in line with general findings of other studies on the robustness of the snow-monsoon relationship over the EASM domain (e.g., Xiao and Duan, 2016; Wang et al., 2018; Zhang Y. et al., 2019; Zhang et al., 2021 C.).
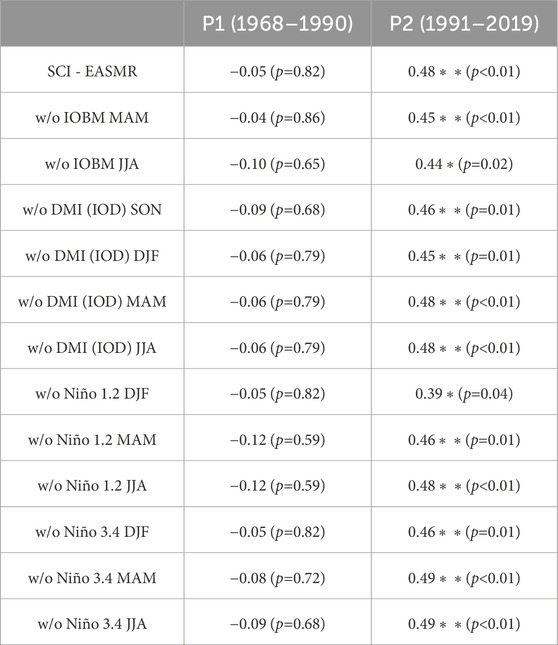
Table 3. Correlations between IPE-WTP spring snow cover and EASMR, and partial correlations excluding the influence of the IOBM, DMI and ENSO (Niño 1.2 and 3.4) in the preceding autumn (SON), winter (DJF) and spring (MAM), and concurrent summer (JJA) for P1 (1968–1990) and P2 (1991–2019). The value between the brackets denotes the statistical significance level (p). Values marked with * and ** are significant at the 95% and 99% confidence level, respectively.
3.2 Atmospheric circulation patterns associated with IPS-WTP snow cover variations
In this section, the differences in the snow-monsoon relationship between P1 and P2 are examined. As mentioned in the Introduction, several studies have highlighted that snow can exert an influence on the atmospheric and land surface heating over the TP during spring and summer. Figure 5 shows the composite differences of spring-summer air temperature at 500 hPa (i.e., the approximate surface level of the TP) between HSC and LSC years for P1 and P2. During spring (MAM) there are significant cold anomalies at 500 hPa southwest of the TP in P1 and over the western domain of the TP in P2 (Figures 5A,B). The differences in the locations of the cold anomalies could be attributed to the more northerly position of the SWJ in the HSC years of P2 (Supplementary Figure S1). While the cold anomalies at the 500 hPa level persist till May-June (MJ) in P2 but become less significant (Figure 5D), the cold anomalies persist throughout the spring into the summer and become more significant over the western domain of the TP in P1 (Figures 5C,E). The disappearance of (significant) cold anomalies during summer after 1990 can potentially be explained by a decline in significant positive snow cover anomalies from spring to summer in P2 as compared to P1 where significant positive snow cover anomalies can persist throughout the summer (Supplementary Figure S2). In other words, integrated over the domain, snow is more abundant in P1, which can restrain melting to facilitate the snow cover anomalies to sustain longer. In contrast, rapid reduction of snow cover in P2 can lead to warmer land surface and atmospheric conditions, and it can contribute to the disappearance of cold temperature anomalies. The reduction of significant positive summer snow cover anomalies in P2 is most likely related to the climate-induced reductions of snow cover (e.g., Wang Z. et al., 2021). Snow reduces the adsorption of solar radiation and suppresses the sensible heat flux, which results in a cooling down of the land surface and overlying atmosphere.
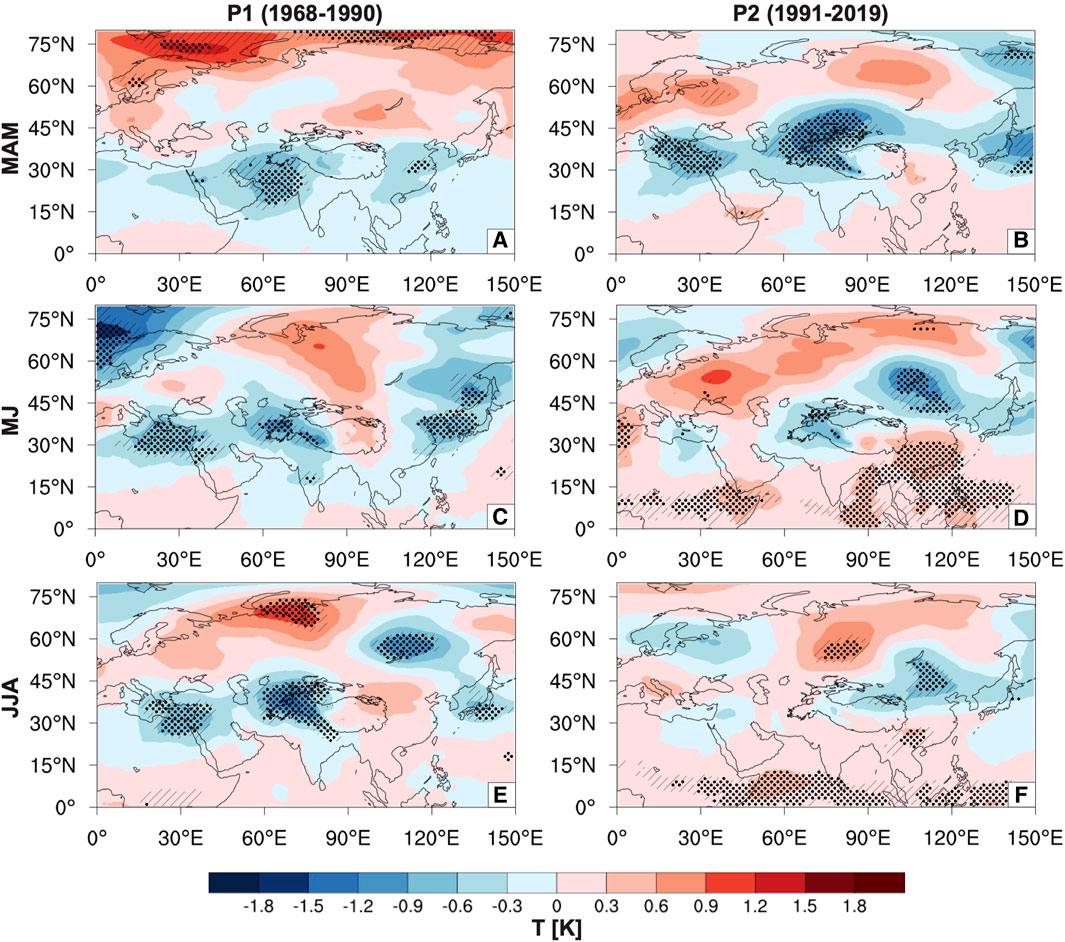
Figure 5. Composite differences in 500 hPa air temperature (shading, unit: (K) between HSC and LSC years from spring (MAM) to summer (JJA) for P1 (1968–1990) (A,C,E) and P2 (1991–2019) (B,D,F). The black outline represents the outlines of the TP and adjacent mountains ranges. The dots (dashed lines) represent the significance of temperature anomalies at the 95% (90%) confidence level. MJ stands for May-June.
Figures 6–8 show the composite differences of the spring-summer geopotential height and wind at 200 hPa (Figure 6), the corresponding wave activity flux (Figure 7), and vertically integrated moisture flux and divergence (Figure 8) between HSC and LSC years. In P1, anomalous cyclones prevail at the midlatitudes during spring, which are significant southwest of the TP (i.e., over Iran and Pakistan) and over eastern China (Figure 6A). This circulation pattern matches well with the cold anomalies (Figure 5A), conforming to the thermal wind constraint. Towards summer, the anomalous cyclone southwest of the TP persists (Figures 6C,E). The persistence and significance of the anomalous cyclone over the TP can be linked with cold anomalies over the western TP that can be attributed to the underlying snow forcing (Figure 5E). Further, a significant anomalous cyclone over the upstream Mediterranean Sea (i.e., surrounding 30°N, 20°E), which persists during the summer, also contributes to the persistence of the anomalous circulation over the TP by supplying wave energy fluxes.
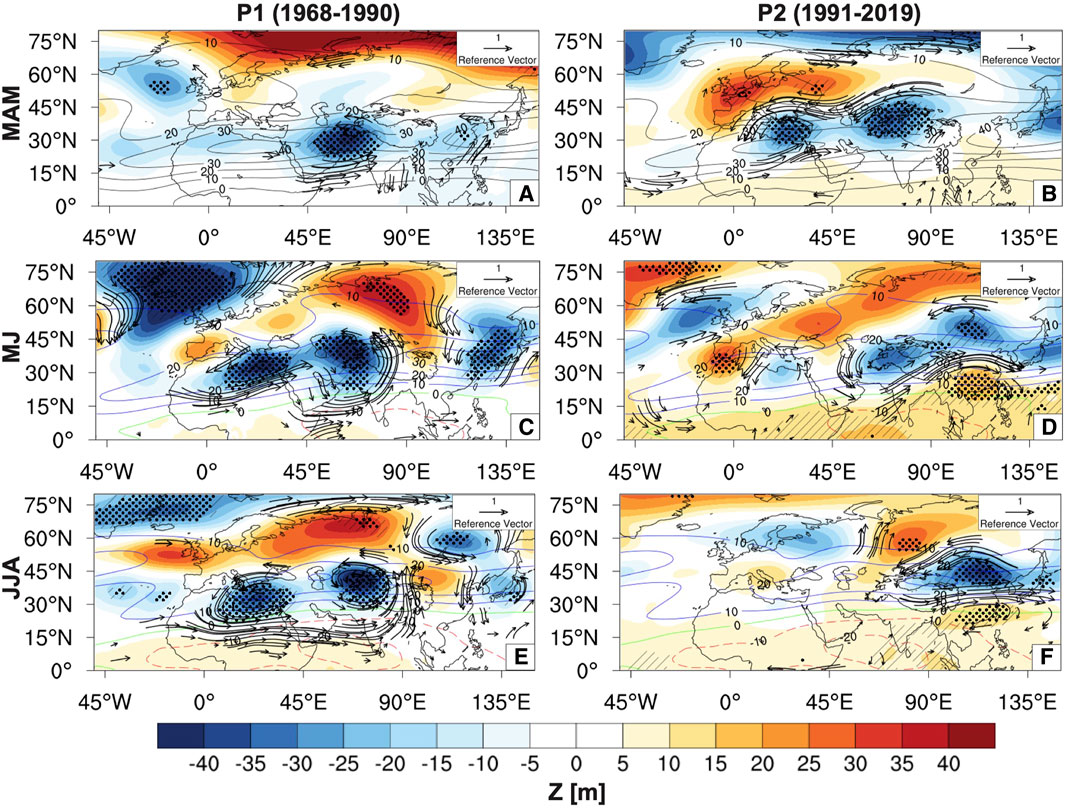
Figure 6. Composite differences in 200 hPa geopotential height (shading, unit: m) and wind (vectors, unit: m s−1) between HSC and LSC years from spring (MAM) to summer (JJA) for P1 (1968–1990) (A,C,E) and P2 (1991–2019) (B,D,F). The black outline represents the outlines of the TP and adjacent mountain ranges. The contours denote the climatological mean of the zonal wind at 200 hPa, where blue stands for positive (eastward) and red stand for negative (westward). The dots (dashed lines) represent the significance of anomalies at the 95% (90%) confidence level. The vectors represent the significance of wind anomalies at 95% confidence level. MJ stands for May-June.
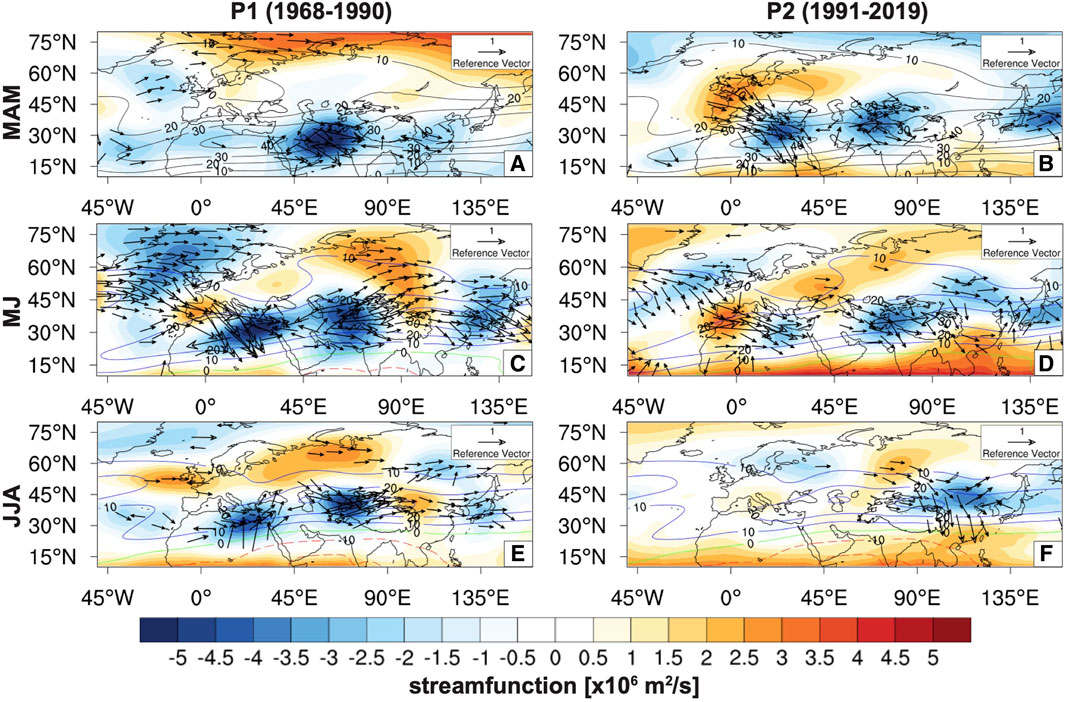
Figure 7. Composite differences in 200 hPa stream function (shading, unit: 106 m2 s−1) and wave activity flux (vectors, unit: m2 s−2) between HSC and LSC years from spring (MAM) to summer (JJA) for P1 (1968–1990) (A,C,E) and P2 (1991–2019) (B,D,F). The black outline represents the outlines of the TP and adjacent mountain ranges. The contours denote the climatological mean of the zonal wind at 200 hPa, where blue stands for positive (eastward) and red stand for negative (westward). The vectors representing wave activity fluxes less than 0.5 m2 s−2 are omitted. MJ stands for May-June.
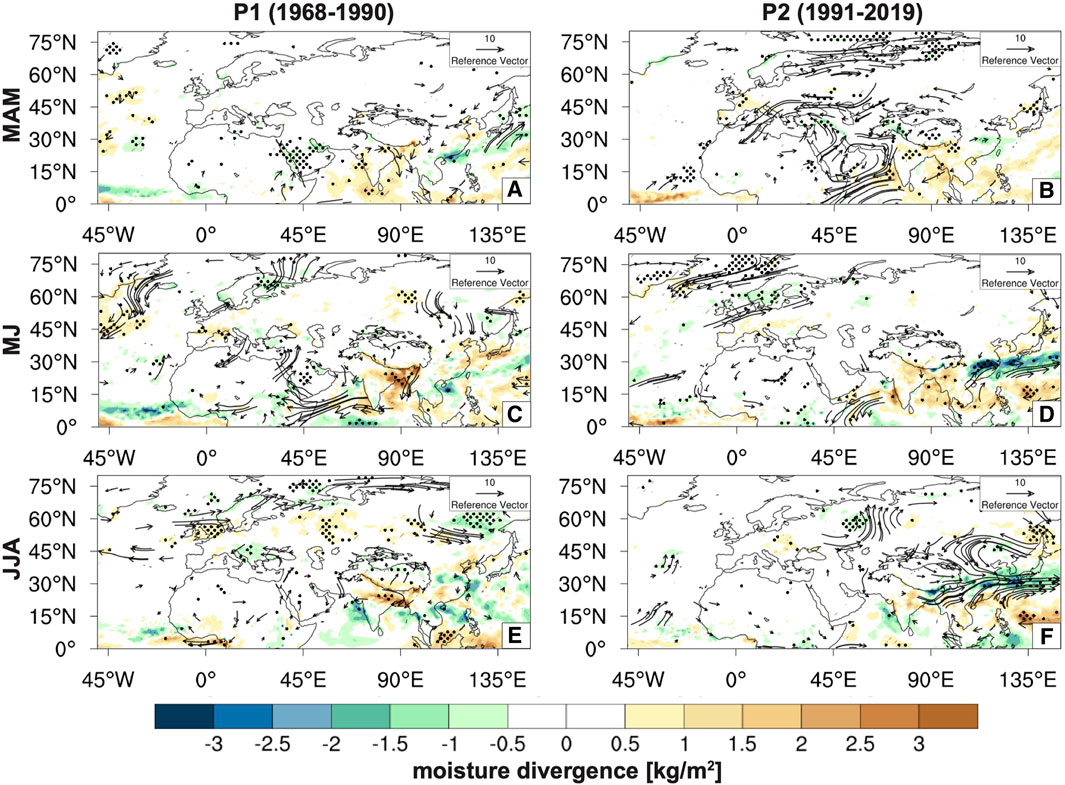
Figure 8. Composite differences in vertically integrated moisture divergence (shading, unit: kg m−2) and vertically integrated moisture fluxes (vectors, unit: kg m−1 s−1) between HSC and LSC years from spring (MAM) to summer (JJA) for P1 (1968–1990) (A,C,E) and P2 (1991–2019) (B,D,F). The black outline represents the outlines of the TP and adjacent mountain ranges. The dots (dashed lines) represent the significance of anomalies at the 95% (90%) confidence level. The vectors represent the significance of moisture flux anomalies at 95% confidence level. MJ stands for May-June.
Over time, the prolonged cyclonic circulation over the TP accompanies downstream anomalies, such as the anomalous cyclone over the Korean Peninsula and Japan in MJ and summer (Figures 6C,E). Alongside with an anomalous anticyclone northeast of the TP, these cyclonic anomalies form a zonally oriented wave train pattern (Figures 6C,E, 7C,E). The geographical location of this wave train coincides with the path of the SWJ that acts as a wave guide for Rossby wave energy along the TP into East Asia. This east-west oriented wave train along the SWJ resembles the Silk Road pattern (SRP), a recurrent teleconnection pattern along the SWJ in summer (Lu et al., 2002; Enomoto et al., 2003; Kosaka et al., 2009; Chen et al., 2013; Wang et al., 2017; Hong et al., 2018). The appearance of the SRP-like anomalies in MJ is essentially associated with northward seasonal migration of the SWJ. A similar wave pattern has also been found by Zhang C. et al. (2021) who showed well-organized Rossby wave source anomalies along the path of the SWJ, which favor the development of a wave pattern and further propagate disturbances eastward into East Asia. Promoted by the wave train, the anomalous cyclone over the Korean Peninsula and Japan induces dry northerly wind anomalies to the west (Figures 6E, 8E), it reduces the southerly inflow of tropical warm, and humid air and stimulate the inflow of continental warm and dry air from the north, eventually contributing to moisture divergence and a decrease in precipitation over northeastern China (Figures 4A, 8E).
In P2, two significant anomalous cyclones are located over the Mediterranean Sea and the TP during spring, which is analogous to that of P1 in MJ and JJA (Figures 6B,C,E). However, unlike the SRP-like circulation patterns in P1, no downstream anomalies are accompanied over East Asia (Figure 6B). During MJ and summer, the anomalous cyclones over the Mediterranean Sea and the TP weaken and lose its significance. This can partly be attributed to a decline in the underlying snow forcing (i.e., due to declining positive snow cover anomalies as observed in Supplementary Figure S2. However, despite the weakening of the anomalous cyclone over the TP, wave energy can still be propagated southeastward during MJ (Figure 7D), which contributes to the formation of an anomalous anticyclone over southeastern China and the western North Pacific (WNP). The anomalous anticyclone exhibits a barotropic vertical structure and can be an indication for a southeastward extension of the South Asian High (Wei et al., 2019; Zhang J. et al., 2021). Concurrently with the formation of the anomalous anticyclone, an anomalous cyclonic circulation also grows over Japan promoted by northeastward wave energy dispersion. Along with the formation of the anomalous atmospheric circulations, an anomalous moisture circulation develops over the WNP with moisture divergence over the Philippine Sea (5°–20°N; 130°–150°E) and enhanced moisture convergence over the East China Sea (25°–35°N; 120°–130°E) (Figure 8D). This anomalous moisture circulation is most likely linked to the strengthening of the western North Pacific subtropical high (WNPSH), which plays an important role in the transport of moist air from the tropics into East Asia (Lee et al., 2013). Here, air-sea interactions (i.e., by latent heating) could be one of the key factors that contribute to the strengthening of the WNPSH.
Figure 9 shows the composite differences of the May-June (MJ) and summer (JJA) surface upward latent heat flux (defined as positive downward) between HSC and LSC years. In P1, the latent heat flux anomalies do not show large significant changes. Only in MJ there are a few areas with significant positive latent heat flux anomalies (Figure 9C). Further, significant negative latent heat flux anomalies can be found in the EASM domain during MJ and summer. In P2, the latent heat flux anomalies are significantly positive over a large region of East Asia and the WNP, particularly between 15°N and 30°N during MJ and in the latitudinal domains 25°–35°N and 0°–15°N during summer (Figures 9E,F). Since the climatological latent heat flux is negative (i.e., upwards) during MJ and summer (Figures 9A,B) the positive anomalies indicate a reduction in the upwards latent heat flux, which is indicative for an increase (decrease) in condensation (evaporation). The reduced upward latent heating over the WNP leads most likely to suppressed convection in P2 and can therefore contribute to the strengthening of the WNPSH (e.g., He and Zhou, 2020). Correlation analyses between IPS-WTP snow cover and the summer WNPSH index (i.e., formulated as the area-averaged geopotential height at 850 hPa over the region 15°–30°N; 110°–150°E (Lee et al., 2013)) confirm that there is a significant positive relation between snow cover and the strength of the WNPSH in P2 (R = 0.44, p=0.02), whereas it is insignificant in P1 (R = −0.15, p= 0.49). This anomalous growth of the subtropical high suggests a forward shift of the seasonal evolution of the WNPSH that expands westward with seasonal progression.
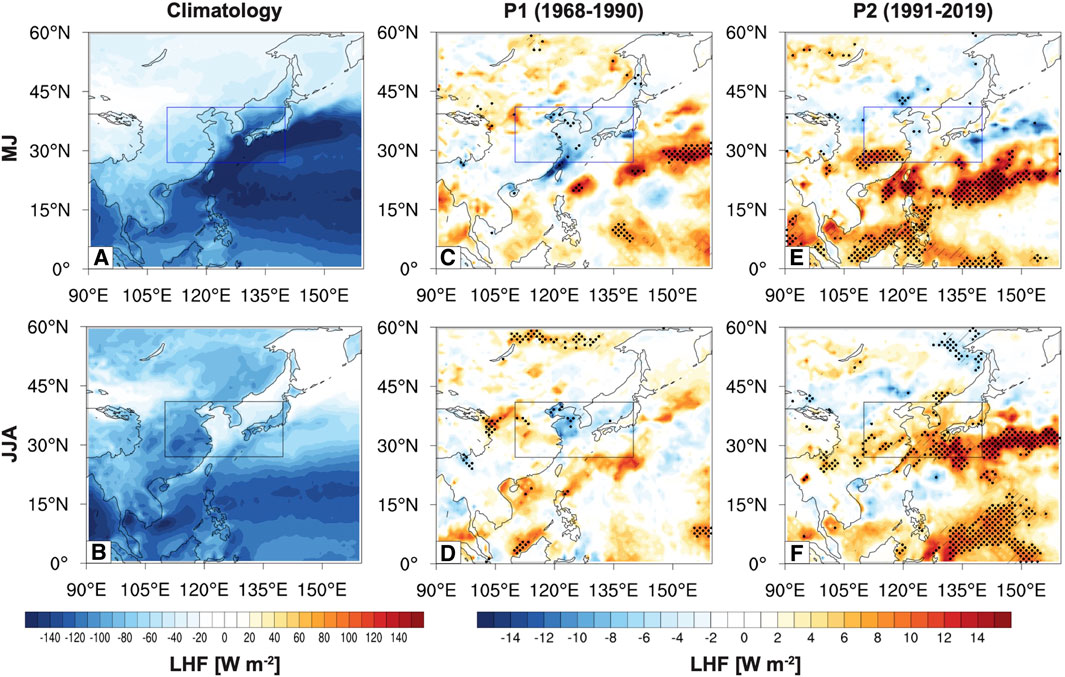
Figure 9. (A,B) Climatology of May-June (MJ) and summer (JJA) surface upward latent heat flux (positive downward, shading, unit: W m−2). (C-F) Composite differences May-June (MJ) and summer (JJA) surface upward latent heat flux (shading, unit: W m−2) between HSC and LSC years for P1 (1968–1990) (C,E) and P2 (1991–2019) (D,F). The black outline represents the outlines of the TP and adjacent mountain ranges. The black box denotes the defined EASM domain. The dots (dashed lines) represent the significance of anomalies at the 95% (90%) confidence level.
Along with the strengthening of the subtropical high, the anomalous moisture divergence over the Philippine Sea is sustained in summer (Figure 8F). Moisture divergence further affects East Asia via anomalous moisture transport and a meridional atmospheric teleconnection (Supplementary Figure S3) that generates northward energy dispersion in the lower troposphere, southward energy dispersion in the upper troposphere (Supplementary Figure S4B) and converges anomalous moisture transport over East Asia. This meridional circulation enhances low-level southwesterly inflow of moisture into the EASM domain in MJ and summer, which eventually results in increased precipitation over the respective domain during summertime (Figures 4B, 8F and Supplementary Figure S3D). One of the possible mechanisms that is responsible for the sustainability of the anomalous moisture circulation and corresponding moisture divergence over the Philippine Sea could be a self-sustaining mechanism through moist processes that resembles the self-sustaining mechanism of the Pacific-Japan teleconnection pattern (Kosaka and Nakamura, 2006).
3.3 LBM simulations
To investigate the response of the atmospheric circulation to the snow forcing and linked cold temperature anomalies in P1 and P2, six different cooling experiments with LBM are conducted in different spring, May-June, and summer backgrounds for P1 and P2, respectively. Supplementary Table S1 lists an overview of the different LBM experimental settings. In the Exp_P1 MAM (Exp_P2 MAM) experiment, LBM is forced with the spring basic state of P1 (P2) in combination with a cooling anomaly located at the southwestern periphery of the TP (the western domain of the TP). The prescribed cooling anomalies correspond with the spring cold anomalies located southwest of the TP (centered at [30°N; 66°E]) in P1 (Figure 5A, Supplementary Figure S5A, S6A) and over the western TP (centered at [38°N; 72°E]) in P2 (Figure 5B, Supplementary Figure S5B, S6B). For the Exp_P1 MJ and JJA (Exp_P2 MJ and JJA) experiments, LBM is forced with the May-June and summer basic states of P1 (P2), respectively. The prescribed cooling anomalies in these experiments have been shifted northward (centered at 37°N; 66°E for P1 and 40°N; 72°E for P2), corresponding with the May-June and summer cold anomalies over the western TP (Figures 5C–F, Supplementary Figure S6D,E, S6G,H). The prescribed cooling anomalies have a circular shape with a radius up to 20° in both latitudinal and longitudinal directions, which are also in line with the cold anomalies shown in Figure 5. In the P1 experiments, a maximum cooling of 1 K day−1 is applied, where the peak in the vertical (gamma) cooling profile occurs at
Figure 10 shows the simulated geopotential height and wind at the 200 hPa level to prescribed cooling anomalies that mimic the spring-summer cold anomalies in P1 (Exp_P1) and P2 (Exp_P2). The Exp_P1 MAM simulations show an anomalous cyclonic circulation southwest of the TP that accompanies an anomalous anticyclonic system southeast of the TP, and an anomalous cyclonic system over Japan (Figure 10A). The Exp_P1 MJ and JJA simulations (Figures 10C,E) show an east-west oriented pattern of alternating cyclonic anomalies and anticyclonic anomalies over the western part of the TP (cyclonic), (north)eastern part of the TP (anticyclonic), and northeast Asia (cyclonic). The atmospheric patterns of Exp_P1 MJ and JJA resemble most the MJ and summer atmospheric patterns of P1 (Figures 6C,E), that also show an east-west oriented pattern of alternating cyclonic and anticyclonic anomalies. The atmospheric patterns of Exp_P1 MAM show some similarities with the spring atmospheric patterns of P1 (Figure 6A) with anomalous cyclones southwest of the TP and over eastern Asia, but also display some distinct differences with an anomalous anticyclone southeast of the TP that is not visible in the composite anomalies.
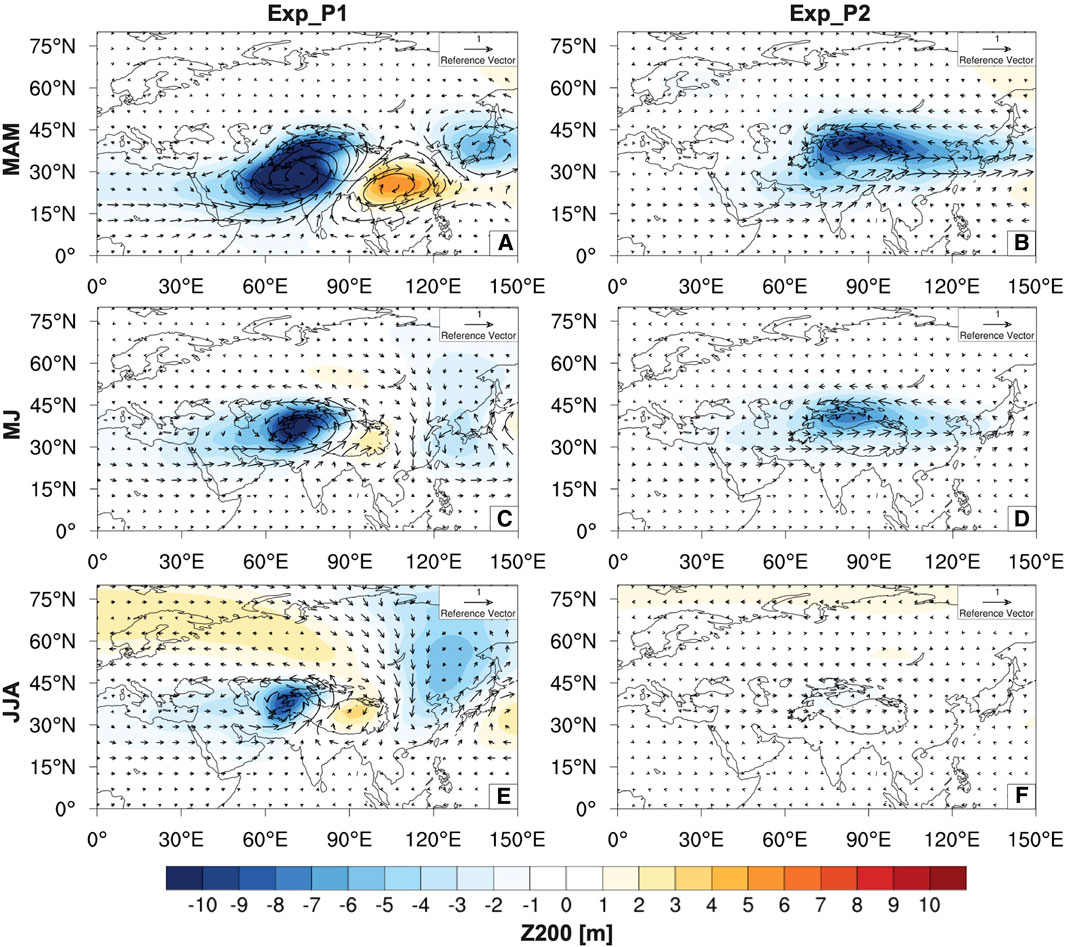
Figure 10. Linear model response of 200 hPa geopotential height (shading, unit: m) and wind (vector, unit: m s−1) to prescribed cooling anomalies that mimic the cold anomalies during MAM (A), May-June (MJ; (B) and summer (JJA; (C) in P1 and during MAM (D), May-June (MJ; (E) and summer (JJA; (F) in P2. The experiments are performed in two different spring (MAM), May-June (MJ), and summer (JJA) backgrounds for P1 and P2, respectively. The black outline represents the outlines of the TP and adjacent mountain ranges.
The Exp_P2 MAM and MJ simulations (Figures 10B,D) show a large anomalous cyclonic system over the TP and northern China that is accompanied with westerly (easterly) wind anomalies along the southern (northern) flank of the cyclonic system. In the Exp_P2 MJ simulation, the anomalous cyclonic system is smaller in extent, presumably because of the reduced anomalous cooling in the respective experiment. Under weak prescribed cooling as applied in the Exp_P2 JJA experiment (Figure 10F) the anomalous cyclonic system over the TP eventually disappears, which is in line with the disappearance of the cyclonic anomaly over the western TP after MJ in P2 (Figure 6F). Compared to the composite anomalies, the anomalous cyclonic system over the TP show similarities with the anomalous cyclone over the TP and East Asia in spring and May-June (Figures 6B,D). However, a major difference is that the anomalous anticyclone over southeastern China/western North Pacific (Figures 6D,F) is not reproduced in the Exp_P2 simulations.
3.4 Possible mechanism for changing snow-monsoon relationship
The previously presented outcomes suggest that during P1 high spring snow cover can be associated with reduced precipitation over the northern part of the EASM domain, whereas during P2 high snow cover can be associated with an enhancement of precipitation over the EASM domain. The differences between P1 and P2 are directly attributable to changes in the wave train patterns that start to occur in MJ (Figures 7C,D). In P1, the wave train pattern associated with HSC develops to an anomalous SRP-like wave train pattern with an eastward propagation of wave energy (Figures 7C,E), whereas in P2 an anomalous SRP-like pattern is not well established, and wave energy is propagated in a more southeastward direction, which contributes to the earlier westward advancement of the WNPSH (Figures 7D,F). These changes in wave patterns between P1 and P2 likely stem from the altered background conditions that serve as Rossby wave guide and potential energy source to feed the SRP. Figure 11A shows the summer mean zonal wind at 200 hPa in P1 and its difference from P2. In P1, the region of the maximum of the SWJ, centered around 40°N, extends eastward towards East Asia, whereas in P2 the SWJ shows a weakening relative to P1. This is in line with the earlier reported weakening of the SWJ over East Asia (Kwon et al., 2007; Archer and Caldeira, 2008; Park et al., 2011; Zhu et al., 2011). The zonally extended SWJ could serve as a favorable condition for the zonal propagation of the SRP that develops being trapped in the SWJ (Kosaka et al., 2009). In addition, the background thermal field could also positively contribute to the maintenance of the SRP-like circulation during P1. Consistent to the stronger zonal wind, the background meridional temperature gradient in P1 is stronger near the center of the SWJ (Figure 11B). Given that the SRP is efficiently sustained by extracting the background available potential energy (Kosaka et al., 2009; Chen et al., 2013), this background thermal condition provides advantages for the wave train to readily sustain for the season. By contrast, in P2, weaker background zonal wind and reduced background potential energy work adversely for the development and maintenance of the zonally oriented circulation anomalies. One of the possible explanations for the weakening of the SWJ in P2 is a warming over the Eurasian continent that reduces the poleward temperature gradient, which is especially visible in adjacency of the SWJ (Figure 11C) (Archer and Caldeira, 2008; Stendel et al., 2021).
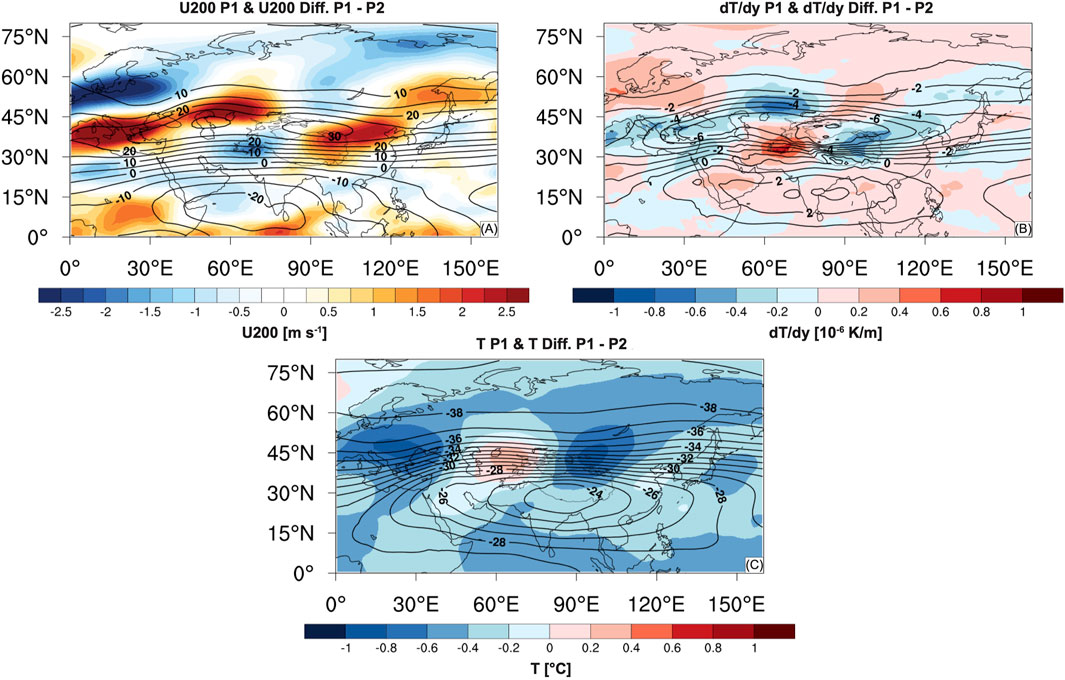
Figure 11. (A) Summer (JJA) mean zonal wind at 200 hPa (contour, unit: m s−1) and the differences in summer mean zonal wind at 200 hPa between P1 (1968–1990) and P2 (1991–2019) (shading, unit: m s−1). (B) Summer (JJA) mean upper tropospheric (200–500 hPa) temperature gradient (contour, unit: 10−6 K/m) and the differences in summer mean upper tropospheric temperature gradient between P1 (1968–1990) and P2 (1991–2019) (shading, unit: 10−6 K/m). (C) Summer (JJA) mean upper tropospheric (200–500 hPa) temperature (contour, unit: °C) and the differences in summer mean upper tropospheric temperature between P1 (1968–1990) and P2 (1991–2019) (shading, unit: °C). The black outline represents the outlines of the TP and adjacent mountain ranges.
4 Discussion
4.1 Uncertainties and limitations
The outcomes presented in this study are based on the analysis of satellite-based, observation-based and reanalysis products. Via propagation of uncertainties from the analysis products uncertainties might have been introduced in the outcomes presented here. For instance, the accuracy of observation-based products is relying on the availability of measurements. Particularly in the remote high-mountain environments of the TP (e.g., the WTP) the number of meteorological stations is limited and unevenly distributed, lowering the accuracy of variables such as precipitation. The poor coverage of meteorological stations eventually introduces uncertainties in gridded observation-based datasets, such as CRU but also in reanalysis products such as ERA5 that rely on observations as well (Immerzeel et al., 2015). Uncertainties might also have been introduced via uncertainties and limitations that are related to reanalysis products such as ERA5. For instance, several studies have indicated the existence of a cold bias in the ERA5 surface temperature fields over the TP, which could be related to the overestimation of snow depth caused by a lacking data assimilation of snow depth from the Interactive Multisensor Snow and Ice Mapping System (IMS) at high altitudes (Orsolini et al., 2019; Wang X. et al., 2021; Khanal et al., 2021). Another study of Rudisill et al. (2024) found that local wind circulations, longwave radiation and surface-layer parameterizations could contribute to cold biases as well, although the exact causes of cold biases remain unknown. The cold biases in ERA5 could therefore have introduced uncertainties in the outcomes presented here, although comparisons with the outcomes of another study of Zhang C. et al. (2021) show similar atmospheric patterns associated with HSC before and after 1990. Since the authors of the cited study applied the National Centers for Environmental Prediction (NCEP) reanalysis to investigate the changing snow-monsoon relationship between the TP and Central China before and after 1990, it can demonstrate that ERA5 and NCEP produce similar outcomes. To validate the impact of the cold bias in ERA5 future research would be of interest that investigates the changing snow-monsoon relationship by using multiple reanalysis products, such as the Japanese 55-year Reanalysis (JRA55), the NASA Modern-Era Retrospective analysis for Research and Applications (MERRA2), NCEP, and ERA-Interim.
Uncertainties could also have been introduced in the presented outcomes via the methods we applied to examine the robustness of the snow-monsoon relationship and to understand atmospheric and land surface patterns in association with high snow cover. For instance, we applied partial correlation analyses to examine the relative effects of different SST signals from the tropics (IOBM, IOD, and ENSO) on the snow-monsoon relationship over different seasons (September-November, December-February, March-May, and June-August). Although the method we applied addressed the seasonal dependencies of each SST signal, the diversity of impacts from multiple SST signals within one season is not captured, which could introduce uncertainties in the outcomes. To assess the diversity of impacts from multiple SST signals over multiple seasons, EOF analysis-based methods as those applied by Hu et al. (2022) and Horan et al. (2024) could be an outcome. To investigate the driving atmospheric and land surface patterns in association with high snow cover, composite analyses were applied. Although composite analyses are effective and useful analysis methods, composite analyses need to be treated with care since composite analyses could reduce the robustness of the main findings (e.g., Boschat et al., 2016). In comparison with regression analysis methods, composite analyses have some limitations, for instance in controlling the influence of remote oceanic and/or atmospheric factors that could affect a relationship. However, as Supplementary Figure S7 shows, there are, despite a few small differences, many similarities between summer precipitation anomalies obtained from composite analyses (Supplementary Figure S7A,B) and summer precipitation anomalies obtained from regression analysis (Supplementary Figure S7C,D), even after removal of the winter ENSO signal (based on the Niño 1.2 index) (Supplementary Figure S7E,F), which is shown to have the largest impact on the snow-monsoon relationship (Table 3). Similar findings are also found for other variables such as for the vertically integrated moisture divergence and fluxes (Supplementary Figure S8). The large similarities between the composite anomalies and the regressions illustrate that composite analyses are a sufficiently robust tool that can contribute to an improved understanding of atmospheric and land surface patterns associated with snow cover variations.
To assess the response of atmospheric circulations to prescribed cooling anomalies before and after 1990, numerical modelling experiments were performed with the Linear Baroclinic Model (LBM). The LBM modelling experiments fairly reproduce the atmospheric patterns over the Asian continent that are associated with the prescribed cooling anomalies in P1 and P2, respectively, although there are also some differences. The numerical experiments lack, for instance, the ability to reproduce the anomalous anticyclone over southeastern China/western North Pacific and its barotropic vertical structure in P2. This is potentially caused by the lack of moisture and missing air-sea interactions in the ‘dry’ version of LBM. Although the wave patterns in P2 contribute to the development of the anomalous anticyclone (as observed in the composite analyses), the lack of ability to reproduce the anomalous anticyclone in LBM demonstrate that air-sea interactions, moisture and other remote oceanic and/or atmospheric forcings could play an important role as well in the development and maintenance of atmospheric patterns that lead to increased rainfall in P2. To investigate the relative role of remote atmospheric/oceanic forcings, moisture, and air-sea interactions, the ‘moist’ version of LBM could be an option. However, a limitation of the ‘moist’ version of LBM is that the model cannot be forced with prescribed diabatic heating or vorticity anomalies over land. Therefore, more advanced modeling approaches are needed. For instance, Zhang et al. (2022) investigated the link between TP spring snow cover and spring rainfall over eastern China by applying a partially coupled earth system modelling framework comprising atmosphere and land models prescribed by SST, sea ice, and TP snow cover anomalies. Similar modelling approaches combining prescribed TP snow cover anomalies and SST anomalies could be helpful to disentangle the relative roles of TP snow cover and other atmospheric and oceanic forcings in EASM variability, and to better understand the delayed response of summer climate to spring snow cover.
4.2 Changing snow-monsoon relationship and possible mechanisms
The presented research gives an insight in the complexity of the changing snow-monsoon relationship. Although the snow-monsoon relationship remains significant in P2 after removing the influence of SSTA over the tropical Indo-Pacific in the preceding autumn, winter, spring, and concurrent summer seasons, preceding autumn-winter tropical Indo-Pacific SSTA and the concurrent Indian Ocean Basin Mode could still modulate the snow-monsoon relationship to some extent. Also, there is a likelihood that SSTA have a time-delayed response of more than a year on the snow-monsoon relationship and that the snow-monsoon relationship is affected by other remote forcings. Several studies have reported the (seasonal) effects of other forcings, such as the North Atlantic Oscillation (NAO) and SSTA (e.g., the Atlantic Multidecadal Oscillation (AMO)), Arctic Oscillation (AO), Antarctic Oscillation/Southern Annular Mode (AAO/SAM), Arctic sea ice, and soil moisture over the Indo-China Peninsula, on TP snow cover or East Asian rainfall (He et al., 2018; Gao et al., 2020; You et al., 2020; Chen et al., 2022; Gao and Li, 2023; Li et al., 2023; Zhang et al., 2023). Finally, there is a possibility that remote atmosphere/oceanic forcings affect TP snow cover and EASM rainfall simultaneously. As outlined in Section 3.2 changed air-sea interaction could be a possible key factor for the strengthening of the WNPSH and subsequently the increased rainfall over East Asia. Although the composite and correlation analyses suggest the existence of a link between TP snow cover and the WNPSH, the LBM simulations do not show this connection, which implies that changes in air-sea interactions could also be driven by remote atmospheric and/or oceanic forcings. These forcings could simultaneously affect snow cover as well. To get a better insight in the connections between snow cover, East Asian rainfall, air-sea interactions, WNPSH, and remote atmospheric/oceanic forcings, identifying causal relationships could be helpful. Causality analyses, have, for instance, been applied to understand the long-term relations between Eurasian snow cover, Indian summer monsoon rainfall and the NAO (Pandey et al., 2022). The connections between TP snow cover, EASM rainfall, and remote forcings illustrate the complexity of the snow-monsoon relationship and emphasize the need for a more detailed understanding of the past, present, and future TP environment and its remote interactions with the atmosphere, ocean, land, and sea ice.
The differences in the driving atmospheric patterns between P1 and P2 that lead to a changing snow-monsoon relationship are most likely attributable to different wave train patterns that are ensuing from different background conditions during summertime. Analyses of the background zonal wind at 200 hPa and upper-tropospheric (200–500 hPa) temperature and meridional temperature gradients indicate that the SWJ and the background meridional temperature gradient are weaker in P2, which could be related to the warming over the Eurasian continent. The changing temperature gradient and intensity of the SWJ can subsequently affect Rossby wave dynamics (Stendel et al., 2021). For instance, a weaker (stronger) meridional temperature gradient and corresponding weaker (stronger) SWJ affects the wave behavior by increasing (decreasing) the waviness of the atmospheric circulation in the vicinity of the SWJ, and therefore can affect the wave patterns as well (Blackport and Screen, 2020; Stendel et al., 2021). There could be several potential explanations for the changing background conditions. One of the potential explanations is that the changing background conditions and ensuing wave patterns during summertime could be attributed to global warming, which could weaken the meridional temperature gradient and SWJ. Global warming could additionally also influence snow cover over the TP and affect the snow-monsoon relationship. For instance, Wang Z. et al. (2021) suggested that the influence of summer snow cover over the TP on EASM circulation and precipitation is weakening after the early 2000s due to a significant warming-induced decline in snow cover. A similar trend in the snow-monsoon relationship is also visible in Figure 2 as the snow-monsoon relationship loses its significance after the early 2000s (Figure 2A), which might as well be related to a decline in spring snow cover. Another potential explanation is that the changing background conditions are caused by interdecadal shifts in oceanic or atmospheric modes, such as the negative-to-positive AMO interdecadal shift of the late 1990s. A recently published study of Wei and Yu (2024) investigating the interdecadal changes between the IOBM and summer precipitation in Central Asia found that the interdecadal shift of the AMO partly contributed to a weakening of the relationship between IOBM and Central Asian precipitation via alteration of the SWJ. Although the timing of the interdecadal shift of the AMO does not coincide with interdecadal shift of the snow-monsoon relationship (early 1990s), similar mechanisms could explain the background changes in zonal wind. Interdecadal shifts that coincide better with the interdecadal shift in the snow-monsoon relationship are, for example, the strengthening of the relation between the NAO and North Atlantic tripole (NAT) SSTAs since the late 1980s (Chen et al., 2020) or the intensification of the interannual relationship between the NAT SSTAs and the Pacific Meridional Mode since the early 1990s (Kao et al., 2022). However, to better understand the impacts of these interdecadal shifts as well as the effects of global warming on the changing background conditions more research is needed.
5 Summary
This study investigates the changing relationship between spring snow cover over the TP and EASM rainfall over time, to see whether differences occur in the snow-monsoon relationship before and after 1990, and what potential mechanisms could be responsible for these differences. The first part of this study focused on the relationships between EASM rainfall and spring snow cover over various parts of the TP and the adjacent IPS. The outcomes of the correlation analyses reveal that the snow-monsoon relationship experience a shift around 1990 from partly negative to positive in all regions and becomes significantly positive over the IPS, WTP, and the combined IPS-WTP domains during the 1990s and early 2000s. Here, the most significant positive correlation was found over the IPS-WTP domain, which remained significant after removal of the effects of SST anomalies over the tropical Indo-Pacific oceans.
To understand the changing relation between EASM rainfall and snow cover over the IPS-WTP region and its association with the driving atmospheric and land surface patterns composite analyses were performed by selecting years with high and low snow cover (HSC and LSC, respectively) for P1 (1968–1990) and P2 (1991–2019). The analyses show that during P1 HSC can be associated with prevailing anomalous cyclones at the midlatitudes during spring that are significant southwest of the TP (i.e., over Iran and Pakistan) and over eastern China, and match well with the cold anomalies. As Figure 12 illustrate, the anomalous cyclone southwest of the TP persists in the following summer, partly due to the underlying snow forcing, and accompanies downstream anomalies, which include an anomalous anticyclone northeast of the TP and an anomalous cyclone over the Korean Peninsula and Japan. Favored by strong background zonal wind and meridional temperature gradients, these anomalies form a strong east-west oriented wave train pattern along the SWJ, which resembles the Silk Road pattern and acts as a Rossby wave guide that further propagates disturbances into East Asia. Promoted by the wave train, the anomalous cyclonic circulation over the Korean Peninsula and Japan induces northerly wind and negative moisture flux anomalies that bring in drier air from the north, leading to moisture divergence and reduced precipitation over northern China.
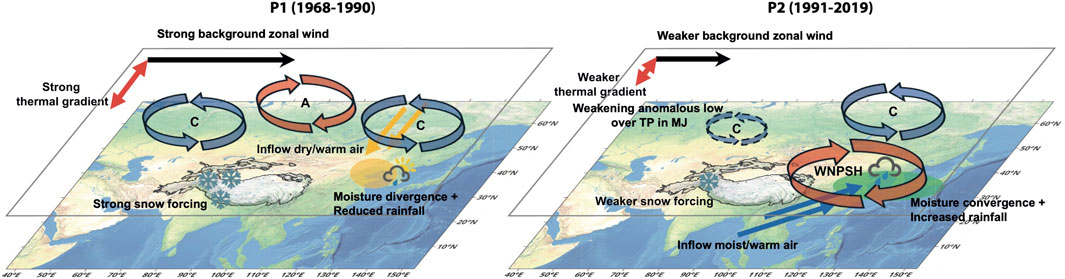
Figure 12. Schematic illustration of the possible mechanisms associated with the changing relationship between IPS-WTP snow cover and EASM rainfall before (P1, 1968–1990) and after 1990 (P2, 1991–2019). “A” and “C” represent anomalous anticyclones (red circles) and cyclones (blue circles), respectively. “WNPSH” stands for the western North Pacific subtropical high. The black outline represents the outlines of the TP and adjacent mountains ranges. The source of the background imagery is http://naturalearthdata.com/(last access: 9 February 2024).
In P2, anomalous cyclones located over the Mediterranean Sea and the TP in spring have an analogous position to those of P1 in MJ and JJA but are not accompanied by downstream anomalies over East Asia. The anomalous cyclones weaken and lose its significance during MJ and summer, which can partly be attributed to a decline in the underlying snow forcing. Further, the weakening of background zonal wind and meridional temperature gradients limits the development and maintenance of zonally oriented wave train patterns. Nonetheless, the anomalous cyclone over the TP can still propagate wave energy in a southeastward direction in MJ, which contributes to the formation of an anomalous anticyclone over southeastern China and the western North Pacific. Combined with a concurrently developing anomalous cyclonic circulation over Japan, the anomalous anticyclone enhances moisture convergence over the East China Sea and moisture divergence occurs over the Philippine Sea. Furthermore, a changed air-sea interaction via reduced upward latent heating and suppressed convection could be a possible key factor for the strengthening of the WNPSH. Here, the air-sea interaction changes could also be driven by other remote atmospheric and/or oceanic forcings. Along with the strengthening of the subtropical high, the anomalous moisture divergence over the Philippine Sea is sustained in summer, and further affects East Asia via anomalous moisture transport and a meridional atmospheric teleconnection that generates northward (southward) wave energy dispersion in the lower (upper) troposphere and converges moisture transport over East Asia. This meridional circulation enhances the southwesterly inflow of warm and moist air into the EASM domain in MJ and is sustained in summer, which leads to increased precipitation over the respective domain during summertime.
The outcomes of this study aim to contribute to a better understanding on the changing relationship between TP spring snow cover and EASM rainfall and the possible mechanisms. However, the presented research also shows the complexity of this changing snow-monsoon relationship and its uncertainties and limitations. For this reason, more future research is needed to improve our understanding on the relative effects of remote atmosphere, ocean, land, and sea ice forcings on the (changing) relation between TP snow cover and EASM rainfall.
Data availability statement
Publicly available datasets were analyzed in this study. This data can be found here: The datasets analysed during the current study are available in the following repositories. Monthly mean snow cover is derived from Northern Hemisphere weekly snow cover extent data, which is available via the National Snow and Ice Data Center (NSIDC) (https://nsidc.org/data/NSIDC-0046/versions/4). Monthly land precipitation and 2 m temperature data are retrieved from the Climatic Research Unit gridded Time Series (CRU TS) of the University of East Anglia (https://crudata.uea.ac.uk/cru/data/hrg/). Monthly reanalysis data is retrieved from ERA5, which is provided by the Climate Data Store (CDS) of the European Centre for Medium-Range Weather Forecasts (ECMWF) (https://cds.climate.copernicus.eu/). Monthly sea surface temperature is retrieved from the Extended Reconstruction SST Version 5 (ERSSTv5) dataset of the National Oceanic and Atmospheric Administration (NOAA) (https://doi.org/10.7289/V5T72FNM). The Niño indices and Dipole Mode Index (DMI) are retrieved from the NOAA Earth System Research Laboratories and Physical Sciences Laboratory (PSL) (https://psl.noaa.gov/data/climateindices/list/and https://psl.noaa.gov/gcos_wgsp/Timeseries/).
Author contributions
RW: Conceptualization, Formal Analysis, Investigation, Methodology, Visualization, Writing–original draft, Writing–review and editing. HO: Conceptualization, Writing–review and editing. SK: Conceptualization, Writing–review and editing. AY: Writing–review and editing. WB: Funding acquisition, Supervision, Writing–review and editing. S-IA: Funding acquisition, Project administration, Resources, Supervision, Writing–review and editing.
Funding
The author(s) declare that financial support was received for the research, authorship, and/or publication of this article. This work was supported by the National Research Foundation of Korea (NRF) grant funded by the Korea government (MSIT) (NRF-2018R1A5A1024958). HO is supported by the NRF grant funded by the Korea government (MSIT) (No. 2021R1C1C2005002). RW and WB acknowledge support from the Netherlands Earth System Science Centre (NESSC), which is funded by the Ministry of Education, Culture and Science under OCW grant no. 024.002.001.
Acknowledgments
We thank Willem Jan van de Berg and Mi-Kyung Sung for the helpful discussions. We thank two reviewers and the associate editor for their constructive remarks and suggestions that helped us to improve the manuscript significantly.
Conflict of interest
Author SK is employed by the company FutureWater.
The remaining authors declare that the research was conducted in the absence of any commercial or financial relationships that could be construed as a potential conflict of interest.
Publisher’s note
All claims expressed in this article are solely those of the authors and do not necessarily represent those of their affiliated organizations, or those of the publisher, the editors and the reviewers. Any product that may be evaluated in this article, or claim that may be made by its manufacturer, is not guaranteed or endorsed by the publisher.
Supplementary material
The Supplementary Material for this article can be found online at: https://www.frontiersin.org/articles/10.3389/feart.2024.1385657/full#supplementary-material
References
Ahmed, F., Adnan, S., and Latif, M. (2020). Impact of jet stream and associated mechanisms on winter precipitation in Pakistan. Meteorology Atmos. Phys. 132, 225–238. doi:10.1007/s00703-019-00683-8
Archer, C. L., and Caldeira, K. (2008). Historical trends in the jet streams. Geophys Res. Lett. 35. doi:10.1029/2008GL033614
Bao, Y., and You, Q. (2019). How do westerly jet streams regulate the winter snow depth over the Tibetan Plateau? Clim. Dyn. 53, 353–370. doi:10.1007/s00382-018-4589-1
Bell, B., Hersbach, H., Simmons, A., Berrisford, P., Dahlgren, P., Horányi, A., et al. (2021). The ERA5 global reanalysis: preliminary extension to 1950. Q. J. R. Meteorological Soc. 147, 4186–4227. doi:10.1002/qj.4174
Blackport, R., and Screen, J. A. (2020). Insignificant effect of Arctic amplification on the amplitude of midlatitude atmospheric waves. Sci. Adv. 6, eaay2880. doi:10.1126/sciadv.aay2880
Blanford, H. F. (1884). II. On the connexion of the Himalaya snowfall with dry winds and seasons of drought in India. Proc. R. Soc. Lond. 37. doi:10.1098/rspl.1884.0003
Bookhagen, B., and Burbank, D. W. (2010). Toward a complete Himalayan hydrological budget: spatiotemporal distribution of snowmelt and rainfall and their impact on river discharge. J. Geophys Res. Earth Surf. 115. doi:10.1029/2009JF001426
Boschat, G., Simmonds, I., Purich, A., Cowan, T., and Pezza, A. B. (2016). On the use of composite analyses to form physical hypotheses: an example from heat wave - SST associations. Sci. Rep. 6, 29599. doi:10.1038/srep29599
Brodzik, M. J., and Armstrong, R. (2013). Northern Hemisphere EASE-grid 2.0 weekly snow cover and sea ice extent. Version 4. Boulder, Colorado USA: NASA DAAC at the National Snow and Ice Data Center. doi:10.5067/P7O0HGJLYUQU
Cannon, F., Carvalho, L. M. V., Jones, C., and Bookhagen, B. (2015). Multi-annual variations in winter westerly disturbance activity affecting the Himalaya. Clim. Dyn. 44, 441–455. doi:10.1007/s00382-014-2248-8
Chen, G., Huang, R., and Zhou, L. (2013). Baroclinic instability of the silk road pattern induced by thermal damping. J. Atmos. Sci. 70, 2875–2893. doi:10.1175/JAS-D-12-0326.1
Chen, L., Li, G., Lu, B., Li, Y., Gao, C., Long, S. M., et al. (2022). Two approaches of the spring North Atlantic sea surface temperature affecting the following july precipitation over Central China: the tropical and extratropical pathways. J. Clim. 35, 2969–2986. doi:10.1175/JCLI-D-21-1012.1
Chen, S., Wu, R., and Chen, W. (2020). Strengthened connection between springtime north atlantic oscillation and north atlantic tripole SST pattern since the late 1980s. J. Clim. 33, 2007–2022. doi:10.1175/JCLI-D-19-0628.1
Chiang, J. C. H., Kong, W., Wu, C. H., and Battisti, D. S. (2020). Origins of east asian summer monsoon seasonality. J. Clim. 33, 7945–7965. doi:10.1175/JCLI-D-19-0888.1
Chiang, J. C. H., Swenson, L. M., and Kong, W. (2017). Role of seasonal transitions and the westerlies in the interannual variability of the East Asian summer monsoon precipitation. Geophys Res. Lett. 44, 3788–3795. doi:10.1002/2017GL072739
Ding, Y., Sun, Y., Wang, Z., Zhu, Y., and Song, Y. (2009). Inter-decadal variation of the summer precipitation in China and its association with decreasing Asian summer monsoon Part II: possible causes. Int. J. Climatol. 29, 1926–1944. doi:10.1002/joc.1759
Duan, A., Hu, D., Hu, W., and Zhang, P. (2020). Precursor effect of the Tibetan plateau heating anomaly on the seasonal March of the East Asian summer monsoon precipitation. J. Geophys. Res. Atmos. 125. doi:10.1029/2020JD032948
Dyhrenfurth, G. O. (1955). The third Pole – the history of the High Himalaya, 1st UK. London: Ex Libris, Werner Laurie.
Enomoto, T., Hoskins, B. J., and Matsuda, Y. (2003). The formation mechanism of the Bonin high in August. Q. J. R. Meteorological Soc. 129, 157–178. doi:10.1256/qj.01.211
Filippi, L., Palazzi, E., Von Hardenberg, J., and Provenzale, A. (2014). Multidecadal variations in the relationship between the NAO and winter precipitation in the Hindu Kush-Karakoram. J. Clim. 27, 7890–7902. doi:10.1175/JCLI-D-14-00286.1
Gao, C., and Li, G. (2023). Enhanced seasonal predictability of spring soil moisture over the indo-China peninsula for eastern China summer precipitation under non-ENSO conditions. Adv. Atmos. Sci. 40, 1632–1648. doi:10.1007/s00376-023-2361-x
Gao, C., Li, G., and Xu, B. (2020). Weakening influence of spring soil moisture over the indo-China peninsula on the following summer mei-yu front and precipitation extremes over the yangtze river basin. J. Clim. 33, 10055–10072. doi:10.1175/JCLI-D-20-0117.1
Hahn, D. G., and Shukla, J. (1976). An apparent relationship between eurasian snow cover and Indian monsoon rainfall. J. Atmos. Sci. 33, 2461–2462. doi:10.1175/1520-0469(1976)033<2461:aarbes>2.0.co;2
Harris, I., Osborn, T. J., Jones, P., and Lister, D. (2020). Version 4 of the CRU TS monthly high-resolution gridded multivariate climate dataset. Sci. Data 7, 109. doi:10.1038/s41597-020-0453-3
He, C., and Zhou, W. (2020). Different enhancement of the east Asian summer monsoon under global warming and interglacial epochs simulated by CMIP6 models: role of the subtropical high. J. Clim. 33, 9721–9733. doi:10.1175/JCLI-D-20-0304.1
He, S., Gao, Y., Furevik, T., Wang, H., and Li, F. (2018). Teleconnection between sea ice in the barents sea in June and the silk road, pacific–Japan and East Asian rainfall patterns in August. Adv. Atmos. Sci. 35, 52–64. doi:10.1007/s00376-017-7029-y
Hersbach, H., Bell, B., Berrisford, P., Hirahara, S., Horányi, A., Muñoz-Sabater, J., et al. (2020). The ERA5 global reanalysis. Q. J. R. Meteorological Soc. 146, 1999–2049. doi:10.1002/qj.3803
Hong, X. W., Xue, S. H., Lu, R. Y., and Liu, Y. Y. (2018). Comparison between the interannual and decadal components of the Silk Road pattern. Atmos. Ocean. Sci. Lett. 11, 270–274. doi:10.1080/16742834.2018.1439661
Horan, M. F., Kucharski, F., Johnson, N., and Ashfaq, M. (2024). Winter precipitation predictability in Central Southwest Asia and its representation in seasonal forecast systems. NPJ Clim. Atmos. Sci. 7, 80. doi:10.1038/s41612-024-00594-5
Hu, S., Zhou, T., and Wu, B. (2022). The physical processes dominating the impact of the summer North Atlantic oscillation on the eastern Tibetan plateau summer rainfall. J. Clim. 35, 7677–7690. doi:10.1175/JCLI-D-21-0661.1
Huang, B., Thorne, P. W., Banzon, V. F., Boyer, T., Chepurin, G., Lawrimore, J. H., et al. (2017a). Extended reconstructed Sea surface temperature, Version 5 (ERSSTv5): upgrades, validations, and intercomparisons. J. Clim. 30, 8179–8205. doi:10.1175/JCLI-D-16-0836.1
Huang, B., Thorne, P. W., Banzon, V. F., Boyer, T., Chepurin, G., Lawrimore, J. H., et al. (2017b). NOAA extended reconstructed sea surface temperature (ERSST). Version 5. NOAA National Centers for Environmental Information. doi:10.7289/V5T72FNM
Immerzeel, W. W., Lutz, A. F., Andrade, M., Bahl, A., Biemans, H., Bolch, T., et al. (2020). Importance and vulnerability of the world’s water towers. Nature 577, 364–369. doi:10.1038/s41586-019-1822-y
Immerzeel, W. W., Wanders, N., Lutz, A. F., Shea, J. M., and Bierkens, M. F. P. (2015). Reconciling high altitude precipitation with glacier mass balances and runoff. Hydrol. Earth Syst. Sci. 12, 4755–4784. doi:10.5194/hessd-12-4755-2015
Jiang, X., Zhang, T., Tam, C. Y., Chen, J., Lau, N. C., Yang, S., et al. (2019). Impacts of ENSO and IOD on snow depth over the Tibetan plateau: roles of convections over the western North Pacific and Indian ocean. J. Geophys. Res. Atmos. 124, 11961–11975. doi:10.1029/2019JD031384
Kang, S., Xu, Y., You, Q., Flügel, W.-A., Pepin, N., and Yao, T. (2010). Review of climate and cryospheric change in the Tibetan Plateau. Environ. Res. Lett. 5, 015101. doi:10.1088/1748-9326/5/1/015101
Kao, P. K., Hong, C. C., Huang, A. Y., and Chang, C. C. (2022). Intensification of interannual cross-Basin SST interaction between the North atlantic tripole and pacific meridional mode since the 1990s. J. Clim. 35, 5967–5979. doi:10.1175/JCLI-D-21-0594.1
Khanal, S., Lutz, A. F., Kraaijenbrink, P. D. A., van den Hurk, B., Yao, T., and Immerzeel, W. W. (2021). Variable 21st century climate change response for rivers in high mountain asia at seasonal to decadal time scales. Water Resour. Res. 57. doi:10.1029/2020WR029266
Kim, I. W., Prabhu, A., Oh, J., and Kripalani, R. H. (2020). Combined impact of Greenland sea ice, Eurasian snow, and El Niño–Southern Oscillation on Indian and Korean summer monsoons. Int. J. Climatol. 40, 1375–1395. doi:10.1002/joc.6275
Kosaka, Y., and Nakamura, H. (2006). Structure and dynamics of the summertime Pacific-Japan teleconnection pattern. Q. J. R. Meteorological Soc. 132, 2009–2030. doi:10.1256/qj.05.204
Kosaka, Y., Nakamura, H., Watanabe, M., and Kimoto, M. (2009). Analysis on the dynamics of a wave-like teleconnection pattern along the summertime Asian jet based on a reanalysis dataset and climate model simulations. J. Meteorological Soc. Jpn. 87, 561–580. doi:10.2151/jmsj.87.561
Kraaijenbrink, P. D. A., Stigter, E. E., Yao, T., and Immerzeel, W. W. (2021). Climate change decisive for Asia’s snow meltwater supply. Nat. Clim. Chang. 11, 591–597. doi:10.1038/s41558-021-01074-x
Kumar, K. K., Rajagopalan, B., and Cane, M. A. (1999). On the weakening relationship between the indian monsoon and ENSO. Science 284, 2156–2159. doi:10.1126/science.284.5423.2156
Kwon, M. H., Jhun, J. G., and Ha, K. J. (2007). Decadal change in east Asian summer monsoon circulation in the mid-1990s. Geophys Res. Lett. 34. doi:10.1029/2007GL031977
Kwon, M. H., Jhun, J. G., Wang, B., An, S. I., and Kug, J. S. (2005). Decadal change in relationship between east Asian and WNP summer monsoons. Geophys Res. Lett. 32. doi:10.1029/2005GL023026
Lee, S. S., Seo, Y. W., Ha, K. J., and Jhun, J. G. (2013). Impact of the western North Pacific subtropical high on the East Asian monsoon precipitation and the Indian Ocean precipitation in the boreal summertime. Asia Pac J. Atmos. Sci. 49, 171–182. doi:10.1007/s13143-013-0018-x
Li, G., Chen, L., and Lu, B. (2023). A physics-based empirical model for the seasonal prediction of the Central China july precipitation. Geophys Res. Lett. 50. doi:10.1029/2022GL101463
Li, J., Wang, B., and Yang, Y. M. (2020). Diagnostic metrics for evaluating model simulations of the east asian monsoon. J. Clim. 33, 1777–1801. doi:10.1175/JCLI-D-18-0808.1
Li, W., Guo, W., Qiu, B., Xue, Y., Hsu, P.-C., and Wei, J. (2018). Influence of Tibetan Plateau snow cover on East Asian atmospheric circulation at medium-range time scales. Nat. Commun. 9, 4243. doi:10.1038/s41467-018-06762-5
Liu, G., Wu, R., Zhang, Y., and Nan, S. (2014). The summer snow cover anomaly over the Tibetan Plateau and its association with simultaneous precipitation over the mei-yu-baiu region. Adv. Atmos. Sci. 31, 755–764. doi:10.1007/s00376-013-3183-z
Lu, R. Y., Oh, J. H., and Kim, B. J. (2002). A teleconnection pattern in upper-level meridional wind over the North African and Eurasian continent in summer. Tellus, Ser. A Dyn. Meteorology Oceanogr. 54, 44–55. doi:10.1034/j.1600-0870.2002.00248.x
Lutz, A. F., ter Maat, H. W., Wijngaard, R. R., Biemans, H., Syed, A., Shrestha, A. B., et al. (2019). South Asian river basins in a 1.5 °C warmer world. Reg. Environ. Change 19, 833–847. doi:10.1007/s10113-018-1433-4
Molnar, P., Boos, W. R., and Battisti, D. S. (2010). Orographic controls on climate and paleoclimate of asia: thermal and mechanical roles for the Tibetan plateau. Annu. Rev. Earth Planet Sci. 38, 77–102. doi:10.1146/annurev-earth-040809-152456
Moon, S., and Ha, K. J. (2019). Early Indian summer monsoon onset driven by low soil moisture in the Iranian desert. Geophys Res. Lett. 46, 10568–10577. doi:10.1029/2019GL084520
Oh, H., and Ha, K. J. (2015). Thermodynamic characteristics and responses to ENSO of dominant intraseasonal modes in the East Asian summer monsoon. Clim. Dyn. 44, 1751–1766. doi:10.1007/s00382-014-2268-4
Orsolini, Y., Wegmann, M., Dutra, E., Liu, B., Balsamo, G., Yang, K., et al. (2019). Evaluation of snow depth and snow cover over the Tibetan Plateau in global reanalyses using in situ and satellite remote sensing observations. Cryosphere 13, 2221–2239. doi:10.5194/tc-13-2221-2019
Pandey, P., Dwivedi, S., and Goswami, B. N. (2022). Trend and variability in the long-term relationship between Eurasian snow cover and Indian summer monsoon rainfall. Int. J. Climatol. 42, 7751–7765. doi:10.1002/joc.7675
Park, D. S. R., Ho, C. H., Kim, J. H., and Kim, H. S. (2011). Strong landfall typhoons in Korea and Japan in a recent decade. J. Geophys. Res. Atmos. 116, D07105. doi:10.1029/2010JD014801
Park, J., Kim, H., Simon Wang, S. Y., Jeong, J. H., Lim, K. S., Laplante, M., et al. (2020). Intensification of the East Asian summer monsoon lifecycle based on observation and CMIP6. Environ. Res. Lett. 15, 0940b9. doi:10.1088/1748-9326/ab9b3f
Rudisill, W., Rhoades, A., Xu, Z., and Feldman, D. R. (2024). Are atmospheric models too cold in the mountains? The state of science and insights from the SAIL field campaign. Bull. Am. Meteorol. Soc. doi:10.1175/bams-d-23-0082.1
Schiemann, R., Lüthi, D., and Schär, C. (2009). Seasonality and interannual variability of the westerly jet in the Tibetan plateau region*. J. Clim. 22, 2940–2957. doi:10.1175/2008JCLI2625.1
Shen, H., Li, F., He, S., Orsolini, Y. J., and Li, J. (2020). Impact of late spring Siberian snow on summer rainfall in South-Central China. Clim. Dyn. 54, 3803–3818. doi:10.1007/s00382-020-05206-5
Stendel, M., Francis, J., White, R., Williams, P. D., and Woollings, T. (2021). The jet stream and climate change. Clim. Change, 327–357. doi:10.1016/b978-0-12-821575-3.00015-3
Takaya, K., and Nakamura, H. (2001). A formulation of a phase-independent wave-activity flux for stationary and migratory quasigeostrophic eddies on a zonally varying basic flow. J. Atmos. Sci. 58, 608–627. doi:10.1175/1520-0469(2001)058<0608:AFOAPI>2.0.CO;2
Wang, L., Xu, P., Chen, W., and Liu, Y. (2017). Interdecadal variations of the silk road pattern. J. Clim. 30, 9915–9932. doi:10.1175/JCLI-D-17-0340.1
Wang, X., Tolksdorf, V., Otto, M., and Scherer, D. (2021a). WRF-based dynamical downscaling of ERA5 reanalysis data for High Mountain Asia: towards a new version of the High Asia Refined analysis. Int. J. Climatol. 41, 743–762. doi:10.1002/joc.6686
Wang, Y., and Xu, X. (2018). Impact of ENSO on the thermal condition over the Tibetan Plateau. J. Meteorological Soc. Jpn. 96, 269–281. doi:10.2151/jmsj.2018-032
Wang, Z., Wu, R., Chen, S., Huang, G., Liu, G., and Zhu, L. (2018). Influence of western Tibetan plateau summer snow cover on East Asian summer rainfall. J. Geophys. Res. Atmos. 123, 2371–2386. doi:10.1002/2017JD028016
Wang, Z., Wu, R., Chen, Z., Zhu, L., Yang, K., Liu, K., et al. (2021b). Decreasing influence of summer snow cover over the western Tibetan plateau on East Asian precipitation under global warming. Front. Earth Sci. (Lausanne) 9. doi:10.3389/feart.2021.787971
Watanabe, M., and Kimoto, M. (2000). Atmosphere-ocean thermal coupling in the North Atlantic: a positive feedback. Q. J. R. Meteorological Soc. 126, 3343–3369. doi:10.1256/smsqj.57016
Wei, W., Zhang, R., Wen, M., Yang, S., and Li, W. (2019). Dynamic effect of the South Asian high on the interannual zonal extension of the western North Pacific subtropical high. Int. J. Climatol. 39, 5367–5379. doi:10.1002/joc.6160
Wei, Y., and Yu, H. (2024). The interdecadal weakening of the relationship between Indian ocean sea surface temperature and summer precipitation in central asia. Geophys Res. Lett. 51. doi:10.1029/2023GL107371
Wu, G., Liu, Y., He, B., Bao, Q., Duan, A., and Jin, F. F. (2012a). Thermal controls on the asian summer monsoon. Sci. Rep. 2, 404. doi:10.1038/srep00404
Wu, Z., Li, J., Jiang, Z., and Ma, T. (2012b). Modulation of the Tibetan Plateau snow cover on the ENSO teleconnections: from the East Asian summer monsoon perspective. J. Clim. 25, 2481–2489. doi:10.1175/JCLI-D-11-00135.1
Wu, Z., Zhang, P., Chen, H., and Li, Y. (2016). Can the Tibetan Plateau snow cover influence the interannual variations of Eurasian heat wave frequency? Clim. Dyn. 46, 3405–3417. doi:10.1007/s00382-015-2775-y
Xiao, Z., and Duan, A. (2016). Impacts of Tibetan Plateau snow cover on the interannual variability of the East Asian summer monsoon. J. Clim. 29, 8495–8514. doi:10.1175/JCLI-D-16-0029.1
Xie, S. P., Hu, K., Hafner, J., Tokinaga, H., Du, Y., Huang, G., et al. (2009). Indian Ocean capacitor effect on Indo-Western pacific climate during the summer following El Niño. J. Clim. 22, 730–747. doi:10.1175/2008JCLI2544.1
Xu, B., Chen, H., Gao, C., Zeng, G., Huang, Q., Chen, W., et al. (2021). Abnormal change in spring snowmelt over eurasia and its linkage to the East Asian summer monsoon: the hydrological effect of snow cover. Front. Earth Sci. (Lausanne) 8. doi:10.3389/feart.2020.594656
Xu, L., and Dirmeyer, P. (2011). Snow-atmosphere coupling strength in a global atmospheric model. Geophys Res. Lett. 38. doi:10.1029/2011GL048049
Yang, J., Liu, Q., and Liu, Z. (2010). Linking observations of the Asian monsoon to the Indian Ocean SST: possible roles of Indian Ocean Basin mode and dipole mode. J. Clim. 23, 5889–5902. doi:10.1175/2010JCLI2962.1
Yao, T., Thompson, L., Yang, W., Yu, W., Gao, Y., Guo, X., et al. (2012). Different glacier status with atmospheric circulations in Tibetan Plateau and surroundings. Nat. Clim. Chang. 2, 663–667. doi:10.1038/nclimate1580
Yihui, D., and Chan, J. C. L. (2005). The East Asian summer monsoon: an overview. Meteorology Atmos. Phys. 89, 117–142. doi:10.1007/s00703-005-0125-z
Yim, S. Y., Jhun, J. G., Lu, R., and Wang, B. (2010). Two distinct patterns of spring Eurasian snow cover anomaly and their impacts on the East Asian summer monsoon. J. Geophys. Res. Atmos. 115. doi:10.1029/2010JD013996
You, Q., Wu, T., Shen, L., Pepin, N., Zhang, L., Jiang, Z., et al. (2020). Review of snow cover variation over the Tibetan Plateau and its influence on the broad climate system. Earth Sci. Rev. 201, 103043. doi:10.1016/j.earscirev.2019.103043
Yuan, C., Tozuka, T., Miyasaka, T., and Yamagata, T. (2009). Respective influences of IOD and ENSO on the Tibetan snow cover in early winter. Clim. Dyn. 33, 509–520. doi:10.1007/s00382-008-0495-2
Zha, P., and Wu, Z. (2023). Contribution of the Tibetan plateau winter snow cover to seasonal prediction of the East Asian summer monsoon. Atmosphere-Ocean 61, 25–39. doi:10.1080/07055900.2022.2077171
Zhang, C., Guo, Y., and Wen, Z. (2022). Interdecadal change in the effect of Tibetan Plateau snow cover on spring precipitation over Eastern China around the early 1990s. Clim. Dyn. 58, 2807–2824. doi:10.1007/s00382-021-06035-w
Zhang, C., Jia, X., Duan, A., and Hu, D. (2023). Interdecadal changes in the dominant modes of spring snow cover over the Tibetan plateau around the early 1990s. J. Clim. 36, 3765–3780. doi:10.1175/JCLI-D-22-0487.1
Zhang, C., Jia, X., and Wen, Z. (2021a). Increased impact of the Tibetan plateau spring snow cover to the Meiyu rainfall over the yangtze river valley after 1990s. J. Clim. 34, 1–42. doi:10.1175/JCLI-D-21-0009.1
Zhang, J., Ma, Q., Chen, H., Zhao, S., and Chen, Z. (2021b). Increasing warm-season precipitation in Asian drylands and response to reducing spring snow cover over the Tibetan Plateau. J. Clim., 1–69. doi:10.1175/jcli-d-20-0479.1
Zhang, R., and Zuo, Z. (2011). Impact of spring soil moisture on surface energy balance and summer monsoon circulation over East Asia and precipitation in East China. J. Clim. 24, 3309–3322. doi:10.1175/2011JCLI4084.1
Zhang, T., Wang, T., Krinner, G., Wang, X., Gasser, T., Peng, S., et al. (2019a). The weakening relationship between Eurasian spring snow cover and Indian summer monsoon rainfall. Sci. Adv. 5, eaau8932. doi:10.1126/sciadv.aau8932
Zhang, Y., Zhou, W., Chow, E. C. H., and Leung, M. Y. T. (2019b). Delayed impacts of the IOD: cross-seasonal relationships between the IOD, Tibetan Plateau snow, and summer precipitation over the Yangtze–Huaihe River region. Clim. Dyn. 53, 4077–4093. doi:10.1007/s00382-019-04774-5
Zhao, P., Zhou, Z., and Liu, J. (2007). Variability of Tibetan spring snow and its associations with the hemispheric extratropical circulation and East Asian summer monsoon rainfall: an observational investigation. J. Clim. 20, 3942–3955. doi:10.1175/JCLI4205.1
Keywords: East Asian summer monsoon rainfall, spring snow cover, Tibetan Plateau, snow-monsoon relationship, interdecadal change
Citation: Wijngaard RR, Oh H, Khanal S, Yoon A, van de Berg WJ and An S-I (2024) The associations of Tibetan Plateau spring snow cover with East Asian summer monsoon rainfall before and after 1990. Front. Earth Sci. 12:1385657. doi: 10.3389/feart.2024.1385657
Received: 13 February 2024; Accepted: 26 June 2024;
Published: 17 July 2024.
Edited by:
Tomas Halenka, Charles University, CzechiaCopyright © 2024 Wijngaard, Oh, Khanal, Yoon, van de Berg and An. This is an open-access article distributed under the terms of the Creative Commons Attribution License (CC BY). The use, distribution or reproduction in other forums is permitted, provided the original author(s) and the copyright owner(s) are credited and that the original publication in this journal is cited, in accordance with accepted academic practice. No use, distribution or reproduction is permitted which does not comply with these terms.
*Correspondence: René Reijer Wijngaard, ci5yLndpam5nYWFyZEB1dS5ubA==; Soon-Il An, c2lhbkB5b25zZWkuYWMua3I=