 Lewis P. Bailey1,2*
 Robert M. Dorrell1
 Ina Kostakis3
 David McKee3,4
 Dan Parsons1,5
 Jon Rees6James Strong7,8
 Stephen Simmons1
 Rodney Forster7
- 1Energy and Environment Institute, University of Hull, Hull, United Kingdom
- 2Department of Earth, Energy and Environment, University of Calgary, Calgary, AB, Canada
- 3Physics Department, University of Strathclyde, Glasgow, United Kingdom
- 4Department of Arctic and Marine Biology, University of the Arctic in Tromsø, Tromsø, Norway
- 5The Loughborough Centre for Sustainable Transitions: Energy, Environment and Resilience, Loughborough University, Loughborough, United Kingdom
- 6Centre for Environment, Fisheries and Aquaculture Research (Cefas), Lowestoft, United Kingdom
- 7Hull Marine Laboratory, University of Hull, Hull, United Kingdom
- 8Ocean BioGeosciences, National Oceanography Centre, Southampton, United Kingdom
Offshore wind farms are becoming an increasingly common feature in the marine environment as a renewable energy source. There is a growing body of evidence on the effects of wind farms on the seabed and its organisms. However, an important and understudied aspect of site development is the interaction of turbine foundations on the surrounding marine environment. Structures exert significant disturbance on tides, waves and currents; these are visible as optically-distinct, elongate wakes at the sea surface with elevated suspended particulate matter. Despite this, there is uncertainty on the mechanisms that lead to the visible manifestation of wakes at turbine foundations, primarily due to a lack of direct measurements. Here, in situ measurements along with a 15-year time series of satellite images of the Thanet offshore wind farm, located within the Thames Estuary, were used to investigate the formation of visible monopile wakes, and the effects these have on the surrounding water column. We show the optically distinct wakes are near-constant at Thanet; visible in >90% of all satellite images, yet no regional change in sea surface turbidity could be attributed to wind farm construction or operation. Monopile wake in situ water samples and acoustic Doppler current profiler (ADCP) backscatter measurements demonstrated colour change related to elevated sea surface sediment concentration. However, averaged water column measurements of suspended sediment within wakes, and upstream of monopiles, remained consistent. These measurements demonstrate that sediment was redistributed towards surface waters, rather than additional sediment becoming suspended in the wake. ADCP velocity measurements supported a mechanism of sediment lofting towards the surface, with enhanced vertically upwards flow recorded in wakes.
1 Introduction
Offshore wind farms are becoming an increasingly common feature in the marine environment as a renewable energy solution to mitigate climate change. The global offshore wind power capacity was 57 GW by the end of 2021, a 60% increase on the previous year, with China alone contributing to 80% of this growth (Global Wind Energy Council, 2022). Wind power capacity will continue to increase, with 300 GW required in Europe to meet renewable energy generation targets by 2050. The United Kingdom has one of the most developed offshore wind infrastructure, with over 3,000 wind turbines installed or under construction across 50 offshore wind farms, with a capacity of 20.4 GW (The Crown Estate, 2022). Unprecedented expansion of the offshore wind sector is expected over the coming decades as the transition towards renewable energy continues, leading to construction in deeper, stratified waters (e.g., Dorrell et al., 2022). Such growth in coastal regions, especially in some developing countries and ecologically vulnerable regions necessitates a comprehensive understanding of wind farm-induced environmental impacts (Dai et al., 2015).
While ecological impacts within offshore wind farms and surrounding local waters are varied, and can differ significantly between even neighboring sites (Vandendriessche et al., 2015), there is an increasing body of evidence on the effects of wind farms on the seabed and its organisms (e.g., Andersson and Öhman, 2010; Lindeboom et al., 2011; Reubens et al., 2011; Franco et al., 2015; Raoux et al., 2017; Kirchgeorg et al., 2018; Wang et al., 2018; Causon et al., 2022; Galparsoro et al., 2022; Heinatz and Scheffold, 2023). However, another important aspect of offshore wind farm development is the interaction of sites with the surrounding air and water flow (i.e., hydrodynamics). Offshore wind farm turbines and monopile bases (which account for 81% of turbine bases in European waters; Global Wind Farm Council, 2022) exert significant disturbance on wave height, wind, current speed and water stratification (Christiansen and Hasager, 2005; Broström, 2008; Grashorn and Stanev, 2016; Rivier et al., 2016; Rogan et al., 2016; Miles et al., 2017; Nagel et al., 2018; Schultze et al., 2020; Christiansen et al., 2023), with the scale of hydrodynamic alteration relative to the size of wind farm sites and number of structures (van der Molen et al., 2014). A consequence of these effects is the near-constant formation of optically-distinct, elongated wakes at the sea surface trailing monopiles down-current for several kilometers (Li et al., 2014; Vanhellemont and Ruddick, 2014; Figures 1, 2B) with increased (up to fivefold) suspended particulate matter (Baeye and Fettweis, 2015).
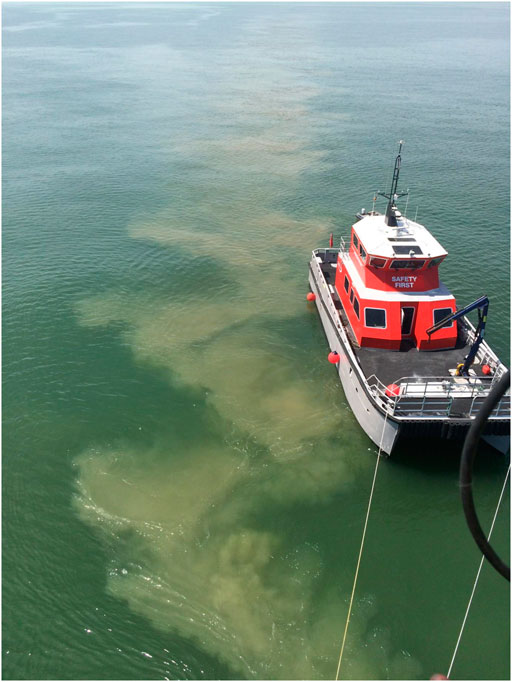
Figure 1. Surface water colour change in a monopile wake producing a pattern consistent with a Kármán vortex street (source: D. van der Zande, Royal Belgian Institute of Natural Sciences).
While optically-distinct monopile wakes have previously been documented, there is uncertainty on the mechanisms that lead to the visible manifestation. Such uncertainty is primarily due to a lack of direct measurements, particularly of current velocity and suspended sediment, in the water column surrounding monopiles. One hypothesis is that the colour change relates to increased suspended particulate matter concentration in surface seawater, though its source remains unclear. The observations of scour at the base of monopiles (e.g., Whitehouse et al., 2011; Yamini et al., 2018) from the generation of horseshoe vortices as water passes the monopile (Sørensen and Ibsen, 2013; Qi and Gao, 2014; Miles et al., 2017) has led to the suggestion that eroded sediment from turbine bases could lead to the generation of surface plumes (e.g., Vanhellemont and Ruddick, 2014). If so, this would have significant economic impacts for the development of offshore wind farms, with increased scour protection required to prevent erosion. Another mechanism increasing surface sediment concentration is enhanced turbulence leading to redistribution of sediment in the monopile wake. For example, the formation of counter-rotating vortices (in the vertical plane) gives a net-upward directed flow in the in a line downstream of the monopile (Petersen et al., 2015) thereby increasing surface sediment concentration. An alternative hypothesis for the generation of colour changes downstream of monopiles is the release of organic material from epifauna colonising the monopile (Baeye and Fettweis, 2015). Understanding the formation of plumes in monopile wakes is critical to validating models of plume dynamics from numerical simulations or scaled-down laboratory experiments.
Here, we aim to better understand the formation and sedimentological implications of optically-distinct wakes at the Thanet offshore wind farm, located in the Thames Estuary (Figure 2). We first analyse a 15-year time series of satellite images from 1997 to 2022 (extending the pre-construction through to operational phases of Thanet) to: 1) Demonstrate the near-constant presence of optically-distinct monopile wakes, and; 2) quantify (anthropogenic) changes, if any, in sea surface suspended particulate matter in monopile wakes and the waters within the wind farm site. Then, using in situ measurements within monopile wakes and adjacent waters we investigate: 3) The cause of colour contrasts; and 4) test mechanisms of optically-distinct wake generation. For example, do colour contrasts occur due to differences in suspended sediment concentration or grain size from localised scouring of the seabed at the base of the monopile, or redistribution of sediment in the water column. Or are other factors such as the bubble formation, resuspended plankton, or the release of organic material from epifauna the cause of the visual manifestation of plumes? Finally, we discuss the sedimentological implications of our observations and provide recommendations for future monitoring at offshore wind farms.
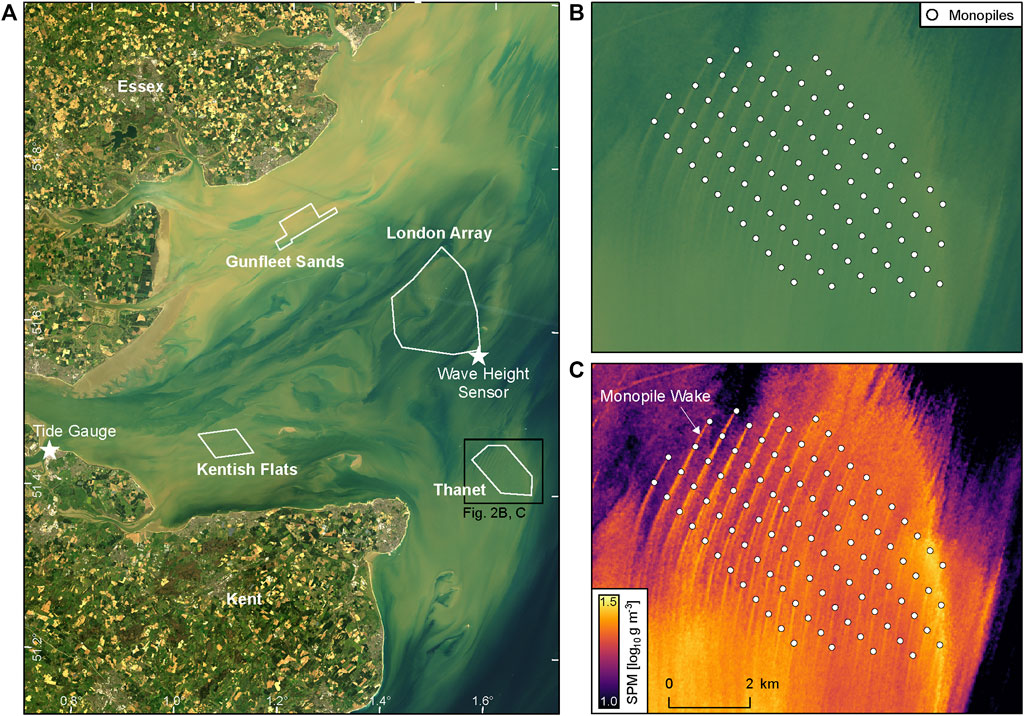
Figure 2. Thanet offshore wind farm and the surrounding area of the Thames Estuary using Landsat 8 OLI imagery from 2018-04-19. (A) RGB composite image corrected for atmospheric effects using the Acolite code showing the location of Thanet, London Array, Gunfleet Sands and Kentish Flat wind farms. The sites of the Sheerness tidal gauge and Cefas wave buoy located at South Knock used in this study are also shown. (B) The Thanet offshore wind farm [as outlined in panel (A)] to show the location of turbine monopiles and (C) shows elevated suspended particulate matter in the wakes of monopiles for the same area, based on estimates using the algorithm of Nechad et al. (2010) for the same area.
2 Materials and methods
2.1 Study site: Thanet offshore wind farm
Thanet offshore wind farm is a fully-operational Round 2 offshore wind farm site operated by Vatenfall Vindkraft AB. The wind farm covers an area of 35 km2 and is located 11 km from the nearest point of the Kent coast and at the margin of the high turbidity zone associated with the outer Thames region (Figure 2A). Construction of Thanet started in January 2008 with a cost of £900 million, and the farm has been operational since September 2010 consisting of 100 Vesta V90 wind turbines with a total capacity of 300 MW. Each of the turbines is supported by a 4.1–4.9 m diameter monopile driven into the seabed between water depths between 14 and 23 m (Figure 3), with no scour protection.
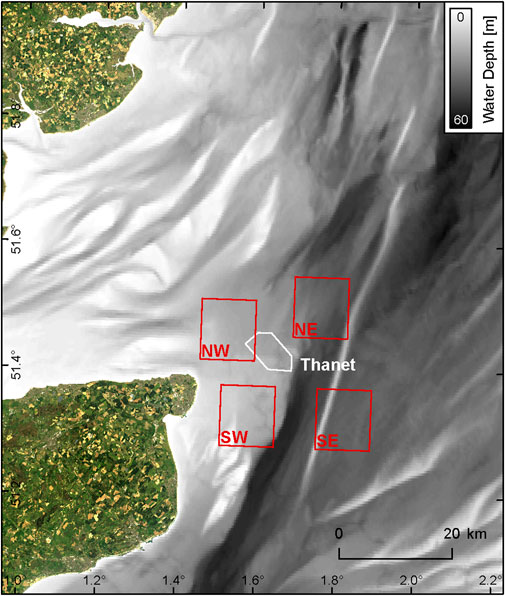
Figure 3. GEBCO seafloor bathymetry (sourced from https://www.gebco.net) of the Thames Estuary and surrounding region. The location of Thanet offshore wind farm (white box) and each of the control zones (red boxes) for surface suspended particulate matter concentration.
2.2 Remote sensing from satellite imagery
Individual monopile wake presence, direction and suspended particulate matter were analysed using a series of high-resolution satellite imagery from initial operation in 2010 through to 2022. This included 55 Landsat 8 (30 m resolution) scenes (2013–2022) and 58 Sentinel-2 (10 m) scenes (2015–2022). A further nine Landsat 5 (60 m) scenes (2010–2011) were included to extend the remotely sensed time series (i.e., pre-Landsat 8 and Sentinal-2 launch) to the start of operation at Thanet. Top of atmosphere Landsat scenes were downloaded from the USGS Earth Explorer (https://earthexplorer.usgs.gov) and Sentinel-2 from the Copernicus Open Access Hub (https://scihub.copernicus.eu/dhus). All images where the Thanet site was not obscured by cloud were included in the analysis.
Atmospheric effects were first corrected using the open access Acolite code (https://odnature. naturalsciences. be/remsem/software-and-data/acolite; Vanhellemont and Ruddick, 2014; Vanhellemont and Ruddick, 2018). This code uses an automated image-based “dark spectrum fitting” approach developed by Vanhellemont and Ruddick (2018) based on the red and near infrared channels to retrieve water-leaving radiance reflectance (ρw) in the red band. Suspended particulate matter estimates for each colour pixel (e.g., Figures 2B, C) were then calculated from ρw using following the algorithm:
where A and C calibration coefficients are based on the wavelength of the red band of each satellite imager, as derived by Nechad et al. (2010). The A and C coefficients have been further calibrated specifically for Landsat 8 and Sentinel-2 in the Acolite code. Here, the Landsat 8 red band values for 654 nm were used: A = 346.32 g m−3 and C = 0.19905; and the Sentinel-2 red band values at 655 nm were used: A = 342.10 g m−3 and C = 0.19563. Estimates for suspended particulate matter in the wake of E01 (Figure 4) were obtained from satellite scenes by creating a perimeter at 1 km distance from the monopile and collecting data where it overlaps the optically distinct wake.
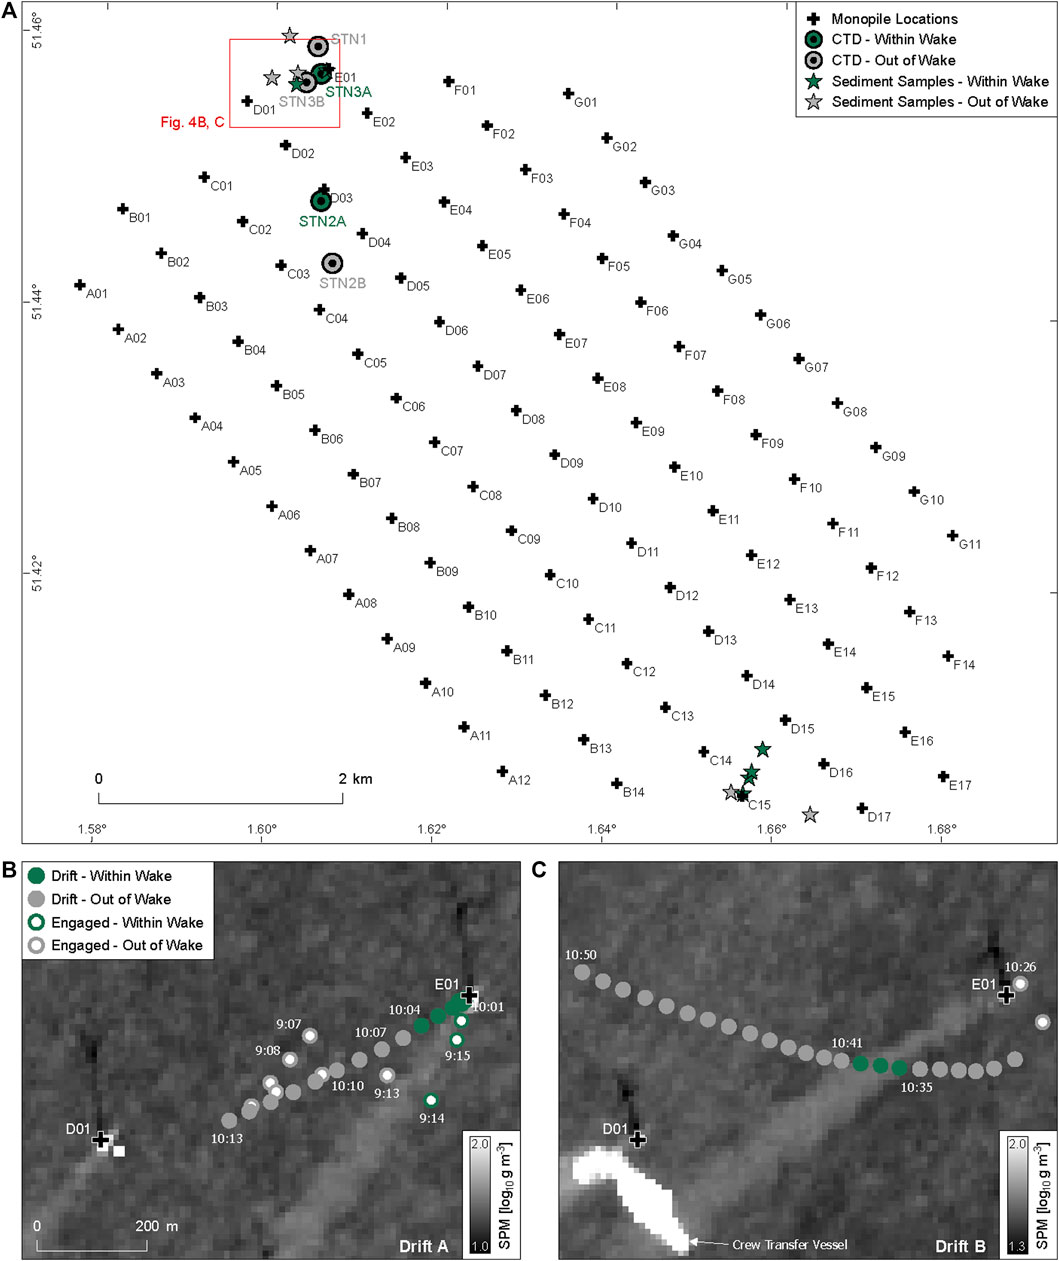
Figure 4. Data collection at Thanet offshore wind farm. (A) Vattenfall numbering system at the Thanet site and location of conductivity, temperature, depth profiles and sediment sampling stations associated with monopiles E01, D03 and C15. Data collected during passive vessel drifting in the wake of monopile E01 on 19th August of 2017 are shown in (B,C). Note that background satellite imagery do not correspond with timing of drift, rather during periods of comparable wake direction. Drift A uses a Sentinel-2 image from 2020-11-04 and Drift B from 2016-03-25.
Temporal (seasonal to annual) variability in suspended sediment concentration within Thanet and the surrounding waters was assessed using coarser resolution (1–4 km pixel size) satellite imagery. Monthly mosaics of MERIS, MODIS/AQUA, VIIRS and SeaWiFS satellite imagery between 1997 and 2014 were acquired from the Copernicus Marine Environmental Monitoring Service (https://marine.copernicus.eu). Suspended particulate matter was then derived from the satellite reflectance using the algorithm of Gohin et al. (2005). To determine the potential impacts of wind farm construction and operation, average monthly suspended particulate matter estimates for the Thanet site prior to construction were compared to measurements post-construction. Four areas, each 10 by 10 km in size, to the northwest, northeast, southwest and southeast (Figure 3) were also analysed as control sites to account for any inter-annual natural variability. These sites were chosen to represent variability in water depth, proximity to sediment sources, and wave and tidal energy.
2.3 Oceanographic datasets
Sea-level data from the nearest tide gauge site at Sheerness (Figure 2A) were downloaded from the British Oceanographic Data Centre (https://www.bodc.ac.uk) and wave measurements from the South Knock (Figure 2A) Cefas WaveNet buoy (https://www.cefas.co.uk/data-and-publications/wavenet).
2.4 In Situ field measurements
In situ measurements within the turbid wakes of monopiles and surrounding waters at the Thanet offshore wind farm were collected in August 2016 on the RV Meriel D. Data were collected over two surveys each consisting of three consecutive days (3rd–5th and 17th–19th August 2016) during spring tides (within a typical spring tidal range for the site) when current velocity would be greatest to ensure the highest chance of measuring within an optically-distinct monopile wake. Measurements were made either through the upper (0–10 m water depth) water column or as continual transects during which the engines of the research vessel were disengaged and allowed to drift in tidal currents. A greatly increased signal-to-noise ratio was obtained when the ship was drifting passively as compared to underway with power, most notably for acoustic Doppler current profiler data (see Section 2.4.3). We describe the results of two periods of passive drifting through the wake of monopile E01 at Thanet on 19th August 2016 (Figure 4). Defining the exact timing of entering and leaving the visible wake was difficult due to sun glint and wave chop meaning the optically-distinct wake was not always observable from the vessel at sea level. Drift A recorded in situ measurements within the wake of E01 for an estimated 34 min while drifting down-current after initially being tethered to the monopile (Figure 4B). Due to a change in wind effects the vessel took a different trajectory to that of the tidal current in Drift B. Here the vessel initially drifted through the water surrounding the wake of E01, before passing through the wake for an estimated 7 min, before leaving again (Figure 4C). Positional data for all other instruments were linked to the primary GPS using time-stamps, with the clocks of all synchronised at the start of surveys. Detailed descriptions of data collection methods are listed below.
2.4.1 Gravimetric analysis of suspended particulate matter
Direct measurements of suspended particulate matter (n = 21) were collected both within and outside the wakes of monopiles E01 and C15 at three depths corresponding to below surface (∼1 m water depth), mid-water (10–13 m) and above seabed (∼20 m) using a 10 L Niskin bottle. Water samples were collected during flood tide at E01, and at high tide (out of wake) and the following ebb tide (in wake and samples at 1 and 13 m water depths) at C15 within the Thanet offshore wind farm (Figure 4A). Water samples from the Niskin bottle were then filtered on dry, pre-weighed glass micro-fibre filters (GFF grade) and stored in dry conditions for laboratory gravimetric analysis where total suspended particulate matter was calculated by weighing dried samples. Oven heating of the filter allowed for removal of organic material, and thus calculation of organic content.
2.4.2 Optical and physiochemical water properties
Optical and physicochemical properties were recorded at the surface and through the water column separately. Surface water measurements of optical backscatter, temperature and salinity were recorded at 1-min intervals using a deck-mounted flow-through system in which the research vessel’s clean seawater supply was routed through a series of de-bubbling tubes, the last of which contained the measuring instruments. Readings were collected automatically by a data logger.
Water column properties were measured using instruments mounted to a steel “rosette” which was lowered to a water depth of 10 m (the maximum operating depth) using the vessel’s Hiab crane. A control profile was measured upstream of the wind farm (STN1) along with paired profiles within, and outside, the turbid wakes of monopiles D03 (5th August 2016; STN2A and B) and E01 (19th August 2017; STN3A and B; Figure 4A). SBE19plus, SBE50 (both SeaBird Electronics), and BBFL2 (WETLabs) sensors were mounted to the “rosette” frame collecting measurements of pressure, temperature, conductivity, chromoporic dissolved organic matter (cDOM), chlorophyll fluorescence and backscattering at 532 nm. Inherent optical properties were collected using a 25 cm pathlength AC9 attenuation and absorption meter alongside a BB9 backscattering meter (both WETLabs). Absorption and attenuation coefficients were determined using nine 10 nm wavebands while backscattering coefficients were calculated based on measurements of the volume scattering function at an effective scattering angle of 117° measured at the same nine wavelengths. Data collected from the AC9 were corrected for the temperature and salinity dependence of pure seawater (Pegau et al., 1997) and for the scattering errors using the Röttgers et al. (2013) semi-empirical correction. BB9 measurements were corrected by converting βp(117°, λ) to particulate backscatter coefficient, bbp(λ) using χ = 0.9 in accordance with Sullivan et al. (2005).
All instruments were timestamped to match the frequency of the AC9 at 1 Hz. All depth data were calibrated against the SBE50 depth sensor using linear regression, with data spikes/artefacts removed and then filtered for noise. Differences in instrument position and logging frequencies produced a ∼20 s time lag from on deck measurements to the moon pool; the time stamps of on deck measurements were therefore corrected for this.
2.4.3 Acoustic Doppler current profiler measurements
Detailed flow velocity fields and estimated suspended sediment concentrations were obtained using an RDI Teledyne 600 kHz acoustic Doppler current profiler (ADCP). The ADCP was deployed on a scaffold pole through the moon-pool of the vessel and coupled with an RTK dGPS to provide both position and velocity of the survey vessel. The instrument has four transducers set at 20° to the vertical, and at 90° to each other to calculate flow velocity at 1 m spaced vertical intervals (bins) by determining the Doppler shift of the received signal along the axis of the four beams. By combining heading and tilt measurement the ADCP resolved a three-dimensional (north, east and vertical) velocity profile through a vertical profile. Due to the low signal-to-noise ratio from measurements taken from a moving vessel time-averaged velocity data were produced by combining ∼40 successive profiles to periods of 1 minute. The ADCP also recorded the intensity of acoustic backscatter at each bin, which is a function of both sediment concentration and grain size of the suspended sediment (Thorne and Hanes, 2002). The acoustic backscatter strength from a particular bin also depends on the amount of acoustic energy that has been lost in the distance between the source and that bin, therefore backscatter measurements have been corrected for spherical spreading and water absorption (Fisher and Simmons, 1977; with temperature = 19.2°C, depth = 0.01°km, salinity = 35 ppt and pH = 8). For each depth profile, the last valid depth bin before the seabed was located manually.
3 Results
3.1 Temporal evolution of regional suspended particulate matter
Regional monthly mosaics of MERIS, MODIS/AQUA, VIIRS and SeaWiFS satellite images between 1997 and 2014 displayed an annual cycle of suspended particulate matter in the Thanet site and surrounding waters (Figure 5A). Similar patterns of variation were observed in significant wave height (Figure 5B). For example, sediment concentrations were highest in January through March when the sea state is roughest with estimates of up to 100 mg L−1 in the outer Thames, with Thanet located on the edge of this high turbidity region. Sediment concentrations and wave height decreased greatly during Spring; by May most of the Thames regions showed values of suspended matter below 20 mg L−1 with the Thanet site indistinguishable from its surrounding waters. Sediment concentrations remained low throughout the summer, until September where zones of higher turbidity were apparent off the Kent and Essex coastlines, with values increasing through the remainder of the year. The annual pattern was observed at Thanet and all the control sites (Figure 3), with higher suspended particulate matter observed in the more proximal southwest and northwest control sites, with a much greater amplitude of suspended matter during the winter than control sites to the northeast and southeast (Figure 5A). The Thanet site does show inter annual variation in suspended particulate matter. Regional satellite images showed annual averaged concentration ranged from 17 (2001) to 42 mg L−1 (2010). This variation though is coupled with the neighboring northwest control zone, which most closely resembled the annual cycle of suspended matter to Thanet (Figure 6).
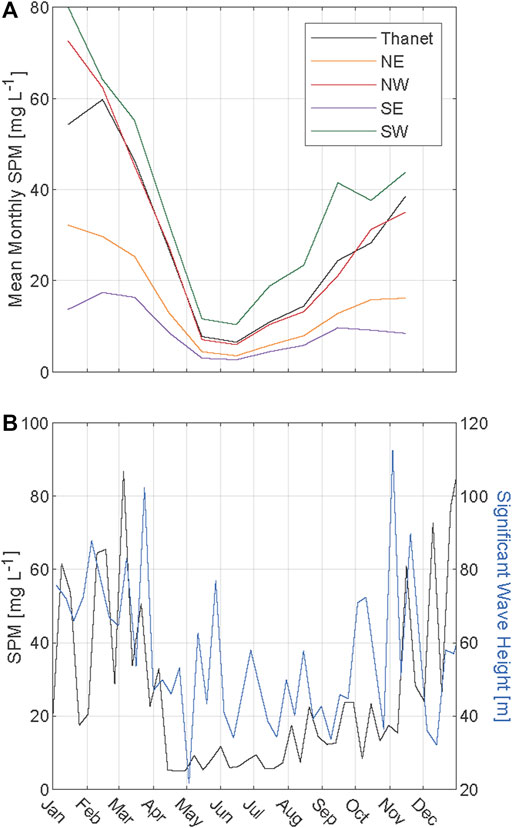
Figure 5. Satellite derived estimates of suspended particulate matter using mosaics of MERIS, MODIS/AQUA, VIIRS and SeaWiFS imagery. (A) Averaged monthly mosaics between 1997 and 2014 of suspended particulate matter estimates for the Thanet offshore wind farm site and the northwest, northeast, southwest and southeast control zones (see Figure 3). Note monthly data from December not included due to insufficient images available. (B) Comparison of 8-day averaged suspended particulate matter estimates with significant wave height recorded at South Knock during 2016.
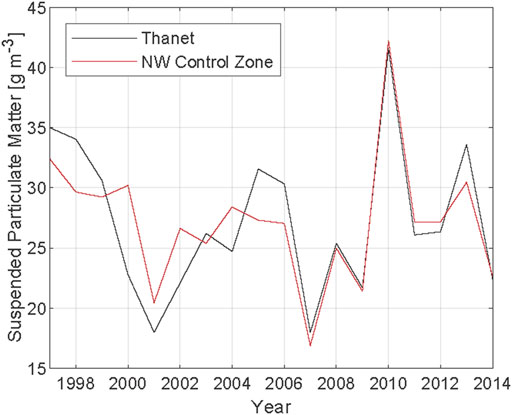
Figure 6. Time series of satellite-derived estimates of sea surface suspended particulate matter in the Thanet region. Low resolution data of Thanet and the northwest control zone from monthly mosaics mosaics of MERIS, MODIS/AQUA, VIIRS and SeaWiFS imagery. High-resolution measurements show to estimates of suspended particulate matter within the wake of monopile E01 (1 km from monopile site) from Landsat 5,8 and Sentinel-2 scenes along with annual averages.
3.2 Monopile wake visibility and direction
Optically distinct monopile wakes were observed in >90% of all satellite images. When wakes were absent, more than half of the images were of poor quality (e.g., partially covered by clouds) or displayed rough sea conditions. The direction of visible monopile wakes was consistent with the tidal ellipse within the Thanet wind farm (Figure 7B). At low water, when tidal flow is aligned from north to south, monopile wakes are also aligned in this direction (Figure 8A). Monopile wake direction rotates clockwise during the rising flood tide, such that the visible wake trends from north-east to south-west by mid-flood (Figure 8B). Clockwise rotation continues with monopile wakes trending south to north at high water (Figure 8C) and then west to east aligning with ebbing currents leaving the Thames Estuary (Figure 8D).
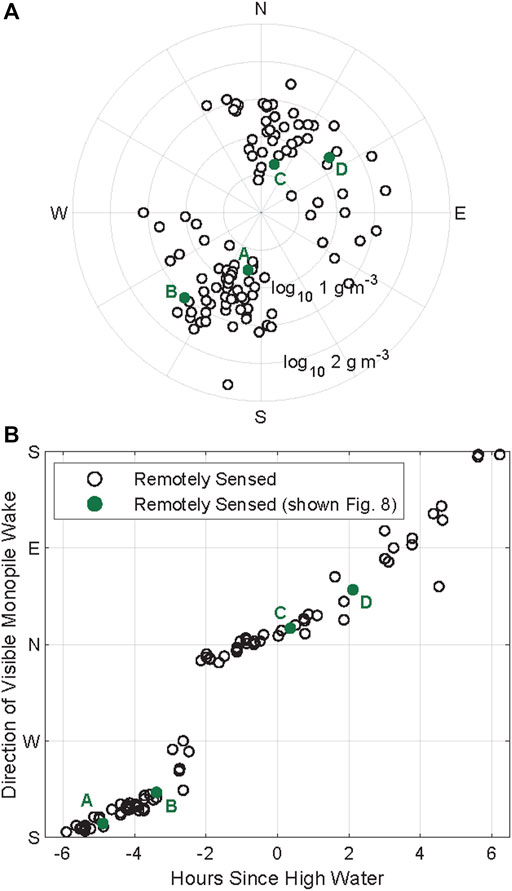
Figure 7. Direction of optically distinct monopile wakes from Landsat 5, 8 and Sentinel-2 imagery acquired between 2010 and 2022. (A) Comparison of wake direction and estimates of suspended particulate matter within the wake of monopile E01 (1 km from monopile site) using the Acolite code and the algorithm of Nechad et al. (2010). (B) Comparison of wake direction and position in the tidal cycle. Direct observations from the field program also included. Green datapoints and letters A-D refer to Sentinel-2 scenes shown in Figure 8.
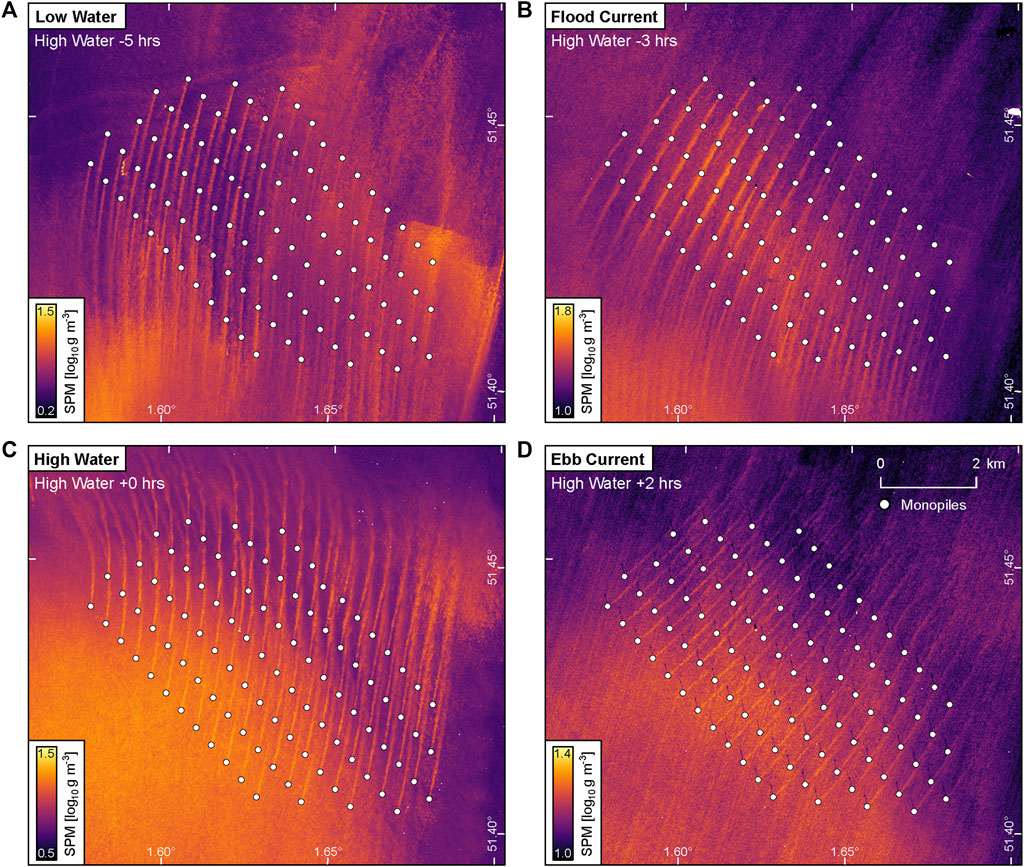
Figure 8. Sentinel-2 imagery to show direction of monopile wakes during different periods of the tidal cycle. (A) Low water on 2019-05-24. (B) During a flood tidal current on 2020-11-04. (C) High water on 2020-09-15. (D) During an ebbing tidal current on 2022-01-13. Estimates of suspended particulate matter using the Acolite code and the algorithm of Nechad et al. (2010).
3.3 Changes to particulate matter within monopile wakes
In situ sampling showed total suspended material in the surface waters (∼1 m water depth) was elevated in the wakes of both monopiles E01 and C15 in comparison to the surrounding water upstream, showing a mean increase of 50% (Figures 9A, C). The wake of C15 was enriched in suspended matter compared to the zone upstream in the mid (10–13 m) and lower (∼20 m) water depths (Figure 9C). However, the corresponding measurements for E01 showed the wake area was depleted in suspended matter in comparison to the surrounding water (measurements outside the wake had 11% higher volume of suspended particulate matter; Figure 9A). Samples recovered at high tide in waters adjacent to the wake of C15 were depleted in suspended particulate matter compared to corresponding samples collected during ebb tide (Figure 9C). The percentage of organic matter in samples showed an overall increase towards the surface (increases of 6% at E01; 4.5% C15); no obvious trend was observed between samples collected within and outside the monopile wakes (Figures 9B, D). Satellite-derived measurements of suspended particular matter (using Eq. 1) showed the direction of the monopile wake (depending on tidal flow) at E01 had no obvious influence on concentration (Figure 7A).
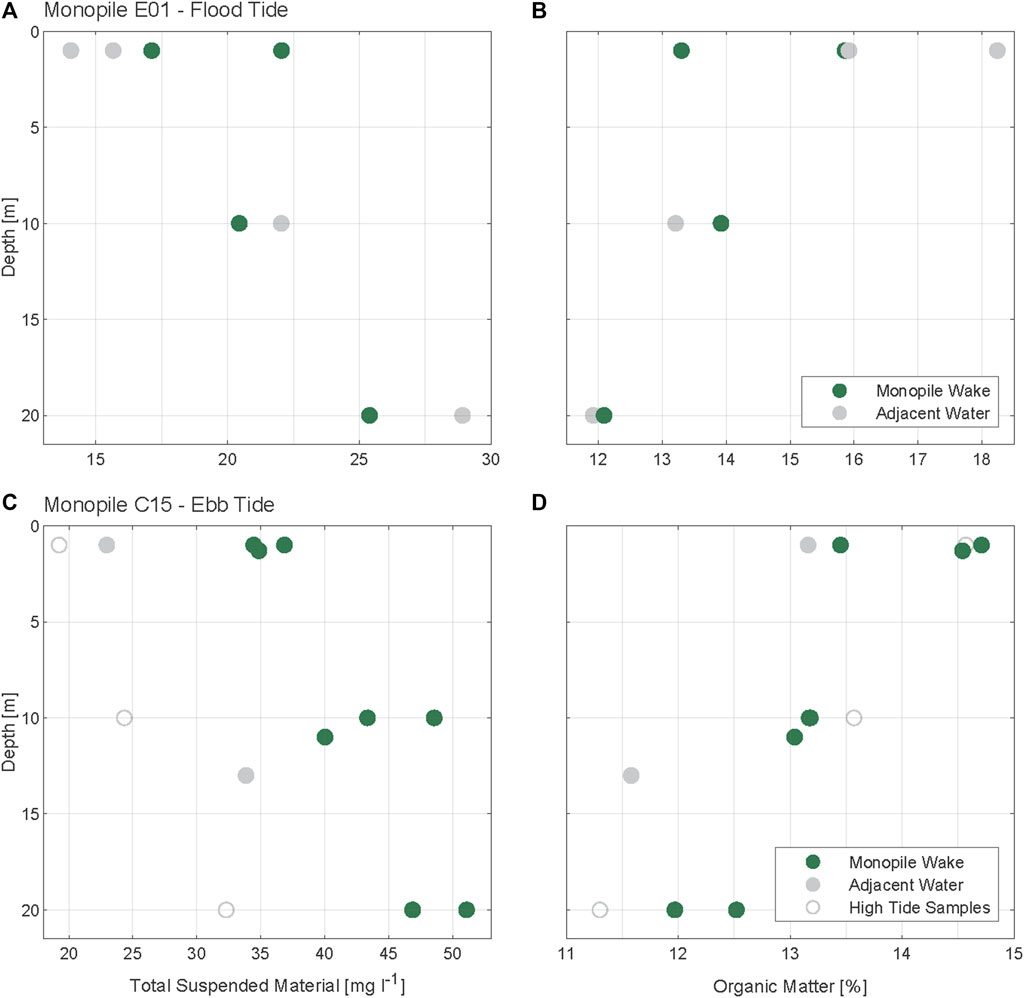
Figure 9. Analysis of sediment samples within and outside monopile wakes through the water column. (A) Total suspended material and (B) organic matter abundance associated with the wake E01 during a flood tide current. (C) Total suspended material and (D) organic matter abundance associated with the wake of C15 during and ebbing tide current.
3.4 Changes to water column properties within monopile wakes
Physical and chemical water properties were broadly consistent between the upper 10 m of the water column in wakes of monopiles D03 (STN2A) and E01 (STN3A) and zones of water immediately adjacent (STN2B and STN3B; Table 1). Temperature and salinity profiles within and outside the monopile wakes were within the range of variability observed at the surface. Of the optically-active water column constituents, chlorophyll and cDOM were higher (depth-averaged increases of 10% and 18%, respectively) within the wake of D03 but almost no change was observed at E01 (Table 1). However, local and horizontal variability in chlorophyll and cDOM can be observed with relatively high depth-averaged measurements of both parameters recorded at STN1 upstream of the wind farm (Table 1). Similarly, depth-averaged backscatter increases in the upper 10 m of the water column at D03 (by 35%) yet remains remarkably consistent at E01 (Table 1).
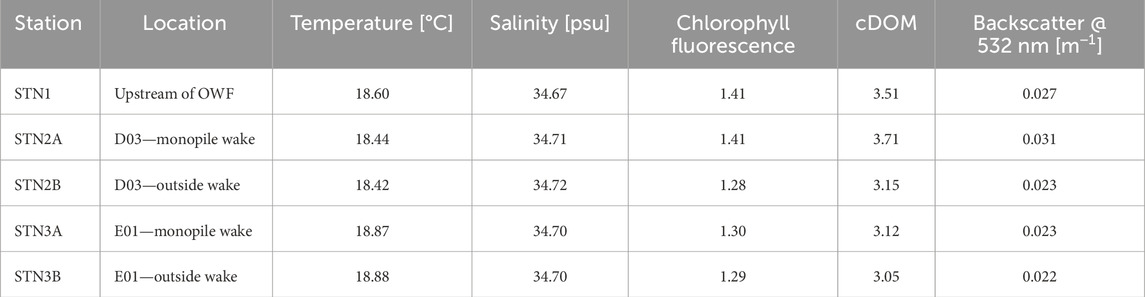
Table 1. Average water column properties to a depth of 10 m. Station locations are shown in Figure 4 and include waters upstream of Thanet offshore wind farm, and within and adjacent to the wakes of monopiles D03 and E01.
3.5 Passive drifts through monopile wakes
Surface turbidity and ADCP measurements were recorded when the vessel was passively drifting through the wake of monopile E01 to greatly increase signal-to-noise (Figure 10). Prior to Drift A (Figure 4B) the vessel approached the plume of turbine E01 from the south-west, entering the plume at 9:08. Turbidity measurements, both from the on-deck system and the instrument frame at 2 m water depth, showed sharp increases between 9:08 and 9:15 before being positioned and tethered ∼30 m down current in the turbulent wake of E01 where the engines were disengaged at 9:27 (Figure 4B, 10C). Continuous measurements of turbidity were then recorded from this point and remained constant when the vessel detached from the turbine at 10:01. A small decrease in turbidity was observed when drifting out of the visible wake at 10:04 (Figure 10C). Surface acoustic backscatter recorded by the ADCP similarly decreased (by ∼2%) at this time (Figures 10D, E). Conversely, near-bed acoustic backscatter readings were lower within the wake and increased (by ∼3%) as the vessel drifted out of the plume (Figures 10D, E). It is important to note however, that a caveat to the use of acoustics is that higher surface sediment load, or surface bubbles, will attenuate backscatter from the underlying water column.
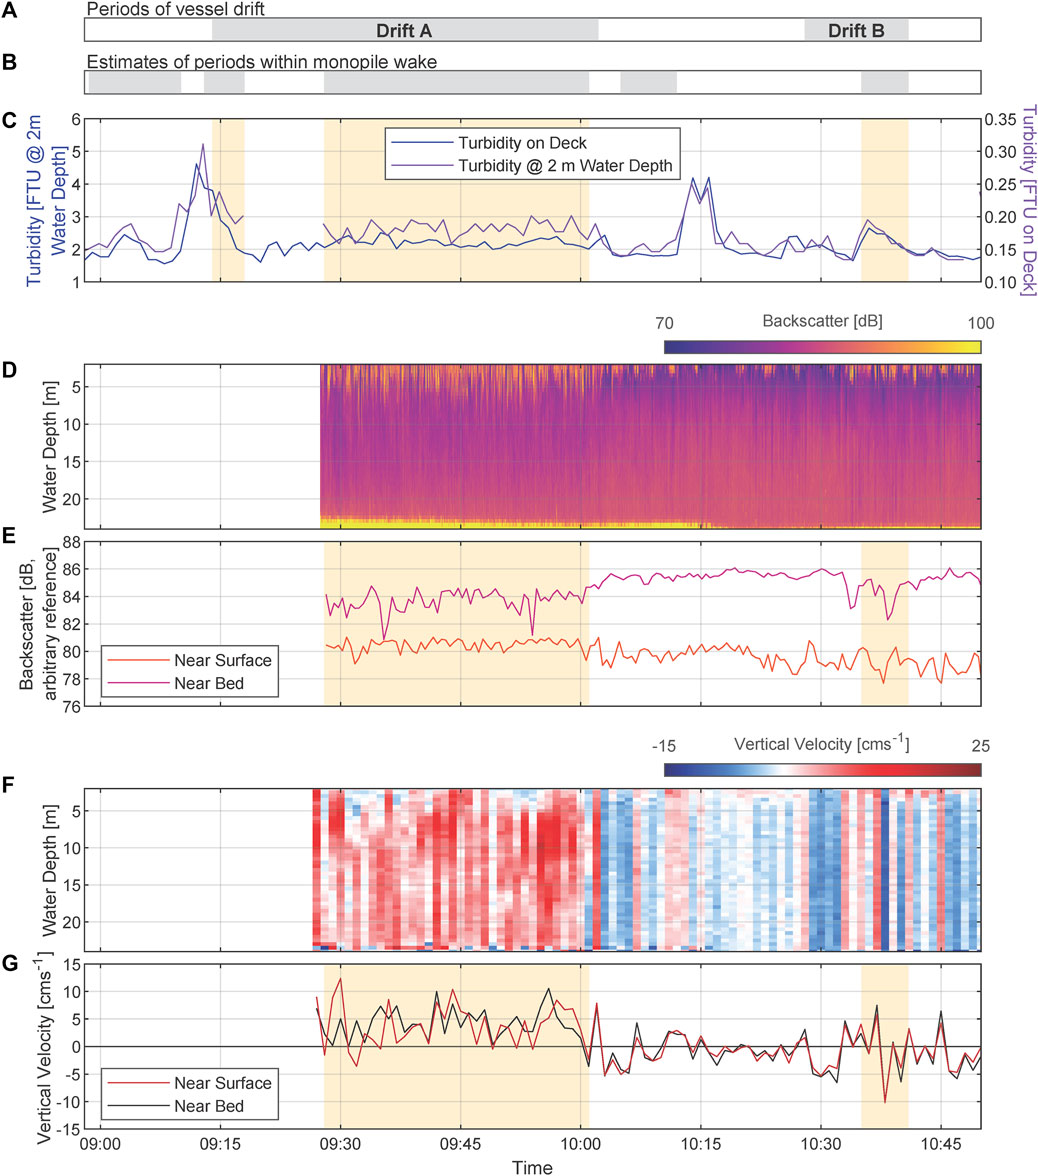
Figure 10. Direct measurements recorded during the period of passive vessel drifting. (A) Shaded areas show the periods of Drifts A and B. (B) Shaded areas show estimates of periods when the vessel was within the wake of monopile E01. (C) Near surface water optical backscatter measurements from the on-deck through system and within the vessel moon-pool. (D) ADCP backscatter (to arbitrary reference) through the water column. (E) Depth-averaged near surface and near bed ADCP backscatter. (F) 1-min time averaged ADCP vertical velocity. (G) 1-min time averaged vertical velocity near surface and near bed. Yellow shaded areas in (C, E, G) denote estimates of periods during which the vessel was within the wake of monopile E01 and the engines were disengaged. Near surface and near bed in (E, G) refer to the averages at 3–5 m below and 17–20 m below the sea surface, respectively.
Turbidity increases were also observed within the wake of E01 during Drift B (Figure 4C); with a sharp increase detected at 10:35 followed by a gradual decrease during transit across the wake from 10:36 to 10:41 (Figure 10C). A higher-resolution record (10 Hz versus 0.016 Hz) of this event was captured from measurements from the instrument frame deployed at 2 m water depths located in the moonpool. Movement of the vessel into the wake similarly resulted in a sharp 40% increase in scattering at 532 nm. Moving away from the center of the monopile wake resulted in a gradual decrease in backscatter (Figure 11). Similar results were also obtained with the multi-waveband optical instruments during this period. Unlike Drift A, entering the plume during Drift B did not show an obvious response in near-surface acoustic backscatter. However, near-bed readings did show a spike in decreased backscatter while within the monopile wake, but this was not observed across the entire drift (Figures 10D, E).
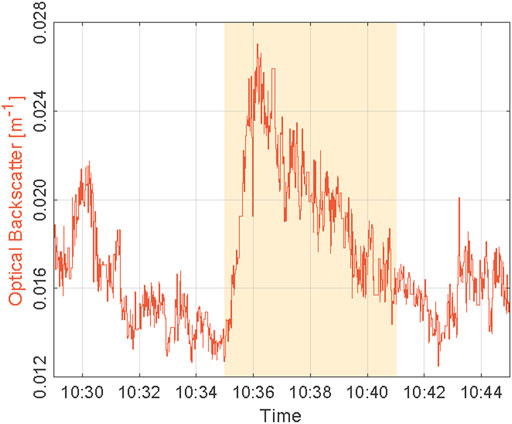
Figure 11. 10 Hz resolution record of backscatter at 532 nm when passing through the wake of monopile E01 with vessel engines disengaged. Yellow shaded region shows estimates of periods within the optically distinct monopile wake.
The velocity structure of the water column is highly variable, even during the period when the vessel was stationary with the engines disengaged while tethered to E01. However, elevated vertical velocity can be observed during both drifts within the wake of E01 in comparison to measurements recorded in the surrounding water column (Figures 10F, G). This is most clearly observed between water depths of 4–12 m in Drift A where vertical upwards velocity increases up to 18 cm s−1, with Drift B much less pronounced (Figure 10F). Additionally, vertical velocity abruptly reversed to a downwards direction on leaving the visible wake during Drift A and prior to entering during Drift B (Figures 10F, G).
4 Discussion
4.1 Has Thanet offshore wind farm altered sea surface turbidity?
Cycles of annual suspended particulate matter variation were observed whereby increases aligned with periods of higher waves heights. Similarly, the abundance of suspended matter varied spatially between the Thanet site and the surrounding waters. For example, a year-round lower concentration of suspended matter was observed in the northeast and southeast control zones due the position of the zones in deeper waters, further from the coast (Figures 3, 5A). While inter-annual variation in suspended particulate matter within Thanet was observed, no obvious trends (increases or decreases) exist during the construction or operational phases of the wind farm. Furthermore, post-construction measurements (aside from 2010) were within the range of pre-construction observations (Figure 6). Additionally, the variation in suspended matter concentration at Thanet showed coupled changes through time with the northwest control site (Figure 5A, 6). Such coupled intra- and inter-annual variability further suggests changes in sea surface turbidity within the Thanet site are likely not an anthropogenic response to the construction and operation of the wind farm, rather natural fluctuations.
4.2 What causes the colour contrast in monopile wakes?
In situ measurements support the hypothesis that colour contrasts in the surface waters of monopile wakes are caused by elevated suspended sediment concentrations in comparison to the surrounding waters. For example, water samples collected from the surface waters in the wakes of monopiles C15 and E01 showed a 50% increase in suspended matter compared to samples obtained upstream (Figures 9A, C). This observed change is less than the 500% increase measured at the Belwind 1 wind farm, located 46 km offshore from Zeebrugge, Belgium, however, much higher quantities of suspended particulate matter were observed in the surface waters of monopile wakes at Thanet (Baeye and Fettweis, 2015). Such disparity between monopile wake suspended sediment likely reflects wind farm site characteristics. For example, greater sediment in the monopile wakes at Thanet could be due to shallower water depth range (14–23 m compared to 15–37 m; Figure 3) or the wind farm site in much more turbid waters than Belwind 1 (14–22 mg L−1 compared to 3 mg L−1; Figure 2A; Baeye and Fettweis, 2015). In either instance, it is therefore likely that changes in suspended sediment in monopile wakes are site specific.
No increase in organic matter abundance was observed in monopile wakes at Thanet (Figures 9B, D), therefore providing evidence against colour contrasts arising from the release of organic material from epifauna-colonizing monopiles (e.g., Baeye and Fettweis, 2015). Similarly, optically significant water constituents such as chlorophyll (plankton) and cDOM show no enrichment within visible monopile wakes that would be outside the range observed in waters surrounding the Thanet site (Table 1). Elevated surface water turbidity and acoustic backscatter recorded by the ADCP in the wake of monopile E01 could provide further evidence to suggest colour changes were related to higher suspended sediment concentration (or an increase in grain size; Figure 10D). A lack of difference between spectral bands (from AC9 and BB9 measurements) indicated that increases in attenuation and scattering was spectrally-neutral, therefore unlikely to be caused by chlorophyll or cDOM. While our results demonstrate the colour contrast in monopile wakes are related to increased sediment concentration it is not possible to rule out bubble formation as a contributing factor to the observed enhanced surface acoustic backscatter (Figure 10D).
4.3 What increases surface sediment concentration in monopile wakes?
Averaged water column measurements (to 10 m water depth) within wakes of monopiles D03 (STN2A and STN2B) and E01 (STN3A and STN3B) showed no significant difference with the adjacent waters or to water column measurements collected to the north of the windfarm (STN1; Table 1). However, bottled water samplings, acoustic backscatter and turbidity measurements provide evidence for elevated suspended sediment concentration near surface (Figure 9, 10C). Additionally, a decrease in acoustic backscatter near-bed suggests that suspended sediment concentration was depleted in the wake at depth, in comparison to the surrounding water column (Figure 10E). This near surface enrichment and near bed depletion is consistent with suspended particulate matter measurements at monopile D03 (Figure 9A). No such depletion was observed at C15; however, three of the five samples taken in the waters adjacent to the monopile wake were collected at high tide (Figure 9C) when tidal velocity and therefore the potential to transport sediment was reduced. Assuming changes in the vertical gradient of sediment concentration in monopile wakes is the norm, the absence of an overall change in suspended particulate matter in the water column (Table 1) indicates elevated wake surface sediment concentration is due to sediment redistribution, rather than additional sediment being sourced.
Increased turbulence in monopile wakes is the driving factor in redistribution of suspended particulate matter from the lower water column to the surface. Although precise ADCP measurements of water column velocity were inconclusive due to variable signals from vessel motion, even when tethered to the monopile, acoustic measurements demonstrated the underwater shape of the wake was complex (Figure 10F). Despite this, time-averaged data indicates a clear shift to upwards motion throughout the water column on entering the wake of E01 during both passive drifts and a change to downwards motion when leaving the visible wake during Drift A and prior to entering during Drift B (Figures 10F, G). These observations are consistent with modeling and laboratory experiments of the hydrodynamics in offshore wind farms (e.g., Petersen et al., 2015; Grashorn and Stanev, 2016; Rivier et al., 2016; Miles et al., 2017; Zhang et al., 2021). For example, previous work has demonstrated that horseshoe-vortices are generated around the monopile base by downward flow upstream (Figure 12); subsequent vortex shredding results a pair of counter-rotating vortices forming an upward flow along the center of the monopile wake (Figure 12). At Thanet this influence of these counter-rotating vortices would equate to a minimum of ∼15 m above bed (i.e., at least three times diameter of monopiles in the wind farm), almost the entire water column at E01. Therefore, we suggest that counter-rotating vortices in monopile wakes drives sediment redistribution towards surface waters (Figure 12). Passive drifting away from the monopile during Drift A shows upwards motion is detectable downstream for a minimum of 100 m (Figures 4B, 10D). Once the surface waters in monopile wakes are enriched in suspended sediment, the development of Kármán vortex street (Figures 1, 12) provide an efficient mechanism to transport these waters downstream for several kilometers, producing the elongate sediment plumes observed.
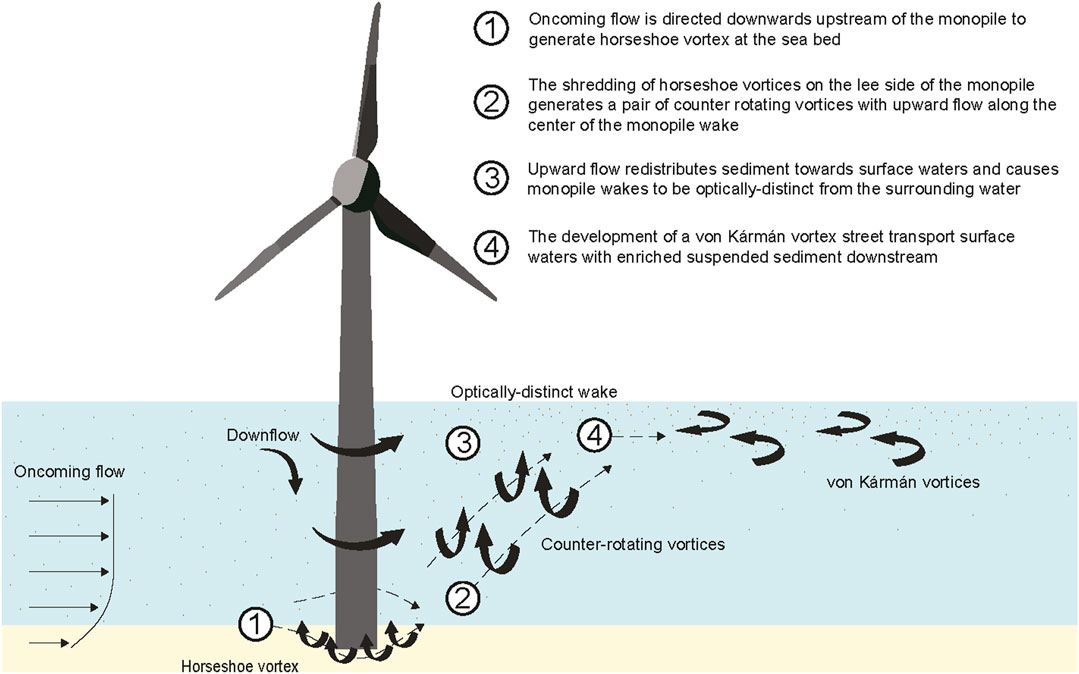
Figure 12. Schematic diagram to show the influence of a bottom-mounted vertical structure on surrounding flow and mechanisms to redistribute suspended sediment to the surface to produce elongate, optically-distinct surface wakes downstream from monopolies at offshore wind farms.
Scouring at the base of monopiles has significant economic impacts, potentially requiring extra scour protection and wind farm maintenance to prevent erosion and extend operational life (e.g., Rezaei et al., 2018). While it is not possible to entirely rule out scour at monopile bases at Thanet (e.g., Vanhellemont and Ruddick, 2014), our results show that averaged sediment concentration in the water column upstream of the monopile is similar to that in the wake (Table 1). The consistent suspended sediment concentration suggests that additional sediment is not sourced from the seafloor, therefore unlikely that erosion around monopile bases is the control on producing optically-distinct sediment plumes in monopile wakes.
4.4 Limitations and future recommendations
4.4.1 Remote sensing
Satellite analysis of turbidity changes within and around the Thanet offshore wind farm used coarse resolution (1–4 km pixel size). At this spatial scale, ∼70% of the wind farm is covered by only two pixels, therefore limiting statistical analysis. Higher resolution satellite images are available though, for example, Landsat 8 and Sentinel-2 have spatial resolutions of 30 and 10 m, respectively. Targeted polygons from these satellites were used to analyse the direction and estimated suspended particulate matter at monopile E01 in this study. It would be advisable that future work to use similar, but larger, targeted polygons extending within the wind farm site and surrounding waters. Such analysis would allow for changes to be quantified statistically, in more detail to our coarser resolution imagery, and over greater timescales.
4.4.2 In Situ measurements
The simplest measurements – collecting water samples in a bottle and filtering the contents – provided the strongest and most equivocal evidence of changes in suspended sediment concentration through the water column within monopile wakes and the surrounding water column. In future work a higher density for gravimetric samples would be recommended though. However, it should be noted that positioning a moving vessel within the rotating plume of a monopile wake was challenging. Furthermore, the plume was not always visible to the observer at sea level due to sun glint and/or wave chop. Perhaps then, the most optimal method of data acquisition would be using remotely operated bottled water samplers, which could be tethered to a mooring and programmed to capture samples at regular intervals.
Similarly, the movement of the vessel complicated interpretation of ADCP observations. While acoustic backscatter provided a useful insight to relative suspended sediment concentration through the water column, it was not possible to account for the surface bubbles (generated by the vessel) which can attenuate the signal below. Additionally, the vessel movement meant we were unable to resolve directional information in monopile wakes from ADCP measurements in detail. Therefore, in future we recommend using a tethered upward-looking ADCP mooring together with high-resolution CTDs and optical sensors at different depths. This configuration would allow data collection through a monopile wake every ∼12 h (i.e., due to tidal currents), and would permit investigation of between-day differences in turbulent intensity.
5 Conclusion
A combination of in situ water column and surface measurements collected at the Thanet offshore wind farm along with a 15-year time series of satellite data were analysed to investigate the impacts of wind farm development. While suspended particulate matter at the Thanet offshore wind farm showed inter-annual and intra-annual variation, changes were consistent with waters located away from the site, therefore variation can be attributed to natural fluctuations rather than anthropogenic change. Colour changes extending in the direction of tidal flow were observed in monopile wakes for >90% of satellite scenes at Thanet. These colour changes formed due to elevated near surface water concentrations in suspended sediment. However, averaged water column showed no additional sediment was sourced in wakes, therefore suggesting the cause of visible plumes is a result of sediment distribution in the water column, instead of sediment erosion from monopile bases. Furthermore, organic matter was consistent between water upstream of monopiles and within the corresponding wake, therefore plume formation was not related to material released by epifauna at Thanet.
Data availability statement
Data from this study will be made available via the offshore wind data repository of The Crown Estate at https://www.marinedataexchange.co.uk/.
Author contributions
LB: Writing–original draft, Formal Analysis, Visualization. RD: Writing–review and editing. IK: Formal Analysis, Writing–review and editing. DM: Investigation, Methodology, Writing–review and editing. DP: Investigation, Methodology, Writing–review and editing. JR: Methodology, Writing–review and editing. JS: Investigation, Methodology, Writing–review and editing. SS: Formal Analysis, Investigation, Methodology, Writing–review and editing. RF: Conceptualization, Formal Analysis, Funding acquisition, Investigation, Methodology, Project administration, Writing–review and editing.
Funding
The authors declare that financial support was received for the research, authorship, and/or publication of this article. This work was funded by a grant from The Crown Estate’s Marine Stewardship Fund to RF. The Marine Stewardship Fund has now been superseded by the Offshore Wind Evidence and Change Programme.
Acknowledgments
The authors would like to thank the management and crew of the RV Meriel D for assistance with the research cruises and the assistance of Vattenfall staff during project planning, and for allowing access to the Thanet site.
Conflict of interest
The authors declare that the research was conducted in the absence of any commercial or financial relationships that could be construed as a potential conflict of interest.
Publisher’s note
All claims expressed in this article are solely those of the authors and do not necessarily represent those of their affiliated organizations, or those of the publisher, the editors and the reviewers. Any product that may be evaluated in this article, or claim that may be made by its manufacturer, is not guaranteed or endorsed by the publisher.
References
Andersson, M. H., and Öhman, M. C. (2010). Fish and sessile assemblages associated with wind-turbine constructions in the Baltic Sea. Mar. Freshw. Res. 61, 642–650. doi:10.1071/MF09117
Baeye, M., and Fettweis, M. (2015). In situ observations of suspended particulate matter plumes at an offshore wind farm, southern North Sea. Geo-Mar Lett. 35, 247–255. doi:10.1007/s00367-015-0404-8
Broström, G. (2008). On the influence of large wind farms on the upper ocean circulation. J. Mar. Syst. 74, 585–591. doi:10.1016/j.jmarsys.2008.05.001
Causon, P. D., Jude, S., Gill, A. B., and Leinster, P. (2022). Critical evaluation of ecosystem changes from an offshore wind farm: producing natural capital asset and risk registers. Environ. Sci. Policy 136, 772–785. doi:10.1016/j.envsci.2022.07.003
Christiansen, M. B., and Hasager, C. B. (2005). Wake effects of large offshore wind farms identified from satellite SAR. Remote Sens. Environ. 98, 251–268. doi:10.1016/j.rse.2005.07.009
Christiansen, N., Carpenter, J. R., Daewel, U., Suzuki, N., and Schrum, C. (2023). The large-scale impact of anthropogenic mixing by offshore wind turbine foundations in the shallow North Sea. Front. Mar. Sci. 10. doi:10.3389/fmars.2023.1178330
Dai, K., Bergot, A., Liang, C., Xiang, W.-N., and Huang, Z. (2015). Environmental issues associated with wind energy – a review. Renew. Energy 75, 911–921. doi:10.1016/j.renene.2014.10.074
Dorrell, R. M., Lloyd, C. J., Lincoln, B. J., Rippeth, T. P., Taylor, J. R., Caulfield, C. P., et al. (2022). Anthropogenic mixing in seasonally stratified shelf seas by offshore wind farm infrastructure. Front. Mar. Sci. 9. doi:10.3389/fmars.2022.830927
Fisher, F. H., and Simmons, V. P. (1977). Sound absorption in sea water. J. Acoust. Soc. Am. 62, 558–564. doi:10.1121/1.381574
Franco, A., Quintino, V., and Elliott, M. (2015). Benthic monitoring and sampling design and effort to detect spatial changes: a case study using data from offshore wind farm sites. Ecol. Indic. 57, 298–304. doi:10.1016/j.ecolind.2015.04.040
Galparsoro, I., Menchaca, I., Garmendia, J. M., Borja, Á., Maldonado, A. D., Iglesias, G., et al. (2022). Reviewing the ecological impacts of offshore wind farms. npj Ocean. Sustain 1, 1–8. doi:10.1038/s44183-022-00003-5
Global Wind Energy Council (2022). Global offshore wind report 2022. Rue Commer. 31, 1000. Available at: https://gwec.net/wp-content/uploads/2022/03/GWEC-GLOBAL-WIND-REPORT-2022.pdf.
Gohin, F., Loyer, S., Lunven, M., Labry, C., Froidefond, J.-M., Delmas, D., et al. (2005). Satellite-derived parameters for biological modelling in coastal waters: illustration over the eastern continental shelf of the Bay of Biscay. Remote Sens. Environ. 95, 29–46. doi:10.1016/j.rse.2004.11.007
Grashorn, S., and Stanev, E. V. (2016). Kármán vortex and turbulent wake generation by wind park piles. Ocean. Dyn. 66, 1543–1557. doi:10.1007/s10236-016-0995-2
Heinatz, K., and Scheffold, M. I. E. (2023). A first estimate of the effect of offshore wind farms on sedimentary organic carbon stocks in the Southern North Sea. Front. Mar. Sci. 9. Available at. doi:10.3389/fmars.2022.1068967
Kirchgeorg, T., Weinberg, I., Hörnig, M., Baier, R., Schmid, M. J., and Brockmeyer, B. (2018). Emissions from corrosion protection systems of offshore wind farms: evaluation of the potential impact on the marine environment. Mar. Pollut. Bull. 136, 257–268. doi:10.1016/j.marpolbul.2018.08.058
Li, X., Chi, L., Chen, X., Ren, Y., and Lehner, S. (2014). SAR observation and numerical modeling of tidal current wakes at the East China Sea offshore wind farm. J. Geophys. Res. Oceans 119, 4958–4971. doi:10.1002/2014JC009822
Lindeboom, H. J., Kouwenhoven, H. J., Bergman, M. J. N., Bouma, S., Brasseur, S., Daan, R., et al. (2011). Short-term ecological effects of an offshore wind farm in the Dutch coastal zone; a compilation. Environ. Res. Lett. 6, 035101. doi:10.1088/1748-9326/6/3/035101
Miles, J., Martin, T., and Goddard, L. (2017). Current and wave effects around windfarm monopile foundations. Coast. Eng. 121, 167–178. doi:10.1016/j.coastaleng.2017.01.003
Nagel, T., Chauchat, J., Wirth, A., and Bonamy, C. (2018). On the multi-scale interactions between an offshore-wind-turbine wake and the ocean-sediment dynamics in an idealized framework – a numerical investigation. Renew. Energy 115, 783–796. doi:10.1016/j.renene.2017.08.078
Nechad, B., Ruddick, K. G., and Park, Y. (2010). Calibration and validation of a generic multisensor algorithm for mapping of total suspended matter in turbid waters. Remote Sens. Environ. 114, 854–866. doi:10.1016/j.rse.2009.11.022
Pegau, W. S., Gray, D., and Zaneveld, J. R. V. (1997). Absorption and attenuation of visible and near-infrared light in water: dependence on temperature and salinity. Appl. Opt. 36, 6035–6046. doi:10.1364/AO.36.006035
Petersen, T. U., Mutlu Sumer, B., Fredsøe, J., Raaijmakers, T. C., and Schouten, J.-J. (2015). Edge scour at scour protections around piles in the marine environment — laboratory and field investigation. Coast. Eng. 106, 42–72. doi:10.1016/j.coastaleng.2015.08.007
Qi, W.-G., and Gao, F.-P. (2014). Physical modeling of local scour development around a large-diameter monopile in combined waves and current. Coast. Eng. 83, 72–81. doi:10.1016/j.coastaleng.2013.10.007
Raoux, A., Tecchio, S., Pezy, J.-P., Lassalle, G., Degraer, S., Wilhelmsson, D., et al. (2017). Benthic and fish aggregation inside an offshore wind farm: which effects on the trophic web functioning? Ecol. Indic. 72, 33–46. doi:10.1016/j.ecolind.2016.07.037
Reubens, J. T., Degraer, S., and Vincx, M. (2011). Aggregation and feeding behaviour of pouting (Trisopterus luscus) at wind turbines in the Belgian part of the North Sea. Fish. Res. 108, 223–227. doi:10.1016/j.fishres.2010.11.025
Rezaei, R., Duffour, P., and Fromme, P. (2018). Scour influence on the fatigue life of operational monopile-supported offshore wind turbines. Wind Energy 21, 683–696. doi:10.1002/we.2187
Rivier, A., Bennis, A.-C., Pinon, G., Magar, V., and Gross, M. (2016). Parameterization of wind turbine impacts on hydrodynamics and sediment transport. Ocean. Dyn. 66, 1285–1299. doi:10.1007/s10236-016-0983-6
Rogan, C., Miles, J., Simmonds, D., and Iglesias, G. (2016). The turbulent wake of a monopile foundation. Renew. Energy 93, 180–187. doi:10.1016/j.renene.2016.02.050
Röttgers, R., McKee, D., and Woźniak, S. B. (2013). Evaluation of scatter corrections for ac-9 absorption measurements in coastal waters. Methods Oceanogr. 7, 21–39. doi:10.1016/j.mio.2013.11.001
Schultze, L. K. P., Merckelbach, L. M., Horstmann, J., Raasch, S., and Carpenter, J. R. (2020). Increased mixing and turbulence in the wake of offshore wind farm foundations. J. Geophys. Res. Oceans 125, e2019JC015858. doi:10.1029/2019JC015858
Sørensen, S., and Ibsen, L. (2013). Assessment of foundation design for offshore monopiles unprotected against scour. Ocean. Eng. 63, 17–25. doi:10.1016/j.oceaneng.2013.01.016
Sullivan, J. M., Twardowski, M. S., Donaghay, P. L., and Freeman, S. A. (2005). Use of optical scattering to discriminate particle types in coastal waters. Appl. Opt. 44, 1667–1680. doi:10.1364/AO.44.001667
The Crown Estate (2022). Offshore wind report - 2021. Available at: https://www.thecrownestate.co.uk/media/4095/2021-offshore-wind-report.pdf.
Thorne, P. D., and Hanes, D. M. (2002). A review of acoustic measurement of small-scale sediment processes. Cont. Shelf Res. 22, 603–632. doi:10.1016/S0278-4343(01)00101-7
Vandendriessche, S., Derweduwen, J., and Hostens, K. (2015). Equivocal effects of offshore wind farms in Belgium on soft substrate epibenthos and fish assemblages. Hydrobiologia 756, 19–35. doi:10.1007/s10750-014-1997-z
van der Molen, J., Smith, H. C. M., Lepper, P., Limpenny, S., and Rees, J. (2014). Predicting the large-scale consequences of offshore wind turbine array development on a North Sea ecosystem. Cont. Shelf Res. 85, 60–72. doi:10.1016/j.csr.2014.05.018
Vanhellemont, Q., and Ruddick, K. (2014). Turbid wakes associated with offshore wind turbines observed with Landsat 8. Remote Sens. Environ. 145, 105–115. doi:10.1016/j.rse.2014.01.009
Vanhellemont, Q., and Ruddick, K. (2018). Atmospheric correction of metre-scale optical satellite data for inland and coastal water applications. Remote Sens. Environ. 216, 586–597. doi:10.1016/j.rse.2018.07.015
Wang, T., Zou, X., Li, B., Yao, Y., Li, J., Hui, H., et al. (2018). Microplastics in a wind farm area: a case study at the rudong offshore wind farm, yellow sea, China. Mar. Pollut. Bull. 128, 466–474. doi:10.1016/j.marpolbul.2018.01.050
Whitehouse, R. J. S., Harris, J. M., Sutherland, J., and Rees, J. (2011). The nature of scour development and scour protection at offshore windfarm foundations. Mar. Pollut. Bull. 62, 73–88. doi:10.1016/j.marpolbul.2010.09.007
Yamini, O. A., Mousavi, S. H., Kavianpour, M. R., and Movahedi, A. (2018). Numerical modeling of sediment scouring phenomenon around the offshore wind turbine pile in marine environment. Environ. Earth Sci. 77, 776. doi:10.1007/s12665-018-7967-4
Keywords: offshore wind farms, hydrodynamics, turbid wakes, suspended particulate matter, in situ measurements
Citation: Bailey LP, Dorrell RM, Kostakis I, McKee D, Parsons D, Rees J, Strong J, Simmons S and Forster R (2024) Monopile-induced turbulence and sediment redistribution form visible wakes in offshore wind farms. Front. Earth Sci. 12:1383726. doi: 10.3389/feart.2024.1383726
Received: 07 February 2024; Accepted: 22 July 2024;
Published: 14 August 2024.
Edited by:
Katrien Van Landeghem, Bangor University, United KingdomReviewed by:
Taavi Liblik, Tallinn University of Technology, EstoniaGerhard Bartzke, University of Bremen, Germany
Chris Unsworth, Bangor University, United Kingdom
Copyright © 2024 Bailey, Dorrell, Kostakis, McKee, Parsons, Rees, Strong, Simmons and Forster. This is an open-access article distributed under the terms of the Creative Commons Attribution License (CC BY). The use, distribution or reproduction in other forums is permitted, provided the original author(s) and the copyright owner(s) are credited and that the original publication in this journal is cited, in accordance with accepted academic practice. No use, distribution or reproduction is permitted which does not comply with these terms.
*Correspondence: Lewis P. Bailey, bGV3aXMuYmFpbGV5QHVjYWxnYXJ5LmNh